www.newtekone.com 0 Newtek Business Services Corp. “Your Business Solutions Company™” NASDAQ: NEWT First Quarter 2016 Financial Results Conference Call May 5, 2016 8:30 am ET Hosted by: Barry Sloane, President & CEO Jennifer Eddelson, EVP & CAO Investor Relations Jayne Cavuoto Director of Investor Relations [email protected] (212) 273-8179

Welcome message from author
This document is posted to help you gain knowledge. Please leave a comment to let me know what you think about it! Share it to your friends and learn new things together.
Transcript

www.newtekone.com 0
Newtek Business Services Corp. “Your Business Solutions Company™”
NASDAQ: NEWT
First Quarter 2016
Financial Results Conference Call
May 5, 2016 8:30 am ET
Hosted by:
Barry Sloane, President & CEO Jennifer Eddelson, EVP & CAO
Investor Relations
Jayne Cavuoto
Director of Investor Relations
(212) 273-8179

www.newtekone.com 1
Note Regarding Forward Looking StatementsThis presentation contains certain forward-looking statements. Words such as “plan,” “believes,” “expects,” “plans,” “anticipates,”
“forecasts” and “future” or similar expressions are intended to identify forward-looking statements. All forward-looking statements
involve a number of risks and uncertainties that could cause actual results to differ materially from the plans, intentions and expectations
reflected in or suggested by the forward-looking statements. Such risks and uncertainties include, among others, intensified competition,
operating problems and their impact on revenues and profit margins, anticipated future business strategies and financial performance,
anticipated future number of customers, business prospects, legislative developments and similar matters. Risk factors, cautionary
statements and other conditions, which could cause Newtek’s actual results to differ from management’s current expectations, are
contained in Newtek’s filings with the Securities and Exchange Commission and available through http://www.sec.gov/.

www.newtekone.com 2
First Quarter 2016 Financial Highlights
� Increased 2016 annual cash dividend forecast to $22.0 million, or $1.521 per share, from the previous
forecast of $21.8 million, or $1.50 per share due to management's business outlook and improving
metrics
� Net asset value (“NAV”) was $203.8 million, or $14.10 per share, at March 31, 2016, compared to NAV
of $203.9 million, or $14.06 per share, at December 31, 2015
� Adjusted net investment income* was $4.9 million, or $0.34 per share, compared to $5.2 million, or
$0.51 per share, for the three months ended March 31, 2015 (see page 3 of presentation)
� Total investment income was $6.8 million; an increase from $4.8 million for the three months ended
March 31, 2015
� Total investment portfolio was $278.0 million at March 31, 2016, compared to $266.9 million at
December 31, 2015
� Debt-to-equity ratio was approximately 66.0% at March 31, 2016
� Repurchased 70,000 shares of Newtek common stock during Q1 2016 at a weighted average price of
$12.37 per share
� Paid the first quarter 2016 dividend of approximately $5.1 million, or $0.351 per share, on March 31,
2016 to shareholders of record as of March 22, 2016
*See slide 37 for definition of Adjusted net investment income.1Amount and timing of dividends, if any, remain subject to the discretion of the Company’s Board of Directors. 2016 dividend forecast
based on shares outstanding at March 31, 2016.

www.newtekone.com 3
Adjusted Net Investment Income Discussion
*See slide 37 for definition of Adjusted net investment income.
**See slide 43 for Q1 2015 Adjusted net investment income pro forma reconciliation calculation.
� 2015 was Newtek’s first full year as a business development company (“BDC”)
� In Q1 2015, we sold loans that we originated in Q4 2014, which resulted in $3.9 million in
realized gains that we recognized in Q1 2015, which in turn increased the Company’s Adjusted
net investment income for Q1 2015
� Without the rollover and the Q1 2015 sale of these loans, which were originated in Q4 2014,
adjusted net investment income in Q1 2015 would have been approximately $0.13** per
share compared to adjusted net investment income of $0.34 per share in Q1 2016

www.newtekone.com 4
SBA Lending Highlights
� Funded $56.1 million of SBA 7(a) loans in the first quarter of 2016; an increase of 13% over the same
period last year
� Funded $80.1 million of SBA 7(a) loans year to date through April 30, 2016; a 49% increase over
$53.7 million in loan fundings for the same period last year
� Reaffirmed loan funding forecast of approximately $320 million in SBA 7(a) and SBA 504 loans (note:
SBA 504 loans are originated by one of Newtek’s controlled portfolio companies), which would
represent an approximate 32% increase over 2015
� For the three months ended March 31, 2016, received an average net premium on the sale of
guaranteed portions of SBA loans of 12.41%
� Newtek Business Credit Solutions is currently below its SBA 504 loan target, but we anticipate
achieving our total loan funding forecast with additional SBA 7(a) loan fundings or catching up with
SBA 504 fundings

www.newtekone.com 5
Bond Offering
� On April 22, 2016, closed a $35 million public offering of 7.00% Notes due 2021
� Interest on the Notes are payable quarterly on March 31, June 30, September 30 and December 31
of each year, beginning June 30, 2016 and are callable on or after April 22, 2017
� Increased the size of the offering from $25.0 million in aggregate principal amount to $35.0 million in
aggregate principal amount (in each case, excluding any overallotment option) to satisfy investor
demand
� The Notes trade on the Nasdaq Global Market under the trading symbol “NEWTL”
� The Notes will mature on March 31, 2021
� Newtek granted the underwriters a 30-day option to purchase up to an additional $5,250,000 in
aggregate principal amount of the Notes to cover overallotments, if any
� Joint book-running managers: Keefe, Bruyette & Woods, A Stifel Company, and D.A. Davidson & Co.
– Co-managers: Janney Montgomery Scott and Ladenburg Thalmann
� Do not presently anticipate having to raise equity in the near future; have sufficient capital available
to invest in and further grow our business

www.newtekone.com 6
Investment Pipeline
� Have targeted four companies for investment
1. Signed Letter of Intent in loan servicing space
� 4.5x EBITDA plus potential origination upside
2. Signed Letter of Intent in technology space
� <$1.0 million at 1x revenue
3. In negotiation on a payment processing company
� Asking 5x EBITDA
4. In negotiation for an insurance agency
� Asking 1.5x revenue

www.newtekone.com 7
Repositioning of the Newtek Brand
� In the process of repositioning our brand to more accurately reflect our business model
� Will soon be rolling out our new website and domain - NewtekOne™ - in conjunction
with our new slogan, ‘Your Business Solutions CompanyTM’
� One Newtek, One Brand
� Satisfy the business needs of small- and medium-sized businesses across many products
and services from ONE brand
� Drive traffic to product pages as The Solutions Provider
– Newtek Business Finance Solutions
– Newtek Payment Solutions
– Newtek Technology Solutions
– Newtek Payroll and Benefits Solutions
– Newtek Insurance Agency Solutions

www.newtekone.com 8
Newtek Business Services Corp.“Your Business Solutions Company™”
NewtekOne.com
Newtekone.com/loans
Newtekone.com/payments
Newtekone.com/technology
Newtekone.com/insurance
Newtekone.com/payrollbenefits
Newtek Business Services Corp.
For all your financial and business solution needs

www.newtekone.com 9
NewTracker®
� NewTracker® is Newtek’s patented proprietary web-based customer referral,
tracking and processing software
� Provides a cost-effective client-acquisition strategy through disintermediation of
human function; no “feet on the street” sales force
� Processing business from a remote location drives Newtek’s business model
� Newtek has built a robust network of nationally recognized alliance partners that
refer businesses to Newtek through NewTracker®
— Alliance partners refer their customers to Newtek for one or more of our product
solutions, to enhance and/or expand their core product menus
— Alliance partner examples include UBS, The Hartford, Morgan Stanley, Amalgamated Bank,
Credit Union National Association (CUNA), Valley National Bank, AIG, JCC, Meineke Muffler
Dealers Association
� Have received 570,000 business referrals to date through NewTracker®

www.newtekone.com 10
New Company Headquarters: Lake Success, NY
� April, 11 2016: Opened a new office in Lake Success, NY, which is located in western Long
Island
� Will serve as the Company’s primary operating location with Newtek and five of its
controlled portfolio companies in a central location
� Furthers the goal of a more efficient and effective cross-selling and cross-marketing
program
� Signifies the anticipated further expansion of the lending business, growth of Newtek’s
controlled portfolio companies and potential future investments
� Central location will allow Newtek to more easily recruit talent from the five Boroughs,
Long Island and parts of Westchester, and offers proximity to New York City, which is
easily accessible via both public and private transportation
� Three additional buildings contiguous to this address that offer additional 1.0 million
square feet of space, which further enhances the attractiveness of expanding Newtek’s
business in this particular location
� Contracted to sublet NYC location, beginning June 2016, which equates to an annual
savings of approximately $250,000 per year
www.newtekone.com 11
Expanding Senior Management Team
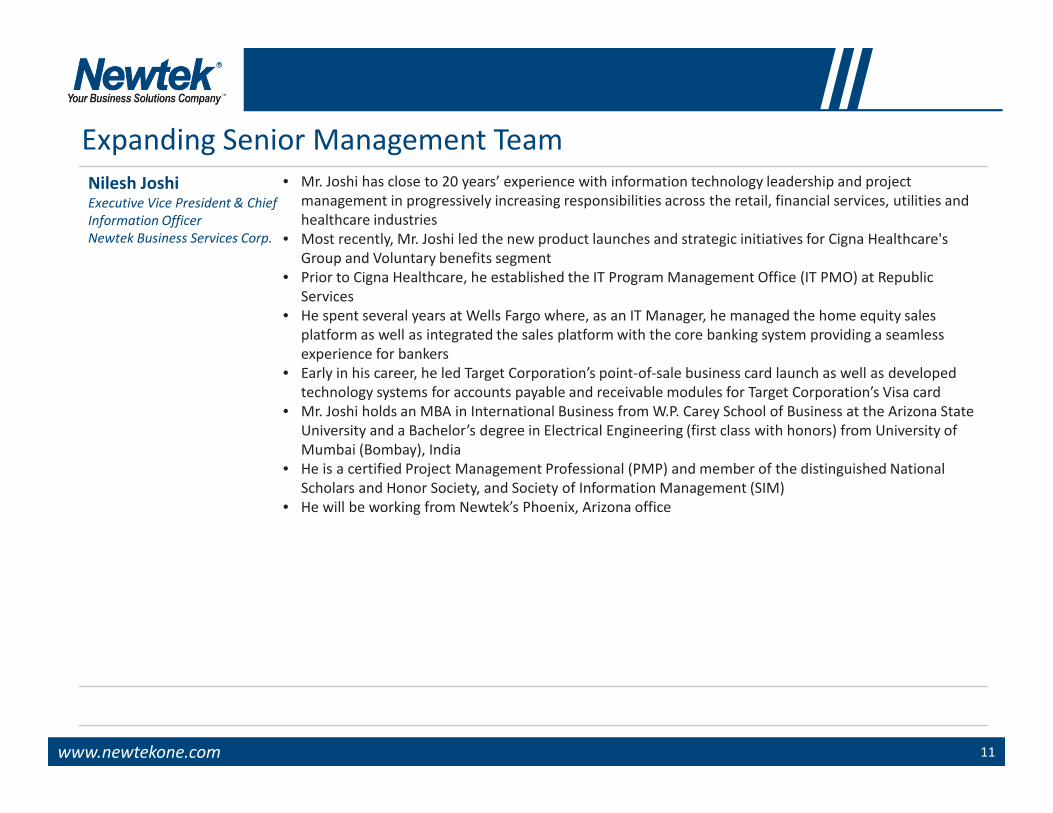
Nilesh JoshiExecutive Vice President & Chief
Information Officer
Newtek Business Services Corp.
• Mr. Joshi has close to 20 years’ experience with information technology leadership and project
management in progressively increasing responsibilities across the retail, financial services, utilities and
healthcare industries
• Most recently, Mr. Joshi led the new product launches and strategic initiatives for Cigna Healthcare's
Group and Voluntary benefits segment
• Prior to Cigna Healthcare, he established the IT Program Management Office (IT PMO) at Republic
Services
• He spent several years at Wells Fargo where, as an IT Manager, he managed the home equity sales
platform as well as integrated the sales platform with the core banking system providing a seamless
experience for bankers
• Early in his career, he led Target Corporation’s point-of-sale business card launch as well as developed
technology systems for accounts payable and receivable modules for Target Corporation’s Visa card
• Mr. Joshi holds an MBA in International Business from W.P. Carey School of Business at the Arizona State
University and a Bachelor’s degree in Electrical Engineering (first class with honors) from University of
Mumbai (Bombay), India
• He is a certified Project Management Professional (PMP) and member of the distinguished National
Scholars and Honor Society, and Society of Information Management (SIM)
• He will be working from Newtek’s Phoenix, Arizona office

www.newtekone.com 12
Expanding Senior Management Team
� Over the last 12 months, added significant talent to the senior management
team of Newtek and its controlled portfolio companies
– John Raven: President and Chief Operating Officer of Newtek Technology Solutions as
well as Chief Technology Officer and Chief Information Security Officer of Newtek
Business Services Corp.
– Michael W. Campbell: Chief Credit Officer and Chief Risk Officer of Newtek Merchant
Solutions
– Jordan Stein: President and Chief Operating Officer of Newtek Merchant Solutions and
Newtek Payment Solutions
www.newtekone.com 13
Newtek Small Business Finance
� Currently the largest non-bank institution licensed by the U.S. Small Business Administration (“SBA”) under
the federal Section 7(a) loan program based on annual origination volume (national PLP status)
� One of 14 Non-Bank SBA Government-Guaranteed Lender Licenses (these licenses are presently no longer
being issued)
� 8th largest SBA 7(a) lender including banks(1)
� National SBA 7(a) lender to small business since 2003; 13-year history of loan default frequency and
severity statistics
� Issued 6 S&P Rated AA & A Securitizations since 2010
� Small balance, industry and geographically diversified portfolio of 1,016 loans
– Average loan size is $173K of average unguaranteed retained loan balance
� Floating rate at Prime plus 2.75% with no caps; equivalent to 6.25% cost to borrower
� No origination fees with 7- to 25-year amortization schedules; receiving a high-quality loan product
� Secondary market established for SBA 7(a) government-guaranteed lending for over 61 years and Newtek
establishes liquidity for unguaranteed portions through securitizations
� After securitization of unguaranteed portion and sale of government insured portion, principal in the loan is
returned
(1) As of March 31, 2016.

www.newtekone.com 14
Capturing Opportunity in the Lending Market
� Referrals received have increased by almost 80% as of March 31, 2016 compared to the
same period one year ago
� The $2.0 billion in referrals received during Q1 2016 represent close to 40% of the total
referrals we received for the full year of 2015
$ in mi l l ions
Year to Date
Lending Referrals
Submitted
March 31, 2016 2,020.0$
March 31, 2015 1,125.9$
YTD Year-over-Year Increase 79.4%

www.newtekone.com 15
Growth in SBA 7(a) Loan Fundings and SBA 7(a)Loan Pipeline
$53.7
$80.1
$0
$20
$40
$60
$80
$100
30-Apr-15 30-Apr-16
Year to date Through April 30, 2015 vs. 2016
$299.6
$523.1
$0
$150
$300
$450
$600
30-Apr-15 30-Apr-16
SBA 7(a) Loan Fundings SBA 7(a) Loan Pipeline
� Year to date through April 30, 2016, SBA 7(a) loan fundings increased year over year by 49.0%
� Year to date through April 30, 2016, the SBA 7(a) loan pipeline increased year over year by 74.6%
$$ in millions $$ in millions

www.newtekone.com 16
Current SBA 7(a) Loan Pipeline; A Year-Over-Year Comparison
� In 2016 through April 30, 2016, SBA 7(a) loans in the pipeline increased by 74.6% to approximately
$523.1 million compared to $299.6 million at April 30, 2015
2016 SBA 7(a) Loan Pipeline
April 30, 2016 April 30, 2015
Open Referrals $328,339,373 $186,413,039
Prequalified Loans $119,451,008 $54,008,685
Loans In Underwriting $45,925,200 $23,275,845
Approved Pending Closing $29,350,150 $35,875,700
Total Loan Pipeline $523,065,731 $299,573,269

www.newtekone.com 17
Average Net Premium From SBA Guaranteed Loan Sales
10.56%
12.22% 12.31%12.49%
11.72%
12.41%
9.00%
10.00%
11.00%
12.00%
13.00%
2011 2012 2013 2014 2015 2016*
Net Premium Trends
Net Premium%
*For the three months ended March 31, 2016, received a weighted average net premium of 112.4% with a weighted average term of
17.30 years.
� For the three months ended March 31, 2016, we have seen an increase in the net premium received on the
sale of guaranteed SBA loans to 12.41% over the 2015 net premium
Weighted Average Term 15.99 17.29 18.84 18.79 17.74 17.30

www.newtekone.com 18
Gain-on-Sale Premium Trend
Loan Sale Premium Income Trend
$ in thousands
2011 2012 2013 2014 2015
$12,468 $12,367 $19,456 $19,493 $29,575*
*Realized gains on non-affiliate investments. Prior to conversion to a BDC in November 2014, amounts
were recorded as Premium Income in the consolidated statements of operations.

www.newtekone.com 19
Average Loan Balance of Loans Sold
*For the three months ended March 31, 2016.
$1.034 $1.056
$0.904
$0.564
$0.00
$0.30
$0.60
$0.90
$1.20
2013 2014 2015 2016*
$ in millions
www.newtekone.com 20
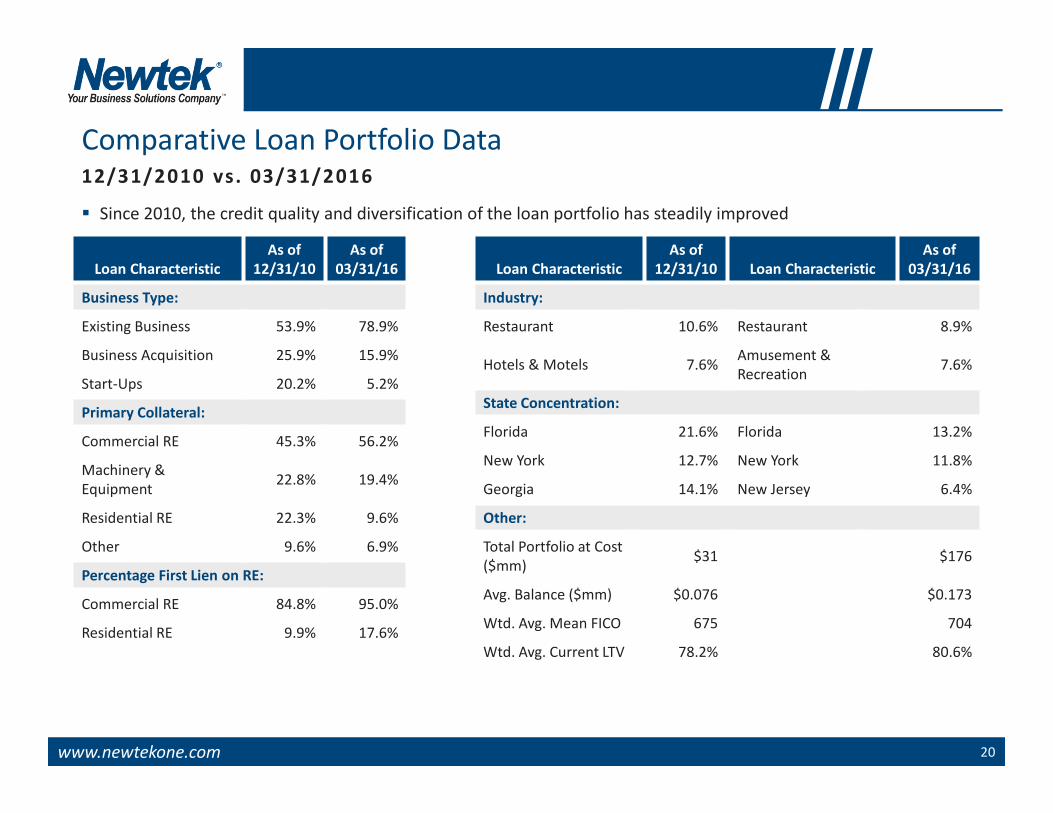
Comparative Loan Portfolio Data12/31/2010 vs. 03/31/2016
� Since 2010, the credit quality and diversification of the loan portfolio has steadily improved
Loan Characteristic
As of
12/31/10
As of
03/31/16
Business Type:
Existing Business 53.9% 78.9%
Business Acquisition 25.9% 15.9%
Start-Ups 20.2% 5.2%
Primary Collateral:
Commercial RE 45.3% 56.2%
Machinery &
Equipment22.8% 19.4%
Residential RE 22.3% 9.6%
Other 9.6% 6.9%
Percentage First Lien on RE:
Commercial RE 84.8% 95.0%
Residential RE 9.9% 17.6%
Loan Characteristic
As of
12/31/10 Loan Characteristic
As of
03/31/16
Industry:
Restaurant 10.6% Restaurant 8.9%
Hotels & Motels 7.6%Amusement &
Recreation7.6%
State Concentration:
Florida 21.6% Florida 13.2%
New York 12.7% New York 11.8%
Georgia 14.1% New Jersey 6.4%
Other:
Total Portfolio at Cost
($mm)$31 $176
Avg. Balance ($mm) $0.076 $0.173
Wtd. Avg. Mean FICO 675 704
Wtd. Avg. Current LTV 78.2% 80.6%

www.newtekone.com 21
Strong Loan Portfolio Performance
� Continue to employ strict underwriting guidelines and attention to credit quality of the
loans we originate
� For the last 12 months through March 31, 2016, experienced 0.73% of charge offs as a
percentage of the average outstanding loan balance
March 31, 2015 March 31, 2016
Average Outstanding Loan Balance 122,593,916$ 157,484,807$
Charge Off Rolling 12 Months(in dollars) 975,715$ 1,152,248$
Chargeoff as a Percentage of Average Oustanding Loan Balance 0.80% 0.73%
www.newtekone.com 22
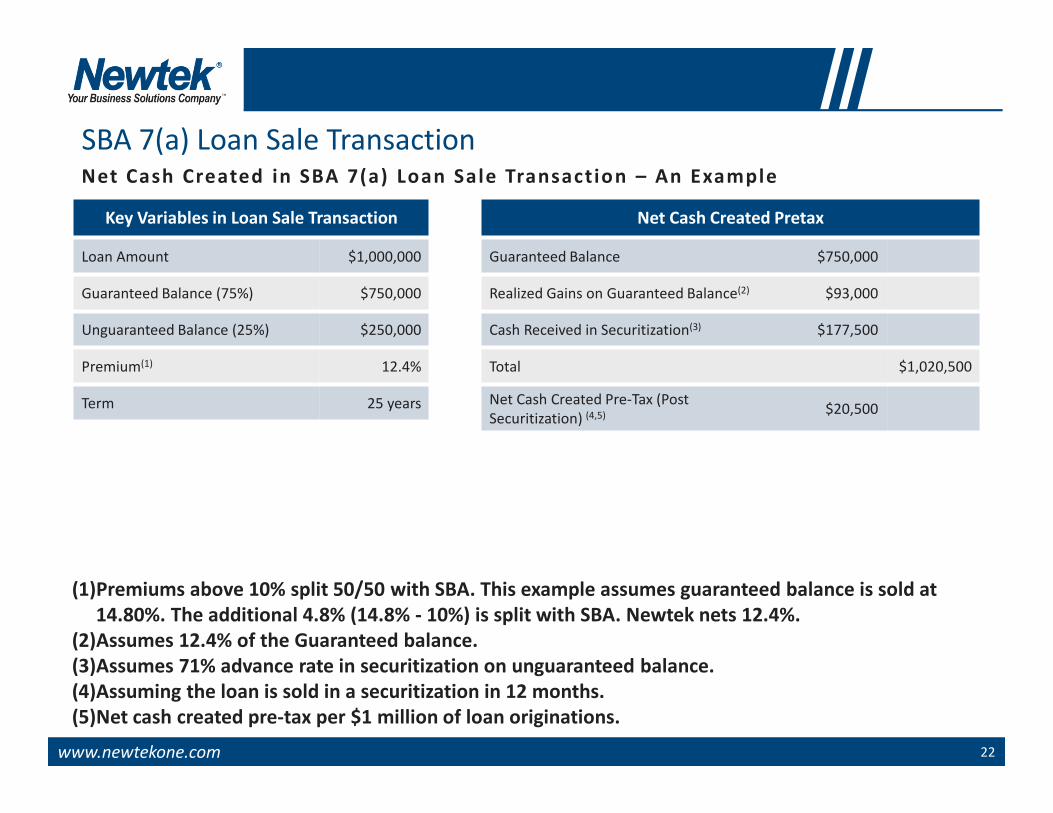
SBA 7(a) Loan Sale Transaction
(1)Premiums above 10% split 50/50 with SBA. This example assumes guaranteed balance is sold at
14.80%. The additional 4.8% (14.8% - 10%) is split with SBA. Newtek nets 12.4%.
(2)Assumes 12.4% of the Guaranteed balance.
(3)Assumes 71% advance rate in securitization on unguaranteed balance.
(4)Assuming the loan is sold in a securitization in 12 months.
(5)Net cash created pre-tax per $1 million of loan originations.
Net Cash Created in SBA 7(a) Loan Sale Transaction – An Example
Key Variables in Loan Sale Transaction
Loan Amount $1,000,000
Guaranteed Balance (75%) $750,000
Unguaranteed Balance (25%) $250,000
Premium(1) 12.4%
Term 25 years
Net Cash Created Pretax
Guaranteed Balance $750,000
Realized Gains on Guaranteed Balance(2) $93,000
Cash Received in Securitization(3) $177,500
Total $1,020,500
Net Cash Created Pre-Tax (Post
Securitization) (4,5) $20,500

www.newtekone.com 23
SBA 7(a) Loan Sale Transaction
(1) Premiums above 10% split 50/50 with SBA. This example assumes guaranteed balance is sold at 14.8%. The additional 4.8%
(14.8% - 10%) is split with SBA. Newtek nets 12.4%.
(2) Assumes 12.4% of the Guaranteed balance.
(3) Value determined by GAAP servicing value; a present value of future servicing income.
(4) Unguaranteed portion gets immediately written down at origination to reflect cumulative estimate of default frequency and
severity. This example assume a 2.5% discount.
(5) Net risk-adjusted profit recognized per $1 million of loan originations.
Direct Revenue / Expense of an SBA 7(a) Loan Sale Transaction – An Example
Key Variables in Loan Sale Transaction
Loan Amount $1,000,000
Guaranteed Balance (75%) $750,000
Unguaranteed Balance (25%) $250,000
Premium(1) 12.4%
Term 25 years
Resulting Revenue (Expense)
Associated Premium (2) $93,000
Servicing Asset (3) $18,000
Total Realized Gain $111,000
Packaging Fee Income $2,500
FV Non-Cash Adjustment on Uninsured Loan
Participations(4) $(6,250)
Referral Fees Paid to Alliance Partners $(7,500)
Total Direct Expenses $(13,750)
Net Risk-Adjusted Profit Recognized (5) $99,750
� In Q4 2015, referral fees paid to alliance partners were 25 basis points lower than our historical average
of 75 basis points

www.newtekone.com 24
SBA 504 Loans: Focus for Portfolio Company – Newtek Business
Credit Solutions� The Certified Development Company (“CDC”)/504 Loan Program is a long-term financing tool that provides
growing businesses with fixed-rate financing to acquire assets such as land, buildings, and sizeable purchases of
equipment
� Funded first SBA 504 loan in November 2015
� Loans cannot be used for working capital or purchasing inventory (allowed uses under the 7(a) program)
� Loan-to-value (“LTV”) ratio for the borrower of 90%; borrowers contribute 10% equity
� Portfolio company has exposure on only 50% of the LTV
� U.S. Government has exposure on 40% of the LTV
� Portfolio company will sell the senior loan participation at an anticipated 3-5 point premium
� SBA 504 loans give borrowers a fixed-rate alternative
www.newtekone.com 25
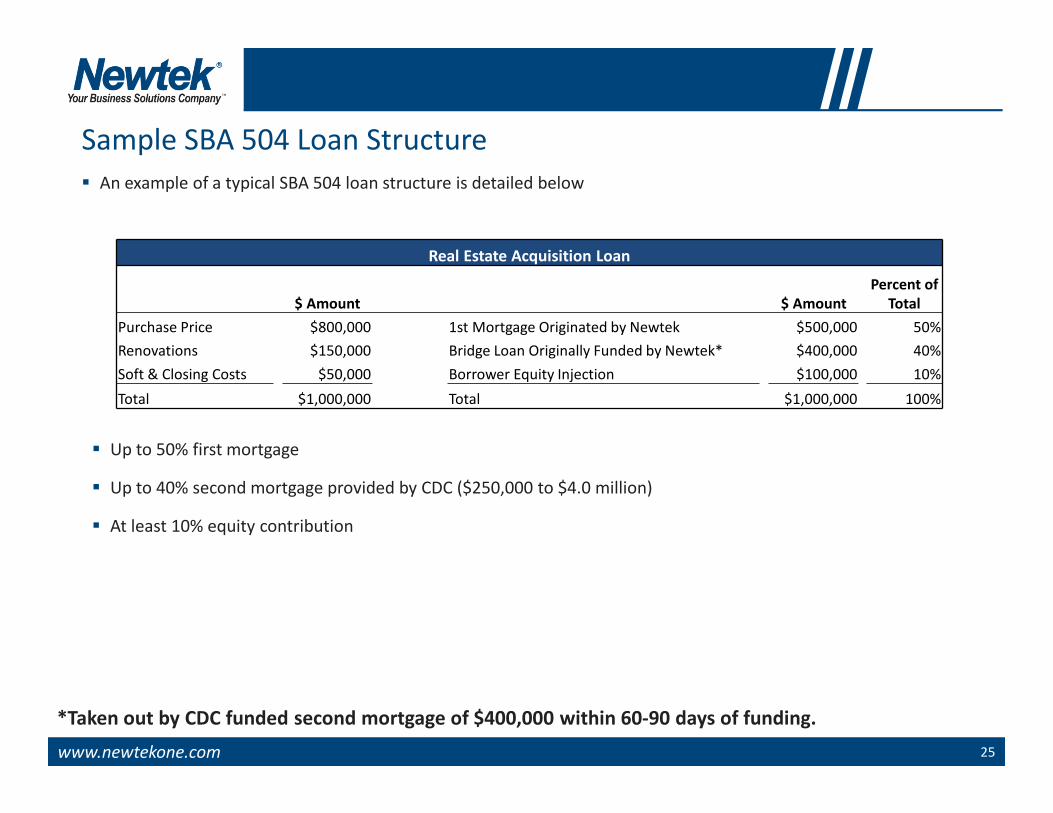
Sample SBA 504 Loan Structure
� An example of a typical SBA 504 loan structure is detailed below
Real Estate Acquisition Loan
$ Amount $ Amount
Percent of
Total
Purchase Price $800,000 1st Mortgage Originated by Newtek $500,000 50%
Renovations $150,000 Bridge Loan Originally Funded by Newtek* $400,000 40%
Soft & Closing Costs $50,000 Borrower Equity Injection $100,000 10%
Total $1,000,000 Total $1,000,000 100%
*Taken out by CDC funded second mortgage of $400,000 within 60-90 days of funding.
� Up to 50% first mortgage
� Up to 40% second mortgage provided by CDC ($250,000 to $4.0 million)
� At least 10% equity contribution

www.newtekone.com 26
Loan Sale Transaction- SBA 504 Loan Net Cash Created in SBA 504 Loan Sale Transaction – An Example
Key Variables in Loan Sale Transaction
Total Projected Financing $2,682,274
Senior Loan Balance $1,342,274
Junior Bridge Loan Balance(1) $1,040,000
Borrower Equity $300,000
Premium(2) 5.00%
Rate Fixed
Term 10 Years
Net Cash Created Pretax
Total Senior & Junior Debt $2,382,274
Funded Under Bank Facility $2,144,047
Newtek Equity $238,227
Net Premium Earned(3) $50,335
Interest Earned Before Sale(4) $39,592
Origination Fees $26,000
Interest Expense ($17,420)
SBA Servicing Fee (One-time) ($6,711)
Total $2,474,070
Net Cash Created(6) $91,796
Return on Investment (Gross Operating
Profit/ Equity)(7) 38.5%
(1) Initially funded by Newtek’s portfolio company to be taken out in 90
days by a junior lender through SBA guaranteed debentures
(2) Assumes 5.00% gross premium with 25% paid to referral source
(3) Assumes 3.75% net premium paid on Senior Loan Balance
(4) Assumes Senior and Junior Bridge loans are outstanding for 90 days
(5) Servicing fee generated over six months
(6) Net cash created equals the addition of Net Premium Earned, Net
Interest Earned Before Sale, Origination Fees, Servicing Fee Income
less Interest Expense
(7) The first year return on investment is based on net cash created of
$91,796 divided by Newtek equity of $238,227. The holding period
for the loan is actually 3 months but the return is based on the full
year

www.newtekone.com 27
Comparable Company Statistics
� Live Oak Bancshares, Inc. (NASDAQ: LOB)
– Online platform for small business
lending
– $551 million market capitalization
– Raised $81.6 million in IPO on 7/23/15
– Currently trading at 2.72x book value*
� BankUnited, Inc. (NYSE: BKU)
– Acquired Certus’ Small Business Finance
Unit in an asset purchase transaction
– Certus’ loan portfolio totaled
approximately $203 million as of January
31, 2015
– Purchase price for the transaction was a
$20 million premium to the tangible NAV
– Currently trading at 1.65x tangible book
value**
*Book value of $5.98 per common share as reported by Live Oak Bancshares, Inc. for quarter ended March
31, 2016. http://investor.liveoakbank.com/phoenix.zhtml?c=253224&p=irol-newsArticle&ID=2162389
Closing price of $16.25 as of May 2, 2016.
**Tangible book value of $20.99 per common share as reported by Bank United, Inc. for the quarter ended
March 31, 2016. http://ir.bankunited.com/phoenix.zhtml?c=89487&p=irol-newsArticle&ID=2158569
Closing price of $34.73 as of May 2, 2016.

www.newtekone.com 28
Portfolio Companies – Electronic Payment Processing (“EPP”)
(1) HPY & VNTV estimates via Bloomberg as of May 3, 2016. FDC estimates via Yahoo Finance data as of May 3, 2016; uses trailing 12
months EBITDA.
(2) *See page 39 for definition of Adjusted EBITDA.
Publicly Traded Comparable Companies
Name (Symbol)
Enterprise Value /
2015 EBITDA (1)
� Heartland Payment Systems (HPY) 15.58x
� Vantiv, Inc. (VNTV) 15.76x
� First Data Corporation (FDC)12.50x
� EPP includes Newtek Merchant Solutions and Subsidiary, and Premier Payments LLC (Newtek
Payment Solutions)
� We have owned and operated Newtek Merchant Solutions for 10+ years
� Over 15,000 business accounts; over $5.5 billion in electronic payment processing volume in 2015
� For the three months ended March 31, 2016 vs. March 31, 2015
– Revenue was $25.4 million; an increase of 9.5% over $23.2 million
– Adjusted EBITDA* was $2.8 million; a 47% increase over $1.9 million
Valuation & Financial Performance
� Valued at approximately 5.5x LTM Adjusted EBITDA or 5.6x FY
2016 Forecasted Adjusted EBITDA*
� Premier Payments valued at $17.5 million as of 3/31/16
� Newtek Merchant Solutions valued at $55.2 million as of 3/31/16
2016 Forecast
� Revenue: $108.8 million
� Adjusted EBITDA*: $13.1 million
Note: See Newtek’s 2015 Form 10-K for specific valua tion methodology applied for Newtek’s controlled por tfolio companies.

www.newtekone.com 29
EPP’s Opportunities in Payment Processing
� Additional alliance partners
� American Express OptBlue
� Tablet and mobile-based cloud computing
� Europay, MasterCard and Visa (“EMV”) compliance solutions
� Clients want:
– Security
– eCommerce backup
– Robust reporting
– Mobile applications
– EMV compliance
– One provider vs. multiple
www.newtekone.com 30
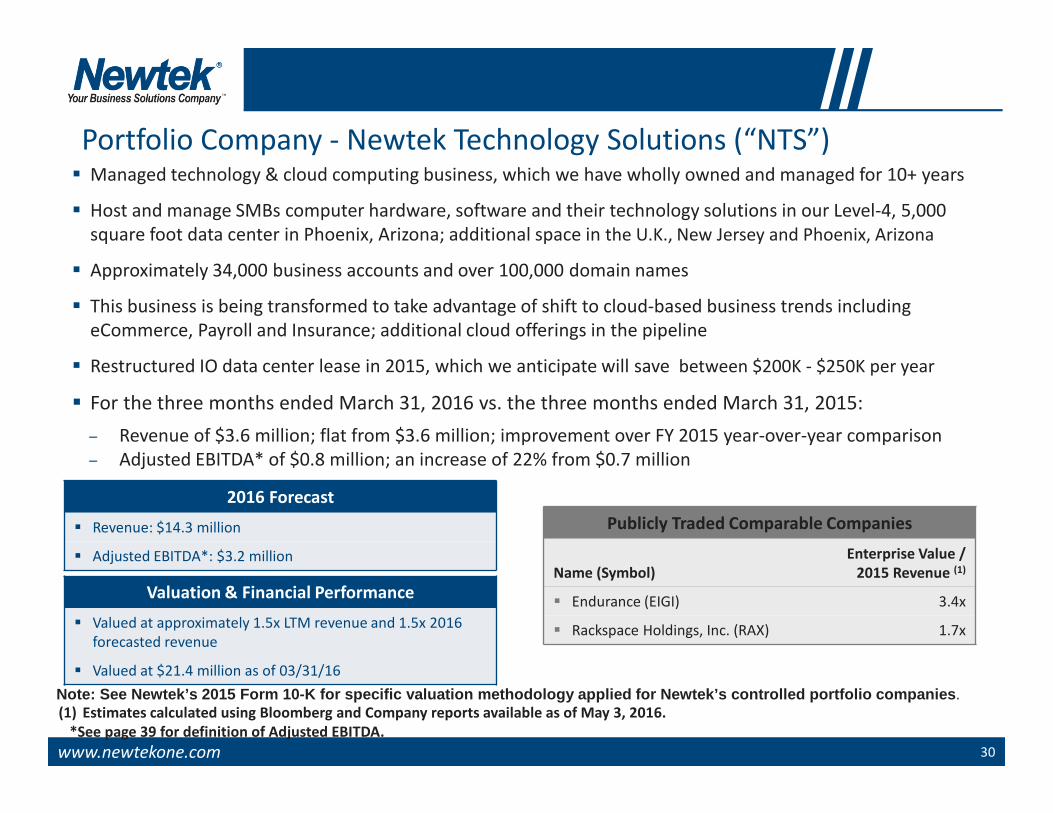
Portfolio Company - Newtek Technology Solutions (“NTS”)
(1) Estimates calculated using Bloomberg and Company reports available as of May 3, 2016.
*See page 39 for definition of Adjusted EBITDA.
� Managed technology & cloud computing business, which we have wholly owned and managed for 10+ years
� Host and manage SMBs computer hardware, software and their technology solutions in our Level-4, 5,000
square foot data center in Phoenix, Arizona; additional space in the U.K., New Jersey and Phoenix, Arizona
� Approximately 34,000 business accounts and over 100,000 domain names
� This business is being transformed to take advantage of shift to cloud-based business trends including
eCommerce, Payroll and Insurance; additional cloud offerings in the pipeline
� Restructured IO data center lease in 2015, which we anticipate will save between $200K - $250K per year
� For the three months ended March 31, 2016 vs. the three months ended March 31, 2015:
– Revenue of $3.6 million; flat from $3.6 million; improvement over FY 2015 year-over-year comparison
– Adjusted EBITDA* of $0.8 million; an increase of 22% from $0.7 million
Publicly Traded Comparable Companies
Name (Symbol)
Enterprise Value /
2015 Revenue (1)
� Endurance (EIGI) 3.4x
� Rackspace Holdings, Inc. (RAX) 1.7x
Valuation & Financial Performance
� Valued at approximately 1.5x LTM revenue and 1.5x 2016
forecasted revenue
� Valued at $21.4 million as of 03/31/16
2016 Forecast
� Revenue: $14.3 million
� Adjusted EBITDA*: $3.2 million
Note: See Newtek’s 2015 Form 10-K for specific valua tion methodology applied for Newtek’s controlled por tfolio companies .

www.newtekone.com 31
NTS’ Opportunities in Cloud Computing
� Dedicated server migration to the Cloud
� 24-7 outsourced managed service solutions
� Hot back-up and live redundancy globally
� HIPAA-compliant solutions under the Affordable Healthcare Act
� Independent business owners will flock to the Cloud
� Independent business owners will ask
– Where is your server?
– Where is your data?
� Counterparty must offer a strong balance sheet, reps and warranties, high level of
security and guaranteed uptime or backup

www.newtekone.com 32
Full Year 2016 Forecasted Adjusted EBITDA Breakdown*
� 38.5% of forecasted 2016 Adjusted EBITDA1 emanates from business service portfolio companies
� 61.5% of forecasted 2016 Adjusted EBITDA1 emanates from the lending business
$13.1
$3.2$26.0
Forecasted 2016 Adjusted EBITDA1
Breakdown
Electronic Payment Processing** Newtek Technology Services
Newtek Small Business Finance
$ in millions
*Slide is for discussion only. Does not represent BDC consolidated results and only reflects NSBF and three of our
largest portfolio companies.
**Includes Newtek Merchant Solutions and Premier Payments LLC.1See page 39 for definition of Adjusted EBITDA.

www.newtekone.com 33
Internally Managed vs. Externally Managed BDCs
� Newtek is an internally managed BDC, and is currently trading at 0.89x* NAV as of May 3, 2016
� The following internally managed BDC public comparables currently trade at a median price to NAV of
approximately 1.27x**
– Hercules Technology Growth Capital (NASDAQ: HTGC)
– KCAP Financial (NASDAQ: KCAP)
– Main Street Capital (NASDAQ: MAIN)
– Triangle Capital (NASDAQ: TCAP)
* As of May 3, 2016 closing price of $12.49.
**Closing prices as of May 3, 2016 and most recently publicly reported NAVs.
Internally Managed BDCs Externally Managed BDCs
No base or incentive fees pa id to an external manager Pay expense and incentive fees to a management company
Generally a greater percent of revenue becomes dividend
income for the shareholder
Not required to provide shareholders with compensation
information
Lower operating expense ratios than externally managed Higher operating expense ratios than internally managed BDCs
Typical ly trade at a premium to NAV/share Typically trade at a discount to NAV/share

www.newtekone.com 34
Investment Summary
� Newtek Business Services Corp. is an internally managed BDC with no base or incentive fees paid to
an external manager
� Portfolio companies are wholly owned, most for over 10 years, by Newtek Business Services Corp.
� Forecasting to pay an annual cash dividend of approximately $1.52 per share in 2016
� Investing in a business without excessive leverage
� Proven track record; Established in 1998; publically traded since September 2000
� Over 13-year lending history through multiple lending cycles; great depth and breadth of experience
� NSBF does not purchase repackaged loans; instead, originates on a true retail basis leading to strong
credit quality and loan performance
� Management’s interests aligned with shareholders
‒ CEO is a major shareholder; Founders, Management and Board combined own approximately 15% of
outstanding shares(1)
� No derivative securities in BDC
� No 2nd lien or mezzanine financing as a business line
� No direct lending exposure to oil and gas industry
(1)As of March 31, 2016.

www.newtekone.com
Financial Review – Jennifer C. Eddelson, Chief Accounting Officer
www.newtekone.com 36
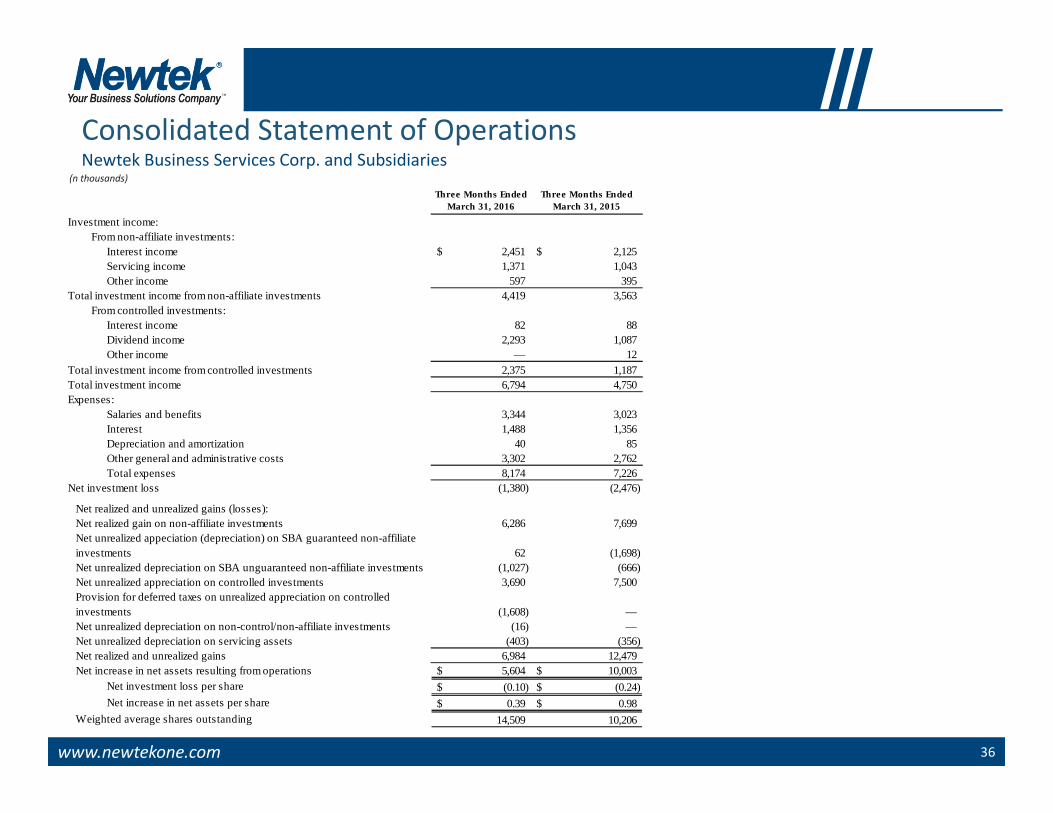
Consolidated Statement of OperationsNewtek Business Services Corp. and Subsidiaries
(n thousands)
Three Months Ended March 31, 2016
Three Months Ended March 31, 2015
Investment income:From non-affiliate investments:
Interest income 2,451$ 2,125$ Servicing income 1,371 1,043Other income 597 395
Total investment income from non-affiliate investments 4,419 3,563From controlled investments:
Interest income 82 88Dividend income 2,293 1,087Other income — 12
Total investment income from controlled investments 2,375 1,187Total investment income 6,794 4,750Expenses:
Salaries and benefits 3,344 3,023Interest 1,488 1,356Depreciation and amortization 40 85Other general and administrative costs 3,302 2,762Total expenses 8,174 7,226
Net investment loss (1,380) (2,476)
Net realized and unrealized gains (losses): Net realized gain on non-affiliate investments 6,286 7,699
Net unrealized appeciation (depreciation) on SBA guaranteed non-affiliate investments 62 (1,698)
Net unrealized depreciation on SBA unguaranteed non-affiliate investments (1,027) (666) Net unrealized appreciation on controlled investments 3,690 7,500
Provision for deferred taxes on unrealized appreciation on controlled investments (1,608) —Net unrealized depreciation on non-control/non-affiliate investments (16) —
Net unrealized depreciation on servicing assets (403) (356) Net realized and unrealized gains 6,984 12,479 Net increase in net assets resulting from operations 5,604$ 10,003$
Net investment loss per share (0.10)$ (0.24)$ Net increase in net assets per share 0.39$ 0.98$
Weighted average shares outstanding 14,509 10,206

www.newtekone.com 37
Non-GAAP Financial Measures
Newtek Business Services Corp. and Subsidiaries
In evaluating its business, Newtek considers and uses adjusted net investment income as a measure of its operating
performance. Adjusted net investment income includes short-term capital gains from the sale of the guaranteed
portions of SBA 7(a) loans, which is a reoccurring event. The Company defines Adjusted net investment income (loss)
as Net investment income (loss) plus Net realized gains (losses) recognized from the sale of guaranteed portions of
SBA 7(a) loan investments.
The term Adjusted net investment income is not defined under U.S. generally accepted accounting principles, or U.S.
GAAP, and is not a measure of operating income, operating performance or liquidity presented in accordance with
U.S. GAAP. Adjusted net investment income has limitations as an analytical tool and, when assessing the Company’s
operating performance, investors should not consider Adjusted net investment income in isolation, or as a substitute
for net investment income (loss), or other consolidated income statement data prepared in accordance with U.S.
GAAP. Among other things, Adjusted net investment income does not reflect the Company’s actual cash
expenditures. Other companies may calculate similar measures differently than Newtek, limiting their usefulness as
comparative tools. The Company compensates for these limitations by relying primarily on its GAAP results
supplemented by Adjusted net investment income.

www.newtekone.com 38
Non-GAAP Financial Measure – Newtek Business Services Corp. and
Subsidiaries
(in thousands, except per share amounts)
Three
Months
ended
March 31,
2016 Per share
Three
Months
ended
March 31,
2015 Per share
Net investment loss (1,380)$ (0.10)$ (2,476)$ (0.24)$
Net realized gain on non-affiliate debt
investments 6,276 0.43 7,699 0.75
Adjusted net investment income 4,896$ 0.34$ 5,223$ 0.51$
Adjusted Net Investment Income Reconciliation
Note: Amounts may not foot due to rounding

www.newtekone.com 39
Non-GAAP Financial Measures
Newtek’s Controlled Portfolio Company Investments
The Company’s controlled portfolio company investments define Adjusted EBITDA as earnings before interest
expense, taxes, depreciation and amortization, managerial assistance fees, loss on lease and stock compensation
expense. Adjusted EBITDA is used as a supplemental measure to review and assess the operating performance of the
controlled portfolio companies. The Company’s controlled portfolio companies also present Adjusted EBITDA
because the Company believes it is frequently used by securities analysts, investors and other interested parties as a
measure of financial performance.
The term Adjusted EBITDA is not defined under U.S. generally accepted accounting principles, or U.S. GAAP, and is not
a measure of operating income, operating performance or liquidity presented in accordance with U.S.
GAAP. Adjusted EBITDA has limitations as an analytical tool and, when assessing the portfolio company’s operating
performance, investors should not consider Adjusted EBITDA in isolation, or as a substitute for net income, or other
income statement data prepared in accordance with U.S. GAAP. Among other things, Adjusted EBITDA does not
reflect the controlled portfolio companies’ actual cash expenditures. Other companies may calculate similar
measures differently than the controlled portfolio company, limiting their usefulness as comparative tools. The
Company compensates for these limitations by relying primarily on its GAAP results supplemented by Adjusted
EBITDA.

www.newtekone.com 40
Non-GAAP Financial Measures - Newtek’s Controlled Portfolio
Company Investments
Adjusted EBITDA Reconciliation – Electronic Payment Processing
(in millions)
Three Months
Ended March 31,
2016
Three Months
Ended March 31,
2015
Pretax income 1.9$ 1.6$
Interest expense, net 0.3 -
Depreciation and amortization 0.4 0.1
Managerial assistance fees 0.2 0.2
Adjusted EBITDA 2.8$ 1.9$

www.newtekone.com 41
Non-GAAP Financial Measures - Newtek’s Controlled Portfolio
Company Investments
Adjusted EBITDA Reconciliation – Newtek Technology Solutions
(in millions)
Three Months
Ended March 31,
2016
Three Months
Ended March 31,
2015
Pretax income 0.1$ 0.2$
Interest expense, net 0.1 -
Depreciation and amortization 0.4 0.4
Managerial assistance fees 0.2 0.1
Adjusted EBITDA 0.8$ 0.7$

www.newtekone.com 42
Non-GAAP Financial Measures - Newtek’s Controlled Portfolio
Company Investments
Forecasted Full Year 2016 Adjusted EBITDA Reconciliation
(in millions)
Electronic
Payment
Processing
Managed
Technology
Solutions
Pretax income 9.6$ 0.9$
Interest expense, net 1.0 0.3
Depreciation and amortization 1.8 1.5
Managerial assistance fees 0.7 0.5
Adjusted EBITDA 13.1$ 3.2$
(in millions)
Newtek Small
Business
Finance
Net increase in net assets 15.6$
Interest expense, net 9.1
Depreciation and amortization 0.1
Loss on lease 1.0
Stock compensation expense 0.2
Adjusted EBITDA 26.0$

www.newtekone.com 43
Q1 2015 Adjusted Net Investment Income and Proforma Adjusted
Net Investment Income Reconciliation
For the three months ended March 31, 2015
Adjusted Net Adjusted Net
(in thousands): Investment Investment
Income Income - Proforma
Net Investment Loss (2,476)$ (2,476)$
Realized gains from loans originated in Q4 2014 sold in Q1 2015 3,860 -
Realized gains from loans originated and sold in Q1 2015 3,839 3,839
Adjusted Net investment income 5,223$ 1,363$
WA shares outstanding 10,206 10,206
Adjusted Net investment income per share 0.51$
Adjusted Net investment income per share - Proforma 0.13$
Related Documents