1 Capital Effectiveness & Capital Effectiveness & Project Development Project Development Guy Lansdown, Senior Vice President Safety, Project Development and Technical Services Tom McCulley, Vice President, Newmont Technology Limited, Boddington Project

newmont mining 2_Cap_Eff_Final
Aug 20, 2015
Welcome message from author
This document is posted to help you gain knowledge. Please leave a comment to let me know what you think about it! Share it to your friends and learn new things together.
Transcript

1
Capital Effectiveness & Capital Effectiveness & Project Development Project Development
Guy Lansdown, Senior Vice President Safety, Project Development and Technical Services
Tom McCulley, Vice President, Newmont Technology Limited, Boddington Project
2February 8, 2008
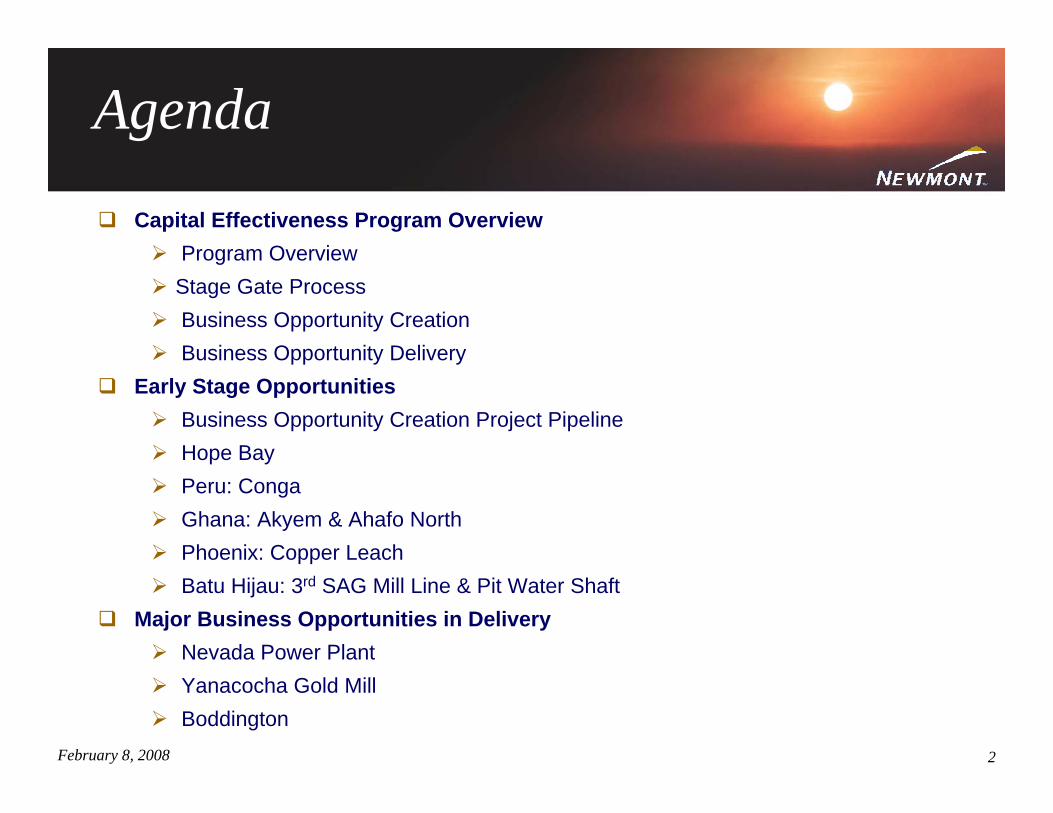
Agenda
Capital Effectiveness Program OverviewProgram OverviewStage Gate ProcessBusiness Opportunity CreationBusiness Opportunity Delivery
Early Stage OpportunitiesBusiness Opportunity Creation Project PipelineHope BayPeru: CongaGhana: Akyem & Ahafo NorthPhoenix: Copper LeachBatu Hijau: 3rd SAG Mill Line & Pit Water Shaft
Major Business Opportunities in DeliveryNevada Power PlantYanacocha Gold MillBoddington

3February 8, 2008
Capital Effectiveness & Major Projects
Russell Ball, Senior Vice President and Chief Financial Officer
Capital Effectiveness Program Overview

4February 8, 2008
Capital EffectivenessProgram Overview
BackgroundEffective means of managing a larger project and investment pipeline
HighlightsStages for project work and deliverable reviewsGates for Executive Decisions and Funding RequestsGoverning policy regardless of project scope or scale
BenefitsOptimization of investment opportunitiesEfficient and effective delivery of information“Right Decisions at the Right Time”Reliable Business Case outcomes
Strategic planning &
capital allocation
1
Portfolio optimization 2
Project development and execution
Project scope and design
Detailed engineering and contracting
Project execution
Project ramp-up
3
Structure Systems ProcessesCapabilities & mindsets
4
Strategic planning &
capital allocation
1 Strategic planning &
capital allocation
1 Strategic planning &
capital allocation
11
Portfolio optimization 2 Portfolio optimization 22
Project development and execution
Project scope and design
Detailed engineering and contracting
Project execution
Project ramp-up
Project development and execution
Project scope and design
Detailed engineering and contracting
Project execution
Project ramp-up
Project scope and design
Detailed engineering and contracting
Project execution
Project ramp-up
33
Structure Systems ProcessesCapabilities & mindsets
4
Structure Systems ProcessesCapabilities & mindsets
44

5February 8, 2008
Execution OperationsStage 1 Stage 2 Stage 3 Stage 4 GateGate
Gate 4Ensure single option is optimized, predictable and competitive
GateGate
Gate 3Select a single option to achieve Business Case
GateGate
Gate 2Determine if a Business Case exists
GateGate
Gate 1Advance viable business opportunities
Capital EffectivenessStage-Gate Process
StageDefined work requirements performed by various cross functional groups
GateDetermine if the investment
aligns with Newmont’s Strategy & Objectives
Business Opportunity Creation
Business Opportunity Delivery

6February 8, 2008
PurposeValue creation
Evaluation of creative andinnovative options
Development of strong business cases
HighlightsFocus on Business Objectives versus Project Objectives
Single point accountability leveraging consistent cross functional teams
Applies to internal and external opportunities for consistent portfolio management
BenefitsBusiness cases align with regional and corporate business strategies
Standardized processes and sharing of “best practices”
Capital EffectivenessBusiness Opportunity Creation

7February 8, 2008
PurposeFocus on achieving business results through project execution
Fast ramp up to delivering on business objectives
HighlightsFocus on Project Objectives that achieve Business Objectives
Standard work processes that align directly with Stage Gate Process
Single point of accountability and dedicated cross functional teams
Implementation of Value Improving Practices (VIP)
Front End Loading of work prior to project authorization
Operational Readiness
BenefitsBetter project definition prior to full funds authorization
Efficient and effective project management
Projects seamlessly transition into operating phase
Capital EffectivenessBusiness Opportunity Delivery

8February 8, 2008
Capital Effectiveness & Major Projects
Russell Ball, Senior Vice President and Chief Financial Officer
Early Stage Opportunities

9February 8, 2008
Business Opportunity CreationProject Pipeline
Several Early Stage Gold and Copper Internal Opportunities Only
Projects Include Potentially Economic Material Inventories
30-40 million ounces gold
5-10 billion pounds of copper
100-200 million ounces silver
Larger Projects Include
Yanacocha district sulfides
Nassau
Akyem
Hope Bay
Additional Interests in Fort ala Corne, Gabriel and Euronimba

10February 8, 2008
Business Objectives
Integrating Miramar into Newmont
Deliver near-term exploration results
Maintain engaged project team and positive community and government relations
Develop a reliable business case with earliest possible production
Project Status
Rescheduling and assessing Miramar’s Doris North
Stage 2 studies underway
Evaluating multiple options to optimize asset
Developing infrastructure on site
Establishing community and regional presence
Building cross functional project team
Hope Bay

11February 8, 2008
Business ObjectivesSustain regional production and presence
Identify additional opportunities
Deliver a reliable business case balanced with earliest possible production
Reserves (Newmont):
6.1 million ounces of gold
1.7 billion pounds of copper
StatusStage 3 study underway
Permitting activities underway
Building cross functional teams
Development decision expected in 2008
Peru: Conga

12February 8, 2008
Business ObjectivesGrow regional production
Maintain positive employee, community and governmental relations
Deliver a reliable business case balanced with earliest possible production
Reserves
Akyem: 7.7 million ounces of gold
Ahafo North: 3.2 million ounces of gold
StatusStage 3 study for Ahafo North project underway
Stage 2 study for Akyem project underway
Permitting activities underway
Building cross functional teams
Akyem development decision expected in 2008
Ghana: Ahafo North and Akyem

13February 8, 2008
Business ObjectivesReduce Phoenix operating costs
Increase reserves
Maximize use of Phoenix and Nevada Infrastructure
Deliver a reliable business case balanced with earliest possible production
Phoenix Reserves
7.6 million ounces of gold
740 million pounds of copper
Project StatusStage 3 study underway
Permitting activities underway
Analyzing options
Development decision expected in 2008
Phoenix: Copper Leach
Main SXEW Plant Area

14February 8, 2008
Business ObjectivesReduce operating costs
Increase Cu and Au reserves and production
Deliver a reliable business case balanced with earliest possible production
Batu Hijau Reserves (Newmont):
4.2 million ounces of gold
4.1 billion pounds of copper
Status Stage 3 studies underway
Pit Water Shaft
3rd SAG Mill Line
Securing production slots for long lead items
Assembling cross functional project teams
Batu Hijau:3rd SAG Mill Line & Pit Water Shaft

15February 8, 2008
Capital Effectiveness & Major Projects
Russell Ball, Senior Vice President and Chief Financial Officer
Major Business Opportunities in Delivery

16February 8, 2008
Business ObjectivesReduce NV operating costs by approximately $25 per ounce
Preserve gold reserves
Power Production200MW, coal fired
~ 150MW consumed by NV operations
Remaining power sold
Project Metrics Safety – TRIFR: 0.25
Capital: $620 - $640 million
Progress: 95% complete
Start-up: On track for mid 2008
First Fire on Coal: Completed January 2008
Nevada Power Plant 12/31/2007 Status

17February 8, 2008
Business ObjectivesPrepare for complex ores within region
Efficiently exploit resource potential
Production (100%)Gold annual average: 400 – 500 thousand ounces
CAS life of mine average: $250 – $300/oz
Project MetricsSafety – TRIFR: 0.77
Capital: $250 - $270 Million
Progress: 96% complete
Start-up: On track for mid 2008
Yanacocha Gold Mill12/31/2007 Status

18February 8, 2008
Business ObjectivesDevelop long life operation in AAA country
Increase future reserves
Create long term stable cash flows
Current Reserves (Newmont):
11.1 million ounces of gold
1.0 billion pounds of copper
Production First Five-Years (100%)Gold annual average: 950 – 1,050 thousand ounce
Copper annual average: 30 – 35 thousand tones
Project Metrics Safety – TRIFR: 1.21
Capital (Newmont): $1.4 to $1.6 billion
Progress: 62% complete
Start-up: On track for late 2008 / early 2009
Boddington 12/31/2007 Status

19February 8, 2008
Boddington 12/31/2007 Status
Plant modeled extensively
Commissioning –benchmarked ramp-up to full production
Attractive work location –close to Perth and beach towns
Good community support for project
OperationsExploration upside locally and in district
Good experienced operations team onboard
Operating costs agreements in place
Owner mining well underway

20February 8, 2008
Development and Investment Decision MakingConsistent approach to project development and investment decision making
Portfolio management for resource and investment planning
OpportunitiesProject pipeline focused on reserve/ production growth and CAS reduction
Emphasis on optimizing operation efficiency and value creation
ApproachFocus on Corporate Strategy
Integrated with Business and Regional Strategy
Standardized project work processes and governance
Manage full project life-cycle through delivery
Conclusion

21
Questions & Answers Questions & Answers
Related Documents