Newman & Tkach SWG Final Report 2015 – ND Amphibian Diseases and Parasites 1 State Wildlife Grant Final Report submitted to North Dakota Game and Fish Department on Sept. 23, 2015 Robert Newman, Ph.D. University of North Dakota, Department of Biology Title of Project: Diseases and Parasites of North Dakota Amphibians Award Period: 4/1/2013 - 6/30/2015 Principal Investigators: Dr. Robert Newman 1 , Dr. Vasyl Tkach, Dept of Biology, Univ of North Dakota 10 Cornell St. STOP 9019, Grand Forks, ND 58202-9019, 1 [email protected], 701-777-4290 Other key personnel: Melanie Firkins, Graduate Research Assistant, Dept of Biology, UND Contributions: RN designed the study, supervised or conducted data analysis, principal report author. VT supervised all aspects of necropsy protocols, parasite identification, and molecular diagnostics of both helminth parasites and microbial pathogens. MF conducted most field collections and necropsies, molecular laboratory procedures, and assisted in data analysis and report preparation. Project Objectives 1. Estimate geographic distribution and prevalence of ranavirus and chytrid fungus infection 2. Estimate distribution and prevalence of helminth parasites infecting amphibian hosts Background Worldwide reports of declines and extinctions of amphibians have continued for at least two decades (Houlahan et al. 2000, Stuart et al. 2004, Wake and Vredenburg 2008). Although multiple causes are implicated and seemingly disparate factors are likely to interact in complex ways, habitat loss or degradation (Cushman 2006) and infectious diseases (Gray et al. 2009, Patz et al. 2000; Rachowicz 2006, Rohr et al. 2011, Szuroczki and Richardson 2009) are often leading contributors. Infectious diseases are a growing concern for the management or conservation of many wildlife species (Daszak et al. 2000, Fisher et al. 2012, Johnson and Paull 2011). In amphibians, three sources of disease have been identified as contributing to declines or potential demographic impairment: chytrid fungus (Rohr et al. 2011), ranavirus (Gray et al. 2009), and various helminth parasites (Kelehear et al. 2011, Rohr et al 2008, Szuroczki and Richardson 2009). Mass mortality events attributed to ranavirus or chytrid fungus (Batrachochytrium dendrobatidis, abbreviated Bd hereafter) clearly implicate these pathogens as important factors in amphibian declines, but the role of helminths in amphibian population dynamics is less clear. Helminths have been shown to negatively impact a range of individual fitness components in amphibians, however (reviewed in Szuroczki and Richardson 2009, and see Kelehear et al. 2011), and so should not be neglected in disease surveillance. For all known amphibian diseases, outbreaks may be sporadic, with occurrence dependent on specific environmental circumstances, challenging our ability to detect and quantify spatial and temporal patterns. We initiated this project because there is limited knowledge of the amphibian parasite fauna in the north central plains and even less on the prevalence of diseases such as those associated with ranavirus and Bd. Although a comprehensive and geographically-intensive statewide survey

Welcome message from author
This document is posted to help you gain knowledge. Please leave a comment to let me know what you think about it! Share it to your friends and learn new things together.
Transcript

Newman & Tkach SWG Final Report 2015 – ND Amphibian Diseases and Parasites 1
State Wildlife Grant Final Report
submitted to North Dakota Game and Fish Department on Sept. 23, 2015 Robert Newman, Ph.D. University of North Dakota, Department of Biology
Title of Project: Diseases and Parasites of North Dakota Amphibians Award Period: 4/1/2013 - 6/30/2015 Principal Investigators: Dr. Robert Newman1, Dr. Vasyl Tkach, Dept of Biology, Univ of North Dakota
10 Cornell St. STOP 9019, Grand Forks, ND 58202-9019, 1 [email protected], 701-777-4290
Other key personnel: Melanie Firkins, Graduate Research Assistant, Dept of Biology, UND Contributions: RN designed the study, supervised or conducted data analysis, principal report author. VT supervised all aspects of necropsy protocols, parasite identification, and molecular diagnostics of both helminth parasites and microbial pathogens. MF conducted most field collections and necropsies, molecular laboratory procedures, and assisted in data analysis and report preparation. Project Objectives
1. Estimate geographic distribution and prevalence of ranavirus and chytrid fungus infection 2. Estimate distribution and prevalence of helminth parasites infecting amphibian hosts
Background Worldwide reports of declines and extinctions of amphibians have continued for at least two decades (Houlahan et al. 2000, Stuart et al. 2004, Wake and Vredenburg 2008). Although multiple causes are implicated and seemingly disparate factors are likely to interact in complex ways, habitat loss or degradation (Cushman 2006) and infectious diseases (Gray et al. 2009, Patz et al. 2000; Rachowicz 2006, Rohr et al. 2011, Szuroczki and Richardson 2009) are often leading contributors. Infectious diseases are a growing concern for the management or conservation of many wildlife species (Daszak et al. 2000, Fisher et al. 2012, Johnson and Paull 2011). In amphibians, three sources of disease have been identified as contributing to declines or potential demographic impairment: chytrid fungus (Rohr et al. 2011), ranavirus (Gray et al. 2009), and various helminth parasites (Kelehear et al. 2011, Rohr et al 2008, Szuroczki and Richardson 2009). Mass mortality events attributed to ranavirus or chytrid fungus (Batrachochytrium dendrobatidis, abbreviated Bd hereafter) clearly implicate these pathogens as important factors in amphibian declines, but the role of helminths in amphibian population dynamics is less clear. Helminths have been shown to negatively impact a range of individual fitness components in amphibians, however (reviewed in Szuroczki and Richardson 2009, and see Kelehear et al. 2011), and so should not be neglected in disease surveillance. For all known amphibian diseases, outbreaks may be sporadic, with occurrence dependent on specific environmental circumstances, challenging our ability to detect and quantify spatial and temporal patterns.
We initiated this project because there is limited knowledge of the amphibian parasite fauna in the north central plains and even less on the prevalence of diseases such as those associated with ranavirus and Bd. Although a comprehensive and geographically-intensive statewide survey

Newman & Tkach SWG Final Report 2015 – ND Amphibian Diseases and Parasites 2
encompassing the entire suite of amphibian host species would be a massive undertaking, particularly given the temporally variable occurrence of the infectious organisms and heterogeneity in habitat and land use, we proposed a more limited and feasible effort to subsample spatial variability across the state of North Dakota. The basic design calls for stratified sampling by the broadest classification of ecoregions (Bryce et al. 1998), the major stages of the amphibian life cycle (larval/metamorph/adult), for any amphibian species we encounter during the two year period of the project. We entered this project with a developing view of patterns of helminth parasitism in two amphibian species (wood frogs and leopard frogs) derived from more intensive sampling of a limited geographic extent (Sheyenne National Grassland and a landscape in northeastern Nelson County at the eastern edge of the Prairie Pothole Region) (Gustafson et al. 2013, Pulis et al. 2011), but little data on other host species or locations, and only a few observations in North Dakota of ranavirus outbreaks (reported in Green et al. 2002). Study design and methods Our goal was to obtain samples for two years (2013 and 2014) from multiple locations within the four major ecoregions of the state (Red River Valley, Northern Glaciated Plains, Missouri Coteau, and Missouri Plateau and Badlands). We hoped to obtain specimens of all amphibian species, realizing that the more common ones were more likely to be encountered, and that idiosyncratic weather patterns would likely constrain amphibian activity, and consequently detectability and availability for sampling. We further hoped to obtain samples at each of the major life stages, including larvae, which are exposed to any potential infectious agent that is transmitted in water (e.g. trematode cercariae, ranavirus), recent metamorphs, which would have survived any infections they might have been exposed to, or avoided infections entirely, but still might retain nonlethal agents, and adults, which often are infected with non-lethal parasite burdens and may even carry viral particles on the surface of their skin (Gray et al. 2009). Sampling outcome and caveats We collected amphibian specimens in 2013 and 2014, on 3 multi-day trips in 2013 and 8 in 2014 (Figure 1). We prioritized expanded geographic scope over site-specific comprehensive sampling, which is appropriate given our objective of conducting a broad-scale survey. Future, complementary studies, should focus on greater sampling intensity at localized landscapes of particular interest (as we did previously in our helminth surveys on the Sheyenne National Grassland and in our northeastern Nelson County study). For some amphibian species (the ranids, primarily), this approach worked well for obtaining our target sample size per wetland (5 individuals per species), but the tradeoff was smaller than desired sample sizes for less conspicuous or active species (tiger salamanders and the toads). Because we do not have repeat sampling per site, we are unable to estimate detection rates of amphibian species and caution against using our results as the basis for inferring geographic distribution of the amphibian species. In particular, our failure to find a species at a specific location cannot be taken as evidence it does not occur there. Routes were selected to span as much of the state as we could, constrained by availability of accessible wetlands, and encompass as much of the active season as possible. Routes were generally driven east-west and individual trips focused on the southern, central, or northern tiers of the state. Wetlands were selected based on availability (sites with water apparent) and accessibility (proximity to roads that were passable under prevailing conditions) and to ensure a gradient of land use classes were included. We specifically sought out wetlands that were in or adjacent to (in order of most to least
Newman & Tkach SWG Final Report 2015 – ND Amphibian Diseases and Parasites 3
expected human impact) croplands, pasture, grasslands (including hayland, CRP-type land, or anything that resembled currently untilled, ungrazed land), and woodland. We assessed land use on-site and recognize that current land use does not necessarily reflect historical land use, even in the relatively recent past. In other words, our land use classification should only be taken as a practical, first approximation, although it certainly reflects what we observed at the time of collections.
Figure 1. Sampling locations from which amphibians were collected in 2013 and 2014 (combined). Symbols are color-coded by amphibian species and differ in size only to permit overlapping symbols to be visible. Only sites where we collected at least one species are included. Lines on the map demarcate county boundaries or ecoregions, with ecoregions labeled along the lower margin of the map. Ecoregion abbreviations: NWGP = Northwestern Great Plains, MC = Missouri Coteau, NGP = northern glaciated plains, RRV = Red River Valley.
We relied on chance encounters with amphibians while we walked around the perimeter and waded through wetlands. This was the most efficient use of time because it limited the investment needed at individual wetlands and provided more time to visit more sites, although it also is subject to substantial bias in terms of which amphibian species were found. Over the two year period, we collected a total of 705 amphibians of six species (Figure 1, Tables 1 and 2). These include what can be considered the most common species in the state (Hoberg and Gause 1992). The northern leopard frog was the most widespread and frequently encountered species in both years. Tiger salamanders had the smallest overall sample size because we did not use collecting methods specifically for them (e.g., seines) at any wetland locations.

Newman & Tkach SWG Final Report 2015 – ND Amphibian Diseases and Parasites 4
In 2013 the sampling season extended from early June to late August/early September, with several one-day trips interspersed. Despite the delayed start because of cold weather, we were able to obtain a combined 263 specimens of 6 amphibian species from 83 of the 103 sample locations surveyed (Table 1). The majority (70%) of these were recent metamorphs or juvenile (young-of-the-year) because breeding activity had nearly ceased for many species, particularly in the southern portion of the state, before we were able to begin field work. The sample is also strongly skewed to leopard frogs, but for two ecological reasons: it is certainly the most broadly distributed amphibian in the state and it had a strong pulse of recruitment in 2013. In 2014, the first trip occurred in late April and the last was late in September. Again, collecting was delayed well into April because of the extended cold period of late winter/spring, We obtained 442 specimens of 6 species, again with the majority being leopard frogs (Table 2). Because we were able to collect during the breeding period or shortly thereafter, we were able to sample both adults and juveniles. We had limited success in dipnet sampling of larvae, although it is reasonable to assume at least for the digenean helminths (for which the life cycle requires a molluscan (snail) intermediate host and infection occurs in the water) that adults carrying those parasites must have acquired them during aquatic activities (i.e. during the larval stage for juveniles and most likely during breeding for the adult frogs).
Table 1. Amphibian specimens collected during the 2013 field season, 68 different sites.
Amphibian species Adult Juvenile Total
Barred tiger salamander (Ambystoma mavortium ) 6 2 8
Canadian toad (Anaxyrus hemiophrys) 1 8 9
Great Plains toad (Anaxyrus cognatus) 1 6 7
Boreal chorus frog (Pseudacris maculata) 11 5 16
Northern leopard frog (Lithobates pipiens) 54 120 174
Wood frog (Lithobates sylvaticus) 14 35 49
Total 263
Table 2. Amphibian specimens collected during the 2014 field season, 103 different sites.
Amphibian species Adult Juvenile Tadpole Total
Barred tiger salamander (Ambystoma mavortium) 4 2 NA 6
Canadian toad (Anaxyrus hemiophrys) 11 25 0 36
Great Plains toad (Anaxyrus cognatus) 13 8 1 22
Boreal chorus frog (Pseudacris maculata) 81 8 0 89
Northern leopard frog (Lithobates pipiens) 171 54 4 229
Wood frog (Lithobates sylvaticus) 44 16 0 60
Total 442

Newman & Tkach SWG Final Report 2015 – ND Amphibian Diseases and Parasites 5
Sample processing, helminth identification, and microbial pathogen diagnosis Amphibians were collected opportunistically at each site by hand and dip nets. The field protocol from James Cook University was followed to avoid cross-contamination in the field and maintain field hygiene when handling amphibians (Speare et al, 2004). Each individual was assigned a numerical ID for future reference along with a photograph to confirm species identification. All collected animals were transported to the University of North Dakota parasitology lab and necropsied following approved protocols (UND IACUC #1305-2). Internal organs were retained for molecular diagnostics of ranavirus, helminth parasites were identified using morphological and molecular approaches and archived in the UND helminth collection, and all amphibians were swabbed in the field and again prior to necropsy to assay for Bd. Diagnostic tests for ranavirus and chytrid fungus in skin swabs or other tissues were done using published PCR/qPCR protocols (reviewed in Gray et al. 2009 for ranavirus; for Bd assays see Boyle et al. 2004 and Retallick et al. 2006). Briefly, DNA was extracted from amphibian spleen tissue for ranavirus assays and from keratinized tissue (skin swabs) for Bd assays. Positive controls for PCR assays were provided by a synthetic gene block of the major capsid protein of Ambystoma tigrinum virus (ATV) for ranavirus and the Chytrid MGB2 gene for Bd. Positive tests for ranavirus infection were confirmed using fluorescent taqman probes and a subsample was sequenced for further verification. Details of all methods are available upon request and will be included in related published reports. Results Objective 1: Ranavirus and Bd prevalence and distribution Patterns of ranavirus infections among species. We detected ranavirus in 238 out of 668 assayed amphibians, for an overall prevalence of 35.6%, although detections varied significantly among amphibian species (X2 = 47.69, df = 5, p < 0.0001; Table 3). In particular, Anaxyrus cognatus, Anaxyrus hemiophrys, and Pseudacris maculata had higher prevalence than other species. Lithobates pipiens had the lowest prevalence of ranavirus among species with sample size for statistical testing. Table 3. Ranavirus detections in amphibian tissues collected in 2013 – 2014.
Amphibian species Assay sample size Overall Prevalence (%)
Barred tiger salamander (Ambystoma mavortium) 14 21.4
Great Plains toad (Anaxyrus cognatus) 29 58.6
Canadian toad (Anaxyrus hemiophrys) 45 57.8
Northern leopard frog (Lithobates pipiens) 367 26.1
Wood frog (Lithobates sylvaticus) 109 36.6
Boreal chorus frog (Pseudacris maculata) 103 54.3

Newman & Tkach SWG Final Report 2015 – ND Amphibian Diseases and Parasites 6
Geographic patterns. Ranavirus was detected in at least one amphibian specimen at 55.6% of sample locations (Fig. 2, Table 4). Pooling among all amphibian species, ranavirus was found at significantly more sites (traditional geographic occupancy) in the Missouri Coteau ecoregion than other areas.
a. N sites where indicated parasite was found in each ecoregion. See Table 7 for full names of helminth taxa.
Ecoregion (N sites)
N amphib specimens Ranavirus Chytrid (Bd) Alaria Echino Rhabdias Haem Glypth
NWGP (19) 87 7 2 15 10 0 7 5
NGP (79) 317 37 3 47 33 14 27 19
MC (43) 140 33 1 24 19 4 12 12
RRV (29) 160 18 0 16 17 11 13 10
total (170) 704 95 6 102 79 29 59 46
chi2 (3 df) 13.46 n.a. 3.45 2.80 14.69 2.24 1.19
p (exact, 2-sided) 0.0037 n.a. 0.34 0.42 0.0022 0.53 0.76
b. Percent of sites (occupancy) where parasite was detected in each ecoregion
NWGP 36.8 1.2 78.9 52.6 0.0 36.8 26.3
NGP 46.8 1.8 59.5 41.8 17.7 34.2 24.1
MC 76.7 2.3 55.8 44.2 9.3 27.9 27.9
RRV 62.1 0.0 62.1 62.1 62.1 62.1 62.1
total 55.9 0.035 60.0 46.5 17.1 34.7 27.1
Figure 2. Geographic occurrence of ranavirus infections across all amphibian species. Green circles represent infected amphibians, open circled “X”s indicate amphibian specimens testing negative. Lines illustrate county boundaries and ecoregions as in Figure 1 (from west to east: NWGP, MC, NGP, RRV).
Table 4. Number and percentage of sites where microbial pathogens and common helminth parasites were found in a least one amphibian specimen of any species. Ecoregion abbreviations are noted in Figure 1.

Newman & Tkach SWG Final Report 2015 – ND Amphibian Diseases and Parasites 7
Pooling among all amphibian species, ranavirus prevalence (“occupancy” in individual hosts) also varied significantly across ecoregions (X2= 39.00, d f= 3, p < 0.0001), with higher prevalence in the Missouri Coteau (52.6%)and Red River Valley (44.6%) than in the Drift Plains (Northern Glaciated Plains) (29.2%) or NW Great Plains (17.6%) ecoregions (Figure 3). Because species were not equally represented in our sampling and there is a possibility of unequal susceptibility to infection, we also tested geographic patterns separately for the two species with largest sample size and broadest geographic sampling distribution. Infection rates still varied significantly across ecoregions for both leopard frogs (X2 = 44.9, p < 0.0001) and chorus frogs (X2 = 9.1, p < 0.028; Fig. 3).
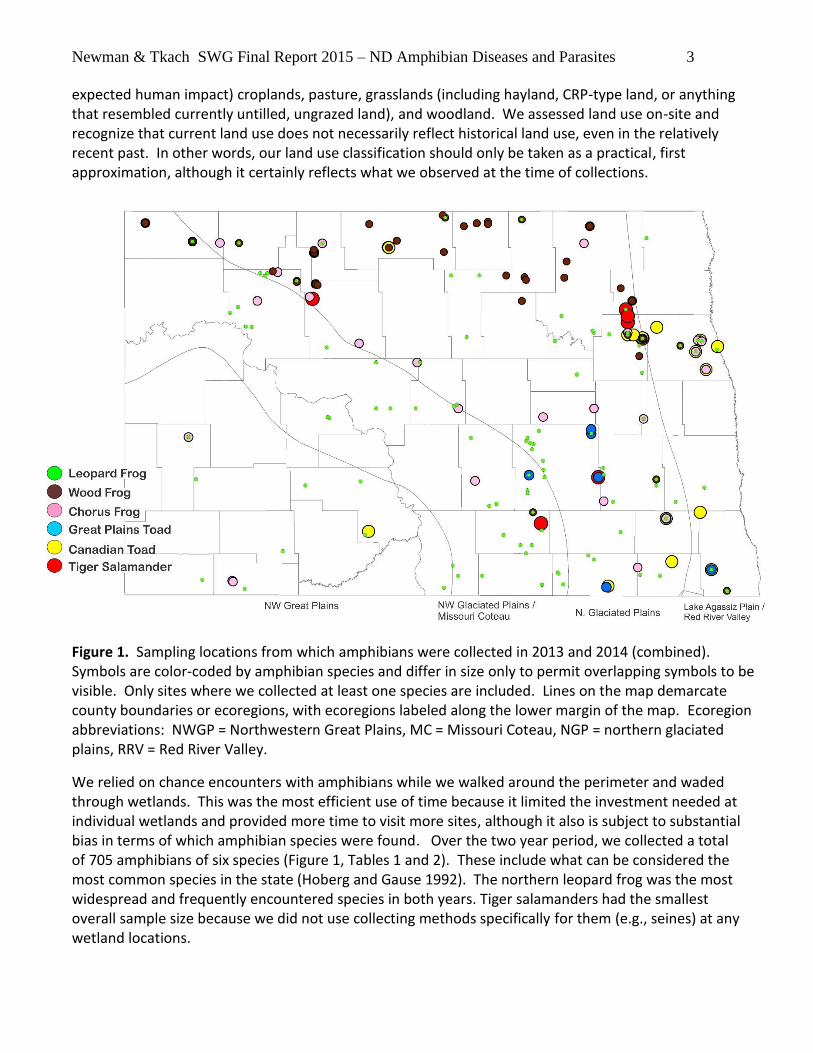
In addition to broad-scale patterns across the state that might be driven by broad differences in climate, landscape or correlated ecological or habitat differences (including land use, wetland distribution and dynamics, differences in biotic communities, etc), we also tested for purely spatial effects that might be caused by demographic linkages among sites that might affect disease transmission rates. Such linkages might be caused by amphibian movement / dispersal behavior or movement among sites by organisms serving as vectors of disease. Finer-scale spatial dependency (i.e. statistical non-independence) was detected in analysis of spatial autocorrelation among wetlands closer than about 40 km, but not at greater distances (Figure 4), indicating a moderately patchy distribution of ranavirus infections on this scale.
Figure 3. Ranavirus prevalence by species and ecoregion. Numbers above each bar indicates sample size.
Newman & Tkach SWG Final Report 2015 – ND Amphibian Diseases and Parasites 8
Patterns by land use. Pooling across amphibian species, ranavirus prevalence appeared to vary significantly among locations in relation to predominant land use (X2 = 8.63, df = 3, p = 0.035; Fig. 5). Over all amphibian species, prevalence was 39.2% in cropland, 30.6% in pasture, 26.2% in grassland, and 39.2% in woodland. However, for the Northern leopard frog (Lithobates pipiens) and boreal chorus frog (Pseudacris maculata) infection rates did not differ significantly among land use categories (X2 = 3.33, df = 2, p = 0.19 for leopard frog infections, and X2 = 4.36, df = 2, p = 0.11 for chorus frog infections. Woodland sites were excluded from analyses because of low sample size for these species).
Figure 4. Spatial autocorrelation among sites separated by indicated distance (lag) classes, for ranavirus presence/absence across all amphibian species. Moran’s I (blue) was used as the measure of autocorrelation; 95% confidence envelope is illustrated in red (dashed lines). N= 171 sites.

Newman & Tkach SWG Final Report 2015 – ND Amphibian Diseases and Parasites 9
Statistical modeling of ranavirus occurrence Although we have limited information about conditions at each site, in this final phase of analysis we constructed regression models to test how well the information available could predict ranavirus occurrence (presence-absence) at sites. In addition to the factors ecoregion (4 categories) and land use (4 categories), we also included wetland area and length, both derived from National Wetlands Inventory records, two GIS-derived indices of wetland density (percent wetland coverage in 250 m and 500 m buffers around sample sites, or number of wetlands within 250 m and 500 m buffers around sample sites; 250m buffer variables were highly correlated with comparable variables at a 500 m scale and we used one or the other, but not both, in regressions), and purely spatial variables derived from principal coordinates of inter-site distance matrices (distance-based Moran’s eigenvector maps, Legendre and Legendre 2012). We used ArcGIS version 10.2 (ESRI 2014) for GIS methods and Program SAM (Rangel et al. 2010) for estimation of spatial variables. Spatial variables were retained for inclusion in further analyses if they exhibited a statistical supported relationship with the response variable (ranavirus presence/absence in this case). In the present analysis we used the default setting of a minimum separation between sites of 90 km for derivation of spatial variables, but this precludes incorporation of finer-scale patterning. At a fine spatial scale, proximity was assessed using the previously mentioned GIS-derived neighborhood variables. For ranavirus occurrence, we retained two spatial variables, SF1, which describes a broad-scale, roughly “saddle-shaped” contrast between eastern plus southwestern North Dakota versus southeastern plus northwestern North Dakota, and SF6, which describes a simpler gradient from northeastern to southwestern North Dakota (Figure 6). To clarify the interpretation of these spatial patterning variables, if a response variable of interest, such as ranavirus occurrence, corresponds to a purely spatial variable (which are derived solely from map coordinates of sample sites and hence their spatial arrangement, then that response variable must exhibit some degree of parallelism in its spatial pattern. In other words, if ranavirus occupancy is correlated with SF6, then it must be high (or low) in
Figure 5. Ranavirus prevalence by species and land use category. Numbers indicate sample size

Newman & Tkach SWG Final Report 2015 – ND Amphibian Diseases and Parasites 10
the northeastern corner of the state and trend in the opposite direction in sample locations progressively south and west. The pattern is clearly more complex for SF1, but testing for associations with spatial variables derived by this method permits discovery of spatial patterns more complex than simple east-west or north-south trends, as would be the case if latitude and longitude were used as predictor variables. Borcard et al. (2004) provide a more detailed explanation of an earlier version of this method.
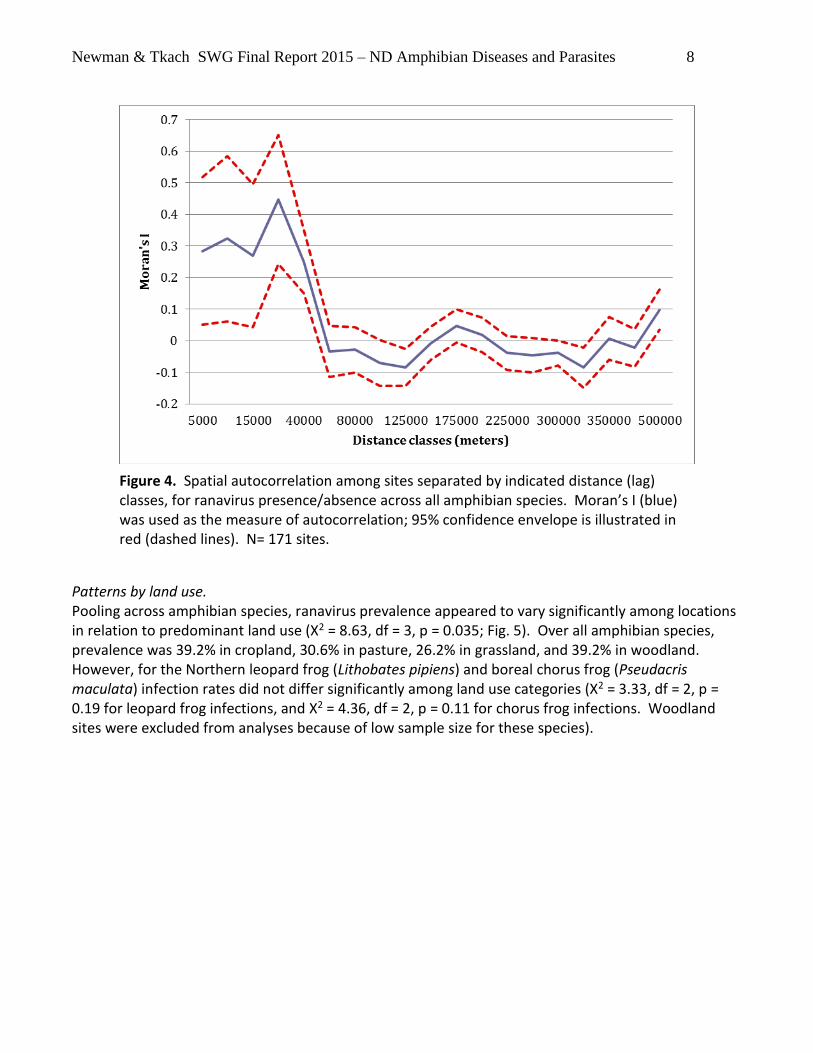
We used logistic regression on ranavirus presence/absence across all amphibian species (n = 171 sites). Model selection was based on a best subsets approach (Hosmer and Lemeshow 2000), with AICc as the criterion for comparing models (Burnham and Anderson 2002). All analyses were conducted using Program R version 3+ and the multimodel inference package MuMIn. The full model (AICc = 226.6) that included two of the spatial variables, ecoregion, land use, the number of wetlands within 500m and the percent wetland coverage within 250 m provided some resolution to ranavirus occurrence, but considerable variation was not accounted for (comparing null and residual deviances in Table 5). The single best model (AICc = 219.4) included the two spatial variables and ecoregion. The ecoregion effect was driven largely by differences between Missouri Coteau sites and other sites. Ecoregion effects are consistent with those identified above in the direct comparisons of prevalence (Figure 3). The spatial variables also conform to corresponding pattern of geographic differences, although because of the way we estimated the spatial variables we did not detect the smaller scale effect seen in analysis of spatial autocorrelation. A more refined set of spatial variables might detect a pattern at a scale corresponding to the under 30-40 km separation. Even in the regression models, though, there was a suggestion of a fine-scale spatial effect: percent wetland coverage in 250 m (or 500 m) buffers around sites was included in 1 of the top 3 models with delta AICc < 2 (hence the non-zero importance value of PcWet250 in multimodel results, Table 5).
Figure 6. Spatial variables SF1 (left) and SF6 (right) derived from coordinates of sample locations. See text for explanation.
Newman & Tkach SWG Final Report 2015 – ND Amphibian Diseases and Parasites 11
Table 5. Logistic regression of ranavirus occurrence in all amphibian specimens
Variable parameter estimate
standard error
p AICc Importance
(AICc < 2)
Full Model [deviance: null = 229.3 (166 df), residual =202.6 (153 df)]
226.6 3 models
(Intercept) -0.595 0.595 0.317
SF1 -4.95 2.28 0.0301 1
SF6 4.45 2.38 0.0561 0.79
Ecoregion[DP] 0.168 0.598 0.7782
Ecoregion[MC] 1.57 0.657 0.017 1
Ecoregion[RRV] 1.12 0.666 0.0923
land_use[GR] -0.191 0.427 0.6555
land_use[PAST] 0.403 0.692 0.5605
land_use[WD] 0.610 0.701 0.3842
Nwetlands500 -0.00185 0.0161 0.9083
PcWet250 1.56 1.23 0.2024 0.31
Best Subset [deviance: null = 229.3 (166 df), residual =206.9 (161 df)]
219.4
(Intercept) -0.362 0.489 0.4593
SF1 -4.817 2.245 0.0319
SF6 4.352 2.311 0.0597
Ecoregion[T.DP] 0.157 0.545 0.773
Ecoregion[T.MC] 1.515 0.612 0.0133
Ecoregion[T.RRV] 0.966 0.626 0.1224
Ranavirus summary We detected an unexpectedly high prevalence of ranavirus in internal organ tissues, demonstrating both that ranavirus infection is not uncommon in the amphibian fauna of North Dakota and that it is geographically widespread. Infected animals were somewhat more common in the Missouri Coteau than other areas, followed by sites in the Red River Valley. The cause of differences in infection risk are not known; there are a variety of factors that might differ geographically across the state, and our study was not designed to reveal underlying causation. More intensive work tracking infections and infection rates would be required to identify the roles of specific factors. One common pattern that was evident, though, was that wetlands inhabited by infected animals occurred in a patchy spatial manner at a scale under ~40 km. It is reasonable to infer that if an infection becomes established at a site, additional transmission is likely to be more likely to nearby sites than to more distant sites. It should be noted that adult frogs and toads with evident infections do not appear to be diseased. Diseased animals probably suffer high mortality rates and disappear quickly, challenging our ability to detect already difficult to detect species. Moreover, adults may be carriers and sources of

Newman & Tkach SWG Final Report 2015 – ND Amphibian Diseases and Parasites 12
transmission among sites, with little impact on their health (Gray et al. 2009). Mortality rates are much higher during the larval stage, however. Clearly, if environmental circumstances lead to outbreak conditions (cool temperatures, crowded wetlands, such as might occur as wetlands dry during the summer, Green et al. 2002), vulnerable life stages such as larvae may immediately be exposed and susceptible to infection, which in turn may trigger mass mortality events. In other words, factors that cause wetlands to dry or augmented rates of transmission (via natural or human activities) at any spatial scale will lead to a notable risk of recruitment failure. Most importantly, ranavirus is already present across the state and, although not ubiquitous, it would not need to travel far to arrive at any particular location. Management implications of ranavirus survey Because ranavirus is a well-established cause of mass mortality and recruitment failure in amphibian populations (Miller et al. 2011, Price et al. 2014), it is the most obvious candidate for disease surveillance, particularly when coupled to routine amphibian monitoring. As far as we know, North Dakota does not have a routine, standardized amphibian monitoring program at this time, but even a modest monitoring program at select sites would be useful and provide a starting point for surveillance. This becomes particularly important in the face of climate change and other environmental perturbations that might alter local habitats in such a way that exposes animals to localized stressors, or alters demographic connectivity among amphibian populations or movement patterns of potential disease carriers. Furthermore, other ectotherms (reptiles and fishes) are also susceptible to ranaviruses (Gray and Chinchar 2015) and monitoring programs for amphibians would also provide useful information for those taxa. Prevalence and distribution of Bd detections In contrast with the widespread occurrence of ranavirus, Bd was detected only in 5 leopard frog specimens out of the 705 amphibians tested (overall prevalence < .01). Consequently we can only say that it appears to be extremely infrequent in the species and sites we sampled. The Bd infections were primarily found near central North Dakota. In particular, one infected northern leopard frog was found southwest of Carrington, North Dakota, two other were found towards the west side of central North Dakota south of Lake Sakakawea, the fourth was towards the central east side of North Dakota north of Cleveland, North Dakota and the last was north of Woodworth, North Dakota. Based on low prevalence, we suggest continued surveillance (sampling and testing) as a component of amphibian population monitoring, but at a lower intensity than ranavirus sampling and testing.

Newman & Tkach SWG Final Report 2015 – ND Amphibian Diseases and Parasites 13
Objective 2: Helminth prevalence and distribution Helminth diversity At the broadest taxonomic level (Phylum and Class), 60.3% of all amphibians were infected with digenean flukes (Phylum Platyhelminthes, Class Trematoda), 17% with nematodes (roundworms, Phylum Nematoda), and 2.8% with tapeworms (Phylum Platyhelminthes, Class Cestoidea). Amphibian species largely exhibited a parallel structure to their helminth parasite communities at this taxonomic level (Table 6; higher prevalence of digeneans, followed by nematodes, and lowest for cestodes). Broadly speaking, the few tiger salamanders in our sample lacked flukes but had a high prevalence of intestinal nematodes, as well as cestodes (tapeworms). Both groups are dietary in their sources. The two toad species and wood frogs, all of whom are largely terrestrial except during breeding, also tended to carry some nematodes, although these were lungworms (Rhabdias sp.). Rhabdias infects terrestrial stages of amphibians, but by direct penetration through the skin. All of the anuran species carried some species of flukes, which infect larvae or adults during aquatic phases of life (tadpoles are strictly aquatic and adults return to water to breed). Table 6. Prevalence of helminth parasites at the broadest taxonomic level in amphibian host species.
Amphibian species (sample size, N)
Digenea Prevalence (%)
Nematoda Prevalence (%)
Cestoda Prevalence (%)
Tiger salamanders (N=14) 0 71.4 14.3
Great Plains toads (N=29) 58.6 34.5 20.7
Canadian toads (N=45) 42.2 22.2 22.2
Northern leopard frogs (N=402) 63.2 13.2 0.5
Wood frogs (N=109) 67.9 35.8 0
Boreal chorus frogs (N=106) 61.3 0.01 0
A more taxonomically refined compilation of the helminth community across all amphibian species for common helminth genera provides these estimates of prevalence for helminth taxa: 29.2% for Alaria, 23.3% for Echinoparyphium, 13.3% for Haematoloechus, 11.2% for Glypthelmines, 7.7% for Cosmocercoides and 8.2% for Rhabdias. Uncommon helminths with less than 2.5% prevalence included Cephalogonimus americanus, Megalodiscus sp., Apharyngostrigea pipientis, Lechriorchis tygarti, Diplostomatidae sp, Telorchis sp, Mesocestoides sp., Oswaldocruzia spp, Eustrongylides sp., Spirurida sp., and Spiroxys sp.. Table 7 provides a more detailed breakdown of helminth taxa by amphibian species.

Newman & Tkach SWG Final Report 2015 – ND Amphibian Diseases and Parasites 14
Table 7. Prevalence of helminth parasites in amphibian host species. N is the number of specimens of each amphibian species. In some instances we have more precise helminth identification, but only list a genus here, typically because only one species is found in each amphibian species. For Rhabdias we identify specific host associations (x).
Tiger
salamander
(N=14)
Great
Plains
toad
(N=29)
Canadian
toad
(N=45)
Northern
leopard
frog
(N=402)
Wood
frog
(N=109)
Boreal
chorus
frog
(N=106)
Nematoda
Cosmocercoides
variabilis
35.7 6.9 4.4 7.2 11.9 0
Eustrongylides sp. 0 0 0 0.25 0 0
Oswaldocruzia spp. 0 6.9 6.7 2.2 5.5 0
unidentified
Nematode sp.
7.1 0 0 0 0 0
Rhabdias sp.
americanus
bakeri
ranae
0 20.7
x
15.6
x
4.2
x
25.7
x
0
Spirurida sp. 0 3.4 0 0 0 0
Spiroxys sp. 28.6 0 0 0 0 0.9
Digenea
Alaria spp. 0 20.7 13.3 37.8 23 16
Apharyngostrigea
pipientis
0 0 0 1.5 3.7 0
Cephalogonimus
americanus
0 0 0 0.1 0 0.9
Diplostomatidae 0 0 0 2.2 0 0
Echinoparyphium
rubrum
0 13.8 20 17 44 33
Glypthelmines
pennsylvaniensis
0 10.3 4.4 5.7 7.3 40.5
Haematoloechus spp. 0 17.2 6.7 18.4 11 0
Lechriorchis tygarti 0 0 0 1.2 1.8 0
Megalodiscus sp. 0 0 0 1.2 0 0
Telorchis sp. 0 3.4 0 0 0 0
Cestoda
Mesocestoides sp.
0 3.4 0 0.25 0 0
Proteocephalidea sp. 14.3 17.2 22.2 0.25 0 0

Newman & Tkach SWG Final Report 2015 – ND Amphibian Diseases and Parasites 15
Patterns of infection in individual hosts Helminth species richness ranged from 0 to 5 taxa per individual host and varied little among host species (Fig. 7). Alaria was the most prevalent of the identified trematodes in our sample (Table 7). The lungworm Rhabdias was the most common nematode, as is often the case. All anuran species harbored some form of trematode (often yet to be identified metacercariae) and some nematode.
Figure 7. Minimum number of helminth taxa found in each host individual, reported separately for each amphibian species. E.g., the dark blue bars illustrate the number of leopard frogs with 0 – 5 helminth taxa per frog. More than half of leopard frogs were infected with at least one helminth species (note that this does not quantify infection intensity, or the number of individual parasites found within the frog). The mean number of helminth taxa per host individual is given in the legend.
Figure 8. Prevalence of the four most common digeneans found in amphibians, pooling all amphibian species, broken down by ecoregion. “Badlands” here refers to sites in ecoregion NWGP and Drift Plains refers to sites in ecoregion NGP.
Newman & Tkach SWG Final Report 2015 – ND Amphibian Diseases and Parasites 16
Geographic patterns of helminth infections
Helminth parasites were found in frogs in all ecoregions (Figure 8). For the helminth taxa that occurred frequently enough to provide sufficient sample size for statistical inference (the digeneans Alaria, Echinoparyphium, Glypthelmines, Haematoloechus, and the lung nematode, Rhabdias), there was no evidence that prevalence varied among ecoregions for any but Rhabdias, which had significantly greater prevalence in the RRV compared to elsewhere (Table 4).
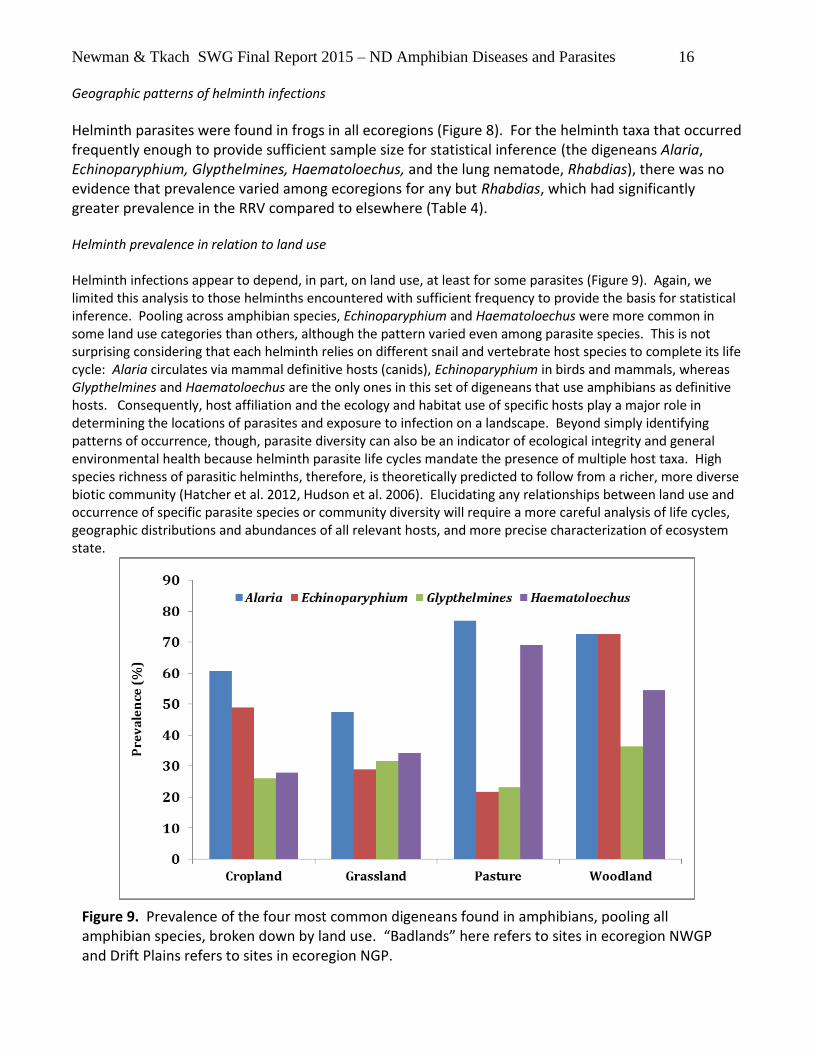
Helminth prevalence in relation to land use Helminth infections appear to depend, in part, on land use, at least for some parasites (Figure 9). Again, we limited this analysis to those helminths encountered with sufficient frequency to provide the basis for statistical inference. Pooling across amphibian species, Echinoparyphium and Haematoloechus were more common in some land use categories than others, although the pattern varied even among parasite species. This is not surprising considering that each helminth relies on different snail and vertebrate host species to complete its life cycle: Alaria circulates via mammal definitive hosts (canids), Echinoparyphium in birds and mammals, whereas Glypthelmines and Haematoloechus are the only ones in this set of digeneans that use amphibians as definitive hosts. Consequently, host affiliation and the ecology and habitat use of specific hosts play a major role in determining the locations of parasites and exposure to infection on a landscape. Beyond simply identifying patterns of occurrence, though, parasite diversity can also be an indicator of ecological integrity and general environmental health because helminth parasite life cycles mandate the presence of multiple host taxa. High species richness of parasitic helminths, therefore, is theoretically predicted to follow from a richer, more diverse biotic community (Hatcher et al. 2012, Hudson et al. 2006). Elucidating any relationships between land use and occurrence of specific parasite species or community diversity will require a more careful analysis of life cycles, geographic distributions and abundances of all relevant hosts, and more precise characterization of ecosystem state.
Figure 9. Prevalence of the four most common digeneans found in amphibians, pooling all amphibian species, broken down by land use. “Badlands” here refers to sites in ecoregion NWGP and Drift Plains refers to sites in ecoregion NGP.

Newman & Tkach SWG Final Report 2015 – ND Amphibian Diseases and Parasites 17
Summary of parasite survey
We believe that additional sampling of parasite communities can provide important insights into biotic
communities that encompass more than just the parasites themselves, for the reasons just noted.
Parasite surveys can provide a relatively inexpensive method to index ecosystem integrity. Impacts on
amphibian health are more difficult to detect. Some species have clearly been found to impair some
aspect of host health, even if they do not immediately or directly cause mortality. This list includes at
least the echinostomes (Echinoparyphium) that infect host kidneys, and the two taxa that infect host
lungs (the lung fluke Haematoloechus and the lung nematode Rhabdias) (Kelehear et al. 2011,
Koprivnikar et al. 2006, Szuroczki and Richardson 2009). Moreover, infection risk may be amplified by
exposure to a variety of environmental stressors , some of which are likely or certain to be
encountered on agricultural landscapes (Gendron et al, 2003, King et al. 2007, Koprivnikar et al. 2006).
Consequently, parasite surveys can provide useful information about factors that might influence
amphibian demography and distribution.
Literature Cited: Borcard D, Legendre P, Avois-Jacquet, and Tuomisto H. 2004. Dissecting the spatial structure of
ecological data at multiple scales. Ecology 85: 1826-1832.
Boyle DG, Boyle DB, Olsen V et al. 2004. Rapid quantitative detection of chytridiomycosis (Batrachochytrium dendrobatidis) in amphibian samples using real-time Taqman PCR assay. Diseases of Aquatic Organisms 60: 141-148.
Bryce S, Omernik JM, Pater DE et al. 1998. Ecoregions of North Dakota and South Dakota. Jamestown, ND: Northern Prairie Wildlife Research Center Online. http://www.npwrc.usgs.gov/resource/habitat/ndsdeco/index.htm (Version 30NOV1998).
Burnham KP and Anderson DR. 2002. Model selection and multimodel inference: A Practical Information-Theoretic Approach. 2nd ed. Springer, New York.
Cushman, SA. 2006. Effects of habitat loss and fragmentation on amphibians: A review and prospectus. Biological Conservation 128, (2): 231-240
Daszak P, Cunningham AA, and Hyatt AD. 2000. Emerging infectious diseases of wildlife – threats to biodiversity and human health. Science 287: 443-449.
Fisher MC, Henk DA, Briggs CJ et al. 2012. Emerging fungal threats to animal, plant and ecosystem health. Nature 484: 186-194.
Forson DD and Storfer A. 2006. Atrazine increases ranavirus susceptibility in the tiger salamander, Ambystoma tigrinum. Ecological Applications 16: 2325-2332.
Gendron AD, Marcogliese DJ, Barbeau S, Christin MS, Brousseau P, Ruby S, Cyr D, Fournier M. 2003.
Exposure of leopard frogs to a pesticide mixture affects life history characteristics of the lungworm Rhabdias ranae. Oecologia, 135: 469-476.

Newman & Tkach SWG Final Report 2015 – ND Amphibian Diseases and Parasites 18
Gray MG and Chinchar VG. (eds.) 2015. Ranaviruses: Lethal Pathogens of Ectothermic Vertebrates. Spring Open DOI 10.1007/978-3-319-13755-1.
Gray MJ, Miller DL, and Hoverman JT. 2009. Ecology and pathology of amphibian ranaviruses.
Diseases of Aquatic Organisms 87: 243-266. Green DE, Converse KA, Schrader AK. 2002. Epizootiology of sixty-four amphibian morbidity and
mortality events in the USA, 1996-2001. Annals of the New York Academy of Sciences 969: 323-339.
Gustafson KD, Newman RA and Tkach VV. 2013. Effects of Host Species and Life Stage on the Helminth Communities of Sympatric Northern Leopard Frogs (Lithobates pipiens) and Wood Frogs (Lithobates sylvaticus) in the Sheyenne National Grasslands, North Dakota. Journal of Parasitology 99: 587-594.
Hatcher MJ, Dick JTA, and Dunn AM. 2012. Diverse effects of parasites in ecosystems: linking
interdependent processes. Frontiers in Ecology and the Environment 10: 186-194. Hoberg T and Gause C. 1992. Reptiles and amphibians of North Dakota. North Dakota Outdoors 55(1):
7-18. Hosmer DW and Lemeshow S. Applied Logistic Regression, 2nd ed. Wiley, New York. Houlahan JE, Fidlay CS, Schmidt BR, Meyer AH, and Kuzmin SL. 2000. Quantitative evidence for global
amphibian population declines. Nature 404: 752-755. Hudson PJ, Dobson AP and Lafferty KD. 2006. Is a healthy ecosystem one that is rich in parasites?
Trends in Ecology and Evolution 21: 381-385. Johnson PTJ, Paull SH. 2011. The ecology and emergence of diseases in fresh waters. Freshwater
Biology 56: 638-657. Kelehear C, Brown GP, Shine R. 2011. Influence of lung parasites on the growth rates of free-ranging
and captive adult cane toads. Oecologia 165: 585-592.
King KC, McLaughlin JD, Gendron AD, Pauli BD, Giroux I, Rondeau B, Boily M, Juneau P, and Marcogliese DJ. 2007. Impacts of agriculture on the parasite communities of northern leopard frogs (Rana pipens) in southern Quebec, Canada. Parasitology Vol. 134: 2063-2080.
Koprivnikar J, Forbes MR and Baker RL. 2006. Effects of atrazine on cercarial longevity, activity, and infectivity. Journal of Parasitology 92, 306–311.
Legendre P and Legendre L. 2012. Numerical Ecology, 3rd ed. Elsevier, Amsterdam.
Miller D, Gray M and Storfer A. 2011. Viruses 3: 2351-2373.
Patz JA, Graczyk TK, Geller N and Vittor AY. 2000. Effects of environmental change on emerging parasitic diseases. International Journal for Parasitology 30: 1395-1405.

Newman & Tkach SWG Final Report 2015 – ND Amphibian Diseases and Parasites 19
Price SJ, Garner TWJ, Nichols RA et al. 2014. Collapse of amphibian communities due to introduced Ranavirus. Current Biology 24: 1-6.
Pulis EE, Tkach VV and Newman RA. 2011. Helminth parasites of the wood frog, Lithobates sylvaticus, in Prairie Pothole wetlands of the northern Great Plains. Wetlands 31: 675-685.
Rachowicz LJ, Knapp RA, Morgan JAT et al. 2006. Emerging infectious disease as a proximate cause of amphibian mass mortality. Ecology 87: 1671-1683
Rangel TF, Diniz-Filho JAF, and Bini LM. 2010. SAM: a comprehensive application for spatial analysis in Macroecology. Ecography 33: 46-50.
Retallick RWR, Miera V, Richards KL et al. 2006. A non-lethal technique for detecting the chytrid fungus Batrachochytrium dendrobatidis on tadpoles. Diseases of Aquatic Organisms 72: 77-85.
Rohr JR, Schotthoefer AM, Raffel TR, Carrick HJ, Halstead N, et al. 2008. Agrochemicals increase trematodes infections in a declining amphibian species. Nature 455: 1235-1240.
Rohr JR, Halstead NT, and Raffel TR. 2011. Modelling the future distribution of the amphibian chytrid fungus: the influence of climate and human-associated factors. Journal of Applied Ecology 48: 174-176.
Speare R, Berger L, Skerratt LF et al. 2004. Hygiene protocol for handling amphibians in field studies. Amphibian Diseases Group, James Cook University, online document. http://www.jcu.edu.au/school/phtm/PHTM/frogs/field-hygiene.pdf
Stuart SN, Chanson JS, Cox NA, Young BE, Rodrigues ASL, Fischman DL, and Waller RW. 2004. Status
and trends of amphibian declines and extinctions worldwide. Science 306: 1783 – 1786.
Szuroczki D and Richardson JML. 2009. The role of trematodes parasites in larval anuran communities: an aquatic ecologist’s guide to the major players. Oecologia 161: 371-385.
Wake DB and Vredenburg VT. 2008. Are we in the midst of the sixth mass extinction? A view from the world of amphibians. Proceedings of the National Academy of Science 105: 11466-11473.
Related Documents