New Zealand Bank Vulnerabilities in International Perspective Ray Brooks and Rodrigo Cubero WP/09/224

Welcome message from author
This document is posted to help you gain knowledge. Please leave a comment to let me know what you think about it! Share it to your friends and learn new things together.
Transcript

New Zealand Bank Vulnerabilities in International Perspective
Ray Brooks and Rodrigo Cubero
WP/09/224

© 2009 International Monetary Fund WP/09/224 IMF Working Paper Asia and Pacific Department
New Zealand Bank Vulnerabilities in International Perspective
Prepared by Ray Brooks and Rodrigo Cubero1
Authorized for distribution by Mahmood Pradhan
October 2009
Abstract
This Working Paper should not be reported as representing the views of the IMF. The views expressed in this Working Paper are those of the authors and do not necessarily represent those of the IMF or IMF policy. Working Papers describe research in progress by the authors and are published to elicit comments and to further debate.
The global financial crisis is creating stress on banking systems across the world through funding and asset quality shocks. This paper combines different stress scenarios, as well as cross-country analysis, to assess New Zealand bank vulnerabilities to the global crisis and the domestic recession. It finds that a sharp worsening of asset quality would be required to reduce bank capital below the regulatory minimum. On the funding side, a disruption to banks’ offshore funding may put pressure on the exchange rate, but would not trigger a systemic liquidity problem. JEL Classification Numbers: G21, G28, E44, F32 Keywords: New Zealand, bank funding, bank asset quality, stress tests Author’s E-Mail Address: [email protected]; [email protected]
1 We would like to thank Jim Gordon, David Hargreaves, Ian Harrison, Mizuho Kida, John Kiff, Li Lian Ong, Michael Reddell, Elod Takats, Alexander Tieman, and seminar participants at the IMF and the Reserve Bank of New Zealand for helpful comments and suggestions, as well as Kessia De Leo, Khoi Nguyen, and Ranee Sirihorachai for very able research assistance. All remaining errors are ours.
2
Contents Page I. Introduction........................................................................................................................3 II. The Global Turmoil: How Has it Affected New Zealand Banks?.....................................4 III. Can Banks Handle an Increase in Mortgage Defaults? .....................................................7 IV. How Vulnerable are Banks to Higher Defaults on Corporate Lending? .........................12 V. What are the Risks Related to Banks’ Wholesale Funding?............................................15 Tables 1. New Zealand’s Four Large Banks: Selected Financial Soundness Indicators...................5 2. Financial Soundness Indicators of the Banking Sector......................................................6 3. Housing Market Risk: Stress Tests Results, December 2008............................................9 4. Owner-Occupied Mortgages by Risk Bucket ..................................................................10 5. Numerical Example of Mortgage Default Probabilities ..................................................11 6. Corporate Sector Indicators .............................................................................................13 7. New Zealand’s Credit Risk Exposure by Asset Class, December 2008..........................15 8. Balance of Payments Financing.......................................................................................19 9. Funding Structure.............................................................................................................21 Figures 1. Bank Asset Quality ............................................................................................................6 2. Mortgage Interest Rates .....................................................................................................6 3. Overall Credit Growth .......................................................................................................7 4. Bank Asset by Type ...........................................................................................................8 5. Household Debt .................................................................................................................8 6a. Business and Agriculture Credit Growth.........................................................................12 6b. Credit to GDP Ratio.........................................................................................................12 7. Overdue Debts and Liquidations .....................................................................................13 8a. Net Capital Inflows ..........................................................................................................16 8b. Net Foreign Liabilities .....................................................................................................16 8c. Bank Borrowing Offshore................................................................................................16 8d. Bank’s Share of Funding from Nonresidents...................................................................16 9a. Debt by Residual Maturity...............................................................................................16 9b. Local Currency External Debt as Share of Total External Debt......................................16 10. Average 5-Year CDS Spread on Four Major Australasian Banks...................................17 11. Funding Costs for Banks and New Mortgage Rates........................................................17 12. Loan-to-Deposit Ratio for the Banking System...............................................................17 Appendix......................................................................................................................................22 References....................................................................................................................................26
3
I. INTRODUCTION
Global events over the past two years have shown the extent to which banks’ balance sheet problems can interact with a real recession through several negative feedback loops, with the potential to put an economy on a downward spiral (IMF, 2008 and 2009). To break that spiral, or prevent it from starting, it is crucial to assess the strength of banks’ financial position to funding or asset quality shocks. This paper combines different stress scenarios, as well as cross-country evidence, to assess banking system vulnerabilities in the case of New Zealand.
New Zealand’s banks have weathered the global financial storm relatively well thus far. Banks remain profitable, with low levels of impaired assets, and aggregate capital well above the regulatory minimum. However, they are vulnerable on two fronts. They are heavily exposed to households, whose debt has risen significantly and whose assets have been hit by a slump in house and equity prices. In addition, banks are reliant on short-term wholesale funding from offshore markets that have been disrupted since the collapse of Lehman Brothers in September 2008.
The paper finds that a sharp worsening of asset quality would be needed to reduce bank capital below the regulatory minimum. An increase in the default rate from less than 1 percent at present to 6–8 percent for all loans would be required to reduce bank capital below 8 percent of risk-weighted assets. While such a large increase in defaults is unlikely, the risks of such an outcome have jumped in the past year as the outlook for global and local economies has worsened. Therefore, banks should be required to undertake extreme stress tests and increase their capital if needed.
Banks would have access to domestic liquidity from the Reserve Bank of New Zealand (RBNZ) in the event of a disruption to capital inflows, but the balance of payments and exchange rate may come under pressure. The paper notes that use of some official reserves, borrowing from Australian parent banks, and tapping some of the Reserve Bank of New Zealand’s swap line with the U.S. Federal Reserve could fill the financing gap if up to two-fifths of external debt in 2009 were not rolled over. The government’s wholesale funding guarantee scheme, introduced in November 2008, should help banks roll over their funding and lessen the possibility of a more severe disruption.
The paper is structured as follows. The next section provides an overview of the current financial position of New Zealand banks. Section III considers banks’ resilience to an increase in residential mortgage defaults. It uses two alternative default scenarios, and then looks at a battery of domestic and cross-country evidence to assess the plausibility of the assumed default rates. Section IV extends the analysis to corporate lending. Finally, Section V discusses the risks associated with banks’ offshore funding, and in particular, the implications of a sharp reduction in foreign financing to banks, taking an aggregate, balance-of-payments perspective.

4
II. THE GLOBAL TURMOIL: HOW HAS IT AFFECTED NEW ZEALAND BANKS?
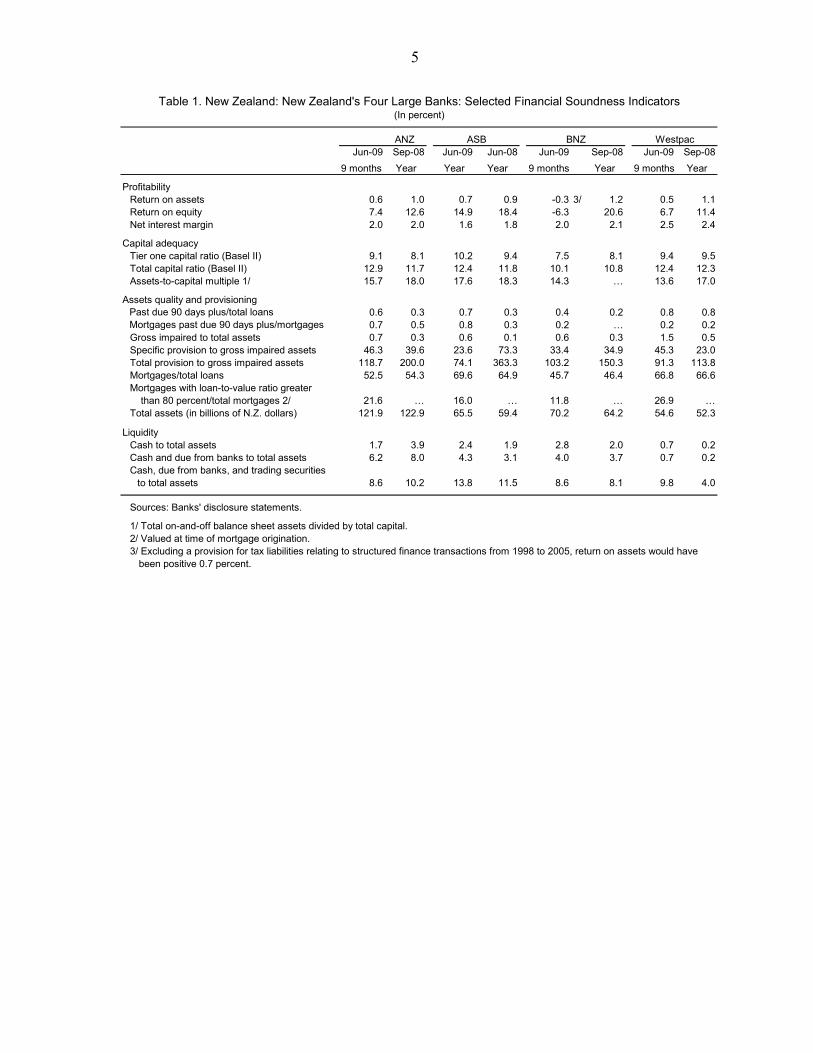
The direct impact of the global financial crisis on New Zealand banks has been limited thus far.2 Banks had minimal exposure to U.S. subprime-related or other distressed assets, and the securitization of mortgages in New Zealand was very limited. The four largest banks are wholly owned by Australian parents that enjoy a very strong financial position, have remained profitable, and have retained their high credit rating (Tables 1 and 2).3 The main direct impact of the global financial crisis on New Zealand banks has been an increase in the cost of borrowing relative to the New Zealand dollar swap rate, as discussed below.
The banking system remained strong through mid-2009. The turmoil did not affect banks’ capitalization significantly, although profits weakened somewhat.4 Total capital of the four large banks was about 10–12 percent, well above the regulatory minimum of 8 percent of risk-weighted assets, while Tier 1 capital ranged from 7½ percent to 10 percent in 2009. The banking system has become more concentrated in the four large banks, whose share of total bank assets rose to almost 90 percent in 2008.
2 Banks account for almost 80 percent of total assets of the New Zealand financial system, while nonbank lending institutions account for 7 percent, and funds under management for the remainder.
3 The four largest banks in New Zealand (with their Australian parents in brackets) are: the Australia and New Zealand Bank (a subsidiary of the Australian-based bank of the same name), Auckland Savings Bank (wholly owned by Commonwealth Bank of Australia), Bank of New Zealand (owned by National Australia Bank), and Westpac (a subsidiary of the Westpac Banking Group). Of the 100 largest banking groups in the world, only 9 had credit ratings of AA and higher as of September 2009; the four Australian parent banks were among those 9. Moreover, an analysis by Takats and Tumbarello (Australia Selected Issues, IMF Country Report No. 09/249, August 2009) suggests that risks from the corporate and household sectors facing banks in Australia appear to be manageable.
4 BNZ reported a loss in the nine-months to June 2009. However, excluding a provision equivalent to almost 1 percent of assets for tax liabilities relating to structured finance transactions from 1998–2005, BNZ would have reported a profit.
5
Jun-09 Sep-08 Jun-09 Jun-08 Jun-09 Sep-08 Jun-09 Sep-08
9 months Year Year Year 9 months Year 9 months Year
ProfitabilityReturn on assets 0.6 1.0 0.7 0.9 -0.3 3/ 1.2 0.5 1.1Return on equity 7.4 12.6 14.9 18.4 -6.3 20.6 6.7 11.4Net interest margin 2.0 2.0 1.6 1.8 2.0 2.1 2.5 2.4
Capital adequacyTier one capital ratio (Basel II) 9.1 8.1 10.2 9.4 7.5 8.1 9.4 9.5Total capital ratio (Basel II) 12.9 11.7 12.4 11.8 10.1 10.8 12.4 12.3Assets-to-capital multiple 1/ 15.7 18.0 17.6 18.3 14.3 … 13.6 17.0
Assets quality and provisioning Past due 90 days plus/total loans 0.6 0.3 0.7 0.3 0.4 0.2 0.8 0.8 Mortgages past due 90 days plus/mortgages 0.7 0.5 0.8 0.3 0.2 … 0.2 0.2
Gross impaired to total assets 0.7 0.3 0.6 0.1 0.6 0.3 1.5 0.5Specific provision to gross impaired assets 46.3 39.6 23.6 73.3 33.4 34.9 45.3 23.0Total provision to gross impaired assets 118.7 200.0 74.1 363.3 103.2 150.3 91.3 113.8Mortgages/total loans 52.5 54.3 69.6 64.9 45.7 46.4 66.8 66.6Mortgages with loan-to-value ratio greater than 80 percent/total mortgages 2/ 21.6 … 16.0 … 11.8 … 26.9 …Total assets (in billions of N.Z. dollars) 121.9 122.9 65.5 59.4 70.2 64.2 54.6 52.3
LiquidityCash to total assets 1.7 3.9 2.4 1.9 2.8 2.0 0.7 0.2Cash and due from banks to total assets 6.2 8.0 4.3 3.1 4.0 3.7 0.7 0.2Cash, due from banks, and trading securities
to total assets 8.6 10.2 13.8 11.5 8.6 8.1 9.8 4.0
Sources: Banks' disclosure statements.
1/ Total on-and-off balance sheet assets divided by total capital.2/ Valued at time of mortgage origination.3/ Excluding a provision for tax liabilities relating to structured finance transactions from 1998 to 2005, return on assets would have
been positive 0.7 percent.
Table 1. New Zealand: New Zealand's Four Large Banks: Selected Financial Soundness Indicators
BNZANZ ASB Westpac
(In percent)

6
End of Year 1995 2000 2001 2002 2003 2004 2005 2006 2007 2008 1/
Capital adequacy Total capital to risk-weighted assets 10.6 11.1 10.7 11.1 10.3 10.8 10.9 10.7 10.4 11.1 Tier I capital to risk-weighted assets 2/ 7.8 7.7 7.6 8.3 7.6 8.4 8.7 8.1 7.7 8.0
Asset composition (share of total) Financial securities … 17.5 22.0 19.7 18.2 16.4 16.6 14.6 14.1 12.7 Residential mortgage loans … 37.6 34.7 36.6 37.2 41.6 43.2 44.5 44.5 43.8 Other lending … 37.9 36.9 38.0 38.3 35.7 34.5 35.1 34.9 37.7 Other assets … 7.0 6.5 5.8 6.4 6.2 5.7 5.8 6.5 5.8
Asset growth Total assets 12.1 13.7 5.2 7.9 7.8 9.8 4.9 15.8 14.9 9.3 Total loans 13.7 7.7 9.4 8.1 9.5 10.2 9.4 13.3 14.6 12.3 Residential mortgages 17.6 7.4 4.7 8.6 17.3 14.8 16.1 13.8 14.8 7.8
Asset quality Impaired assets to total lending 1.3 0.4 0.4 0.3 0.2 0.2 0.2 0.1 0.1 0.2 Specific provisions to impaired assets 42.0 33.8 25.4 37.5 45.4 34.2 38.2 35.0 33.2 28.2
Earnings and profitability (year average) Return on average assets 1.0 1.1 1.2 1.4 1.2 1.2 1.1 1.2 1.1 1.0 Return on average equity 3/ ... ... ... 22.5 17.8 14.1 13.7 14.6 … … Aggregate lending margin 3.0 2.3 2.3 2.6 2.5 2.5 2.3 2.3 2.2 2.1 Total income to average assets … 3.4 3.2 3.5 3.5 3.4 3.2 3.2 … … Net interest income to total income … 62.2 63.3 67.6 67.7 68.8 67.8 69.0 69.2 70.8 Operating costs to income 66.1 54.8 48.4 45.5 46.1 47.6 48.0 45.9 44.2 43.3
Bank concentration (market share) Largest bank ... ... ... 32.7 32.9 33.2 33.3 34.6 33.1 33.4 Four largest banks ... ... ... 84.6 85.4 85.6 85.3 87.9 88.9 89.7
Source: Reserve Bank of New Zealand.
1/ Data for end-June.2/ Tier I capital includes issued and fully paid common equity and perpetual noncumulative preference shares, and disclosed reserves.3/ For systemically important banks.
(In percent)Table 2. New Zealand: Financial Soundness Indicators of the Banking Sector
Some signs of a deterioration in asset quality emerged in recent quarters, but impaired assets remain small (Figure 1). Loans overdue for 90 days or more jumped in the past year, but averaged just 0.6 percent of total loans for the four main banks. Gross impaired assets (i.e., where collateral is insufficient to fully cover the loan) have also increased, but are covered by total provisions. The increase in past due and impaired assets came from corporate and mortgage lending, due to pressure on borrowers’ cash flows from a slowing economy and, up to mid-2008, higher interest rates (Figure 2).
Figure 1. New Zealand: Bank Asset Quality
0.0
0.2
0.4
0.6
0.8
1.0
1.2
1.4
1.6
1.8
2003 2004 2005 2006 2007 2008
0.0
0.1
0.2
0.3
0.4
0.5
0.6
0.7
0.8
0.9
1.0
ImpairedPast-due
Impaired and past-due assets/total lending (rhs)
Figure 2. New Zealand: Mortgage Interest Rates
5
6
7
8
9
10
11
2000 2001 2002 2003 2004 2005 2006 2007 2008 2009
5
6
7
8
9
10
11
Effective mortgage rate
Effective nonresidential borrowing rate

7
Overall credit growth slowed to less than 5 percent year-on-year in mid-2009 (Figure 3). Credit to households has slowed more markedly, however, reflecting a shift in demand and a more risk-averse approach of banks to household lending.
The financial ratios of New Zealand banks compare favorably with those of other advanced country banks. Their capital position is one of the strongest, with leverage (assets-to-capital multiple of 22) well below that for Finland, Ireland, and the United Kingdom (Appendix Table A1). Asset quality and provisioning are also high by international standards. But New Zealand banks—like their Australian counterparts—are more exposed to mortgages and rollover risk (i.e., the low ratio of liquid assets to short-term funding) than banks in other advanced countries. Financial soundness ratios, however, are lagging indicators and can deteriorate rapidly under stress. This is illustrated by the Icelandic experience, where banks had strong indicators for capital and asset quality in 2007, but became insolvent in 2008.
Figure 3. New Zealand: Overall Credit Growth(Year-on-year percentage change)
-5
0
5
10
15
20
25
30
2003 2004 2005 2006 2007 2008 2009
-5
0
5
10
15
20
25
30
Household claims
Total
Business loans
III. CAN BANKS HANDLE AN INCREASE IN MORTGAGE DEFAULTS?
New Zealand banks remain heavily exposed to the housing market. Residential mortgages comprised 44 percent of total bank assets and 54 percent of total loans in 2008 (Figure 4). The increase in lending in recent years coincided with strong growth in house prices, but the housing cycle turned in late 2007 and house prices in early 2009 were about 10 percent below the peak.
Households’ high levels of indebtedness, in turn, increases their vulnerability to shocks. Total households’ debt has risen fast in recent years, reaching about 160 percent of disposable income by end-2007, where it has since stabilized, while debt service reached 14½ percent of disposable income by June 2008 (Figure 5). Therefore, their capacity to repay is vulnerable to a continued decline in house prices, increases in interest rates, or a fall in disposable income from the economic downturn.

8
Figure 4. New Zealand: Bank Assets by Type
0
50
100
150
200
250
300
350
400
1997 1998 1999 2000 2001 2002 2003 2004 2005 2006 2007 2008
0
50
100
150
200
250
300
350
400
Financial securitiesResidential mortgagesOther lendingOther assets
Figure 5. New Zealand: Household Debt
0
20
40
60
80
100
120
140
160
180
200
220
2000 2001 2002 2003 2004 2005 2006 2007 2008
0
5
10
15
20
25
30
35
40
Debt to disposable income ratio
Debt servicing (rhs)
Debt to assets ratio (rhs)
This section looks at whether banks’ high exposure to housing is a cause for concern, by analyzing their resilience to an increase in defaults. Two scenarios for mortgage defaults are used to gauge the impact on bank capital. Then evidence from other countries is used to assess the likelihood of those scenarios materializing.
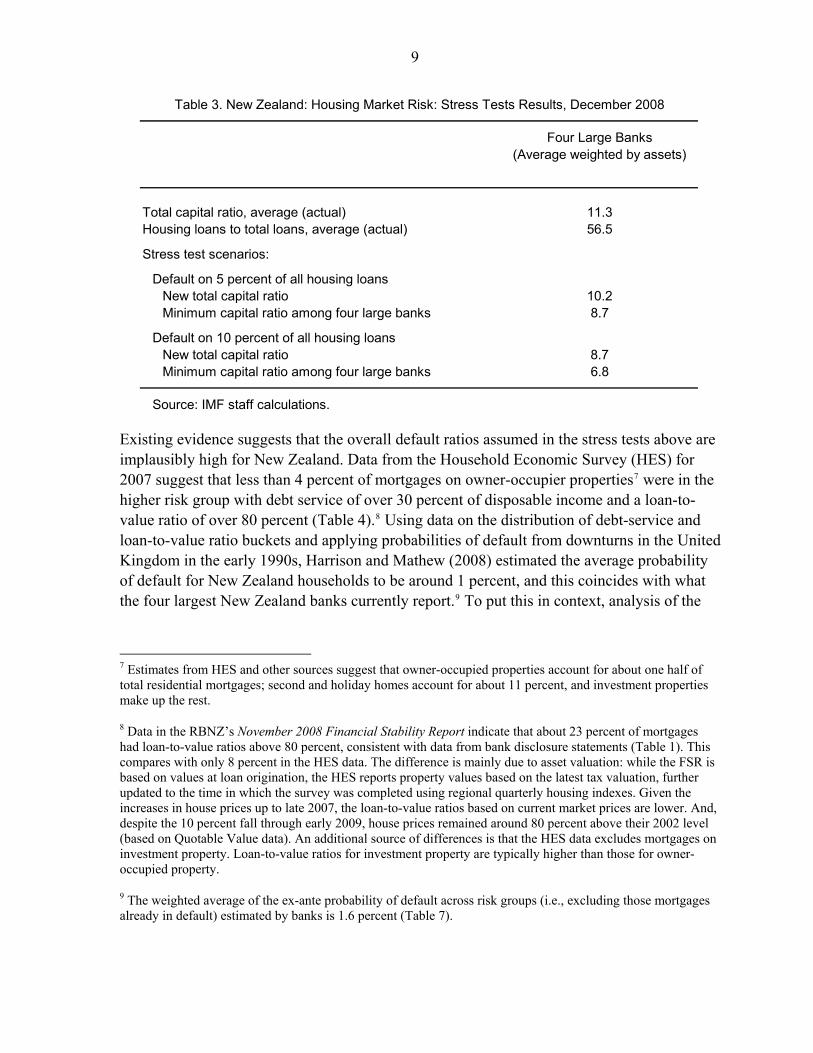
The analysis suggests that bank capital would be resilient to a sharp increase in defaults. The tests that were conducted involved scenarios of default on 5 or 10 percent of all housing loans (Table 3). The average loss given default was assumed to be 40 percent.5 While bank profits would be severely hit, with over 100 percent average annual net profits wiped out in a 5 percent default scenario, the tests indicate that bank capital would fare reasonably well even in a 10 percent default scenario. The aggregate capital ratio drops to 8½ percent, and the capital ratio for the most affected large bank falls to just below 7 percent.6
5 This is on the upper end of values generated by empirical and simulation studies for New Zealand, the United States, the United Kingdom, and other countries (Harrison and Mathew, 2008), as well as above the average (22–24 percent) used by New Zealand banks and required by the RBNZ under the Basel II Accord. The IMF’s Global Financial Stability Report (October 2008) uses a loss-given-default rate of 39 percent in a stress scenario.
6 The actual impact would be smaller, as provisions would cushion the losses. The exercise in Table 7 below takes account of loan loss provisions when estimating the impact on capital adequacy ratios.
9
Four Large Banks(Average weighted by assets)
Total capital ratio, average (actual) 11.3Housing loans to total loans, average (actual) 56.5
Stress test scenarios:
Default on 5 percent of all housing loans New total capital ratio 10.2Minimum capital ratio among four large banks 8.7
Default on 10 percent of all housing loans New total capital ratio 8.7Minimum capital ratio among four large banks 6.8
Source: IMF staff calculations.
Table 3. New Zealand: Housing Market Risk: Stress Tests Results, December 2008
Existing evidence suggests that the overall default ratios assumed in the stress tests above are implausibly high for New Zealand. Data from the Household Economic Survey (HES) for 2007 suggest that less than 4 percent of mortgages on owner-occupier properties7 were in the higher risk group with debt service of over 30 percent of disposable income and a loan-to-value ratio of over 80 percent (Table 4).8 Using data on the distribution of debt-service and loan-to-value ratio buckets and applying probabilities of default from downturns in the United Kingdom in the early 1990s, Harrison and Mathew (2008) estimated the average probability of default for New Zealand households to be around 1 percent, and this coincides with what the four largest New Zealand banks currently report.9 To put this in context, analysis of the
7 Estimates from HES and other sources suggest that owner-occupied properties account for about one half of total residential mortgages; second and holiday homes account for about 11 percent, and investment properties make up the rest.
8 Data in the RBNZ’s November 2008 Financial Stability Report indicate that about 23 percent of mortgages had loan-to-value ratios above 80 percent, consistent with data from bank disclosure statements (Table 1). This compares with only 8 percent in the HES data. The difference is mainly due to asset valuation: while the FSR is based on values at loan origination, the HES reports property values based on the latest tax valuation, further updated to the time in which the survey was completed using regional quarterly housing indexes. Given the increases in house prices up to late 2007, the loan-to-value ratios based on current market prices are lower. And, despite the 10 percent fall through early 2009, house prices remained around 80 percent above their 2002 level (based on Quotable Value data). An additional source of differences is that the HES data excludes mortgages on investment property. Loan-to-value ratios for investment property are typically higher than those for owner-occupied property.
9 The weighted average of the ex-ante probability of default across risk groups (i.e., excluding those mortgages already in default) estimated by banks is 1.6 percent (Table 7).

10
U.S. mortgage market suggests that the default rate on all mortgages will peak at about 6 percent, assuming a loss-given-default ratio of 40 percent (IMF GFSR, October 2008).
Moreover, the analysis above assumes that the increase in defaults occurs instantly. In practice, however, an increase in default rates driven by an economic downturn takes places gradually over the length of the downturn. As long as banks remain profitable, their profits could be set aside to cover some of the emerging losses.10
< 60 60–80 > 80 Total
Debt service ratio 2/0–20 34.0 4.7 3.1 41.820–30 19.6 9.0 1.7 30.330–40 7.5 5.5 1.9 14.840–50 6.4 1.6 0.9 8.950+ 2.5 1.0 0.7 4.2
Total 70.0 21.8 8.3 100.00
Sources: Statistics New Zealand (Household Economic Survey) and Reserve Bank of New Zealand.
1/ Excludes mortgages on second or holiday homes and investment properties.
2/ Annual mortgage payments (interest and principal) to annual household disposable income.
Table 4. New Zealand: Owner-Occupied Mortgages by Risk Bucket 1/(In percent of all mortgages)
Loan-to-Value Ratio
Another way of assessing the likelihood of the stress test scenarios materializing is to see what the scenarios imply for default probabilities for various debt-service and risk buckets. Table 5 provides a numerical example of default rates that would lead to an overall probability of default of 10 percent. The example shows that one would need to assume rather high default probabilities (in the range of 60–95 percent) for the higher risk households. However, experience with housing downturns in Australia and New Zealand in the 1980s and 1990s, and with Hong Kong SAR in the late 1990s, suggests that default rates range around 4–5 percent for mortgages with loan-to-value ratios of more than 80 percent (Harrison and Mathew, 2008). Also, the default rate for securitized U.S. mortgages, which involve a high share of sub-prime loans, was about 11 percent by end 2007.11
10 The absence of sizable mortgage securities on the banks balance sheet means banks do not need to mark-to-market mortgage losses that would require a call on capital.
11 The default rate is here defined as the sum of loans to borrowers subsequently declared bankrupt, loans in foreclosure, and loans already foreclosed but with the property still in the bank’s possession, as a percentage of total loans outstanding. The data were obtained from Loan Performance.

11
<60 60–80 > 80
Debt-service ratio0–20 0.5 5.0 10.020–30 1.0 10.0 30.030–40 5.0 30.0 60.040–50 10.0 50.0 75.050+ 40.0 80.0 95.0
Overall probability 10.0
Source: IMF staff calculations.
1/ Probabilities of default (in percent) on mortgages required for the overall probability of default to be equal to 10 percent.
Loan-to-Value Ratio
Table 5. New Zealand: Numerical Example of Mortgage Default Probabilities 1/(In percent)
There are a number of factors that would mitigate against a large increase in bank losses from mortgage lending. First, interest rates on new mortgages have fallen by over 400 basis points from their peak in July 2008, which will make it easier for households to service the loans.12 Second, a portion of the higher loan-to-value ratio mortgages is insured by third parties.13 Third, in contrast to the practice in many U.S. states, the legal framework in New Zealand makes the homeowner liable for remaining debt even after repossession by the bank. This discourages homeowners from defaulting on mortgages when a drop in house prices wipes out equity. And finally, almost three-quarters of the mortgage debt in New Zealand in 2007 was held by households with incomes in the two highest quintiles, and the median debt-service ratio for those households is below 20 percent. Households in the two lowest income quintiles held only 7 percent of mortgage debt.
Stress tests in the Financial System Stability Assessment (FSSA) also suggest some resilience of bank capital to a combination of adverse shocks. The shocks included a 20 percent fall in house prices, a 4 percentage point increase in the unemployment rate and a 4 percent decline in household income (IMF, 2004). They resulted in a loss of ¼ of annual bank profits on average. In addition, the FSSA stress tests show that banks would suffer significant losses from a sharp rise in funding costs, but the results suggest that no individual
12 If rates for new mortgages hold at present levels, average household debt service could fall by 3–4 percent of disposable income by end 2009.
13 For example, the ASB Bank insured ¼ of loans with 80 percent or higher loan-to-value ratios. Also, some first home borrowers with high loan-to-value ratios have mortgages guaranteed by their parents; and loans on many rental properties are secured against the landlord’s own home. This underlying collateral is not reflected in the loan-to-value ratio of the mortgage.

12
bank’s capital position would be endangered by the scenario.14 Preliminary updates of these stress tests by the RBNZ suggest the results remained valid through 2007 (Rozhkov, 2007). The RBNZ’s November 2008 Financial Stability Report also suggests some resilience of bank profits to a combination of house price, unemployment, and interest rate shocks. Of course, increases in unemployment or other shocks to household income beyond those contemplated in these stress tests could lead to more severe losses.
IV. HOW VULNERABLE ARE BANKS TO HIGHER DEFAULTS ON CORPORATE LENDING?
Banks’ exposure to businesses and agriculture is smaller than to households, but has grown quickly in the past year. The pace of growth in lending for commercial property and agriculture, particularly dairy farming, picked up in 2008 in response to earlier strength in real estate and dairy prices (Figure 6a). However, commercial property and dairy prices have fallen in recent quarters, which amplifies the risks of such lending. Signs of stress in the business sector have already emerged with a sharp pick up in past due loans, which has been a precursor for liquidations in the past (Figure 7). Moreover, the high level of debt to agricultural output points to significant risks in the event of a sharper-than-expected downturn in dairy prices (Figure 6b).
Figure 6a. New Zealand: Business and Agriculture Credit Growth
(Percent change; y/y)
-10
0
10
20
30
40
2000 2001 2002 2003 2004 2005 2006 2007 2008
-10
0
10
20
30
40AgricultureNon-farm business - property (banks)Non-farm business - ex property (banks)
0
100
200
300
400
500
1992 1994 1996 1998 2000 2002 2004 2006 2008
0
100
200
300
400
500
Agricultural credit to agricultural GDP ratio
Private sector credit (resident) to GDP ratio
Figure 6b. New Zealand: Credit to GDP Ratio (In percent)
14 The funding-costs-stress scenario in the FSSA assumes an increase in short-term interest rates to 18-20 percent, a depreciation of the New Zealand dollar by 40 percent, and a permanent increase in the risk-premium for New Zealand dollar-denominated debt.

13
Figure 7. New Zealand: Overdue Debts and Liquidations
0
50
100
150
200
250
300
350
1990 1992 1994 1996 1998 2000 2002 2004 2006 2008
No/per quarter
-20
-10
0
10
20
30
40
Net %
Company liquidations
Overdue debts: manufacturers & builders (RHS)
Overdue debts: merchants (RHS)
The financial position of New Zealand’s corporate sector is generally sound, but a cross-country comparison points to some vulnerabilities. While their share of short-term debt is low by advanced country standards, New Zealand companies have relatively high debt-to-asset ratios (Table 6, Appendix Table A2 and Figure A1).15 Somewhat higher leverage and higher interest rates in New Zealand lead to a lower interest coverage ratio—only Ireland and Portugal are below—, but still well above one. The agricultural sector is particularly exposed, with profitability and interest coverage well below those of manufacturing or the corporate sector as a whole.
Agriculture Manufacturing2005 2006 2007 2007 2007
Leverage (total liabilities to total assets 52.7 53.4 51.9 47.8 55.2Current assets to current liabilities 131.7 125.3 128.4 160.0 170.4Interest coverage ratio 1/ 3.7 3.8 3.7 1.6 7.7Return on equity 13.3 14.7 13.7 2.1 19.5Return on assets 6.3 6.9 6.6 1.1 8.8
Sources: Statistics New Zealand (Annual Enterprise Survey), and Fund staff calculations.
1/ Earnings before interest and taxes divided by interest payments.
All industries
Table 6. New Zealand: Corporate Sector Indicators(Aggregate ratios for nonfinancial private enterprises, in percent)
15 Based nonfinancial enterprise data from Statistic New Zealand’s Annual Enterprise Survey and cross-country data for listed nonfinancial companies. The data sets are not fully comparable. Listed companies tend to be larger and financially healthier than nonlisted companies that are also covered by the HES. Moreover, the listed companies covered may be particularly unrepresentative in New Zealand, as their market capitalization is less than 40 percent of GDP, compared with 100 percent or more in Australia, Canada, and the United States.

14
Despite these weaknesses, the data for listed companies suggest a very low probability of systemic financial distress one year ahead. Indeed, New Zealand has the highest distance-to-default ratio among comparator countries (Appendix Table A2 and Figure A1). This means that it would take a large shock-to-asset values or returns to lead to solvency or liquidity problems among the listed companies.
To assess the risks to banks of corporate and other lending, this paper analyzes data recently published by banks on their risk exposure. Following the adoption of the Basel II internal modeling approach, banks published a breakdown of corporate, mortgage, and other retail lending exposure disaggregated into six risk categories (Table 7). They also published estimates of the probability of default and loss given default for the six categories. The data show that corporate lending has been classified as more risky than mortgage and other retail lending, with about half of corporate lending exposures classified in the risk category 5 or higher.
A significant increase in the probability of default or the loss given default would be needed to reduce bank capital significantly. Table 7 illustrates this using an arbitrary exercise, where the probability of default is increased to the level of the next highest risk category and the loss given default for mortgages is raised to 1½ times that reported by the banks. In this case, the average overall default rate for the four large banks would rise to about 6–8 percent of total loans, and losses after provisions would amount to about 3 percent of loans for mortgages and corporate loans. Under this scenario, the average capital adequacy ratio would fall to the regulatory minimum of 8 percent, while Tier 1 capital would fall to 5 percent.16 The bank most affected in this scenario would see its Tier 1 capital ratio fall to just over 4 percent.17 Of course, the increase in default rates does not have to follow this particular pattern. Detailed analysis by banks would be needed to assess the vulnerabilities of borrowers to stress.
While this exercise suggests some resilience of bank capital to an increase in defaults, banks should be required to undertake extreme stress tests. The tests outlined above are not as extreme as the earlier scenario discussed of a 10 percent default rate for mortgages, but it covers a broader range of assets. While this scenario is still unlikely, risks have risen in the past year with the deterioration in the global outlook and the knock-on effect to New Zealand through a fall in economic activity, lower agricultural commodity prices, and a higher cost of external borrowing. Therefore, banks should be required to undertake more detailed and extreme stress tests and increase their capital if needed.
16 The October 2008 Global Financial Stability Report (Box 1.6) projects the charge-off or loss rate for corporate loans in the United States also peaking at about 2 percent under a stress scenario.
17 This example uses the loss given default determined by the banks for corporate and other retail lending, but increases the loss given default to about 35-40 percent on average for residential mortgages to match the loss given default used in the earlier numerical example.

15
Exposure Reported Average Adjusted Average Adjusted Loss Estimated Loss/ExposureRisk group (Billions of $NZ) Probability of Default Probability of Default 2/ Given Default 3/ Loss 4/ (Percent)
Corporate0-2 16,162 0.1 0.3 56.8 27 0.23-4 36,790 0.3 1.2 34.3 156 0.45 35,542 1.2 3.1 34.3 390 1.16 21,746 3.1 12.5 34.5 970 4.57-8 5,335 12.5 50.0 37.3 1,013 19.0Default 1,117 100.0 100.0 38.0 442 39.6
Total/average 116,692 2.6 6.9 37.6 2,999 2.6
Retail mortgages 0-2 30,708 0.3 0.5 34.9 49 0.23-4 57,195 0.5 1.2 36.5 244 0.45 42,227 1.2 3.7 38.2 592 1.46 16,270 3.7 15.7 39.8 1,016 6.27-8 6,110 15.7 50.0 41.5 1,268 20.8Default 1,646 100.0 100.0 48.1 792 48.1
Total/average 154,156 2.6 6.2 37.3 3,961 2.6 Other retail 0-2 2,598 0.1 0.4 74.0 8 0.33-4 6,886 0.4 1.4 65.0 58 0.85 4,179 1.4 3.1 65.5 77 1.86 2,746 3.1 15.6 64.5 249 9.17-8 1,089 15.6 50.0 67.0 323 29.7Default 209 100.0 100.0 70.5 134 64.2
Total/average 17,707 3.1 8.0 66.5 849 4.8
Total estimated loss 7,809 Less provisions 1,572
Estimated loss after provisions 6,237 Loss as percent of risk-weighted assets 3.2 Implied new total capital ratio (average of four banks) 8.0 Implied new Tier 1 capital ratio (average of four banks) 5.1 Minimum new Tier 1 capital ratio among the four banks 4.3
Sources: Bank disclosure statements and staff estimates.
1/ As reported by Auckland Savings Bank, Australia and New Zealand Bank, Bank of New Zealand, and Westpac. 2/ The authors' adjusted probability of default assumes that the assets shift to the next highest risk category, and that the probability ofdefault for the category 7–8 is four times that assumed by the banks. 3/ The authors' adjusted loss given default is about 1 1/2 times higher than reported by the banks for mortgage debt, but unchanged to thatreported by the banks for corporate and other retail debt. 4/ The authors' loss estimate is calculated as the exposure multiplied by the probability of default and the loss given default.
Table 7. New Zealand: New Zealand Banks' Credit Risk Exposure by Asset Class, December 2008 1/
V. WHAT ARE THE RISKS RELATED TO BANKS’ WHOLESALE FUNDING?
The magnitude and maturity structure of foreign borrowing by New Zealand banks leaves them vulnerable to disruptions to capital inflows.18 Over the past 5–6 years, New Zealand banks have borrowed sizable amounts from offshore markets to fund their lending, with nonresidents comprising one-third of banks’ total funding (Figure 8). Almost half of New Zealand’s foreign debt (bank and non-bank) matures in less than one year, with more than half of this debt maturing in 90 days or less (Figure 9). Going forward, the ability of banks to roll
18 A Selected Issues paper for the New Zealand 2008 Article IV discussed the policy implications of a disruption to capital inflows (see Brooks, 2008).

16
over their external funding depends not just on their financial health (including the quality of their loan bank and their credit rating) and that of their Australia-based parents, but also on global financial conditions.
Figure 8a. New Zealand: Net Capital Inflows(Four quarter running total, as percent of GDP)
-10
-5
0
5
10
15
Jun-00 Jun-01 Jun-02 Jun-03 Jun-04 Jun-05 Jun-06 Jun-07 Jun-08 Jun-09
-10
-5
0
5
10
15
Debt
Equity
Figure 8b. New Zealand: Net Foreign Liabilities
(As percent of GDP)
40
50
60
70
80
90
100
Jun-00 Jun-01 Jun-02 Jun-03 Jun-04 Jun-05 Jun-06 Jun-07 Jun-08 Jun-09
40
50
60
70
80
90
100
Net equityNet debt
0
10
20
30
40
50
60
70
80
90
100
Jun-01 Jun-02 Jun-03 Jun-04 Jun-05 Jun-06 Jun-07 Jun-08 Jun-09
0
10
20
30
40
50
60
70
80
90
100
Figure 8c. New Zealand: Bank Borrowing Offshore (Amount outstanding, as percent of GDP)
Bank borrowing offshore
Net bank debt
Bank lending offshore
Figure 8d. New Zealand: Bank's Share of Funding
from non-residents(In percent)
0
10
20
30
40
50
Jul-05 Jul-06 Jul-07 Jul-08 Jul-09
0
10
20
30
40
50
Funding from nonresidents in NZ dollars and FX
Funding from nonresidents in FX
Funding from associates
Sources: New Zealand Time Series; and Fund staff calculations.
Fig 9a. New Zealand: Debt by Residual Maturity (Bank and Non-Bank Debt, as percent of Total Debt)
30
35
40
45
50
55
60
65
70
Jun-00 Jun-01 Jun-02 Jun-03 Jun-04 Jun-05 Jun-06 Jun-07 Jun-08 Jun-09
30
35
40
45
50
55
60
65
70
One year or less
90 days or less
Sources: Statistics New Zealand; and Fund staff calculations.
Figure 9b. New Zealand: Local Currency External
Debt as share of Total External Debt
30
35
40
45
50
55
60
65
Jun-00 Jun-01 Jun-02 Jun-03 Jun-04 Jun-05 Jun-06 Jun-07 Jun-08 Jun-09
30
35
40
45
50
55
60
65
Sources: Statistics New Zealand; and Fund staff calculations.
The global financial turmoil has increased the spreads on foreign funding, particularly over the medium-term. Since the Lehman Brothers collapse in September 2008, bank access to financing in global markets has become more difficult. Credit default swap spreads for the

17
four large Australasian banks increased markedly in early 2009, especially for five-year funding, but have eased back in recent months (Figure 10).
Figure 10. Average 5-Year CDS Spread on Four Major Australasian Banks
(In basis points)
0
40
80
120
160
200
240
Jun-07 Sep-07 Dec-07 Mar-08 Jun-08 Sep-08 Dec-08 Mar-09 Jun-09 Sep-09
0
40
80
120
160
200
240
Source: Bloomberg.
Figure 11. New Zealand: Funding Costs for Banks and New Mortgage Rates
0
2
4
6
8
10
12
14
16
18
Aug-06 Feb-07 Aug-07 Feb-08 Aug-08 Feb-09 Aug-09
0
2
4
6
8
10
12
14
16
18
New mortgage rates 2-year swap rates3-month bank bill rates 6-month deposit rates
Source: Reserve Bank of New Zealand and Bloomberg.
This, however, has been more than offset by the reduction in foreign and domestic interest rates, leading to a fall in the total cost of funding. The significant easing of monetary policy by the RBNZ and foreign central banks has led to a sharp drop in the funding costs for New Zealand banks. For instance, the two-year New Zealand dollar swap rate, used to price a popular class of mortgage products, has fallen to about half the level one year earlier (Figure 11). Short-term wholesale and retail funding costs, as reflected by the 90-day bank bill rate and the 6-month deposit rate, have fallen by similar amounts. This has enabled banks to reduce interest rates for new mortgages.
Figure 12. New Zealand: Loan-to-Deposit Ratio for the Banking System
1.20
1.25
1.30
1.35
1.40
1.45
1.50
1.55
1.60
Mar-06 Sep-06 Mar-07 Sep-07 Mar-08 Sep-08 Mar-09
1.20
1.25
1.30
1.35
1.40
1.45
1.50
1.55
1.60
Source: International Financial Statistics.
The introduction of retail deposit and wholesale funding guarantees in late 2008 also helped ease the funding pressure on banks. As a result, retail deposit growth picked up, though the loan-to-deposit ratio still remains high at over 145 percent (Figure 12). In addition, the wholesale guarantee enables banks to use the New Zealand sovereign credit rating (S&P AA+, Moody’s Aaa) to tap the international markets, for a fee.
Still, New Zealand’s high current account deficit and short-term foreign debt levels make it vulnerable to a reduction in capital inflows. The global financial deleveraging, or a sudden shift in investor sentiment, could lead to a capital account shock.
Analysis of balance of payments financing suggests that if two-fifths or more of the maturing debt failed to be rolled over in 2009, a financing gap could arise. The total external debt falling due this year is almost $NZ 120 billion. About 40 percent of it

18
could be financed by using about one-half of the official reserves of $NZ 19 billion and four-fifths of the US$15 billion U.S. Federal Reserve credit line,19 and by banks raising $NZ 25 billion from their Australian parents (Table 8).20 But if only half of the maturing debt or less were rolled over, a sizable financing gap could arise. However, such a dramatic fall in rollover rates is unlikely: during the Asian crisis, about ¾ of bank debt and 2/3 of nonbank debt of Korea, the Philippines, and Thailand was rolled over.21 Moreover, external short-term debt figures include funding provided by parent banks to their bank subsidiaries, which does not face the same roll-over risk as arms’ length funding.22
Any remaining financing gap, once any additional offshore borrowing by the public or private sectors is considered, would force an external adjustment and a depreciation of the currency.23 The fall in the exchange rate would stimulate a shift in the current account and would make domestic assets (including equity and housing) more attractive.
A negative shock to capital inflows would entail a balance of payments financing problem, but banks would still have access to domestic funding. Since banks’ foreign exchange risk is fully hedged, a shortfall in their offshore funding could simply be replaced by domestic currency funds, particularly from the RBNZ. Since the onset of the turmoil in 2007, the RBNZ has expanded banks’ access to its liquidity, including by accepting securitized mortgages as collateral. Over the last year, banks have prepared to take advantage of this by securitizing some of their mortgage portfolio.
19 Assuming the U.S. Federal Reserve credit line is extended beyond October 2009 when it is scheduled to expire.
20 Australian bank regulations limit direct lending to subsidiaries to a maximum of 50 percent of Tier 1 capital. This implies a maximum lending to all Australian bank subsidiaries in the order of $NZ 40 billion. However, lending can also take place through local branches and other associated vehicles. It should be noted, on the other hand, that a sharp negative offshore funding shock to the New Zealand banks is likely to affect their Australian parents. This, in turn, may reduce the parents’ ability to provide financing to the subsidiaries. Parent funding is therefore a relevant source of alternative financing mainly in the case of New Zealand-specific shocks.
21 IMF (2009), note prepared for the Group of Twenty Meeting, March.
22 Non-equity parent funding to bank subsidiaries is classified by Statistics New Zealand as portfolio or other investment rather than foreign direct investment.
23 Staff analysis suggests a semi-elasticity of the current account/GDP ratio of -.24 with respect to the exchange rate. This implies that a 20 percent depreciation of the currency would narrow the current account deficit by almost 5 percent of GDP over the medium term.

19
2007 2008 2009 2009
Est.Illustrative
Scenario 1/Illustrative
Scenario 2/
Current account balance -14.2 -15.9 -10.4 -10.4 (In percent of GDP) -8.1 -8.8 -5.8 -5.8Capital and financial account balance 13.3 15.9 -41.0 -54.7Net errors and ommissions 1.0 0.0 0.0 0.0Overall balance 0.0 0.0 -51.4 -65.0 (In percent of GDP) … … -28.6 -36.2
Other sources of financing … … 51.4 51.4Official reserves 3/ … … 9.3 9.3Australian parent banks 4/ … … 25.0 25.0U.S. Federal Reserve swap facility 5/ … … 17.1 17.1
Remaining gap … … 0.0 -13.7Remaining gap as percent of GDP 0.0 -7.5
Memorandum items: Short-term debt (eop) 119.4 118.7 73.0 59.3
Percent rolled over … … 61.5 50.0Total external debt (eop) 216.4 249.7 204.0 190.3Short-term assets (eop, excluding reserves) 26.0 25.1 22.6 22.6
Percent liquidated … … 10.0 10.0Total foreign assets (eop, excluding reserves) 59.7 75.2 72.7 72.7Official reserves 22.3 19.3 … …NEER annual average 133.0 124.1 … …REER annual average 137.8 128.9 … …
Sources: Statistics New Zealand and Fund staff estimates.
1/ Scenario 1 illustrates the percent of short-term debt that needs to be rolled-over to close the financing gap, givenassumptions on funding from other sources plus the liquidation of 10 percent of short-term foreign assets. Assumes a current account deficit for the calendar year 2009 in line with the outcome for the year ending June 2009.2/ Scenario 2 illustrates the remaining financing gap if only 50 percent of short-term debt is rolled over, given assumptionson funding from other sources plus the liquidation of 10 percent of foreign assets.3/ Assumes the use of one-half of official reserves as of end-December 2008. 4/ Assumes Australian parent banks increase lending to their New Zealand bank subsidiaries by $NZ 25 billion.5/ Assumes use by the RBNZ of the US$15 billion swap facility with the US Federal Reserve in late 2008.
Table 8. New Zealand: Balance of Payments Financing
(In billions of New Zealand dollars)
A cross-country analysis points to several factors that reduce New Zealand’s risk of a sudden capital account reversal or mitigate its consequences (Appendix Figure A2):
Gross external debt is not as large as in some advanced countries. While New Zealand’s net foreign liabilities are among the highest of advanced countries, its gross foreign liabilities (at 170 percent of GDP in June 2009) are small compared with Finland, the United Kingdom, and Iceland.
The banking system is not large by international standards. Gross bank assets are about twice GDP compared to factors of 7 for the United Kingdom, 9 for Ireland, and

20
11 for Iceland.24 Thus, the contingent liabilities on the public finances from potential bank failures are smaller as a share of GDP in New Zealand than elsewhere. By contrast, in Iceland and Ireland, concerns about the fiscal cost of a bank bailout of the oversized banking sectors was reflected in the sharp jump in their sovereign CDS spreads in late 2008.
Banks’ asset quality remains sound. New Zealand has experienced a credit-fueled house price boom only surpassed by Iceland’s, and household debt is high,25 but the analysis above suggests that banks can withstand significant shocks. Also, corporate debt is not as high as in other advanced economies that have recently experienced financial distress.26 More importantly, New Zealand banks (like their Australian parents) have little exposure to sub-prime assets. In contrast, over half of Iceland’s bank assets were held abroad, with a significant share in asset-backed securities. The rapid collapse in the market value of these securities triggered a sudden loss of market confidence in Icelandic banks.
New Zealand’s public finances remain strong. At about 20 percent of GDP, its gross public debt in 2008 was one of the lowest among advanced countries. As a result, the New Zealand government’s access to, and cost of, foreign or domestic financing is likely to remain favorable.
Exchange rate risk is hedged. Banks hedge more than 90 percent of their foreign currency debt using financial derivatives, and more than half of their foreign borrowing is in New Zealand dollars. 27 Banks have limited lending in foreign currency, and corporates also hedge most of their foreign exchange risk anyway. Thus, the sharp depreciation of the New Zealand dollar (about 30 percent against the U.S. dollar between May 2008 and end-March 2009) did not have a material impact on bank or private sector balance sheets. In contrast, in Iceland, about 70 percent of bank loans to corporations were foreign-exchange linked, leading to a severe corporate and banking sector slump when the currency collapsed in October 2008. Foreign exchange exposure has also been a key driver of recent financial distress in Eastern Europe.
24 This is based on gross, unconsolidated assets, which do not net out assets held in other domestic banks.
25 New Zealand’s household debt-to-disposable income ratio was 150 percent in 2006 and 160 percent in 2007. Iceland’s, however, was higher, at 225 percent in 2006.
26 New Zealand’s total corporate liabilities (an upper bound on corporate debt) stood at 178 percent of GDP in 2007, compared with corporate debt-to-GDP ratios of 278 percent for the United Kingdom and 308 for Iceland. Also, the corporate sector has not been mired by risky derivative bets on the exchange rate, which brought down large companies and put downward pressure on the currency in countries like Korea, Mexico, and Brazil.
27 Statistics New Zealand, 2009, Balance of Payments and International Investment Position: Year ended 31 March 2008.

21
Thus far into the global crisis, New Zealand banks have been relatively successful in rolling over offshore debt, but there are some signs of strain. New Zealand dollar-denominated bank funding from nonresidents has remained stable. However, funding from nonresidents, expressed in U.S. dollars, has declined by 3 percent between December 2007 and July 2009 (Table 9). Since the exchange rate depreciation has more than offset this decline, overall funding from nonresidents expressed in New Zealand dollars has increased from December 2007 through July 2009.
Dec-07 Dec-08 Jul-09
Funding from residents 177 202 200In New Zealand dollars 167 193 192In foreign currency 10 9 8
Funding from nonresidents 112 127 127In New Zealand dollars 40 39 41In foreign currency 72 88 86
Other liabilities 22 50 39Capital and reserves 21 23 21
Total 332 402 388
Memorandum item:Total funding from nonresidents (expressed in billions of U.S. dollars) 86 71 83
Exchange rate (US$/$NZ, e.o.p.) 0.769 0.557 0.652
Sources: Reserve Bank of New Zealand, and Fund staff calculations.
Table 9. New Zealand Banks: Funding Structure(In billions of New Zealand dollars, unless otherwise stated)
In order to reduce banks’ vulnerability on the funding side, the RBNZ has introduced a prudential liquidity policy in June 2009. The policy requires banks to have a minimum core funding of 65 percent of total assets by October 1, 2009, increasing to 75 percent over two years. Core funding is defined as Tier 1 capital, wholesale, and retail funding with residual maturity of more than one year plus 90 percent of short-term retail funding. The liquidity guidelines will encourage banks to shift to medium-term debt and may even help reduce New Zealand’s overall debt. Since the cost of medium-term wholesale debt relative to short-term wholesale debt has risen, banks will have an incentive to rely more on domestic retail funding.

APPENDIX. NEW ZEALAND’S VULNERABILITIES IN A COMPARATIVE PERSPECTIVE
Australia Austria Canada Finland Greece Iceland Ireland Portugal SpainUnited
Kingdom Sample
Average 1/New
Zealand
CapitalAssets to Tier 1 capital multiple 2/ 33.2 28.8 26.4 185.1 25.6 16.2 43.7 32.1 25.4 51.2 46.8 24.8Assets to total capital multiple 2/ 23.2 19.9 21.7 156.9 30.8 13.0 33.3 21.2 16.3 33.8 37.0 21.9
Asset qualityImpaired loans to total loans 0.3 3.4 0.5 0.5 6.2 0.9 0.7 1.3 1.0 1.6 1.6 0.2Provisions to impaired loans 216.6 82.0 156.7 62.5 43.3 84.2 52.3 154.8 188.4 59.0 110.0 239.6
ProfitabilityReturn on average assets 1.0 0.8 0.9 2.1 1.2 1.6 0.5 0.9 1.0 0.6 1.1 1.0Return on average equity 17.4 11.5 18.1 21.8 17.1 18.5 14.5 14.4 14.4 13.7 16.1 16.9Net interest margin 1.8 1.9 1.8 1.4 3.0 1.4 1.0 1.9 1.8 1.1 1.7 2.0Dividend payout 74.2 19.7 43.4 60.9 35.9 21.3 56.0 35.4 22.1 49.5 41.8 61.0
Composition of assets and liabilitiesMortgages to total loans 53.1 5.4 10.2 7.6 27.8 3.5 1.7 21.4 5.0 15.8 15.1 56.0Loans to total assets 61.8 53.3 47.7 45.4 61.8 59.8 52.8 68.3 67.6 43.4 56.2 69.4Retail deposits to total liabilities 41.3 41.5 31.7 31.0 60.8 29.7 25.7 46.5 42.1 38.1 38.8 56.6Liquid assets to deposits and ST funding 4.1 15.1 2.1 25.6 20.8 16.5 9.0 9.0 9.5 7.7 11.9 5.3
Sources: Bankscope, APRA, and Fund staff estimates.
1/ Simple (unweighted) average of comparator countries, excluding New Zealand. 2/ Assets include off-balance sheet items; figures expressed as a multiple, not in percent.
Table A1. New Zealand: Banking Sector Financial Soundness Indicators for New Zealand and Comparator Countries, 2007
(In percent, except where otherwise indicated)
22

23
Default probability
Liabilities to assets
Debt to assets
ST debt to total debt
Current ratio 1/
Interest coverage ratio 2/
Return on average assets
Return on average equity
Distance to default,
pooled 3/
Australia 51.3 25.8 21.5 181.6 14.5 12.4 22.8 19.6
Austria 57.3 25.5 41.2 126.7 12.7 8.6 19.1 14.9
Belgium 53.0 23.9 23.0 127.2 29.0 9.9 19.0 15.3
Canada 47.0 21.0 16.4 189.5 13.6 6.9 12.7 18.5
China 45.6 24.9 72.1 160.5 35.9 9.0 15.7 13.8
Denmark 52.1 24.5 28.4 168.8 12.5 12.3 28.6 17.1
Developed Asia 49.0 21.3 40.1 177.2 61.4 7.6 14.1 --
Developed Europe 58.6 24.6 33.1 134.3 22.7 10.1 23.0 --
Emerging Asia 45.8 21.2 49.3 185.8 51.0 11.4 20.5 --
Emerging Europe 37.2 19.2 50.7 200.9 27.1 14.8 23.8 --
Finland 53.1 16.5 49.8 147.1 81.2 14.4 30.0 18.7
Greece 59.0 34.1 34.5 146.7 28.8 13.0 29.4 16.6
Ireland 61.8 35.8 12.2 197.5 7.1 8.5 24.2 12.7
Japan 50.7 21.4 45.5 173.7 77.4 5.4 11.1 13.5
Korea (South) 48.5 21.5 51.4 152.5 27.7 7.0 13.6 11.3
Portugal 70.5 41.4 21.6 91.8 7.2 7.4 24.0 16.2
Spain 65.0 37.6 24.8 109.2 15.1 9.4 28.6 15.9
Sweeden 52.0 22.1 29.7 178.3 17.1 12.0 24.0 14.6
United Kingdom 59.9 25.6 28.5 121.2 15.5 10.9 27.8 20.0
United States 54.6 23.2 20.4 172.7 29.8 8.4 18.9 20.1
Sample average 4/ 53.6 25.5 34.7 157.2 29.4 10.0 21.5 16.2
New Zealand 47.1 29.1 25.8 147.5 11.5 15.3 18.3 27.1
Sources: Worldscope, and IMF staff calculations.
1/ Current assets to current liabilities.
4/ Simple (unweighted) average of comparator countries, excluding New Zealand.
3/ Distance to default within one year (DtD), measured as DtD = 3+ {log (A) - log (B) + [μ - (σ2A)/2]}/σa, where A is
total assets, B is the default barrier measured as short-term debt plus one half of long-term debt plus interest payments, μ is the expected return on assets (based on last year's annual capital gain including dividends), and σA is the standard deviation of the asset return. DtD is calculated from pooled data, adding all inputs into a synthetic company at the country level. Asset values and the standard deviation of asset returns are derived using the Black-Scholes-Merton option pricing formula, with stock prices and their volatility as inputs.
2/ Earnings before interest and taxes to interest payments, expressed in absolute, not percent, terms.
Table A2. Financial Soundness Indicators for the Nonfinancial Corporate Sector in New Zealand and a Set of Comparator Countries, 2007
(Companies listed in a stock exchange; aggregations based on market capitalization weighted averages)
Leverage
(In percent, except where otherwise stated)
Liquidity Profitability

24
Figure A1. Corporate Vulnerability Indicators for New Zealand and Comparators
Debt to Assets
10
20
30
40
50
60
2000 2001 2002 2003 2004 2005 2006 2007 2008
10
20
30
40
50
60
AustraliaNew ZealandUnited StatesDeveloped EuropeEmerging Asia
Short-term Debt to Total Debt
10
20
30
40
50
60
70
80
2000 2001 2002 2003 2004 2005 2006 2007 2008
10
20
30
40
50
60
70
80
AustraliaNew ZealandUnited StatesDeveloped EuropeEmerging Asia
Interest Coverage Ratio
0
10
20
30
40
50
60
70
80
90
2000 2001 2002 2003 2004 2005 2006 2007 2008
0
10
20
30
40
50
60
70
80
90
AustraliaNew ZealandUnited StatesDeveloped EuropeEmerging Asia
Return on Assets
0
5
10
15
20
2000 2001 2002 2003 2004 2005 2006 2007 2008
0
5
10
15
20
AustraliaNew ZealandUnited StatesDeveloped EuropeEmerging Asia
Return on Equity
0
10
20
30
40
50
2000 2001 2002 2003 2004 2005 2006 2007 2008
0
10
20
30
40
50
AustraliaNew ZealandUnited StatesDeveloped EuropeEmerging Asia
Distance to Default
0
10
20
30
40
50
2000 2001 2002 2003 2004 2005 2006 2007
0
10
20
30
40
50
AustraliaNew ZealandUnited StatesIrelandKorea
Sources: Worldscope; and Fund staff calculations.

25
Figure A2. Selected Economic Indicators for New Zealand and Comparators
Figure A2a. Foreign Investment Position, June 2008(In percent of 2008 GDP)
-800
-600
-400
-200
0
200
400
600
800
1000
ICE GBR HUN FIN GRC NZL AUS CAN
-800
-600
-400
-200
0
200
400
600
800
1000
Gross liabilitiesGross assetsNet foreign assets
Source: International Financial Statistics; and Fund staff calculations.
Figure A2b. Banks: Total Foreign Liabilities, 2007
(In percent of total assets)
0%
10%
20%
30%
40%
50%
60%
70%
80%
90%
100%
IRL PRT GBR GRC FIN ICE NZL ESP HUN AUT AUS CAN
0%
10%
20%
30%
40%
50%
60%
70%
80%
90%
100%
Sources: Reserve Bank of New Zealand; International Financial Statistics; Bankscope; and Fund staff estimates.
Figure A2c. Banks: Total Assets, 2007 (In percent of GDP)
0
200
400
600
800
1000
1200
1400
ICE IRL GBR AUT ESP PRT AUS FIN NZL CAN GRC HUN
0
200
400
600
800
1000
1200
1400
Sources: World Economic Outlook; Bankscope; and Fund staff estimates.
Figure A2d. 5-year Sovereign CDS Spreads
(Basis points)
0
100
200
300
400
500
600
700
Aug-08 Sep-08 Oct-08 Nov-08 Dec-08 Jan-09 Feb-09 Mar-09
0
200
400
600
800
1000
1200
1400
1600
1800
2000
Australia GreeceIreland New ZealandPortugal SpainIceland (RHS)
Source: Bloomberg.
Figure A2e. House Price Index(2002 = 100)
40
60
80
100
120
140
160
180
200
220
240
Mar-00 Mar-01 Mar-02 Mar-03 Mar-04 Mar-05 Mar-06 Mar-07 Mar-08 Mar-09
40
60
80
100
120
140
160
180
200
220
240
Australia Canada Iceland IrelandNew Zealand United Kingdom United States
Source: Haver Analytics; and Fund staff calculations.
Figure A2f. Gross Public Debt, 2008
(In percent of GDP)
0
10
20
30
40
50
60
70
80
90
100
GRC HUN PRT USA CAN AUT GBR ESP FIN IRL ICE NZL AUS
0
10
20
30
40
50
60
70
80
90
100
Sources: International Financial Statistics and World Economic Outlook;and Fund staff calculations.

26
References
Brooks, R., 2008, “Assessing the Impact of a Disruption to Capital Inflows on New Zealand,” in New Zealand: Selected Issues, IMF Country Report No. 08/164 (Washington: International Monetary Fund).
Harrison, I., and C. Mathew, 2008, “Project TUI: A Structural Approach to the
Understanding and Measurement of Residential Mortgage Lending Risk,” Reserve Bank of New Zealand, http://www.fdic.gov/bank/analytical/cfr/2008/jun/Project_TUI-Final.pdf
International Monetary Fund, 2004, New Zealand: Financial System Stability Assessment,
IMF Country Report No. 04/126 (Washington: International Monetary Fund). ______, 2008, Global Financial Stability Report: October 2008 (Washington: International
Monetary Fund). ______, 2009, “Global Economic Policies and Prospects,” Note prepared for the Group of
Twenty Meeting of the Ministers and Central Bank Governors, March, http://www.imf.org/external/np/g20/pdf/031909a.pdf
Reserve Bank of New Zealand, 2008, Financial Stability Report: November 2008
(Wellington: Reserve Bank of New Zealand). Rozhkov, D., 2007, “Analysis of Vulnerabilities,” in New Zealand: Selected Issues, IMF
Country Report No. 07/151 (Washington: International Monetary Fund). ______, 2008, “Australian Banks: Weathering the Global Storm,” in Australia: Selected
Issues, IMF Country Report No. 08/311 (Washington: International Monetary Fund). Statistics New Zealand, 2009, Balance of Payments and International Investment Position:
Year Ended 31 March 2008, January (Wellington: Statistics New Zealand).
Related Documents