New York City September 22, 2015

New York City September 22, 2015. Nutrition driving the SDGs Progress on nutrition status Progress on actions Financing and capacity Climate Food Systems.
Jan 03, 2016
Welcome message from author
This document is posted to help you gain knowledge. Please leave a comment to let me know what you think about it! Share it to your friends and learn new things together.
Transcript

New York City September 22, 2015

• Nutrition driving the SDGs
• Progress on nutrition status
• Progress on actions• Financing and
capacity• Climate• Food Systems• Business• Accountability & Data• Calls to Action
Outline
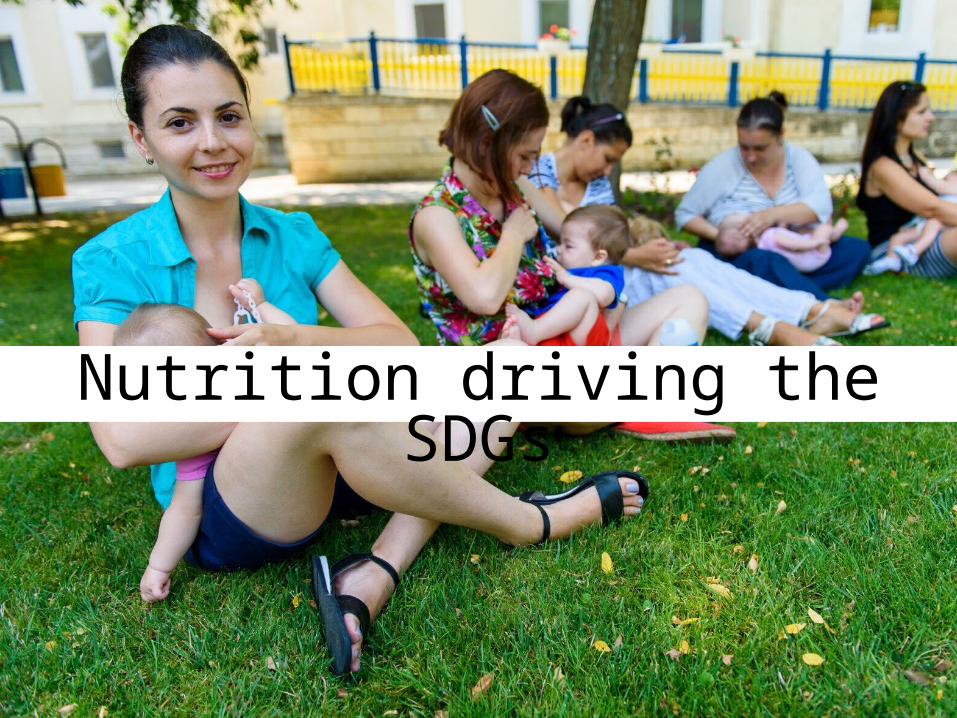
Nutrition driving the SDGs

Alive and
thriving
Intergenerational
equity
Human Rights
Economic Benefits
Why invest in improving nutrition?
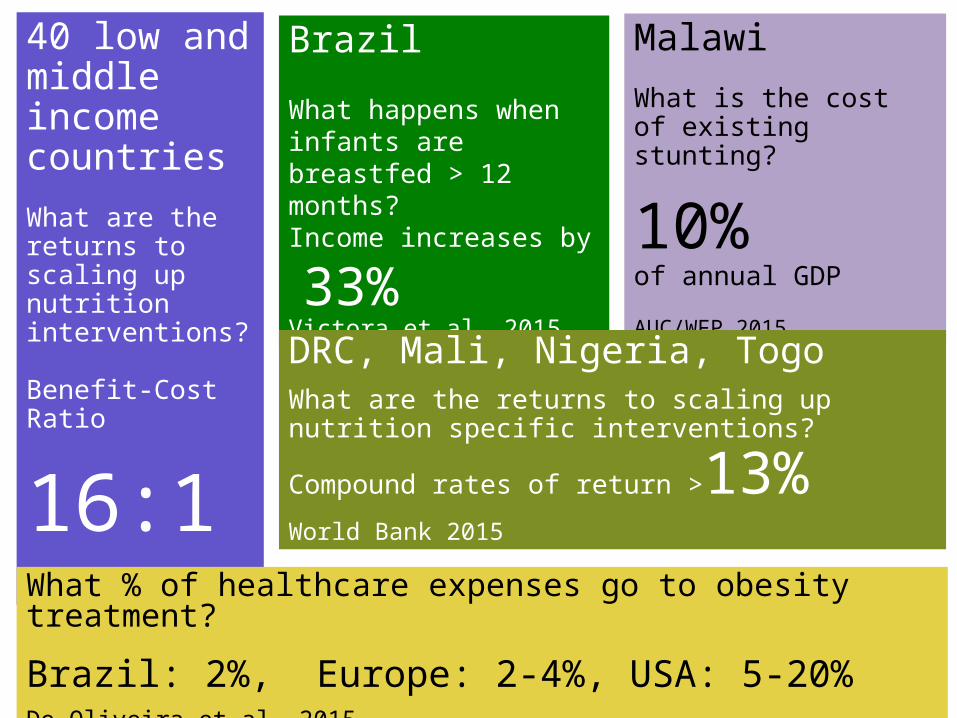
40 low and middle income countries
What are the returns to scaling up nutrition interventions?
Benefit-Cost Ratio
16:1IFPRI 2014
Brazil
What happens when infants are breastfed > 12 months?Income increases by
33% Victora et al. 2015
Malawi
What is the cost of existing stunting?
10% of annual GDP
AUC/WFP 2015
DRC, Mali, Nigeria, TogoWhat are the returns to scaling up nutrition specific interventions?
Compound rates of return >13% World Bank 2015
What % of healthcare expenses go to obesity treatment?
Brazil: 2%, Europe: 2-4%, USA: 5-20% De Oliveira et al. 2015
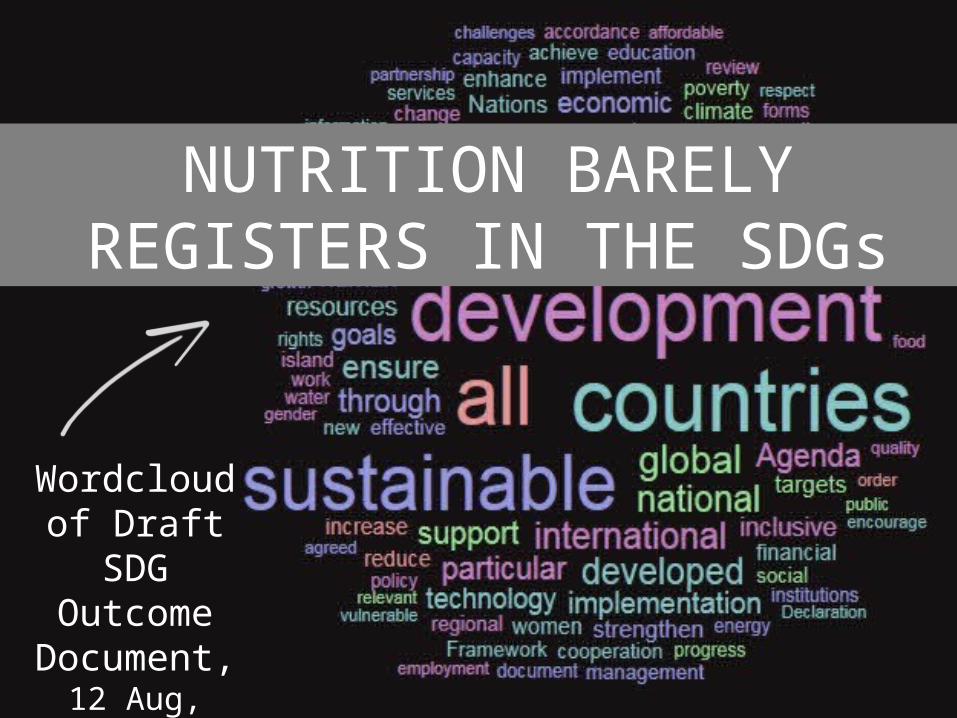
Wordcloud of Draft
SDG Outcome
Document, 12 Aug, 2015
NUTRITION BARELY REGISTERS IN THE SDGs
Progress on Nutrition Status

Progress on stunting reduction
2014 2015
19 15
6660
24 39On course
Off course, some progress
Off course, no progress
Number of countries on course to meet global (WHA) targets
#NutritionReport

Some progress on wasting reduction
2014 2015
64 63
59 67
Off course
#REF!
Number of countries on course to meet global (WHA) targets

2014 2015
25 24
19 22
24 24
3139 On course, good
progressOn course, at riskOff course, some progressOff course, no progress
Some progress on Under 5 overweight reduction
Number of countries on course to meet global (WHA) targets

Exclusive Breastfeeding RatesLess progress. Not much data. Reversals
even. Number of countries on course to meet global (WHA) targets
32
10
30
6 on course
off course, some progress
off course, no progress
off course, reversal
Countries experiencing a reversal: Cuba, Egypt, Kyrgyzstan, Mongolia, Nepal and Turkey
N=78

But… number of countries that have reduced
adult obesity rates
WHO: 2010-2014

39Stunting children under 5
Wastingchildren under 5
Overweightchildren under 5
Anemiawomen aged 15-49 yearsExclusive Breastfeeding, 0-6 months
Adult Overweight + Obesity (BMI≥ 25)
Adult Obesity (BMI≥ 30)
Adult Diabeteshigh blood sugar
601579
63
84
8
115
67
39
5
32
63
242224
180
1036
190
193
185 53
Global Target
Missing data Off course, little/no progress Off course, some progress On courseOn course, at risk
Number of countries at various stages of progress against global targets on nutrition
3
Progress on Nutrition Actions
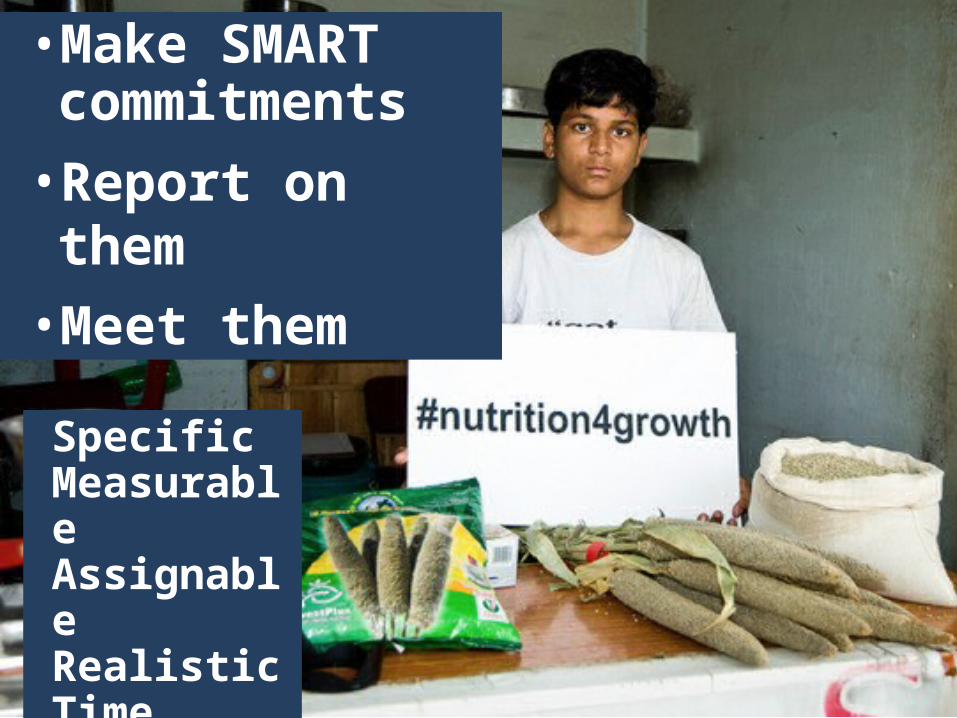
• Make SMART commitments
• Report on them• Meet them
SpecificMeasurableAssignableRealisticTime Bound
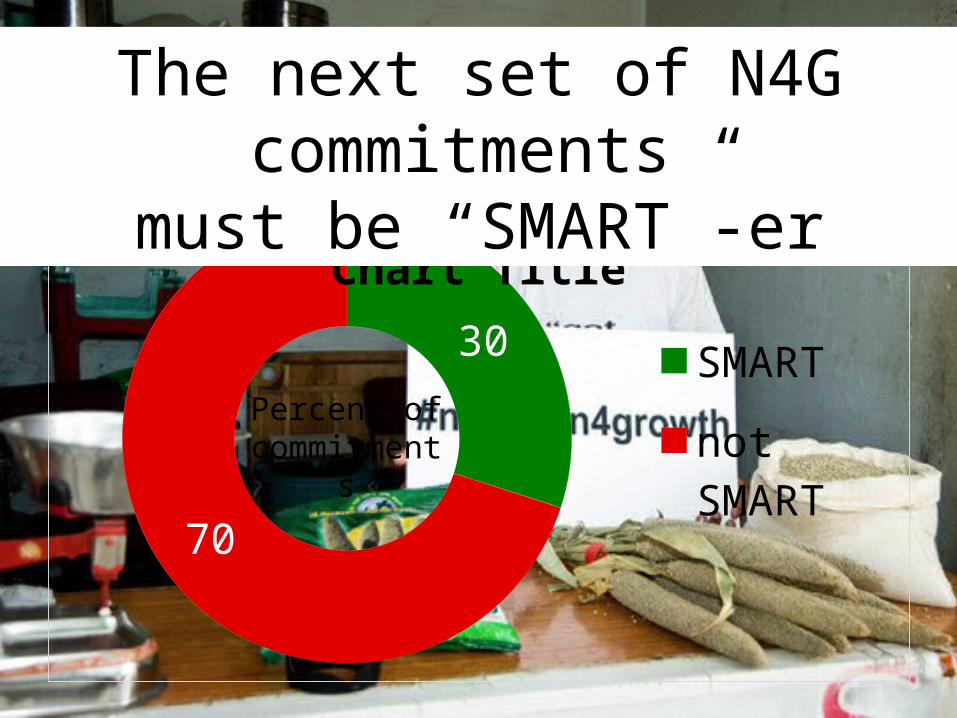
30
70
Chart Title
SMART
not SMART
Percent of commitments
The next set of N4G commitments
must be “SMART”-er

2014 commitments
2015 commitments
42
44
9
10
40
25
10
21
met/on course off coursenot clear no response
Percent of commitments
Too many N4G signatories failed to report on
commitments they made
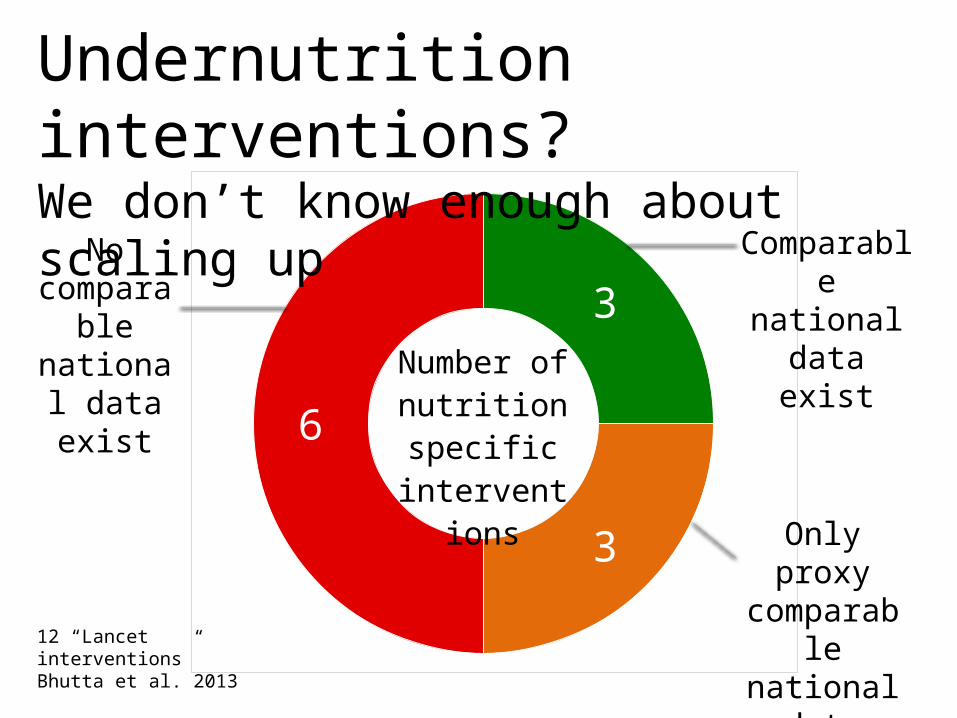
3
3
6Number of nutrition specific
interven-tions
Undernutrition interventions? We don’t know enough about scaling upNo compara
ble national
data exist
Comparable national data exist
Only proxy
comparable
national data exist
12 “Lancet interventions” Bhutta et al. 2013
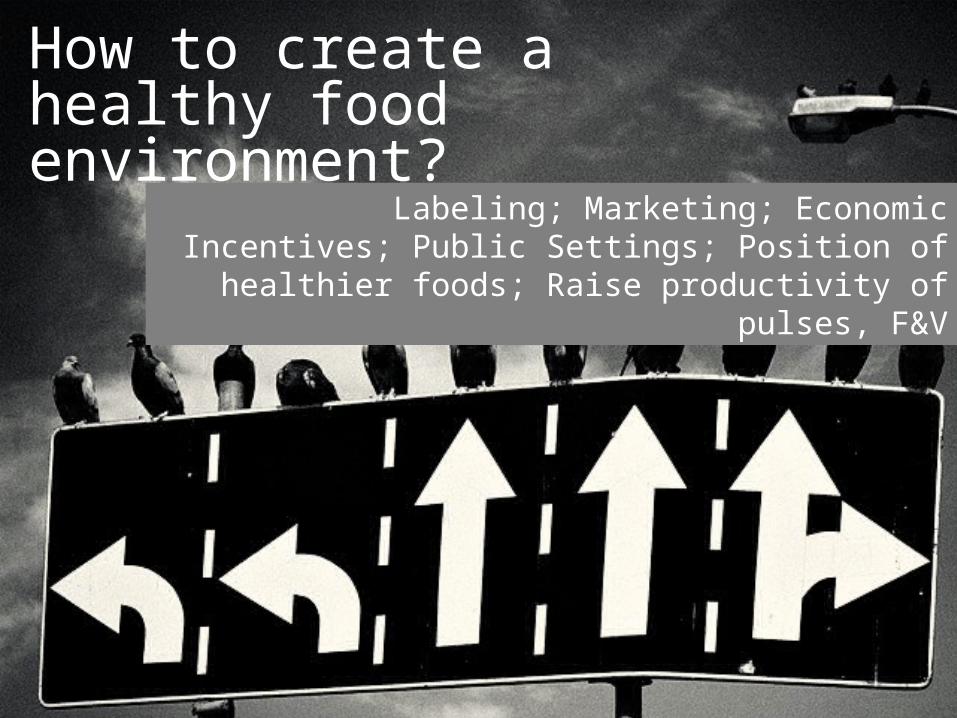
How to create a healthy food environment?
Labeling; Marketing; Economic Incentives; Public Settings; Position of healthier foods;
Raise productivity of pulses, F&V

63 %High income
Upper middle 27 %
Lower middle 10 %
Low income 0 %
But few middle-to-low income countries have implemented policies
to improve food environments
Share of 67 countries that have implemented policies, by income level

Finance

Every country will need to increase its spending on nutrition policies &
programs
Domes

SUN member countries
stepped up in 2015
Countries: How much of their budgets are allocated to nutrition?
Bangladesh, Benin, Burundi, Burkina Faso, Cameroun, Chad, Comoros, Congo DRC, Costa Rica, Cote D’Ivoire, Ghana, Guatemala, Indonesia, Kenya, Lesotho, Madagascar, Maharashtra, Mauritania, Nepal, Pakistan, Peru, Philippines, South Sudan, Tajikistan, The Gambia, Togo, Uganda, Vietnam, Yemen, Zambia

Domestic Budget Allocations to Nutrition as % of total Government BudgetActual 1.3%
Upper bound 4.1%
% are medians
14 countries completed the exercise
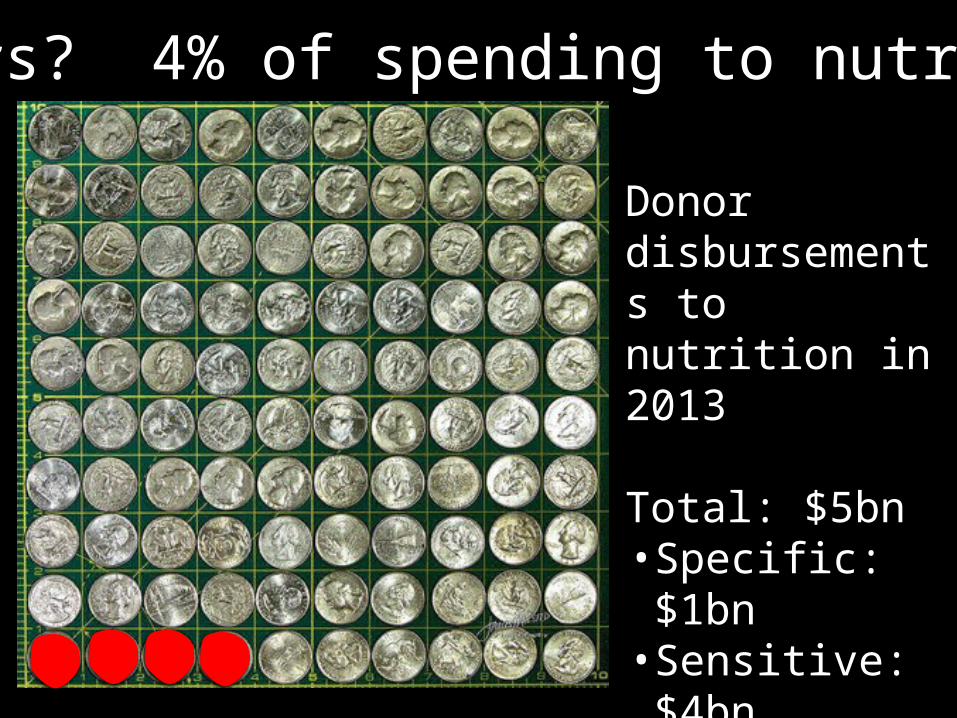
Donor disbursements to nutrition in 2013
Total: $5bn• Specific: $1bn
• Sensitive: $4bn
Donors? 4% of spending to nutrition
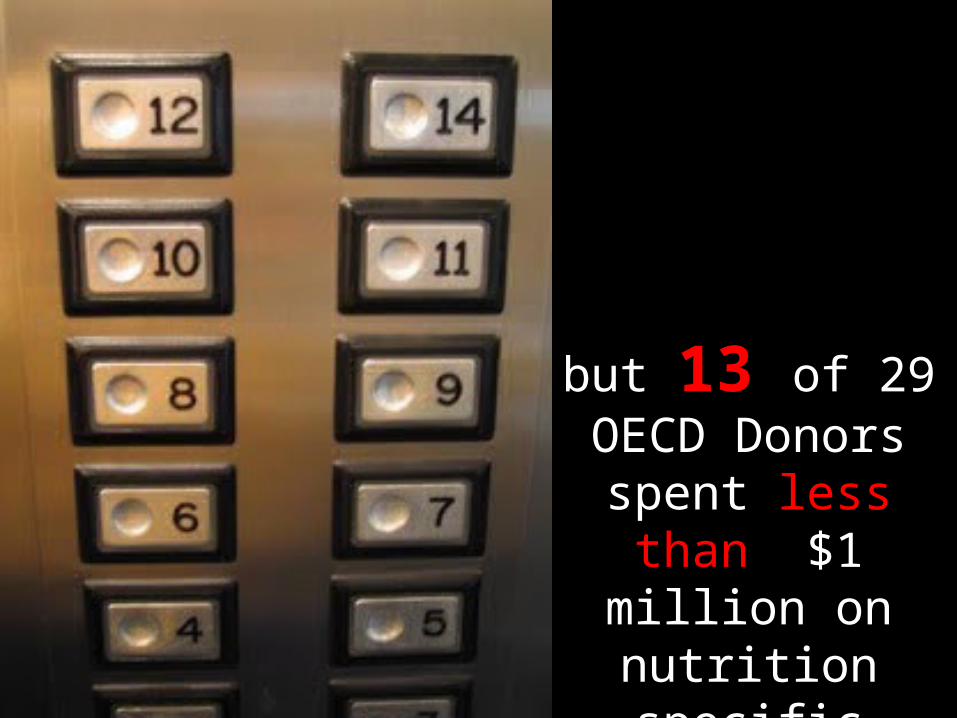
but 13 of 29 OECD Donors
spent less than $1 million on
nutrition specific
interventions in 2013

More resources are needed for nutritionto meet WHA undernutrition targets
Spending on nutrition specific interventions, 2015-2025
x x
Governments Donors
R4D and World Bank estimates for stunting reduction

Climate Nutrition

2005-6
Jan Feb Mar April
May
June
July Aug
Sept
Oct Nov
Dec
Height-for-Age Z-Scores of children under 3 in
India
NFHS Data
Lokshin and Radyakin 2012
Nutrition status is already shaped by seasons. What havoc will climate change cause?
0.2 is the median impact of complementary feeding interventions

Vegetarian
Pescetarian
Mediterranean
Global average diet
190
240
320
340
Approx. per capita lifecycle greenhouse gas emissions; Kg of CO2-ceq/person/yearSource: Adapted from Tilman and Clark 2014, Fig 4.1
Diet Choices Affect Efforts to Mitigate Climate Change

Food Systems
Poor Diet is now the number 1 risk factorin the global burden of disease
Lancet, September 10, 2015

Food Consumption
Diversity
Health and Nutrition
StatusFood
Affordability
Environ-mental
Sustainability
Dashboard for Food Systems(13 indicators)
Food SystemsHow nutrition-friendly are yours?
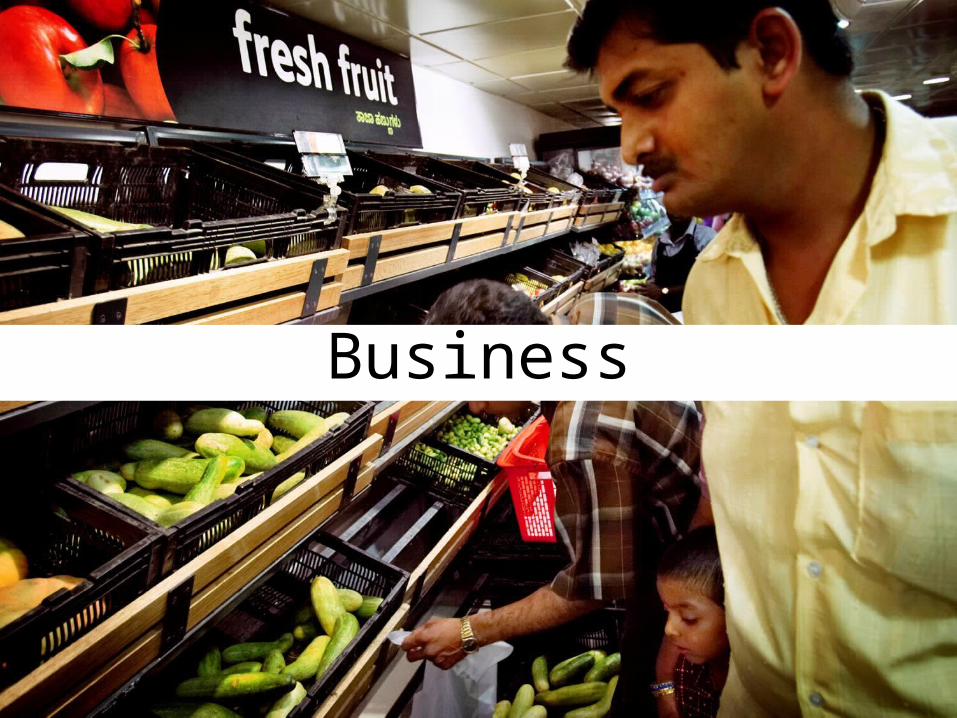
Business

Trust
Engage
Which Comes First?
Business and Nutrition

Transparency +
Monitoring Trust
•Register of PPPs
•Nutrition Transparency Initiative
•Enforcement Litigation Fund
•ATNI-type disclosures
•Public research Initiatives
Opportunities to advance nutrition
•Mobile phones
•Health•Logistics
•Food
but…there is a massive dialogue gap

FAO, UNICEF, WHO and WFP, together with others, should
• establish an inclusive, time-bound Commission
• to develop a shared understanding of the roles and responsibilities of business in nutrition
Once the WHO Framework for Engagement with Non-State Actors (FENSA) is completed in 2016…

Accountability and Data

Each of the 193 countries has a nutrition profile like this
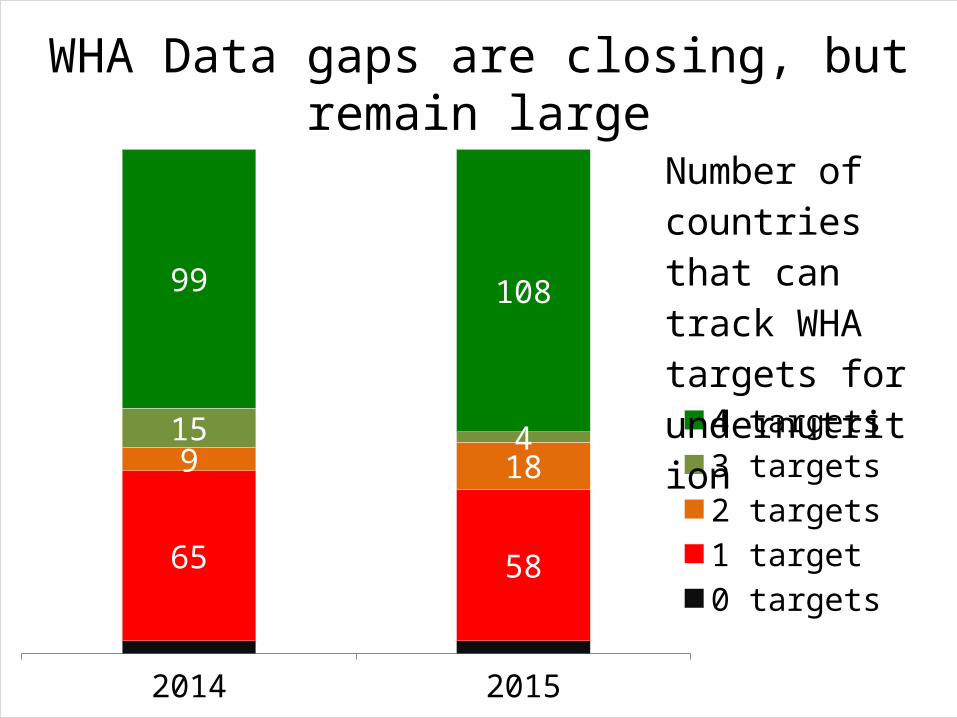
2014 2015
65 58
9 1815 4
99 108
4 targets3 targets2 targets1 target0 targets
Number of countries that can track WHA targets for undernutri-tion
WHA Data gaps are closing, but remain large

Calls to Action

Calls to Action1. Elevate nutrition across the SDGs2. Strengthen national accountability on
nutrition3. Strengthen the Nutrition for Growth
commitments4. Implement actions to address malnutrition 5. Find more funding for nutrition action 6. Build alliances between nutrition & climate
communities 7. Develop indicators for nutrition friendly food
systems8. Build a greater shared understanding of the
roles and responsibilities of business in nutrition
9. Identify the data gaps that hinder action—and fill them

GN
R
Want “Designer” Babies? Invest in Nutrition!

Thank You
Related Documents