New York City Police Department 0 100,000 200,000 300,000 400,000 500,000 600,000 700,000 800,000 Complaints 1968 1969 1970 1971 1972 1973 1974 1975 1976 1977 1978 1979 1980 1981 1982 1983 1984 1985 1986 1987 1988 1989 1990 1991 1992 1993 1994 1995 1996 1997 1998 Calendar Year Total FBI Index Crime Complaints Index Crimes include murder and non-negligent manslaughter, robbery, forcible rape, aggravated assault, burglary, larceny theft, and grand larceny auto. Includes official data as per Crime Analysis Unit reports for 1968-1998. Data for 1998 is preliminary and subject to change. No comparable data is available prior to 1968. 1998 saw the lowest number of index crimes of any year since prior to 1968, when modern reporting methods were instituted.

Welcome message from author
This document is posted to help you gain knowledge. Please leave a comment to let me know what you think about it! Share it to your friends and learn new things together.
Transcript

New York City Police Department0
100,
000
200,
000
300,
000
400,
000
500,
000
600,
000
700,
000
800,
000
Co
mp
lain
ts
1968 1969 1970 1971 1972 1973 1974 1975 1976 1977 1978 1979 1980 1981 1982 1983 1984 1985 1986 1987 1988 1989 1990 1991 1992 1993 1994 1995 1996 1997 1998
Calendar Year
Total FBI Index Crime Complaints
Index Crimes include murder and non-negligent manslaughter, robbery, forcible rape, aggravated assault, burglary, larceny theft, and grand larceny auto.Includes official data as per Crime Analysis Unit reports for 1968-1998. Data for 1998 is preliminary and subject to change. No comparable data is available prior to 1968.
1998 saw the lowest number of index crimes of any year since prior to 1968, when modern reporting methods were instituted.

Rank
PercentGreater Than
New York
Total FBI Index Crimes per 100,000 Populationfor 197 Cities with Population over 100,000
January-June 1998
Crime in Selected Cities
Crimes per 100,000
1 Orlando 212.4
2 Atlanta 208.5
3 St. Louis 198.4
4 Topeka 181.9
5 Miami 175.5
6 Tampa 168.8
7 Fort Lauderdale 167.0
8 Detroit 162.8
9 Kansas City 156.5
10 Macon 154.9
13 Durham 146.9
19 Salt Lake City 132.1
20 Little Rock 132.0
25 Seattle 129.2
29 Baltimore 123.6
34 Phoenix 113.6
41 Dallas 108.0
45 Washington D.C. 104.1
47 New Orleans 101.9
48 Newark 101.4
64 Rochester 81.9
90 Buffalo 58.4
105 Albany 45.5
108 Syracuse 44.6
117 Boston 37.0
125 Pittsburgh 32.6
139 Los Angeles 22.6
140 Denver 21.1
150 San Diego 10.3
163 New York 0.0Based on preliminary FBI Uniform Crime Reports
2,150.8
2,373.2
2,605.6
2,637.8
2,851.8
2,947.4
3,109.5
3,128.8
3,407.4
3,912.3
4,330.8
4,341.8
4,389.2
4,474.4
4,593.7
4,809.8
4,928.6
4,989.1
4,991.0
5,311.3
5,483.3
5,516.0
5,652.6
5,741.9
5,781.6
5,925.2
6,062.1
6,417.2
6,636.1
6,718.8
New York City Police Department
548
636
631
654
746
986
1,04
3 1,11
71,
466
1,69
11,
680
1,55
4 1,64
51,
622
1,55
71,
504
1,73
3 1,81
41,
826
1,66
81,
622
1,45
01,
384
1,58
2 1,67
21,
896
1,90
5
2,24
52,
154
1,99
5
1,94
61,
561
1,17
798
377
0
629
0
500
1,000
1,500
2,000
2,500
Rep
ort
s o
f M
urd
er a
nd
No
n-N
eglig
ent
Man
slau
gh
ter
1963
1964
1965
1966
1967
1968
1969
1970
1971
1972
1973
1974
1975
1976
1977
1978
1979
1980
1981
1982
1983
1984
1985
1986
1987
1988
1989
1990
1991
1992
1993
1994
1995
1996
1997
1998
*
Calendar Year
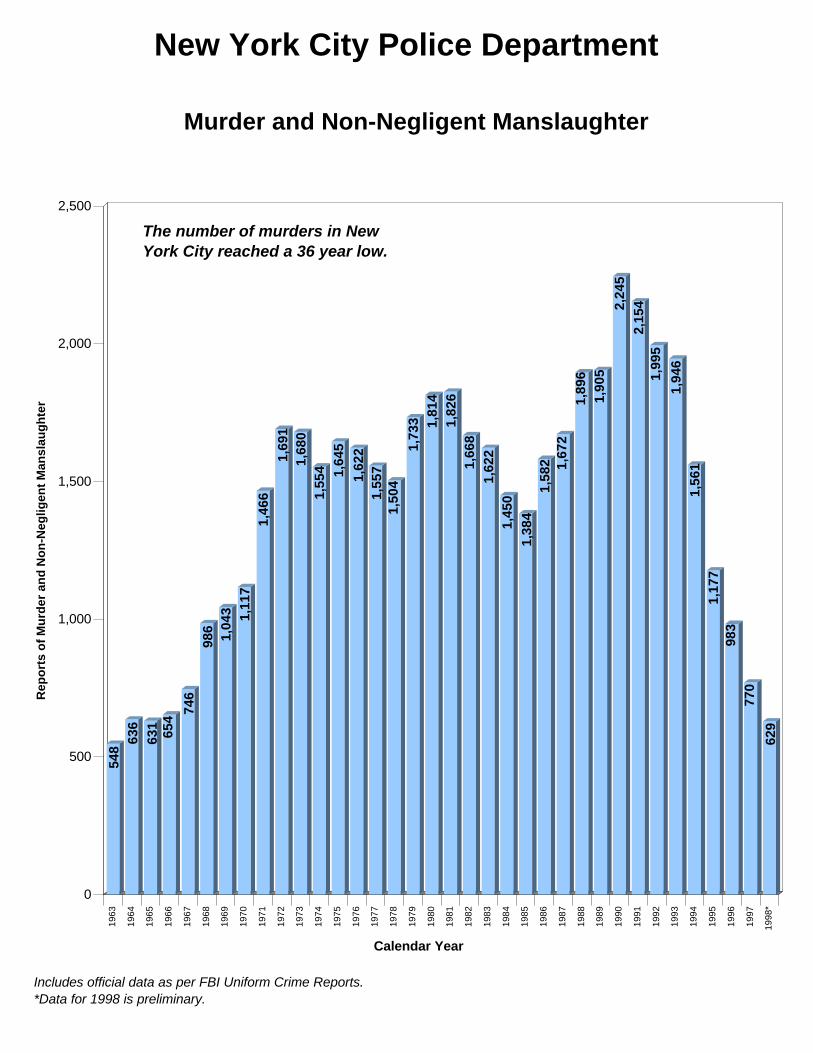
Murder and Non-Negligent Manslaughter
The number of murders in New York City reached a 36 year low.
Includes official data as per FBI Uniform Crime Reports.*Data for 1998 is preliminary.

New York City Police Department
5,862
4,973
3,769
2,930
2,262
2,004
0
2,000
4,000
6,000
Nu
mb
er o
f V
icti
ms
1993 1994 1995 1996 1997 1998
Reports of Shooting VictimsCalendar 1993-1998
The number of shooting victims fell by 65.8% from Calendar 1993 to Calendar 1998 and by 11.4% from Calendar 1997 to Calendar 1998.
Based on preliminary data.

New York City Police Department
10,366
9,891
9,318
8,339
5,000
6,000
7,000
8,000
9,000
10,000
11,000
Fel
on
ies
1995 1996 1997 1998
Crime in Housing DevelopmentsSeven Major Felonies *
Calendar 1995-1998
The merger of the Housing Police with the NYPD took place in April 1995. Major felony complaints in housing developments decreased by 20% from Calendar 1995 to Calendar 1998.
*Murder, Robbery, Rape First Degree, Felonious Assault, Burglary, Grand Larceny, Grand Larceny Motor Vehicle.
Figures are based on preliminary data

New York City Police Department
6,218
4,776
3,000
3,500
4,000
4,500
5,000
5,500
6,000
6,500
Fel
on
ies
1997 1998
Crime in Transit SystemMajor Felonies *
Calendar 1997-1998
Major felony complaints in the Transit System have decreased by 23.2% from Calendar 1997 to Calendar 1998.
*Murder, Robbery, Rape First Degree, Felonious Assault, Burglary, Grand Larceny.
Figures are based on preliminary data

New York City Police Department
111,618
94,523
71,798
59,440
51,337
43,347
0
20,000
40,000
60,000
80,000
100,000
120,000
Gra
nd
Lar
cen
y A
uto
1993 1994 1995 1996 1997 1998
Grand Larceny AutoCalendar 1993-1998
Grand Larceny Auto declined by 61% from Calendar 1993 to Calendar 1998 and by 16% from Calendar 1997 to Calendar 1998.
Figures are based on preliminary data.

New York City Police Department
0.00
0.20
0.40
0.60
0.80
1.00
1.20
1.40
1.60
1.80
2.00
Fat
al S
ho
oti
ng
s p
er 1
,000
Off
icer
s
1973
1974
1975
1976
1977
1978
1979
1980
1981
1982
1983
1984
1985
1986
1987
1988
1989
1990
1991
1992
1993
1994
1995
1996
1997
1998
Calendar Year
Fatal Shootings by Police Officers (Ratio per 1,000 Officers)
In 1998 the incidence of fatal shootings by police officers -- 0.48 per 1,000 Officers -- was the lowest since 1985, and the second lowest in the 26 years for which data is available.
No comparable data is available prior to 1973.

New York City Police Department
309,587
366,110
395,609 403,659
1995 1996 1997 1998
Total Citywide Arrest Data vs. Shots Fired by Officers
Calendar 1995-1998
Citywide Arrests Shots Fired by Officers
1,728
856
1,040
1,292
-25.3%-19.4%
-17.7%
While citywide arrests have increased by 30.4 percent, the number of shots fired by police officers have decreased by 50.5 percent from 1995 to 1998.
Arr
ests
Sh
ots F
ired
Percentages indicate increase or decrease from the previous year. Calendar 1998 figures are preliminary.
New York City Police Department
95,229
81,360
70,035
65,23765,043
83,842
96,303
102,364
105,757
124,000
50,000
60,000
70,000
80,000
90,000
100,000
110,000
120,000
130,000
Arr
ests
1989 1990 1991 1992 1993 1994 1995 1996 1997 1998*
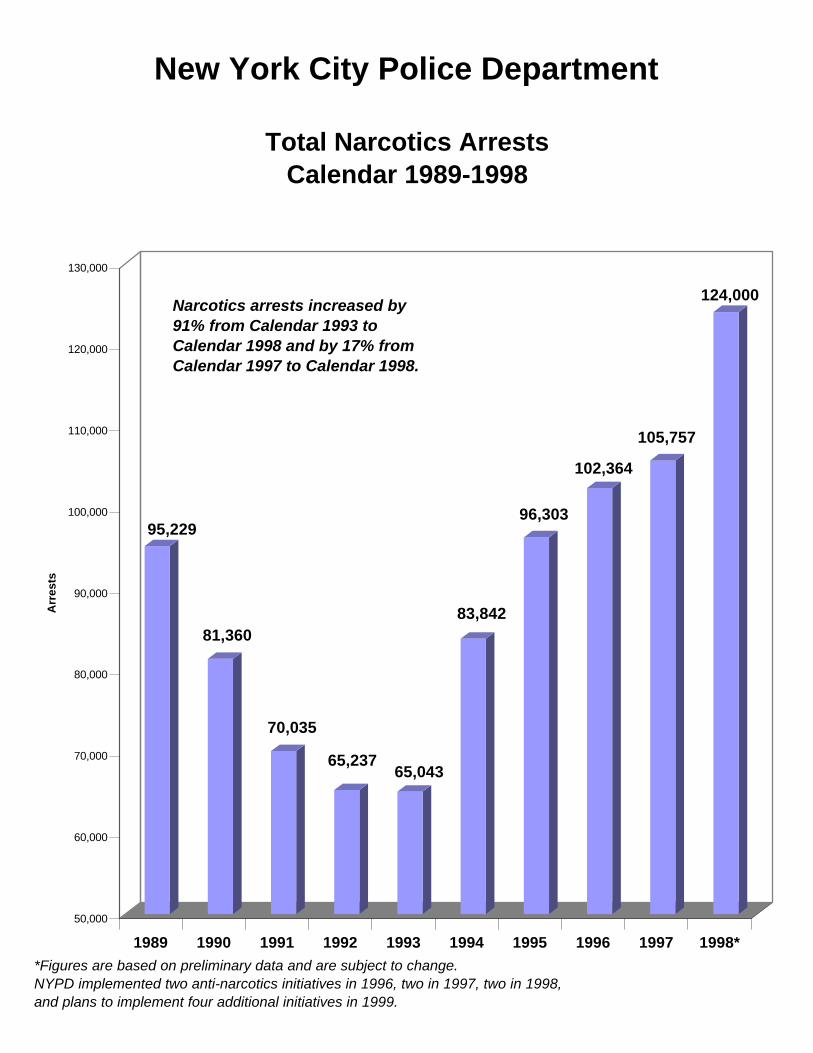
Total Narcotics ArrestsCalendar 1989-1998
*Figures are based on preliminary data and are subject to change.NYPD implemented two anti-narcotics initiatives in 1996, two in 1997, two in 1998, and plans to implement four additional initiatives in 1999.
Narcotics arrests increased by 91% from Calendar 1993 to Calendar 1998 and by 17% from Calendar 1997 to Calendar 1998.

New York City Police Department
8:18
9:36
10:00
10:30
0:00
2:00
4:00
6:00
8:00
10:00
12:00
Min
ute
s:S
eco
nd
s
Jul-Oct 1995 Jul-Oct 1996 Jul-Oct 1997 Jul-Oct 1998
Average Response Time to Crimes in Progress (in minutes)
July-October 1995-1998

Fire Department
8:17
7:16
7:01
6:12
4:50
4:29
4:584:46
4:20 4:16
2:24
3:36
4:48
6:00
7:12
8:24
Min
ute
s
EMS toSegments 1-3
Combined EMS/CFRDto Segment 1-3
Fire Unit to Medical(CFRD)
Fire Unit to AllEmergencies
Structural Fire
Citywide Average Response Times(in minutes)
July-October 1997-1998
JUL-OCT 97 JUL-OCT 98

Fire Department
5:06
4:55
4:35
4:20
4:52
4:51
5:23
5:00
5:13
5:04
4:58
4:46
2:24
2:52
3:21
3:50
4:19
4:48
5:16
5:45
Min
ute
s
BRONX BROOKLYN MANHATTAN QUEENS STATEN ISLAND CITYWIDE
Average Response Time by Fire Units Only to All Emergencies by Borough
July-October 1997-1998
Jul-Oct 1997 Jul-Oct 1998

Fire Department
4:21
4:23
3:59
3:52
4:19
4:13
5:00
4:45 4:
47
4:57
4:20
4:16
2:24
2:52
3:21
3:50
4:19
4:48
5:16
min
ute
s
BRONX BROOKLYN MANHATTAN QUEENS STATEN ISLAND CITYWIDE
Structural Fire Response Time by Borough July-October 1997-1998
Jul-Oct 1997 Jul-Oct 1998

Fire Department
9:29
6:27
8:34
6:13
8:39
6:02
8:28
6:08
8:05
6:06
8:45
6:12
Min
ute
s
Bronx Brooklyn Manhattan Queens Staten Island Citywide
Response Time to Segment 1-3Life-Threatening Medical Emergencies
(Combined EMS/Fire)* by Borough(in minutes)
Jul-Oct 1995EMS Only/Pre-Merger
Jul-Oct 1998EMS/CFRD Combined
*In the Fire Department's Certified First Responder Program, fire engine units respond to Segment 1-3 life-threatening medical emergencies only.
Fire Department
0
50
100
150
200
250
300
350
Fat
alit
ies
1946
1947
1948
1949
1950
1951
1952
1953
1954
1955
1956
1957
1958
1959
1960
1961
1962
1963
1964
1965
1966
1967
1968
1969
1970
1971
1972
1973
1974
1975
1976
1977
1978
1979
1980
1981
1982
1983
1984
1985
1986
1987
1988
1989
1990
1991
1992
1993
1994
1995
1996
1997
1998
Calendar Year
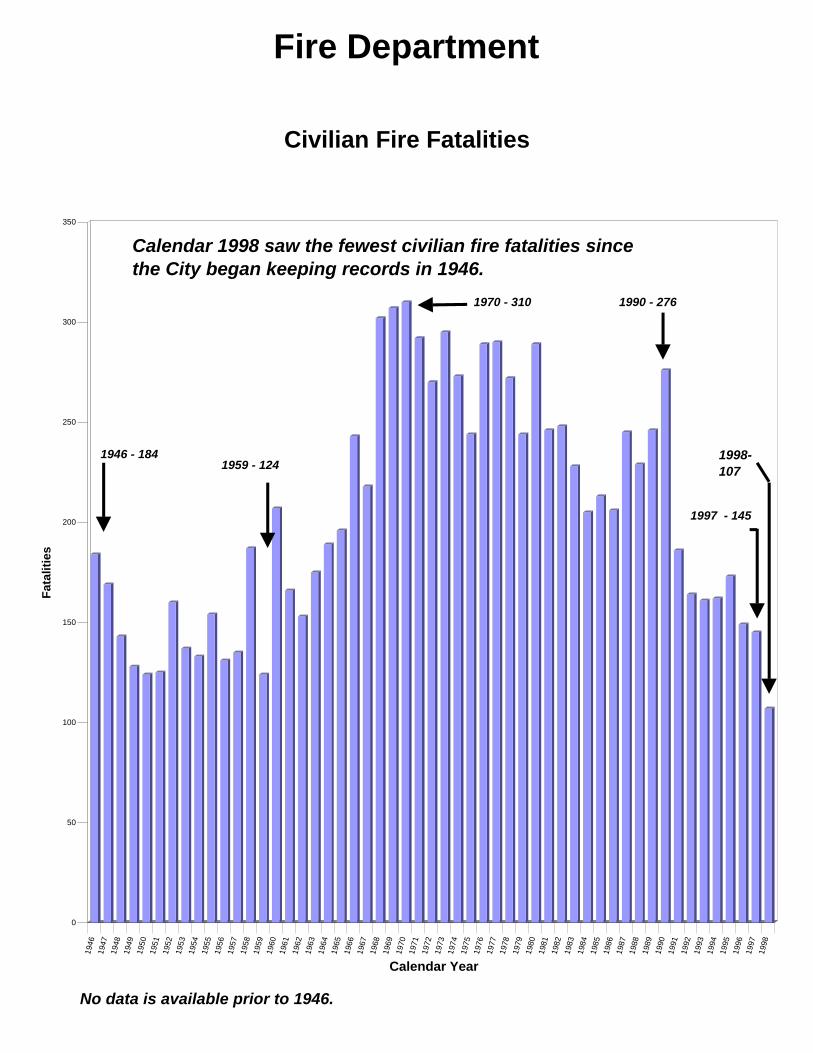
Civilian Fire Fatalities
Calendar 1998 saw the fewest civilian fire fatalities since the City began keeping records in 1946.
No data is available prior to 1946.
1997 - 145
1990 - 2761970 - 310
1959 - 1241946 - 184 1998-
107

Fire Department
878
612
484
532
390
0
200
400
600
800
1,000
Bu
rns
1994 1995 1996 1997 1998
Firefighter Burns Calendar 1994-1998
Bunker Gear Introduced February 1995
Fire Department
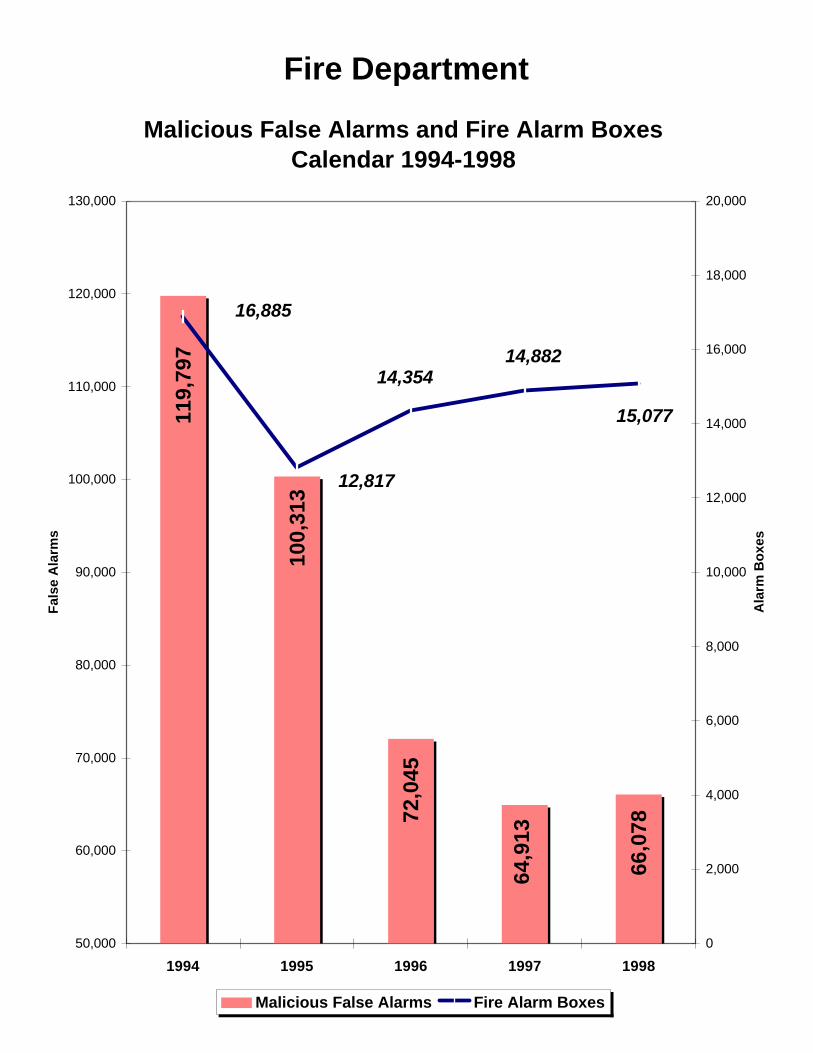
Malicious False Alarms and Fire Alarm BoxesCalendar 1994-1998
119,
797
100,
313
72,0
45
64,9
13
66,0
78
12,817
15,077
14,88214,354
16,885
50,000
60,000
70,000
80,000
90,000
100,000
110,000
120,000
130,000
1994 1995 1996 1997 1998
Fal
se A
larm
s
0
2,000
4,000
6,000
8,000
10,000
12,000
14,000
16,000
18,000
20,000
Ala
rm B
oxe
s
Malicious False Alarms Fire Alarm Boxes

Department of Correction
18,73618,161
20,069
17,47218,093
0
5,000
10,000
15,000
20,000
25,000
Po
pu
lati
on
Jul-Oct 1994 Jul-Oct 1995 Jul-Oct 1996 Jul-Oct 1997 Jul-Oct 1998
Average Daily Inmate Population

Department of Correction
497
136 134
82
400
50
100
150
200
250
300
350
400
450
500
Sta
bb
ing
s an
d S
lash
ing
s
1994 1995 1996 1997 1998
Violence Incidents (Stabbings and Slashings)
July-October 1994-1998
Violence incidents have been reduced by 92% since July-October 1994 and by 51% since last year.

Department of Correction
69.5% 69.8%
79.1%
88.9%
0%
20%
40%
60%
80%
100%
Rep
ort
ed D
eliv
ery
Rat
e
1995 1996 1997 1998
Overall On-Time Court Delivery RateCalendar Year

Department of Probation
5,427
6,4716,801
10,338
2,000
3,000
4,000
5,000
6,000
7,000
8,000
9,000
10,000
11,000
Ch
ecks
Jul-Oct 1995 Jul-Oct 1996 Jul-Oct 1997 Jul-Oct 1998
Field Checks of Adult Probationers
Field checks of adult probationers increased 52 percent from 1997 to 1998.

Department of Probation$1
,810
,000
5,888
$1,5
93,0
00
5,807
$1,7
16,0
00
5,592
$1,9
90,0
006,493
$2,4
31,0
00
8,253
$2,4
40,0
00
8,912
1993 1994 1995 1996 1997 1998
Restitution Collected for Crime VictimsCalendar Year 1993-1998
Dollar Amount Number of Payments

Civilian Complaint Review Board
1,761
2,101
1,762
1,665
500
700
900
1,100
1,300
1,500
1,700
1,900
2,100
2,300
Co
mp
lain
ts
July-October 1995 July-October 1996 July-October 1997 July-October 1998
Total Complaints Received Within Jurisdiction *
* Figures show complaints in the categories falling within CCRB's jurisdiction (Force, Abuse of Authority, Discourtesy, Offensive Language)

Civilian Complaint Review Board
1,438
924
792
0
500
1,000
1,500
Alle
gat
ion
s
Jul-Oct 1996 Jul-Oct 1997 Jul-Oct 1998
Use of Force AllegationsJuly - October 1996 - 1998
Use of force allegations decreased 50 percent from July-October 1996 to July-October 1998.
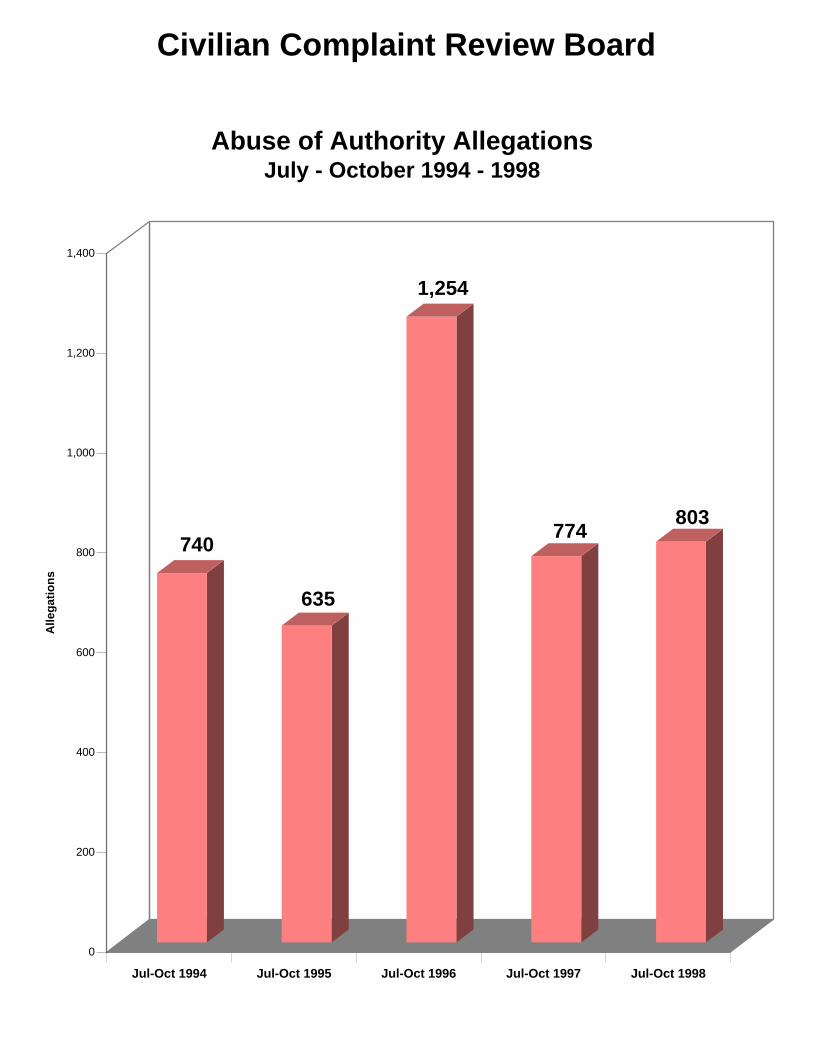
Civilian Complaint Review Board
740
635
1,254
774803
0
200
400
600
800
1,000
1,200
1,400
Alle
gat
ion
s
Jul-Oct 1994 Jul-Oct 1995 Jul-Oct 1996 Jul-Oct 1997 Jul-Oct 1998
Abuse of Authority AllegationsJuly - October 1994 - 1998
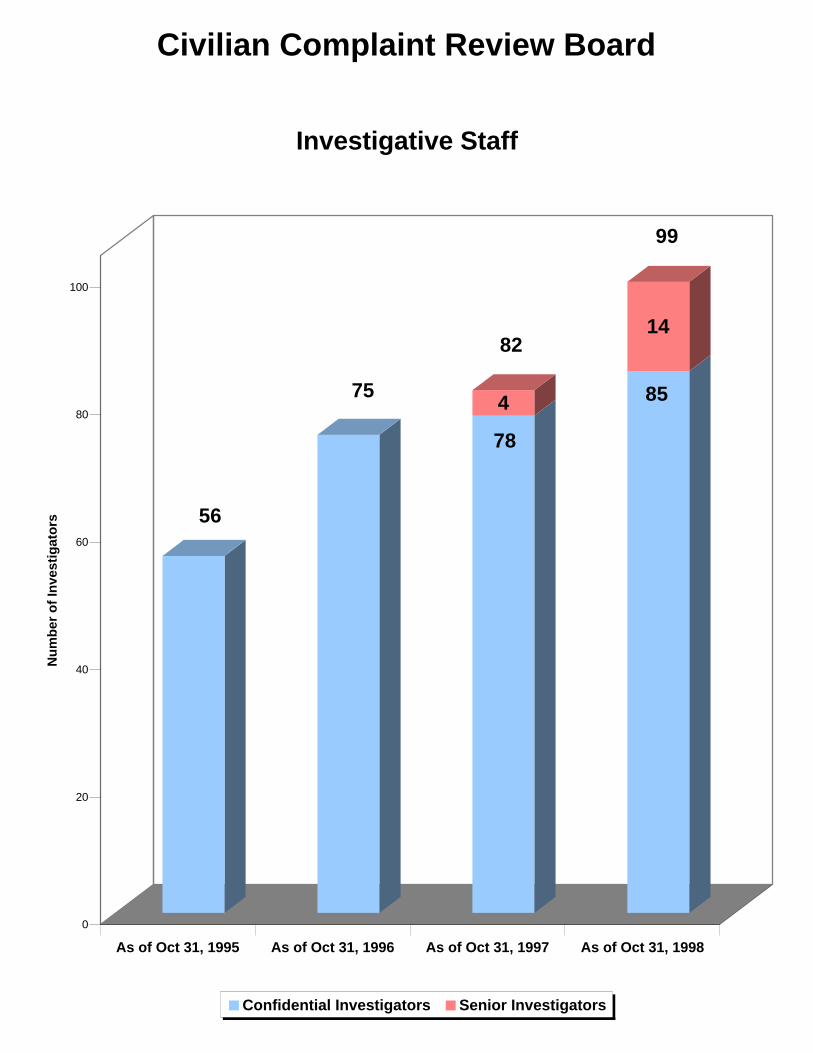
Civilian Complaint Review Board
56
75
78
4 85
14
0
20
40
60
80
100
Nu
mb
er o
f In
vest
igat
ors
As of Oct 31, 1995 As of Oct 31, 1996 As of Oct 31, 1997 As of Oct 31, 1998
Investigative Staff
Confidential Investigators Senior Investigators
82
99

Civilian Complaint Review Board
2,486
998 978
0
500
1,000
1,500
2,000
2,500
3,000
Cas
es
As ofOctober 31, 1996
As ofOctober 31, 1997
As ofOctober 31, 1998
Backlog (Based on Date of Incident)

New York City Housing Authority
47%
45%45%
46%
45%
46%
49% 49%
48%48%
43%
40%
39% 39%
37%
35%
32%
31%
30% 30%
31%
32%
34%
25%
30%
35%
40%
45%
50%
Per
cen
t o
f F
amili
es
1976 1977 1978 1979 1980 1981 1982 1983 1984 1985 1986 1987 1988 1989 1990 1991 1992 1993 1994 1995 1996 1997 1998
Working Families as a Percent of All FamiliesCalendar 1976-1998 *
* Figures are for the end of each calendar year.

Department of HousingPreservation and Development
28,9
75
31,4
88
31,7
56
34,4
71
38,8
40
39,6
32
38,2
01
37,3
55
32,3
77
33,8
51
32,7
83
32,8
01
32,0
78
30,3
58
27,9
22
24,5
03
22,2
98
19,0
84
17,9
41
15,000
20,000
25,000
30,000
35,000
40,000
Ho
usi
ng
Un
its
in O
ccu
pie
d B
uild
ing
s
1981
1982
1983
1984
1985
1986
1987
1988
1989
1990
1991
1992
1993
1994
1995
1996
1997
1998
Jul.-
Oct
. 199
8
In Rem Housing Units
Fiscal Year
From Fiscal 1994 to October 1998, the number of in rem housing units was reduced by 41 percent. Units that have passed into private ownership during this period now provide over $6 million annually to the City in tax revenue.
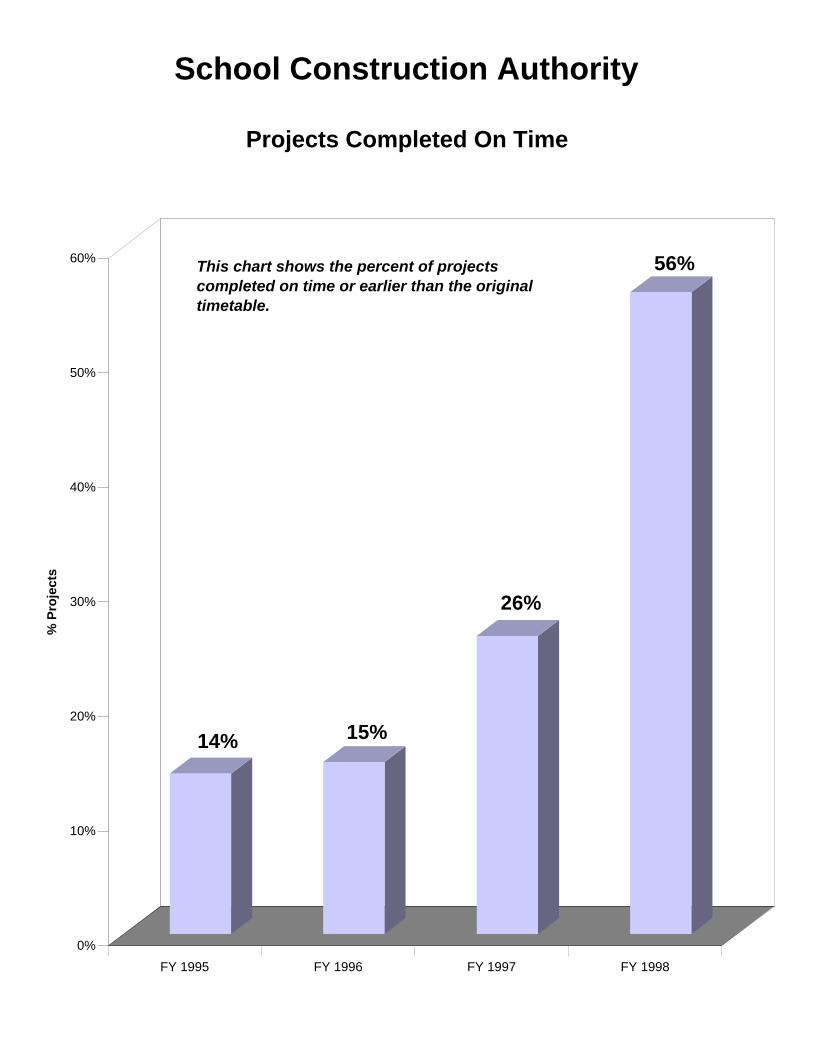
School Construction Authority
14% 15%
26%
56%
0%
10%
20%
30%
40%
50%
60%
% P
roje
cts
FY 1995 FY 1996 FY 1997 FY 1998
Projects Completed On Time
This chart shows the percent of projects completed on time or earlier than the original timetable.
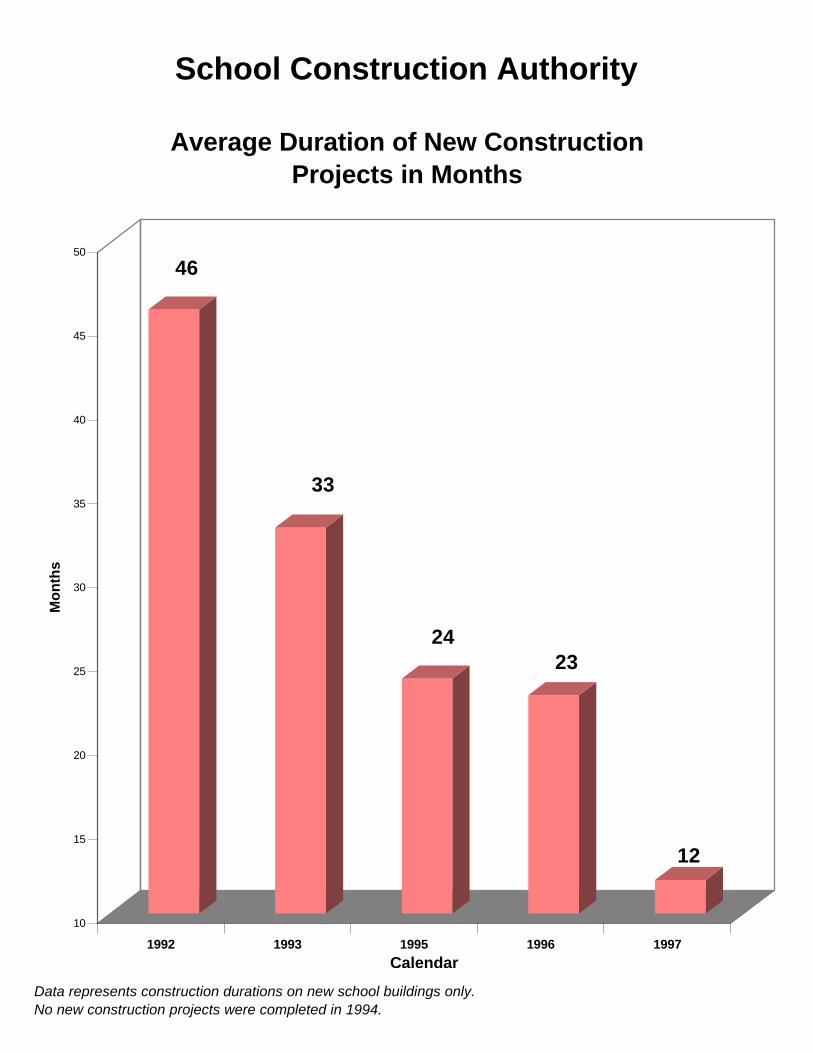
School Construction Authority
46
33
2423
12
10
15
20
25
30
35
40
45
50
Mo
nth
s
1992 1993 1995 1996 1997
Average Duration of New ConstructionProjects in Months
Calendar
Data represents construction durations on new school buildings only. No new construction projects were completed in 1994.

Department of Transportation
642
377
701
366
626
304
591
290
537
285
487
246
486
243
426
236
493
254
361
179
0
200
400
600
800
Fat
alit
ies
1989 1990 1991 1992 1993 1994 1995 1996 1997 1998
Traffic FatalitiesCalendar 1989-1998
Total Pedestrians

Department of Transportation
4,9925,237
6,7046,992
8,121
0
1,000
2,000
3,000
4,000
5,000
6,000
7,000
8,000
9,000
Sig
ns
Inst
alle
d
Jul-Oct 1994 Jul-Oct 1995 Jul-Oct 1996 Jul-Oct 1997 Jul-Oct 1998
Priority Regulatory Sign Installations
Priority regulatory signs include Stop, Yield, Do Not Enter, and One Way signs

Department of Transportation
7.3 Weeks
Wai
tin
g P
erio
d
December 1997 October 1998
Average Waiting Time for Parking Permitsfor People with Disabilities (PPPDs)
Since the responsibility for physical examinations of applicants was transferred to Bellevue Hospital in January 1998, the average waiting time to receive a permit has decreased from 6 months to 7.3 weeks. The goal is 6 weeks.
6 Months
Department of Transportation
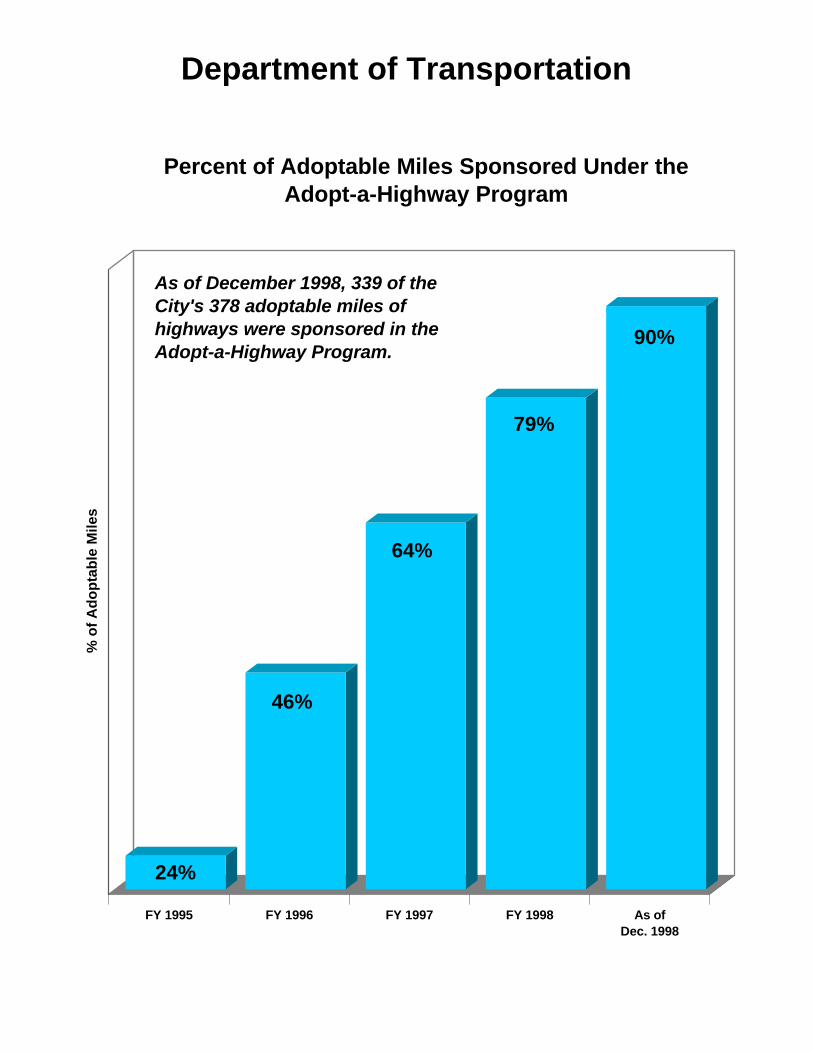
24%
46%
64%
79%
90%
% o
f A
do
pta
ble
Mile
s
FY 1995 FY 1996 FY 1997 FY 1998 As ofDec. 1998
Percent of Adoptable Miles Sponsored Under theAdopt-a-Highway Program
As of December 1998, 339 of the City's 378 adoptable miles of highways were sponsored in the Adopt-a-Highway Program.
Department of Environmental Protection
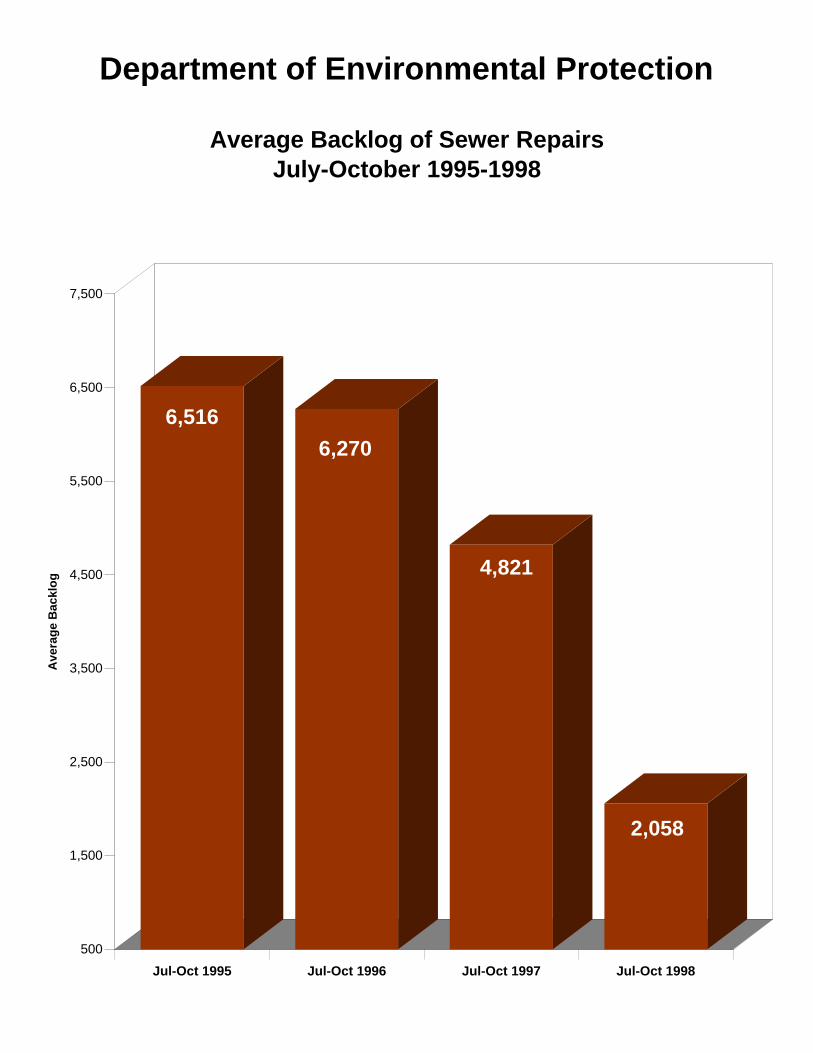
6,516
6,270
4,821
2,058
500
1,500
2,500
3,500
4,500
5,500
6,500
7,500
Ave
rag
e B
ackl
og
Jul-Oct 1995 Jul-Oct 1996 Jul-Oct 1997 Jul-Oct 1998
Average Backlog of Sewer Repairs July-October 1995-1998

Department of Design and Construction
281
180
100
120
140
160
180
200
220
240
260
280
300
Day
s
July-October 1997 July-October 1998
Average Construction Duration of Projects
(Days)
The average duration of days for construction projects decreased by 36% from July-October 1997 to July-October 1998.

Department of Design and Construction
99
176
50
70
90
110
130
150
170
Nu
mb
er o
f P
roje
cts
July-October 1997 July-October 1998
Projects Completed by the Structures Division *
Project completions increased by 78% from July-October 1997 to July-October 1998.
* DDC's Structures Division builds and reconstructs health care and human services facilities, public school buildings, public safety facilities, and cultural institutions.

Department of Sanitation
50.0
55.0
60.0
65.0
70.0
75.0
80.0
85.0
90.0
% A
ccep
tab
ly C
lean
1975
1976
1977
1978
1979
1980
1981
1982
1983
1984
1985
1986
1987
1988
1989
1990
1991
1992
1993
1994
1995
1996
1997
1998
Scorecard Street Cleanliness RatingsJuly-December 1975-1998
The last six months of 1998 received the highest rating of any six-month period in the history of City cleanliness ratings.
HIGHEST SIX-MONTH RATING EVER:85.9%

Department of Sanitation
34
46
39
61
4042
33
40
20 0
0
10
20
30
40
50
60
70
Nu
mb
er o
f S
anit
atio
n S
ecti
on
s R
ated
Dir
ty
1988 1989 1990 1991 1992 1993 1994 1995 1996 1997 1998
Number of Sanitation Sections Rated DirtyJuly-December 1988-1998
None of the City's 227 Sanitation Sections have been rated dirty for any six-month period since July 1997.

Department of Sanitation
Curbside Collection ProductivityJuly-October 1994-1998
6.8
9.810.1
10.510.2
9.1
6.6
4.6 4.6
5.5
0.0
2.0
4.0
6.0
8.0
10.0
12.0
July-Oct 1994 July-Oct 1995 July-Oct 1996 July-Oct 1997 July-Oct 1998
To
ns
Per
Tru
ck-S
hif
t
Refuse Recycling

Department of Sanitation
12.6% 12.7% 12.6%
13.4%
16.3%
17.9%
10.0%
11.0%
12.0%
13.0%
14.0%
15.0%
16.0%
17.0%
18.0%
Per
cen
t o
f C
urb
sid
e &
Co
nta
iner
ized
Res
iden
tial
Was
te S
trea
m R
ecyc
led
FY1994 FY1995 FY1996 FY1997 FY1998 July-Dec. 1998
Curbside and Containerized ResidentialRecycling Diversion Rate
Department of Parks and Recreation
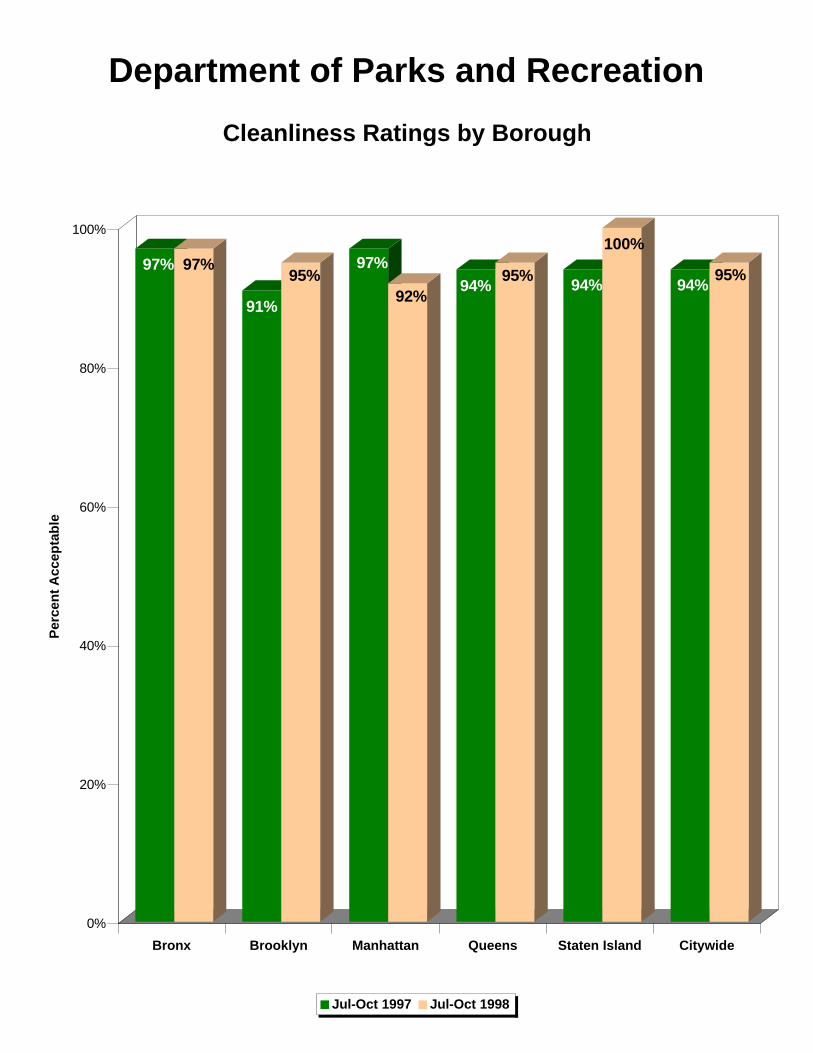
97% 97%
91%
95%97%
92%94%
95%94%
100%
94%95%
0%
20%
40%
60%
80%
100%
Per
cen
t A
ccep
tab
le
Bronx Brooklyn Manhattan Queens Staten Island Citywide
Cleanliness Ratings by Borough
Jul-Oct 1997 Jul-Oct 1998

Department of Parks and Recreation
57%
74%
86%
40%
60%
80%
Co
nd
itio
n R
atin
g
Jul-Oct 1996 Jul-Oct 1997 Jul-Oct 1998
Overall Condition Rating*
Ratings of overall conditions are at their highest level since the current rating system was implemented in Spring 1992.
*The Department conducts inspections of parks of six acres or less.
Department of Parks and Recreation
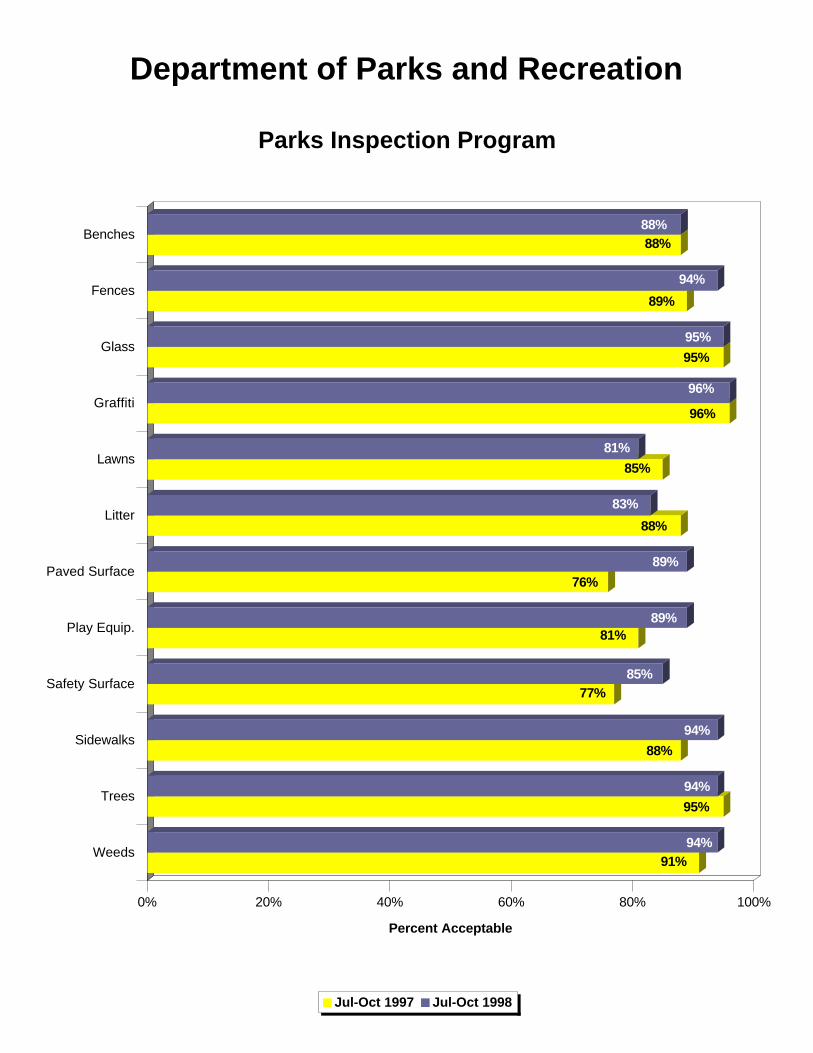
91%94%
95%
94%
88%
94%
77%85%
81%89%
76%
89%
88%
83%
85%
81%
96%
96%
95%
95%
89%
94%
88%88%
0% 20% 40% 60% 80% 100%
Percent Acceptable
Benches
Fences
Glass
Graffiti
Lawns
Litter
Paved Surface
Play Equip.
Safety Surface
Sidewalks
Trees
Weeds
Parks Inspection Program
Jul-Oct 1997 Jul-Oct 1998
23.9
-3.9
9.4
-68.
030
.765
.68.
5-8
5.7
41.2
14.6
-18.
518
.8-3
7.3
18.3
4.0
15.1
26.5
38.7
55.0
-68.
5
-140
.6-4
1.2 -3
5.7
-102
.3-1
49.9
-25.
1-7
.335
.6 43.0
26.2
57.8
-14.
85.
964
.333
.235
.3 42.9
0.4
-3.3
-48.
0-1
76.6
-84.
96.
440
.435
.2 44.0
63.1
84.3
-200.0
-150.0
-100.0
-50.0
0.0
50.0
100.0
An
nu
al A
vg. C
han
ge
(th
ou
san
ds)
1951
1953
1955
1957
1959
1961
1963
1965
1967
1969
1971
1973
1975
1977
1979
1981
1983
1985
1987
1989
1991
1993
1995
1997
Calendar Year
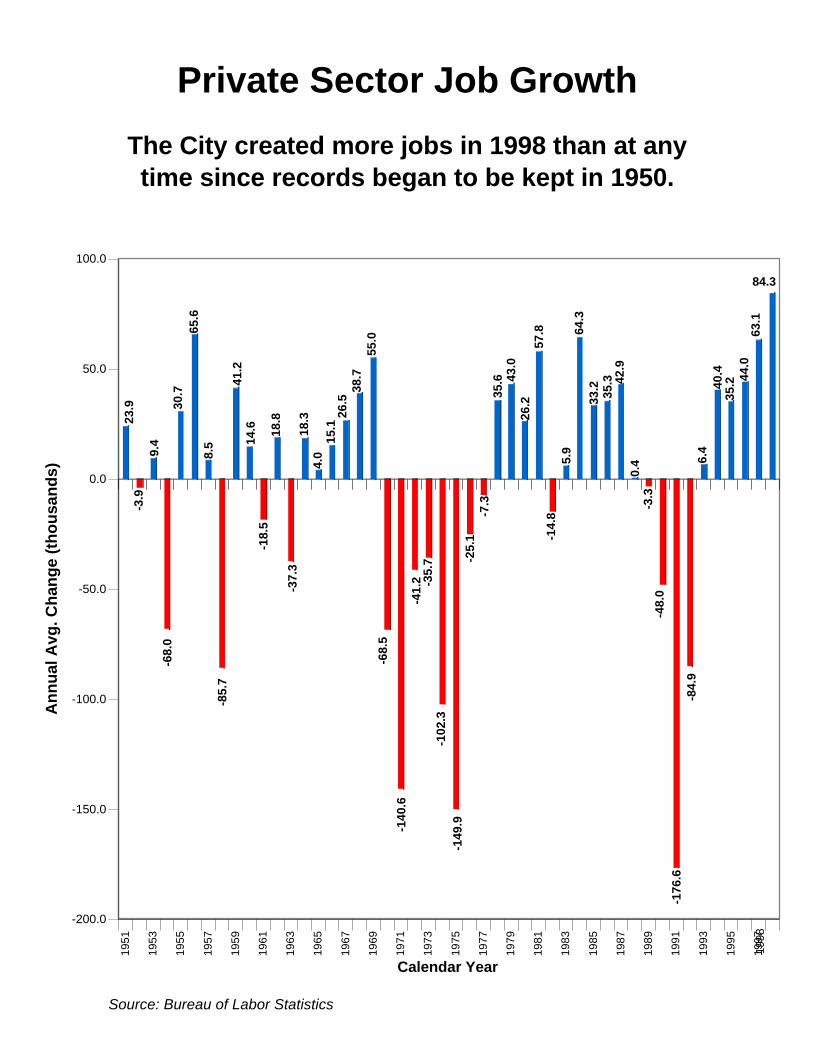
Private Sector Job Growth
The City created more jobs in 1998 than at any time since records began to be kept in 1950.
Source: Bureau of Labor Statistics
1998

2.9%2.8%
1.3%
0.0%
0.5%
1.0%
1.5%
2.0%
2.5%
3.0%
Yea
rly
Per
cen
t C
han
ge
New York City U.S. New York Stateexcluding NYC
In 1998 NYC Private Sector Employment Growth Exceeded the Nation and
New York State
Source: Bureau of Labor Statistics

Department of Finance
$293.01 $294.07 $294.38
$298.36
$311.37
$330.58
$270
$280
$290
$300
$310
$320
$330
$340
$ B
illio
ns
FY 1995 FY 1996 FY 1997 FY 1998 FY 1999 FY 2000*
Total Fair Market ValueFully and Partially Taxable Properties
(in Billions)
*Tentative Assessment

Department of Finance
$66.60
$59.28$59.57
$60.20$60.75
$61.78
$64.50
$67.62
$54
$56
$58
$60
$62
$64
$66
$68
$ B
illio
ns
1993 1994 1995 1996 1997 1998 1999 2000*
Total Fair Market Value for One Family Homes(in Billions)
Fiscal 1993-2000
*Tentative Assessment
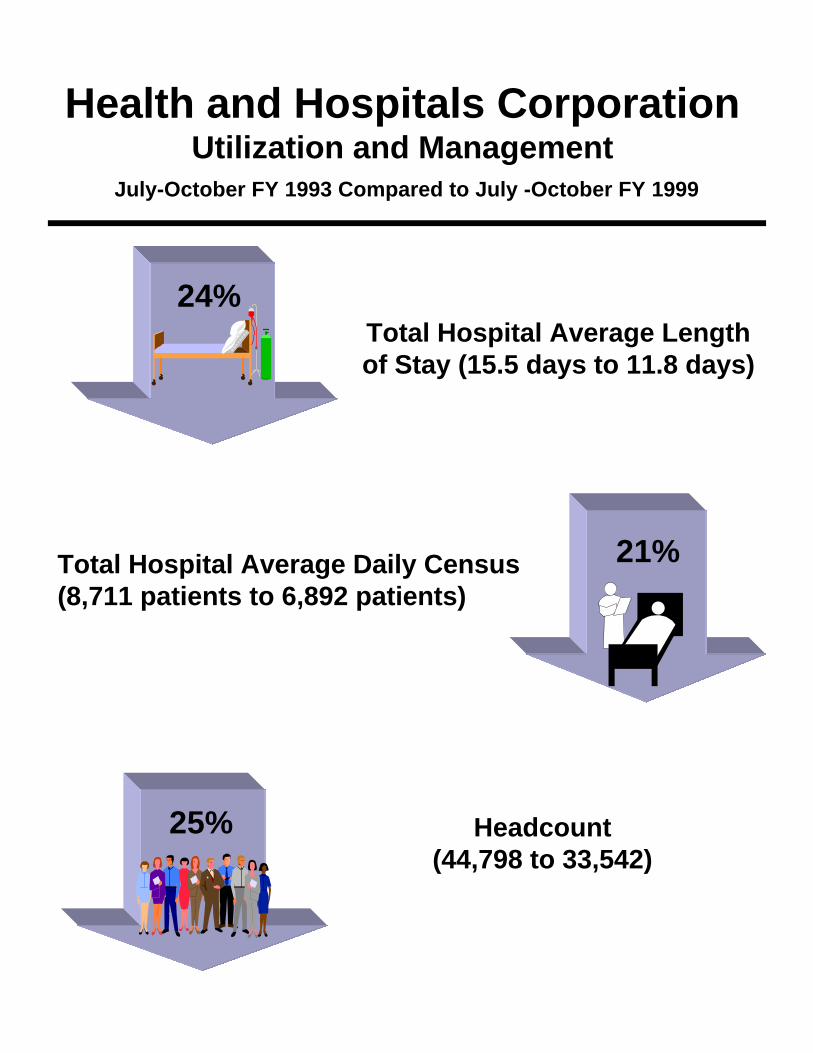
Total Hospital Average Daily Census(8,711 patients to 6,892 patients)
21%
Total Hospital Average Lengthof Stay (15.5 days to 11.8 days)
Health and Hospitals CorporationUtilization and Management
July-October FY 1993 Compared to July -October FY 1999
24%
Headcount(44,798 to 33,542)
25%
Health and Hospitals Corporation
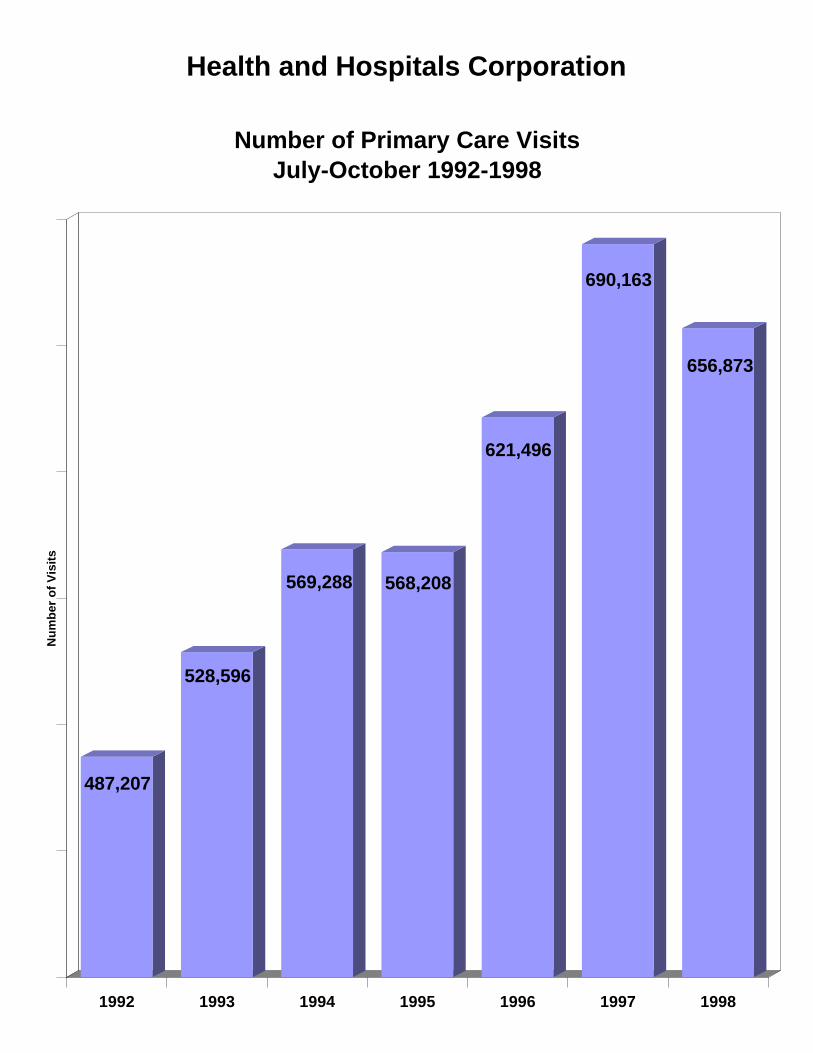
487,207
528,596
569,288 568,208
621,496
690,163
656,873
Nu
mb
er o
f V
isit
s
1992 1993 1994 1995 1996 1997 1998
Number of Primary Care VisitsJuly-October 1992-1998

Health and Hospitals Corporation
293.4291.8
284.2
267.4
254.3
245.3
257.3
Vis
its
(000
)
1992 1993 1994 1995 1996 1997 1998
Emergency Room Visits(Excluding Visits Resulting in Admissions)
July-October 1992-1998

Health and Hospitals Corporation
Average Waiting time for Mammography Screening Appointments
July-September 1995-1998
11 Days
5 Days6 Days
15 Days
0
2
4
6
8
10
12
14
16
1995 1996 1997 1998
Ave
rag
e W
aiti
ng
Tim
e (d
ays)
For the past two years the Corporation has surpassed the industry standard waiting time of 8 days.

Health and Hospitals Corporation
46%
54%53%
64%
30%
35%
40%
45%
50%
55%
60%
65%
% o
f W
om
en
Jul-Oct 1995 Jul-Oct 1996 Jul-Oct 1997 Jul-Oct 1998
Women Receiving Initial Prenatal Care in First Trimester
July-October 1995-1998

Department of Health
12,832
10,67711,051
9,187
7,823
0
2,000
4,000
6,000
8,000
10,000
12,000
14,000
Cas
es
1994 1995 1996 1997 Preliminary 1998
New AIDS Cases*Calendar 1994-1998
* Includes pediatric and adult cases. Figures show citywide cases by year of report.
New AIDS cases declined by 39% from 1994 to 1998.

Department of Health
425
952
1,663
2,650
3,192
3,773
4,282
4,616
5,228
5,789
6,120
7,102 7,046
4,998
2,625
1,947
0
2,000
4,000
6,000
8,000
Dea
ths
1983
1984
1985
1986
1987
1988
1989
1990
1991
1992
1993
1994
1995
1996
1997
Pre
limin
ary
1998
Number of Deaths from HIV/AIDSCalendar 1983-1998
AIDS case surveillance began in 1981 by year of report.
The number of deaths from HIV/AIDS declined last year to its lowest level since 1985.
Department of Health
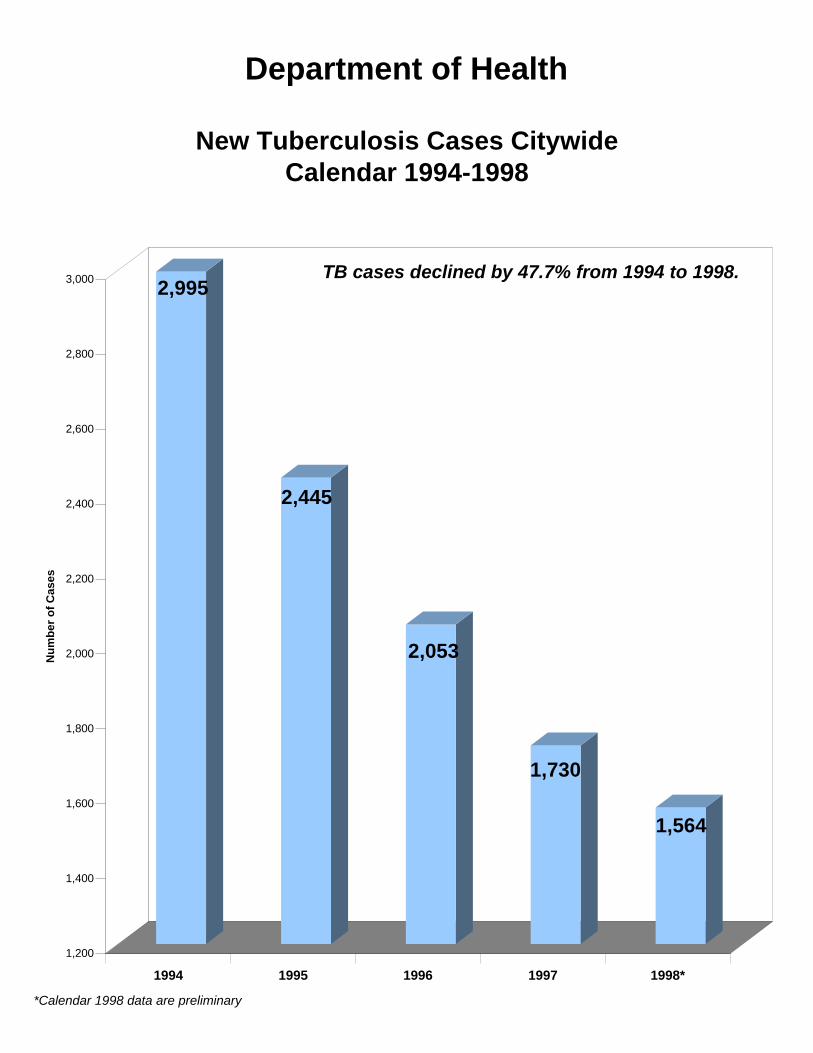
2,995
2,445
2,053
1,730
1,564
1,200
1,400
1,600
1,800
2,000
2,200
2,400
2,600
2,800
3,000
Nu
mb
er o
f C
ases
1994 1995 1996 1997 1998*
New Tuberculosis Cases CitywideCalendar 1994-1998
TB cases declined by 47.7% from 1994 to 1998.
*Calendar 1998 data are preliminary

Department of Health
840
638
591
516
400
650
900
Cas
es
1995 1996 1997 1998
New Lead Poisoning CasesJuly-October 1995-1998
New lead poisoning cases declined by 39% from July-October 1995 to July-October 1998.

Human Resources Administration
1,16
0.6
1,14
0.5
1,12
8.5
1,11
9.4
1,10
0.6
1,10
1.4
1,08
4.8
1,07
1.1
1,05
4.8
1,04
6.4
1,04
1.4
1,04
5.1
1,04
2.7
1,03
7.7
1,02
5.1
1,00
7.9
1,00
4.2
994.
697
8.0
971.
495
1.3
940.
692
5.2
916.
591
2.4
908.
3
897.
188
0.1
870.
5
855.
883
9.4
838.
182
2.1
817.
480
9.2
797.
279
0.3
776.
377
1.5
763.
3
759.
174
5.8
735.
873
6.7 71
9.7
715.
7
703.
4
700,000
900,000
1,100,000
Rec
ipie
nts
(00
0)
Mar
95
May Ju
l
Sep
Nov
Jan
96
Mar
May Ju
l
Sep
Nov
Jan
97
Mar
May Ju
l
Sep
Nov
Jan
98
Mar
May Ju
l
Sep
Nov
Jan
99
Public Assistance Recipients
The number of public assistance recipients fell by more than 457,200 -- a drop of 39.4% -- from March 1995 to January 1999.

Human Resources Administration
Number of Public Assistance RecipientsDecember 1955 - January 1999
0
200,000
400,000
600,000
800,000
1,000,000
1,200,000
1,400,000
1955
1956
1957
1958
1959
1960
1961
1962
1963
1964
1965
1966
1967
1968
1969
1970
1971
1972
1973
1974
1975
1976
1977
1978
1979
1980
1981
1982
1983
1984
1985
1986
1987
1988
1989
1990
1991
1992
1993
1994
1995
1996
1997
1998
Jan.
199
9
Calendar Year
703,367
The number of public assistance recipients is at its lowest level since November 1967.

Human Resources Administration
653
864871
920958
1,2011,250
1,298
0
200
400
600
800
1,000
1,200
1,400
Bed
s
FY1992 FY1993 FY1994 FY1995 FY1996 FY1997 FY1998 FY1999 Plan
Domestic Violence Shelter Bed Capacity
From Fiscal 1992 to Fiscal 1999, there will be a 99 percent increase in domestic violence bed capacity.
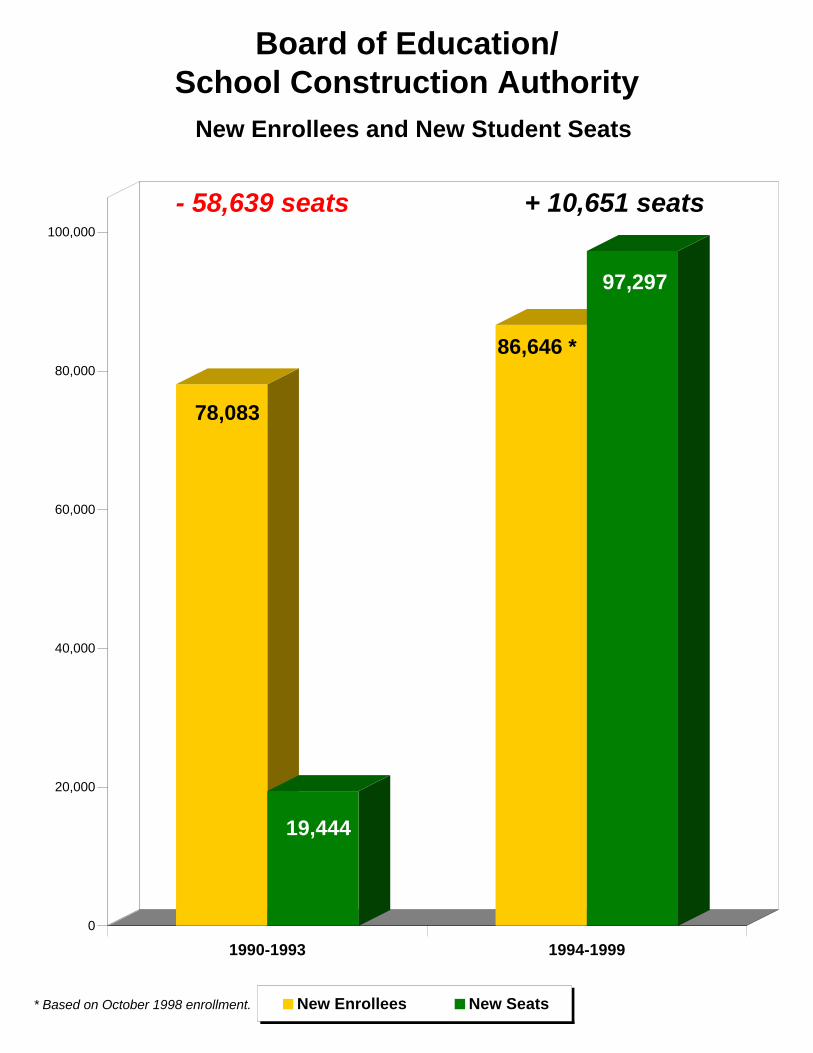
Board of Education/School Construction Authority
78,083
19,444
86,646 *
97,297
0
20,000
40,000
60,000
80,000
100,000
1990-1993 1994-1999
New Enrollees and New Student Seats
New Enrollees New Seats
- 58,639 seats + 10,651 seats
* Based on October 1998 enrollment.

Board of Education
3,224
3,556
4,545
3,000
3,200
3,400
3,600
3,800
4,000
4,200
4,400
4,600
Nu
mb
er o
f C
hild
ren
1996-97 1997-98 1998-99
Special Education EnrollmentStudents Placed in a Less Restrictive Setting
July-October
School Year

Board of Education
16,064
15,576
11,753
10,000
11,000
12,000
13,000
14,000
15,000
16,000
17,000
18,000
1996-97 1997-98 1998-99
Initial Case Referrals forSpecial Education Assessment
July-December
School Year
With referrals to Special Education down by 25%, 3,800 students were able to remain in general education.

Administration for Children's Services
15,213
14,551
14,147
13,516
15,724
16,110
15,191
10,000
Nu
mb
er o
f R
epo
rts
1992 1993 1994 1995 1996 1997 1998
Child Abuse and Neglect ReportsJuly-October 1992-1998
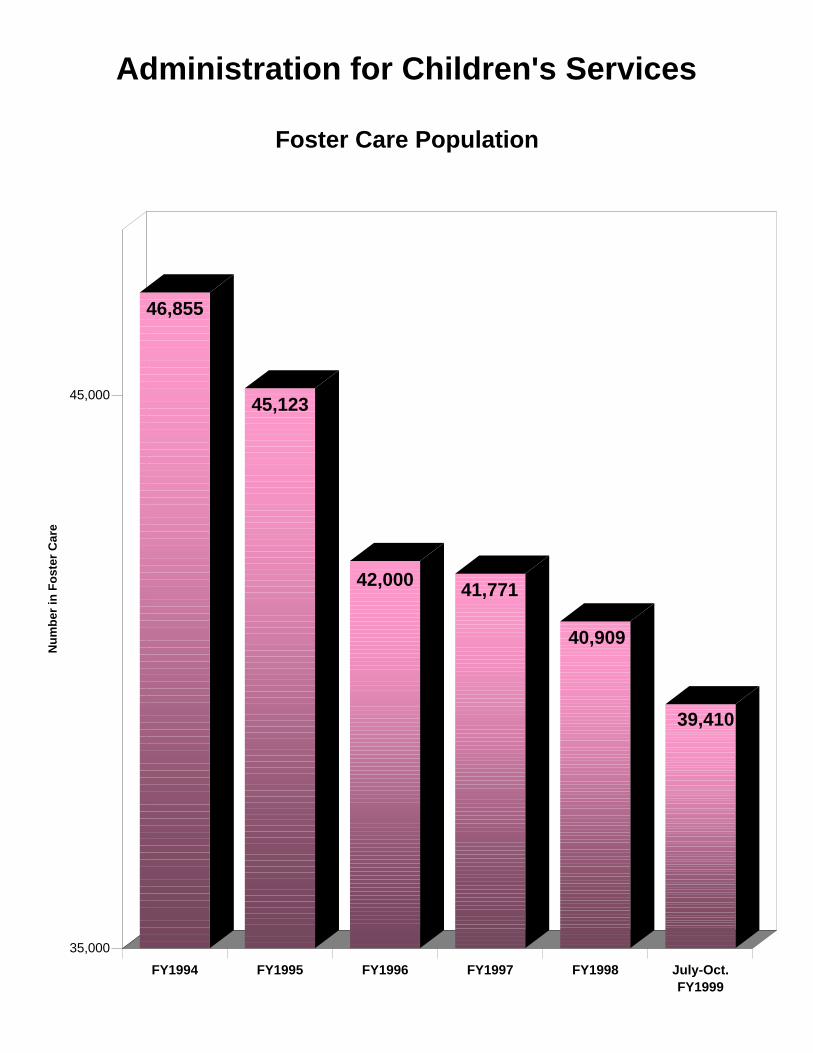
Administration for Children's Services
46,855
45,123
42,000 41,771
40,909
39,410
35,000
45,000
Nu
mb
er in
Fo
ster
Car
e
FY1994 FY1995 FY1996 FY1997 FY1998 July-Oct.FY1999
Foster Care Population

Administration for Children's Services
2,125
2,279
2,674
3,957
3,293
4,075
3,840
2,000
2,500
3,000
3,500
4,000
Nu
mb
er o
f A
do
pti
on
s
1992 1993 1994 1995 1996 1997 1998
Total Number of Child AdoptionsCalendar 1992-1998
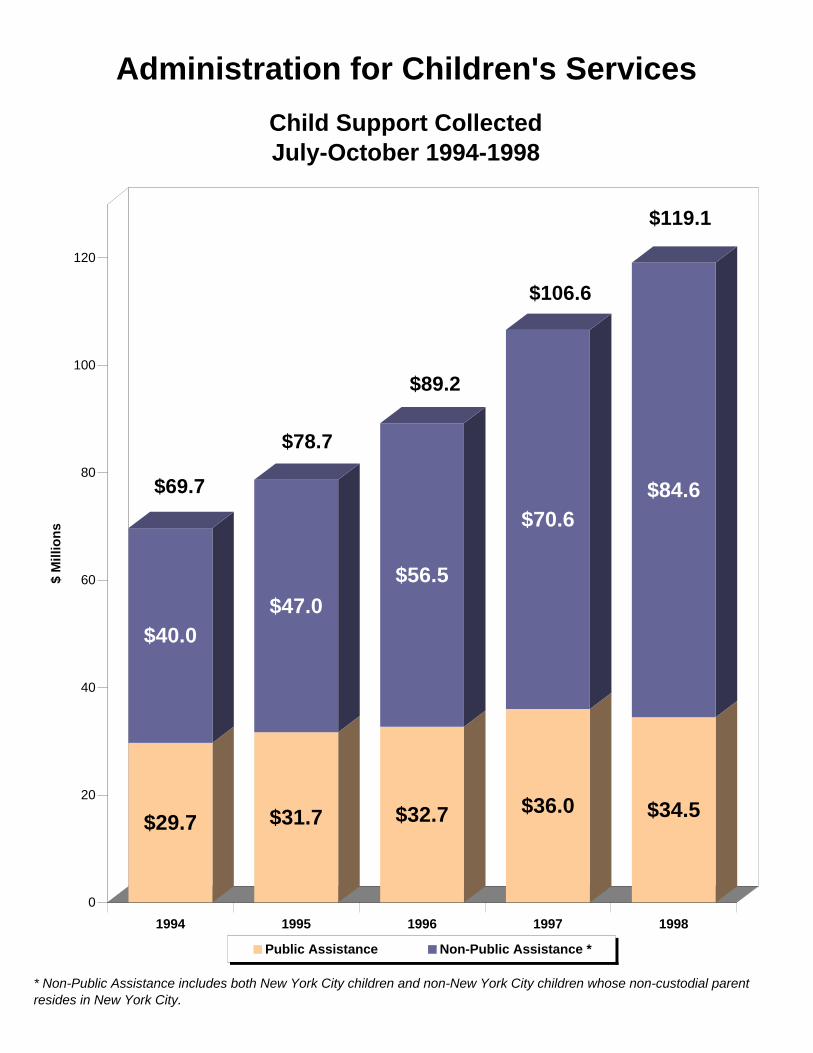
Administration for Children's Services
$29.7
$40.0
$31.7
$47.0
$32.7
$56.5
$36.0
$70.6
$34.5
$84.6
0
20
40
60
80
100
120
$ M
illio
ns
1994 1995 1996 1997 1998
Child Support CollectedJuly-October 1994-1998
Public Assistance Non-Public Assistance *
$69.7
$78.7
$89.2
$106.6
$119.1
* Non-Public Assistance includes both New York City children and non-New York City children whose non-custodial parent resides in New York City.

Department of Consumer Affairs
Enforcement Against Tobacco Sales to Minors
4,400
5,462
429335444 295
$66,000
$446,000
$24,530 $31,285$14,985
$154,000
0
1000
2000
3000
4000
5000
6000
FY 1994 FY 1995 FY 1996 FY 1997 FY 1998 Jul-Dec 1998
Insp
ecti
on
s
$0
$50,000
$100,000
$150,000
$200,000
$250,000
$300,000
$350,000
$400,000
$450,000
Fin
es
# of Inspections Fines
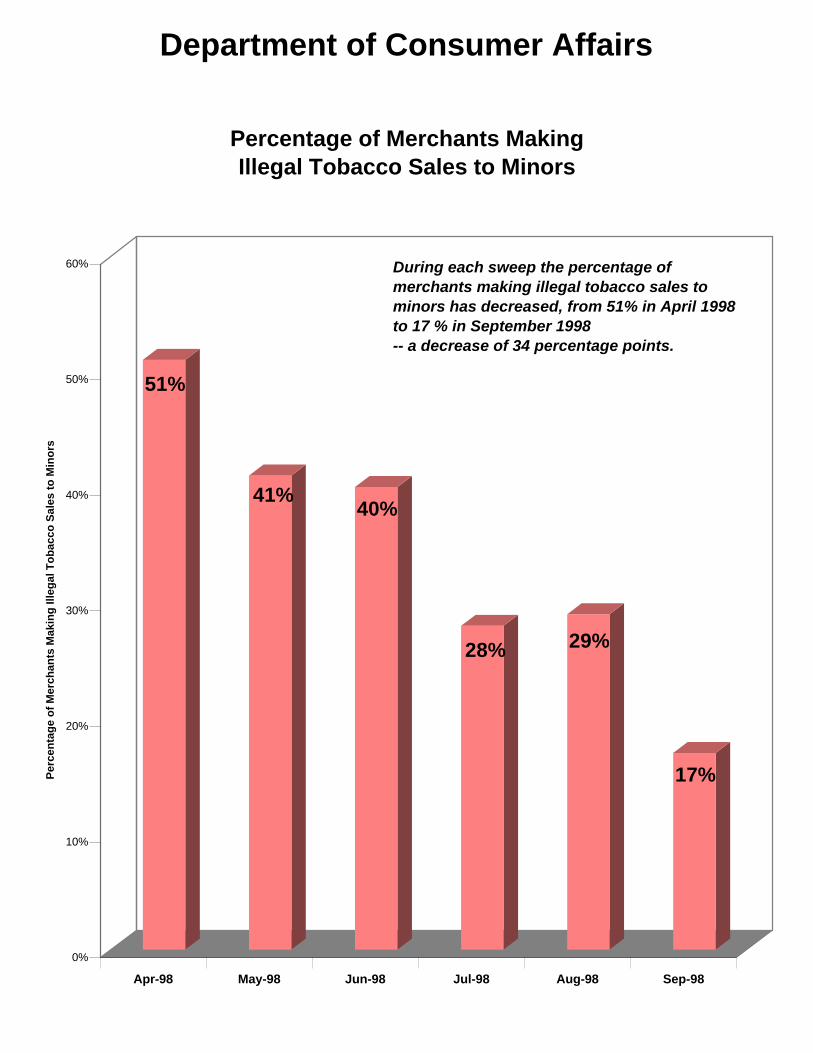
Department of Consumer Affairs
51%
41%40%
28% 29%
17%
0%
10%
20%
30%
40%
50%
60%
Per
cen
tag
e o
f M
erch
ants
Mak
ing
Ille
gal
To
bac
co S
ales
to
Min
ors
Apr-98 May-98 Jun-98 Jul-98 Aug-98 Sep-98
Percentage of Merchants MakingIllegal Tobacco Sales to Minors
During each sweep the percentage of merchants making illegal tobacco sales to minors has decreased, from 51% in April 1998 to 17 % in September 1998-- a decrease of 34 percentage points.
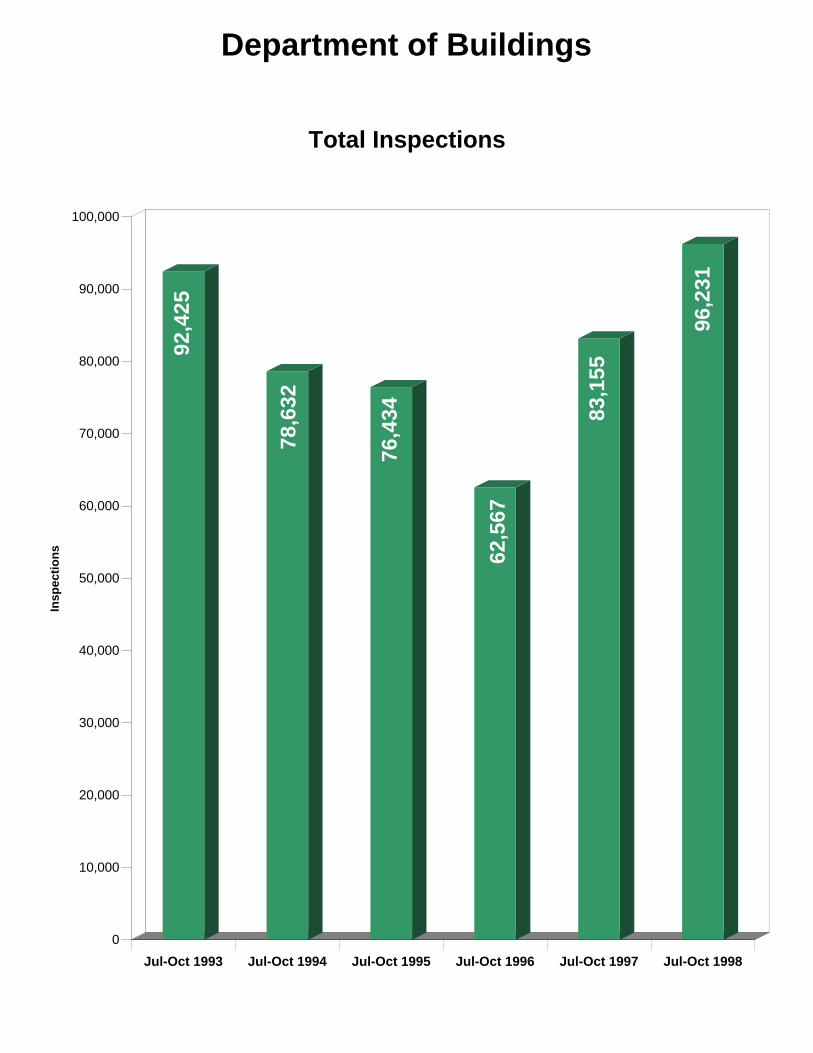
Department of Buildings
92,4
25
78,6
32
76,4
34
62,5
67
83,1
55
96,2
31
0
10,000
20,000
30,000
40,000
50,000
60,000
70,000
80,000
90,000
100,000
Insp
ecti
on
s
Jul-Oct 1993 Jul-Oct 1994 Jul-Oct 1995 Jul-Oct 1996 Jul-Oct 1997 Jul-Oct 1998
Total Inspections

Department of Buildings
228 230 251
431
1,997
2,191
0
500
1,000
1,500
2,000
2,500
Vio
lati
on
s
Jul-Oct 1993 Jul-Oct 1994 Jul-Oct 1995 Jul-Oct 1996 Jul-Oct 1997 Jul-Oct 1998
Violations Issued for Illegal Conversions
After the creation of the Department's Quality of Life Team, illegal conversion violations issued increased by 166 percent.
Department of Buildings
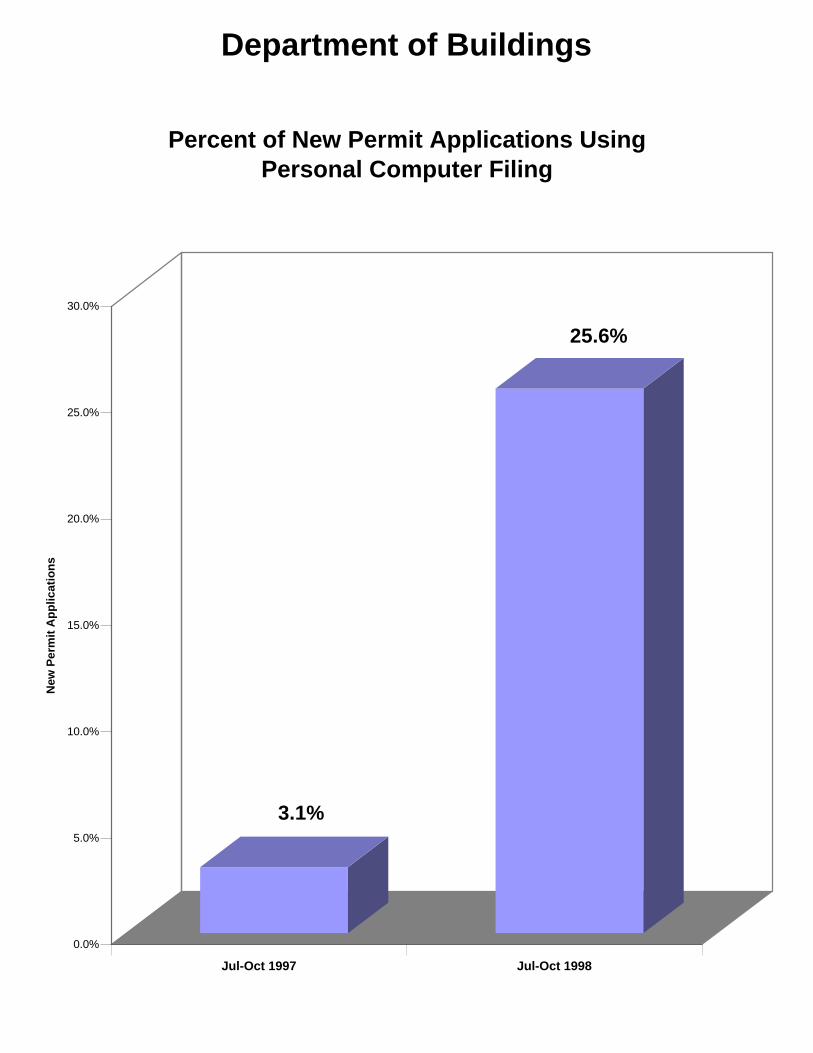
3.1%
25.6%
0.0%
5.0%
10.0%
15.0%
20.0%
25.0%
30.0%
New
Per
mit
Ap
plic
atio
ns
Jul-Oct 1997 Jul-Oct 1998
Percent of New Permit Applications Using Personal Computer Filing

Taxi and Limousine Commission
2,906
4,272
5,106
0
1,000
2,000
3,000
4,000
5,000
6,000
Fo
r H
ire
Veh
icle
Dri
ver
Su
mm
on
ses
Issu
ed
1996 1997 1998
For Hire Vehicle Driver Summonses Issued July-December 1996-1998
Taxi and Limousine Commission
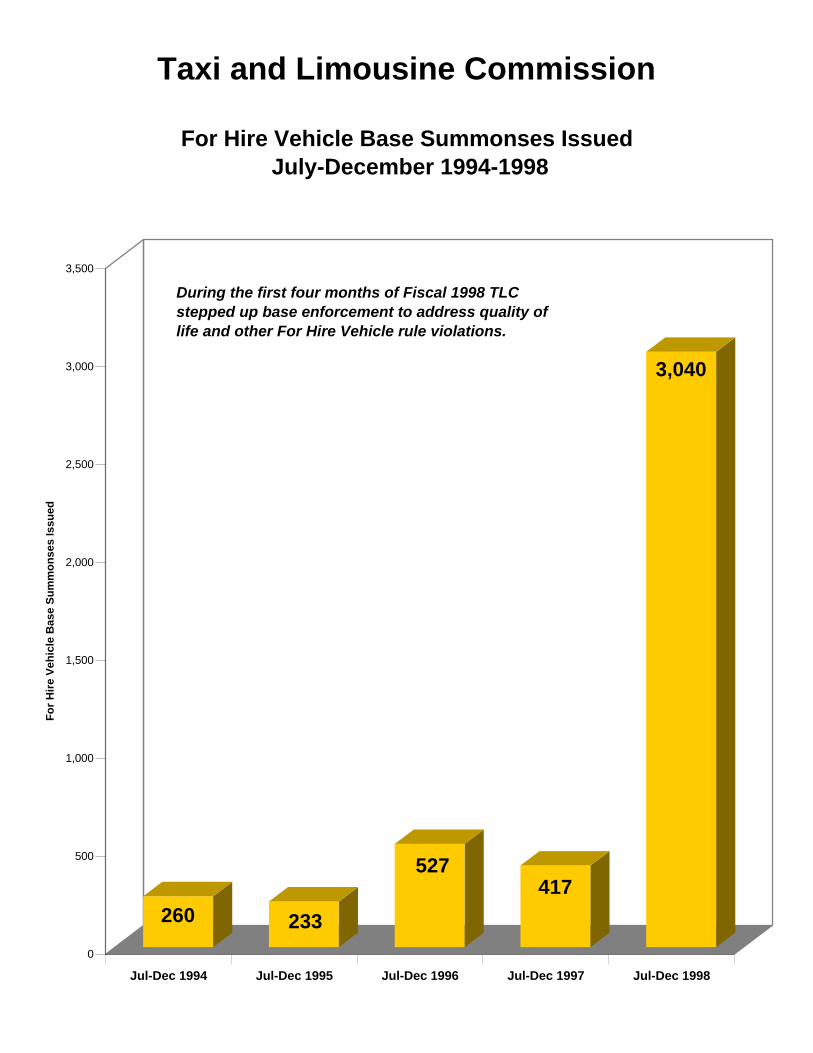
260 233
527417
3,040
0
500
1,000
1,500
2,000
2,500
3,000
3,500
Fo
r H
ire
Veh
icle
Bas
e S
um
mo
nse
s Is
sued
Jul-Dec 1994 Jul-Dec 1995 Jul-Dec 1996 Jul-Dec 1997 Jul-Dec 1998
For Hire Vehicle Base Summonses Issued July-December 1994-1998
During the first four months of Fiscal 1998 TLC stepped up base enforcement to address quality of life and other For Hire Vehicle rule violations.

Taxi and Limousine Commission
1,244
826
250
450
650
850
1,050
1,250
Co
mp
lain
ts o
f O
verc
har
gin
g
Jul-Dec 1997 Jul-Dec 1998
Complaints of OverchargingJuly-December 1997-1998
Complaints of overcharging have decreased 34% due to the introduction of the JFK Airport flat fare in June 1996, and due to the Commission's enforcement efforts, including introduction of its NYC-TAXI hotline.

New York City Office of New Media
1,381,242
4,060,704
0
500,000
1,000,000
1,500,000
2,000,000
2,500,000
3,000,000
3,500,000
4,000,000
4,500,000
Jul-Oct 1998 Jul-Oct 1999
Total NYC LINK Page Views
The number of NYC LINK page views has increased by 194 percent.
New York City Office of New Media
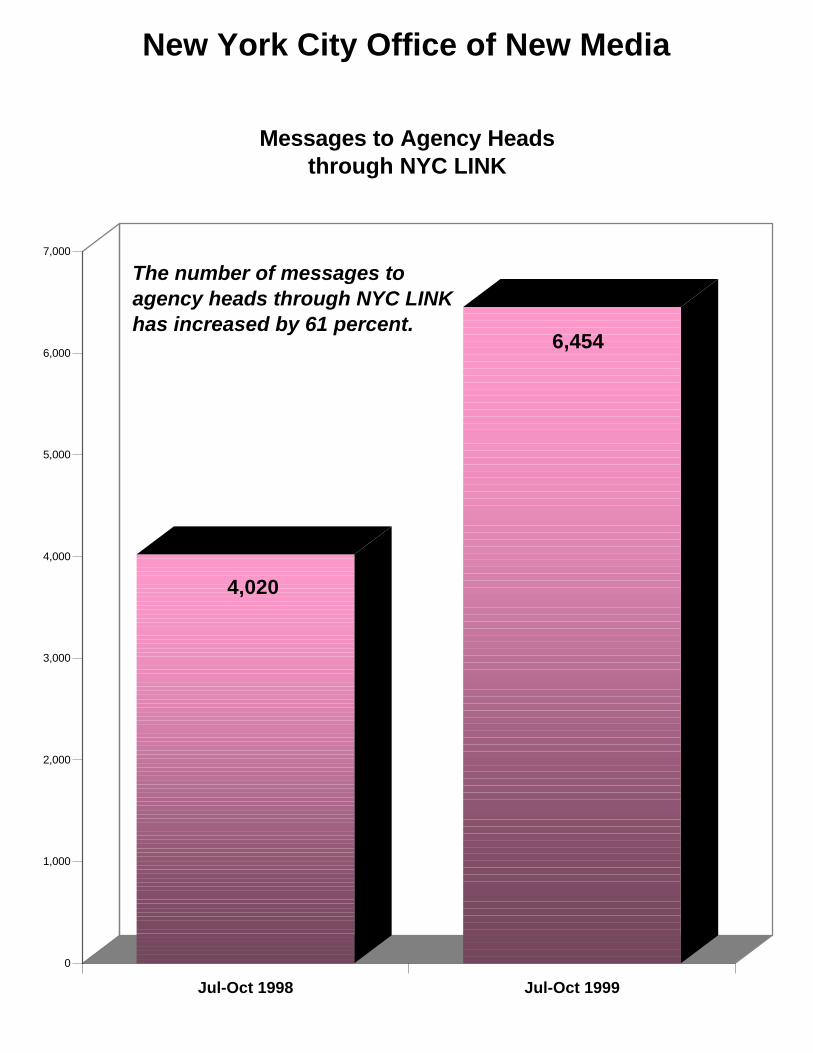
4,020
6,454
0
1,000
2,000
3,000
4,000
5,000
6,000
7,000
Jul-Oct 1998 Jul-Oct 1999
Messages to Agency Heads through NYC LINK
The number of messages to agency heads through NYC LINK has increased by 61 percent.
Related Documents