New Ways of Seeing Regional Issues: Using Information to Move Beyond Stereotypes Fiona McKenzie ,.t. I i ': r 'l: .1.. I 'Inffoduction ln:any debate about regionalAustratia it is easy to :"use wetl-worn perspectives and stereotypes. For 'policy makers, researchers and media commentators this can be reinforced by the fact that most reside in capital cities. Challenging such stereotypes is an important step in developing and exploring new perspectives on old problems. For example, does population decline mean the'death' of a town or a region? Why do many economic indicators improve in the face of such decline? And which population are we actua[ly measuring when we determine patterns of decline? Sometimes, our understanding ofexisting issues can be re- invigorated by introducing information from other fietds of research. lt can also be enhanced through the development of broader timeframes - both historical and proiected. This article examines a number of regional issues in ' ., such ways. lt arises from work undertaken by the Victorian Government which has been published as Regional tulatters: An Atlas of Regional Vktorn. This whole-of-government project involved both traditional and new data sources in the production of charts and maps. lts focus is on iszues, not iust data: it informs us on the basis of what needs to be known rather than what is simply easy to illustrate. And, where possible, it hightights [inkages between issues rather than quarantining issues within single portfolios or fields of study. For example, agriculture is as much about economic restructuring, community cohesion and environmental sustainability as it is about crops and animal husbandry. Regiona[ economic development is not iust about industries and employment - it is also about communities, tifestytes and the services needed to attract skilled workers. Throughout this paper, the term 'regional Victoria' refers to non-metropolitan Victoria, that is, a[[ parts of the State which tie outside the Melbourne Statistical Division. While it is a commonly used geographical construct, it is not a single, homogeneous place, but rather a series ofdiverse regions with differing landscapes, [oca[ economies and communities. Regional and Metropolitan 1. dlvergence 'REgionat Victoria is home to approximately r.3 'milli6n peopte and makes a major contribution to Victoria's export wealth through both primary (a gricu ltu re, m i nin g, forestry) and seco ndary (processed or manufactured) products. lt has also shown resilience and adaptability through two decades ofeconomic and social change. The economic base of mhny regions has diversified, new markets have been identified and developed and service-baded industries such as tourism have continued to grow Value-adding rather than bimply exporting raw produce is now much more common, Nevertheless, in sociaI and cultural terms, regional Victoria may be seen to have had more difficulty in Sustaining Regions

Welcome message from author
This document is posted to help you gain knowledge. Please leave a comment to let me know what you think about it! Share it to your friends and learn new things together.
Transcript
New Ways of Seeing Regional Issues:Using Information to Move Beyond Stereotypes
Fiona McKenzie
,.t. I i
': r 'l: .1.. I
'Inffoduction
ln:any debate about regionalAustratia it is easy to
:"use wetl-worn perspectives and stereotypes. For
'policy makers, researchers and media
commentators this can be reinforced by the fact
that most reside in capital cities. Challenging such
stereotypes is an important step in developing and
exploring new perspectives on old problems. For
example, does population decline mean the'death'of a town or a region? Why do many economic
indicators improve in the face of such decline? And
which population are we actua[ly measuring when
we determine patterns of decline? Sometimes, our
understanding ofexisting issues can be re-
invigorated by introducing information from other
fietds of research. lt can also be enhanced through
the development of broader timeframes - both
historical and proiected.
This article examines a number of regional issues in ' .,
such ways. lt arises from work undertaken by the
Victorian Government which has been published as
Regional tulatters: An Atlas of Regional Vktorn.This whole-of-government project involved both
traditional and new data sources in the production
of charts and maps. lts focus is on iszues, not iustdata: it informs us on the basis of what needs to be
known rather than what is simply easy to illustrate.
And, where possible, it hightights [inkages between
issues rather than quarantining issues within singleportfolios or fields of study. For example,
agriculture is as much about economic
restructuring, community cohesion and
environmental sustainability as it is about crops
and animal husbandry. Regiona[ economic
development is not iust about industries and
employment - it is also about communities,
tifestytes and the services needed to attract skilled
workers.
Throughout this paper, the term 'regional Victoria'
refers to non-metropolitan Victoria, that is, a[[ parts
of the State which tie outside the Melbourne
Statistical Division. While it is a commonly used
geographical construct, it is not a single,
homogeneous place, but rather a series ofdiverse
regions with differing landscapes, [oca[ economies
and communities.
Regional and Metropolitan1.
dlvergence
'REgionat Victoria is home to approximately r.3
'milli6n peopte and makes a major contribution toVictoria's export wealth through both primary(a gricu ltu re, m i nin g, forestry) and seco ndary(processed or manufactured) products. lt has also
shown resilience and adaptability through twodecades ofeconomic and social change. The
economic base of mhny regions has diversified,new markets have been identified and developed
and service-baded industries such as tourism have
continued to grow Value-adding rather than bimplyexporting raw produce is now much more common,
Nevertheless, in sociaI and cultural terms, regional
Victoria may be seen to have had more difficulty in
Sustaining Regions
responding to change. Modern economies tend to
favour [arge cities where diverse economic and
social environments continue to attract young
people. Regional areas with more dispersed
populations and fewer urban centres may be
economically efficient and productive, but may be
seen as socia[[y and cultura[[y more isolated than a
large city.
Social expectations have changed greatly over thepast 30 years - mobitity, travel and the internet
make us global citizens, a iob for life has been
replaced by severaI jobs within a career or several
careers within a lifetime, and education is more
tikety to occur throughout one's life rather than for
the first two decades only. ln short, people's lives
are more subject to change than in the past, and
larger centres are able to provide a range ofservices and attractions a[[owing flexibte and
changing lifestyles to be accommodated more
easily.
Australia's geography plays a part in this process as
wetl because the major capital cities dominate theirrespective States with relatively few large cities
being found in regional areas. The contrast between
regional and metropolitan may therefore be [arge
and can exacerbate perceived and real differences
in opportunity and experience between regional
and urban living.
The r importance of linkages
ealegorisation of trends and impacts is important
for,'us: to understand them. However, the process ofcategorisation can often lead us to underestimate
the importance of linkages - the impact of one
factor on another.
Economic change, for example, can have positive
effects on the productivity of a region, but may also
lead to increasing demand for infrastructure or
certain types of skilled labour. ln some cases it may
be difficutt to attract these workers when and
where they are needed. Emerging regionaI industry
opportunities tike the'New Mediterranean' olivegrowing at Boort (north west of Bendigo), or the
mineral sands development in the Mallee have
attracted international investment but where are
the workers to be drawn from? Why aren't people
flocking from Melbourne to the Mallee in order to
take up these jobs? The reasons for skilled workers
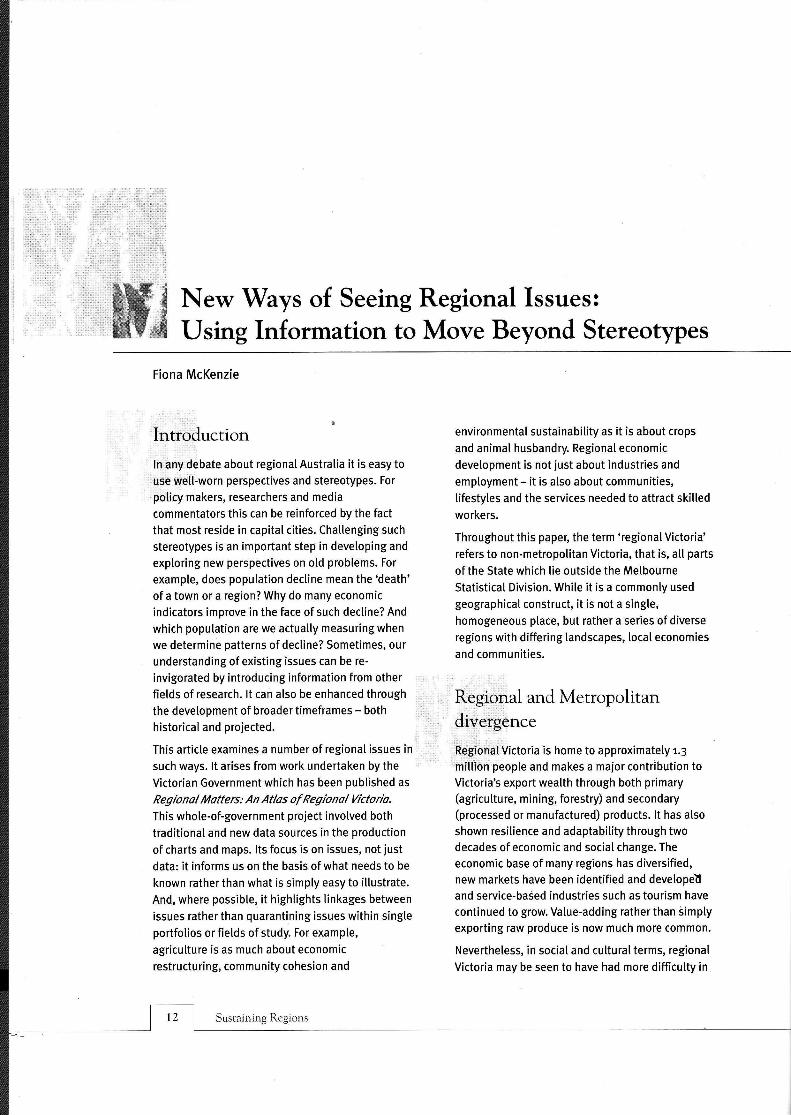
being attracted to a region go beyond the economic
attraction of a job - factors such as the physical
environment, service avaitabitity and social
diversity may all come into play (refer Figure r).
Figure r lmpacts arising from economic change in aregion
Source: Victormn Government 2oo2, p. 7.
These are iust one example of the ways in which
regional issues are intertwined. While these
tinkages add to the comptexity of understandingregional Victoria, it is necessary to approach theseissues with such an understanding in order to
develop appropriate and effective responses toregionaI change.
New ways of seeing regional
Victoria.,l:'..'i'.,.,lvlappr@ Wa te r Res o urce lss ues
Apart from hightighting linkages between issues,
the Regional Atlas aimed, where possible, to give
new insights through creative presentation ofdata
and through the juxtaposition of different types ofdata. This approach was applied to the water
resources section ofthe atlas where socio-
demographic information was overlaid on
environmental data (refer Figure z).
:,il,i:.rl,l
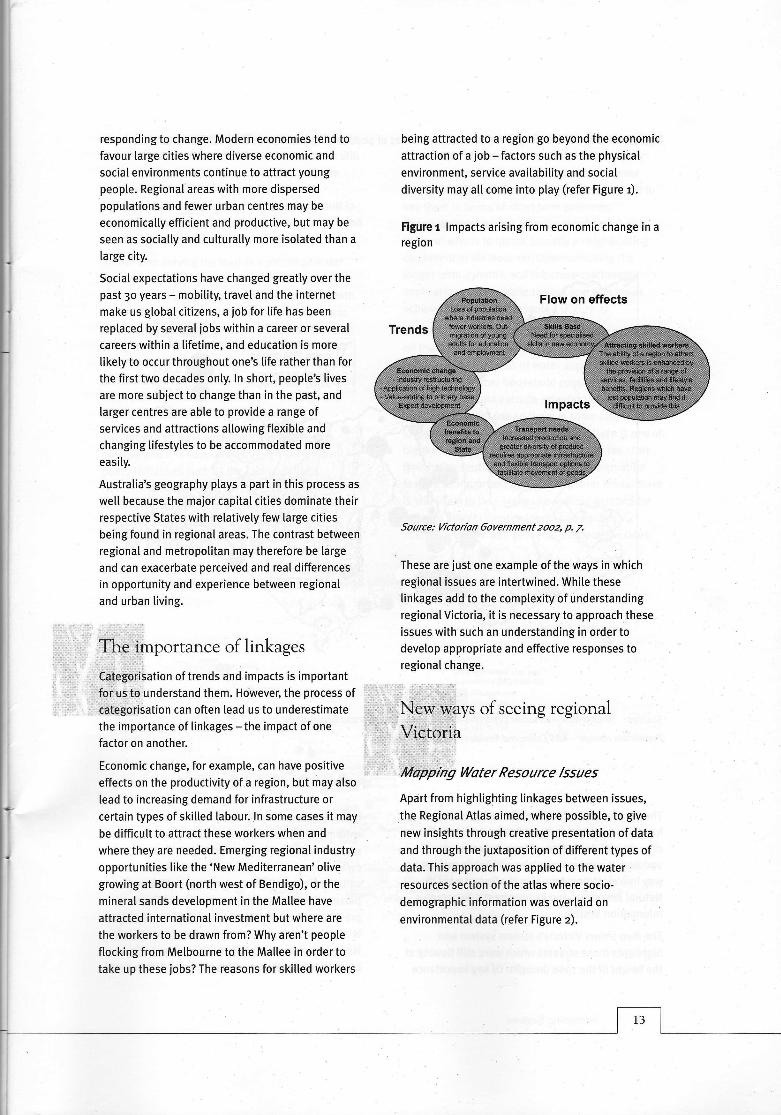
Figure z Stream ftow during drought (rq58) and areas of population growth Gg%to zooo), Victoria
Stream still flowingduring 1968 drought
Stream not flowingduring 1968 drought
Sources: Stream flow - Victoflan Department oflVatural Resources and Environment
Populatbn change -ABS Estrmated Resident Populatbn Counts
mii
Average annualpopulation growthbySLA,1991-2000
fu,oooI z,soo
o 500
The base map itself had an interesting history. lthad been prepared by hand fottowingthe 1968
drought and, having never been repeated or
updated, it survived as a 'one-off'fina[[y making its
way into electronic format in the Department ofNatural Resources and Environment's Geographic
lnformation System.
The map shows Victoria's stream system and
hightights those streams which were still flowing at
the height of the 1968 drought. Of key importance
is that it gives us a picture of severe drought - an
extreme environmental event but one which visited
us again in the early r98os and again in 2oo2. lt is a
cyclical event within Victoria's and Australia's
variable climate. This map provides a differentperspective from average streamflow and also
presents a point of critical shortfall of supply which
is as important to those considering water supply
issues as extreme rainfall events may be to those
considering flood protection.
The map shows that stream flow was maintained in
the south east of the state where streams were sti[[
able to be fed from alpine sources. Towards the
north west, however, the topographic and
hydrographic characteristics ofthe region result in
streamflow vutnerabitity during severe drought, and
consequently water supply vutnerability.
Rather than [eaving the map as a picture of water
resources, the [inkage through to water supply is
foIlowed through by considering population growth.
During the r99os the locations in regional Victoria
which experienced greatest growth were in the ring
of regionaI centres from Geelong through Ballarat
and Bendigo in the west and through to Shepparton
and Wodonga in the north. One thing that strikes us
immediately is that some of these - Bendigo and
Ballarat for example - are growing rapidty.
This growth trend is something that is seen as
positive and it is supported through government
poticy initiatives such as the fast train links.
Nevertheless, there is a potential vulnerability
which may not be evident this year or next year but
which would certainly be evident in a severe
drought. ln one sense, this is not a new issue. The
water boards of Bendigo, Ballarat and Geelong
have voiced concern over issues ofwater supply
and water restrictions for many years. However
there is a tendency when such issues are raised to
see them in terms of short term problems
(inconvenience or cost ofwater restrictions) or in
terms of who is to blame (usuatty a neighbouring
catchment or Melbourne). Communicating the
longer term dynamic and the cross-catchment
implications was a challenge but one which was
achieved in the map presented (Figure z).
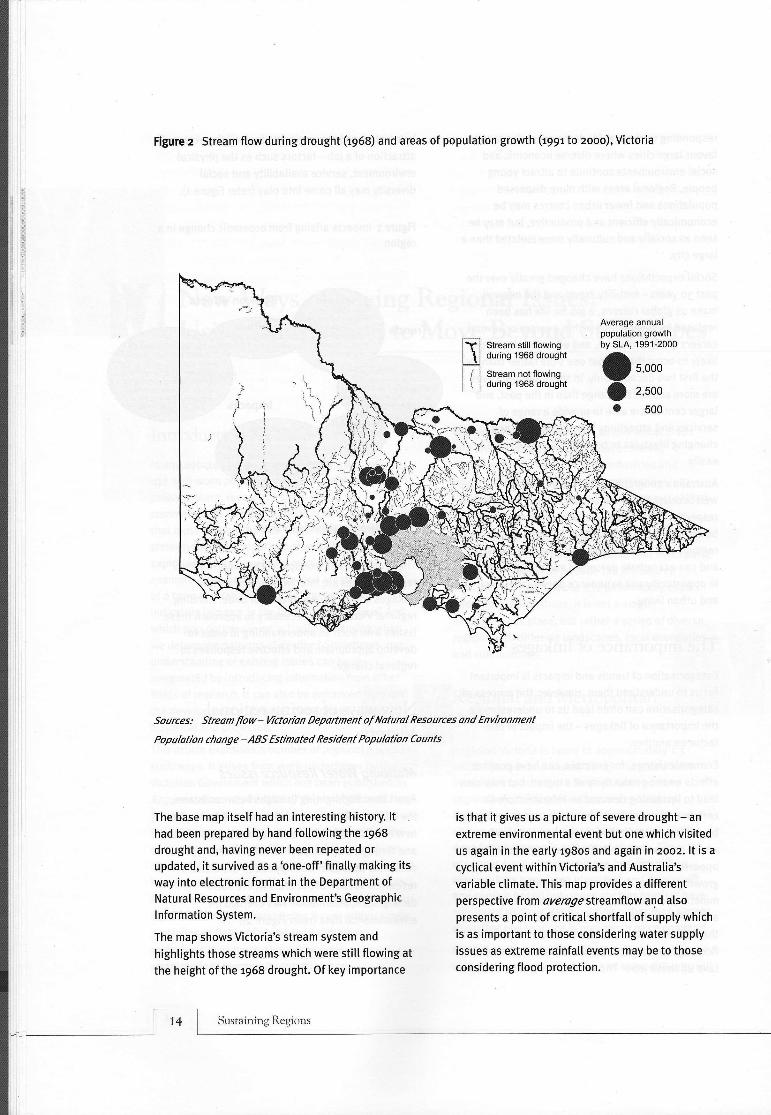
Likewise, water consumption data can be overlaid
on the streamflow map and again we can see a
tension between areas of water supply vulnerability
and areas of higher household consumption (refer
Figure 3). The data exclude irrigation use but
include industrial use so there is some bias to
larger towns and cities. The overal[ pattern is one of
higher consumption in the north west of the state
than in the south east. While water conservation
may be an important part of life in drier areas, there
is stitt tikely to be a higher household demand for
water in hotter climates (pools and garden
maintenance) as we[[ as higher evaporation rates.
Average water use perhousehold (kL) 1998-99
| 4oo and over
I eoo to ggg
ffi zoo to zggE too to tss
Figure 3 Household water consumption for selected settlements, Victoria, ry98-99
Source: ABS Regtbnal Statstics, l/ictoria zoot, pp. 97-98.
i:l
The issue ofskilts shortages has relevance across anumber of agencies. The Departments of Educationand Training as well as the Department of HumanServices raised concerns about attracting'professionals to regional areas. The Department of
attracted or the industries that are not locatingthere because of perceived or real shortages.
As a result of differing perspectives, it was difficuttto present a set ofdata that gave an adequatepresentation ofthe issue. Furthermore, data issues
- avai labi lity, q uality, com prehensiveness andrepresentativeness - became a major cha[[enge.Separately. No one map and no one indicator couldget across the complexity ofthe story. Hence,
various facets of the skills topic were presented inorder to build up a bigger picture.
Managers&Administrators AssociateProfessionalsProducton Managets ChefsChild Care Co-ordinators
TradespeBons & Related WorkersProfessionals Metal Fittere & MachinistsElectriel & Electroni6 Enginers Toolmakers*Building & Engineering Professionals Shuctural Steel & Welding Tradespereons*Acmuntanls Sheetmetal TradespersonsComputing Professionals Motor l\4echanics*
Registered Nurses* Automotive ElectriciansRegistered Midwives Panel BeatersRegistered Mental Health Nurses Vehicle Painters
Registered Devpt Disability Nurses Refrigeration & Airmnditioning MechanicDental Practitioners Carpentry & Jojnery TradespemonsPharmacists Roofslaters & TilersPhysiotherapists BricklayersSpeech Pathologlsts Solid Plastereml\,ledical lmaging Professionals Bakers & Pastrycooks*Olher Health Professionals Printing l\4achinists & Small Offset printere
Pre-PrimarySchoolTeachem Cabinetmakere'&WoodTradespersons
Secondary Schml Teachers* Hairdressets
Urban & Regional Planners Upholsterers & Bedding Tradespersons
'Only fime oeupati@al subgoups within the* @tegoies
lnnovation, lndustry and Regional Development trad :::i::.:.':.;,' ::.::.:i',::,:::l:r.l'
a broad interest in business development, XrXl&ffied Skill Shortage Listsinvestment attraction and the matching of skitts . .. ,.. , ,demand and supply. ..:i*' ,:Ei$$g*lPibsents a list of identified skitts
Despite the existence of a new interdepartme.,rr , .,.,:r,, ,1i#tiffi;li:H:H:il:.industry skills network and the cross-departmental ir,r"rri t.a"ri oou"rnr.nt state specificrelevance of the issue, it was difficutt to pin downthe exact nature orthe issue and to asree on how fji:1ffil[::l',,jjn:i:T#']j|T:;'J,if,il:"tthe issue should be presented through the regional ,ig;;;,,,.irrry in particular regions. Theatlas. The skills issue(s) meant different things ;-.;;r^-,;;::.;;across and within departments: State/Territory Nominated lndependent (STNI)
Scheme enables States and Territories to sponsorDemand skitted independent migrants who are witling to
What skills are needed in a region or by an settle in areas where their skitts are in demand.
industry? Victoria, which participates in the STNI scheme,
What existing ski[s have experienced reduction determines the list of skitts which are in short
in demand? supply on the basis of skilt shortage assessments
Are there seasonalvariations in demand? undertaken by the Department of Employment andWorkplace Relations (DEWR).
Supplywhat is the skilts base of the region?
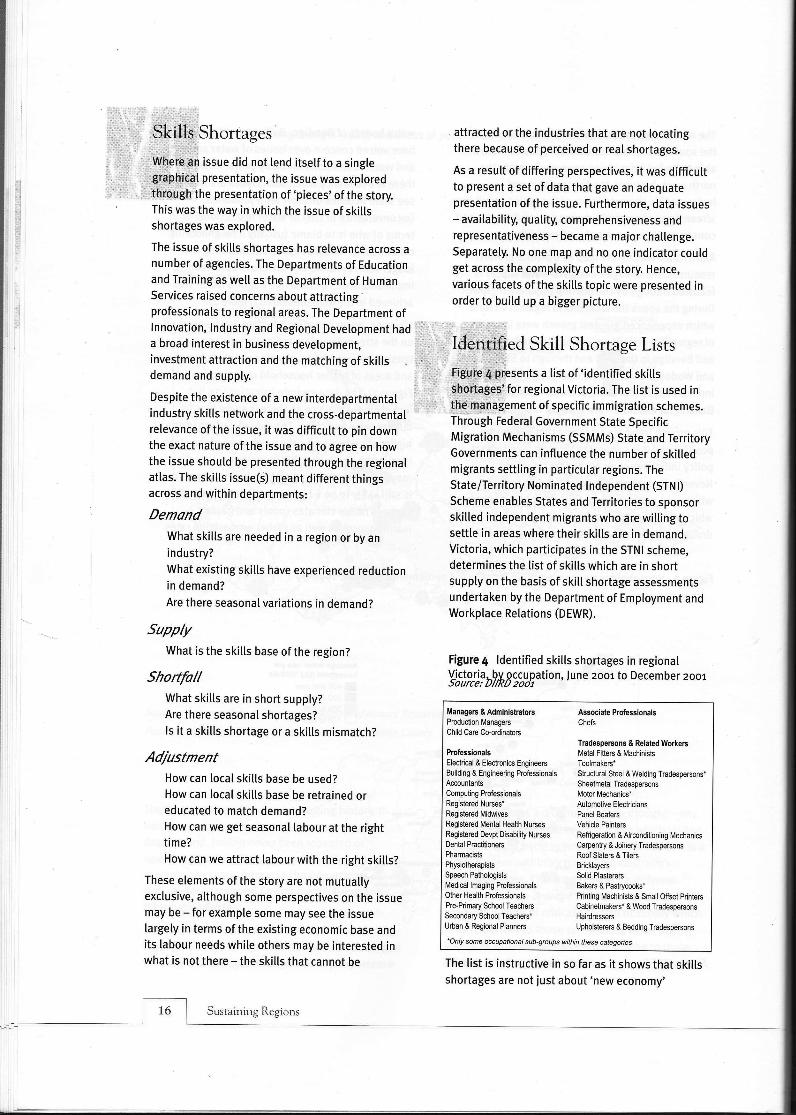
Figure 4 rdentified skitts shortages in regional
Shortfall VL':P;J?*il8ti1gation, June zoor to December zoor
What skitts are in short supply?Are there seasonalshortages? ll;lififii,l#:1''*"" Assciareproressionars
ls it a skills shortage or a skills mismatch? | chird care co-orJinators
I TradespeBons & Related Workers
Adiustment | 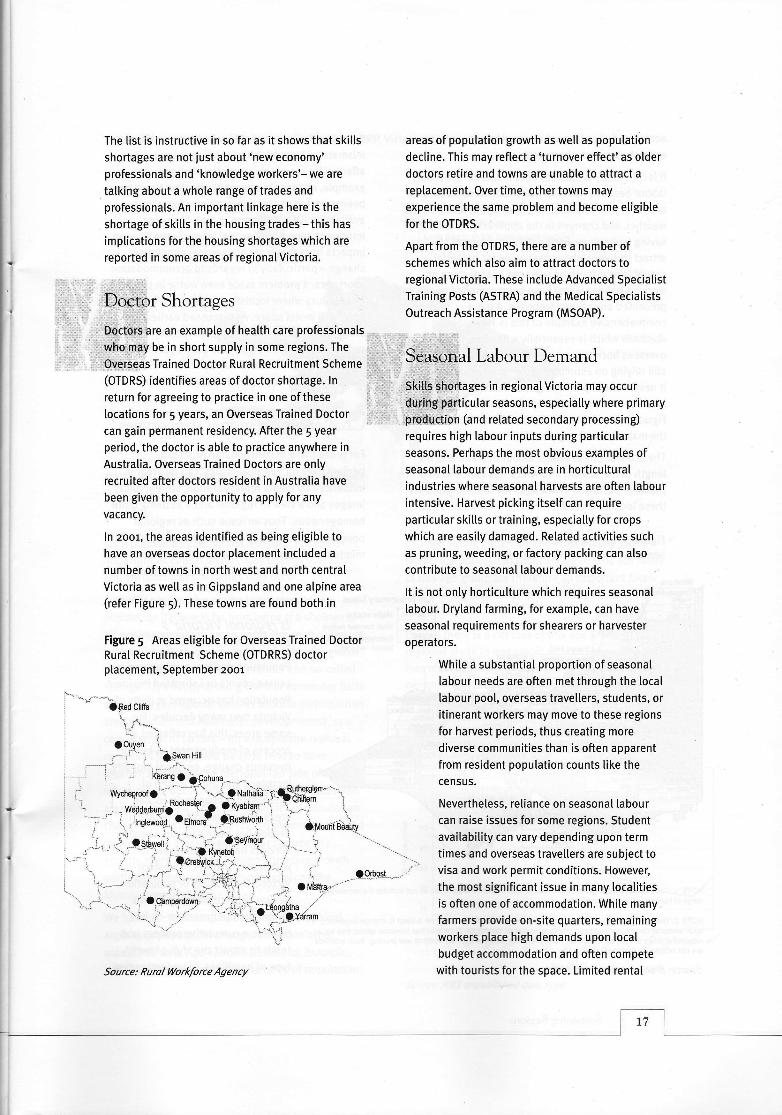
The list is instructive in so far as it shows that skills areas of population growth as well as population
shortages are not just about'new economy' decline. This may reflect a'turnover effect'as olderprofessionals and 'knowtedge workers'- we are doctors retire and towns are unable to attract a
talking about a whole range of trades and replacement. Over time, other towns may
professionals. An important linkage here is the experience the same problem and become etigibte
shortage of skills in the housing trades - this has for the OTDRS.
implications for the housing shortages which are Apart from the OTDRS, there are a number ofreporte: in some areas of regionarVictoria'
L.:,.J:i#,[T.1T.X],:T::**:ff$eciaristShortages Training Posts (ASTRA) and the Medical Specialists
Outreach Assistance Program (MSOAP)...,: ,.. :r..::.:ri::_. UUIfeaCn i
rrr:o'6isf[fEi;1s an example of health care professionals .., ... ....
..:.:.who,may be in short suppty in some regions. The c\ l
,rOverieas trained Doctor Rural Recruitment Scheme ,, , otot-,1(OTDRS) identifies areas of doctor shortage' ln , ,, s-kil-Is s.hqrtages in regionat Victoria may occurreturn for agreeing to practice in one of these
locations for 5 years, an overseas Trained Doctor 'r ':.:1" ' '(l'0rih&piirticutar seasons' especially where primary
can gain permanent residency. After the 5 year " '..." " ..lJffl::;lrf li#ft"#;:i:li1?;iffffii'
period, the doctor is able to practice anywhere in
Austraria. overseas Trained Doctors are onry ::lllll,l|ili;:l:ffi::j;ilT;:il#:i "trecruited after doctors resident in Australia have industries where seasonal harvests are often labourbeen given the opportunity to apply for any intensive. Harvest picking itsetf can requirevacancy' particular skills or training, especially for crops
ln 2oo1, the areas identified as being etigibte to which are easily damaged. Related activities such
have an overseas doctor placement inctuded a as pruning, weeding, or factory packing can also
number oftowns in north west and north central contribute to seasonal labour demands.
Victoria as well as in Gippsland and one alpine area lt is not onty horticutture which requires seasonal(refer Figure 5)' These towns are found both in rabour. Dryrand farming, for exampte, can have
seasonaI requirements for shearers or harvesterFigure 5 Areas eligible for Overseas Trained Doctor operators.Rural Recruitment Scheme (OTDRRS) doctorplacement, september zoor white a substantial proportion of seasonal
labour needs are often met through the local\*._ ..""-,,-') "{ "3n.o
ctitt,""-'-*in.o critr. labour poo[, overseas travellers, students, or
- I itinerant workers may move to these regions'f i""- 'ir' -'1 for harvest periods, thus creating more't :aoiv.l '.- ^.. --,,* diverse communities than is often apparent.--
. , 'ttnn"' from resident poputation counts [ike thefrom resident population counts [ike the
cenSus.
Nevertheless, reliance on seasonal labour
,. i -i] - i,-,)_ -ir; i i .,.,.|; JrsrrrrrLqrrr rJrus rrr rrrqrty rvLqrrrrsJ
, ..i-'..---* ; o.ci'pa'dil" t.-.i,f.,.''^-inod*. , is often one of accommodation. White many,'t - Jl_ , i'
-'" --,1 |!.vd*' farmers provide on-site quarters, remaining
!r-f i'i- :; workers place high demands upon localbudget accommodation and often compete
Source: Rural tlorkforceAgency with tourists for the space. Limited rental
- -- - r -Q*.n Hitt
-i--. Kgrang O agohuna_. --
.- wycheproofo "^^_^.".
- 11..*g
wycheproofo ='\'-ltNail;ii.*5q$tllt*',,!
-,.._ waa**'j.1n.1!tiA 3rvl6"r' '' i:f)' i Nevertheless, reliance on seasonal labour
lnglewod!'Elmoret'Rushwortht: i" -^.._l,l-,
-( , .*"_- --- -'sevffiur ' . t, \.... availability can vary depending upon term
- ;- '' l,',,;;"ilh;oai".,{ r.tsusrr*'oirr 1 ,' i,s"roia:fu, can raise issues for some regions. Student
i - t" os**"fj -t. .*.,-;-- -gwr** ' . " ! availability can vary depending upon term
- ':-'-' ',' -'-*t- ;a;Hff'Ji u',
,t -- - '
' r-rr-i- ; _:"i;**' ".rl- 1 : ,-e9.r!s!r.---,.t* visa and work permit conditions. However,
. --- '- _-^,j t;=!r"T:. ,i ,,.- ovbrs,.-- themostsignificant issue in many.tocatities
accommodation in most regional towns
exacerbates such shortages.
It is inherentty difficutt to obtain data on seasonal
labour because numbers vary from month to month
and from year to year depending on harvests,
weather, and changes in the application of labour'
saving technology. Fortunatety, in attempts to
attract this very labour, resources for potential
casual labour (such as overseas backpackers on
working holidayvisas) have been compiled or
presented on regional websites. A more
comprehensive example of this is Workabout
Australnwhich is essentially a handbook for
overseas backpackers and casual labourers. While
stitt relying on estimates rather than actual counts
it nevertheless provides good coverage ofseasonal
labour needs across the horticuttural industries.
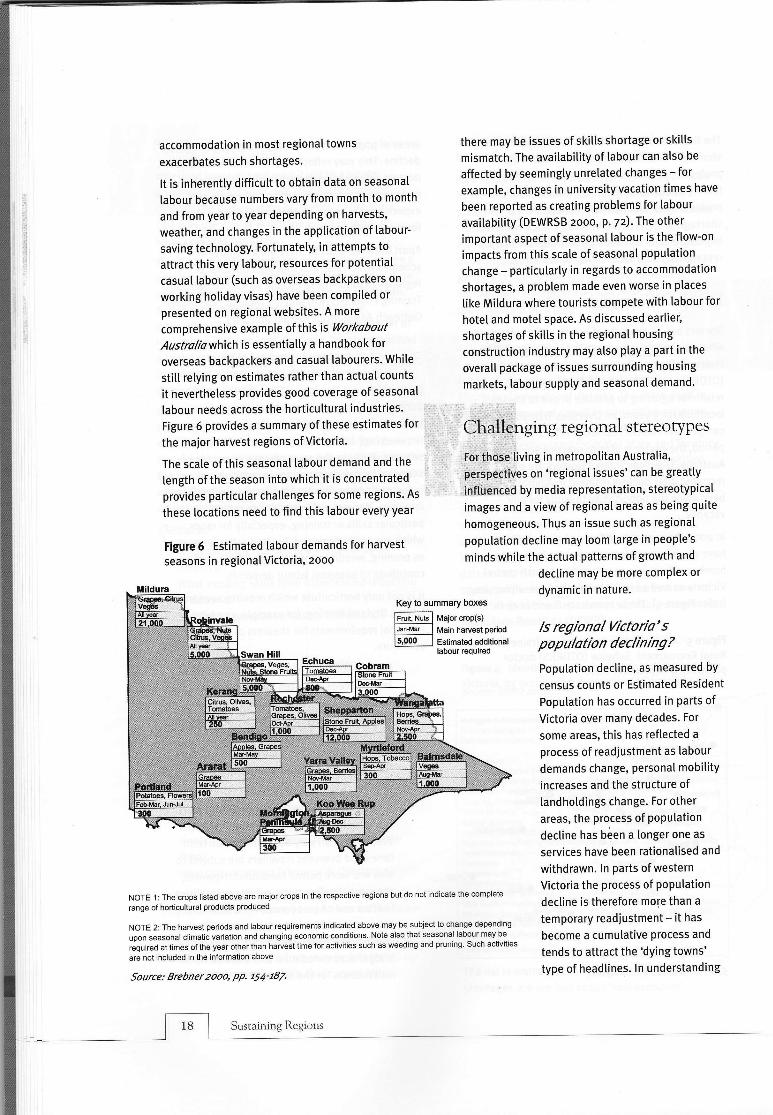
Figure 6 provides a summary of these estimates for
the major harvest regions of Victoria.
The scale ofthis seasona[ [abour demand and the
tength ofthe season into which it is concentrated
provides particular challenges for some regions. As
these locations need to find this labour every year
Figure 6 Estimated labour demands for harvest
seasons in regionalVictoria, zooo
there may be issues of skitts shortage or skitls
mismatch. The avaitability of labour can also be
affected by seemingly unretated changes - for
example, changes in university vacation times have
been reported as creating problems for labour
availabitity (DEWRSB 2ooo, p. 7z). The other
important aspect of seasonal labour is the flow-on
impacts from this scate of seasonal population
change - particutarly in regards to accommodation
shortages, a problem made even worse in ptaces
tike Mitdura where tourists compete with [abour for
hotel and motel space. As discussed earlier,
shortages ofskitls in the regional housing
construction industry may also play a part in the
overall package of issues surrounding housing
markets, tabour supply and seasonal demand.
i, ChaU€nging regional stereotypes
:,Fiif.ifi rltd tivin g in metro potitan Australia,
',,p*i3p.aiiftt on 'regional issues'can be greatly
tirifl iienied by media re presentation, stereotypical
images and a view of regional areas as being quite
homogeneous. Thus an issue such as regional
poputation decline may loom [arge in people's
minds white the actual patterns of growth and
decline maY be more comPlex or
dynamic in nature.
ls regional Victoria'spopulation declining?
Population decline, as measured by
census counts or Estimated Resident
Population has occurred in parts of
Victoria over many decades. For
some areas, this has reflected a
process of readiustment as labour
demands change, personaI mobititY
increases and the structure of
tandholdings change. For other
areas, the process of PoPulationdecline has b6en a longer one as
services have been rationalised and
withdrawn. ln parts of western
Victoria the process of population
decline is therefore mole than a
temporary readiustment - it has
become a cumulative Process and
tends to attract the 'dYing towns'
type of headlines. ln understanding
Key to summary boxes
Major crop(s)
Main haryest period
Estimated additionallabour requirsd
NOTE 1: The crops listed above are major crops in the respective regions but do not indi€te the complete
range of horticultural products produced
NOTE 2: The harvest periods and labour requirements indicated above may be subject to change depending
upon seasonal climatic variation and changing economic conditions. Note also that seasonal labour may be
required at times of the year other than haruest time for activities such as weeding and pruning' Such activities
are not included in the information above
Source: Brebner 2ooq PP. 154-187.
Sr.rstaining Regions
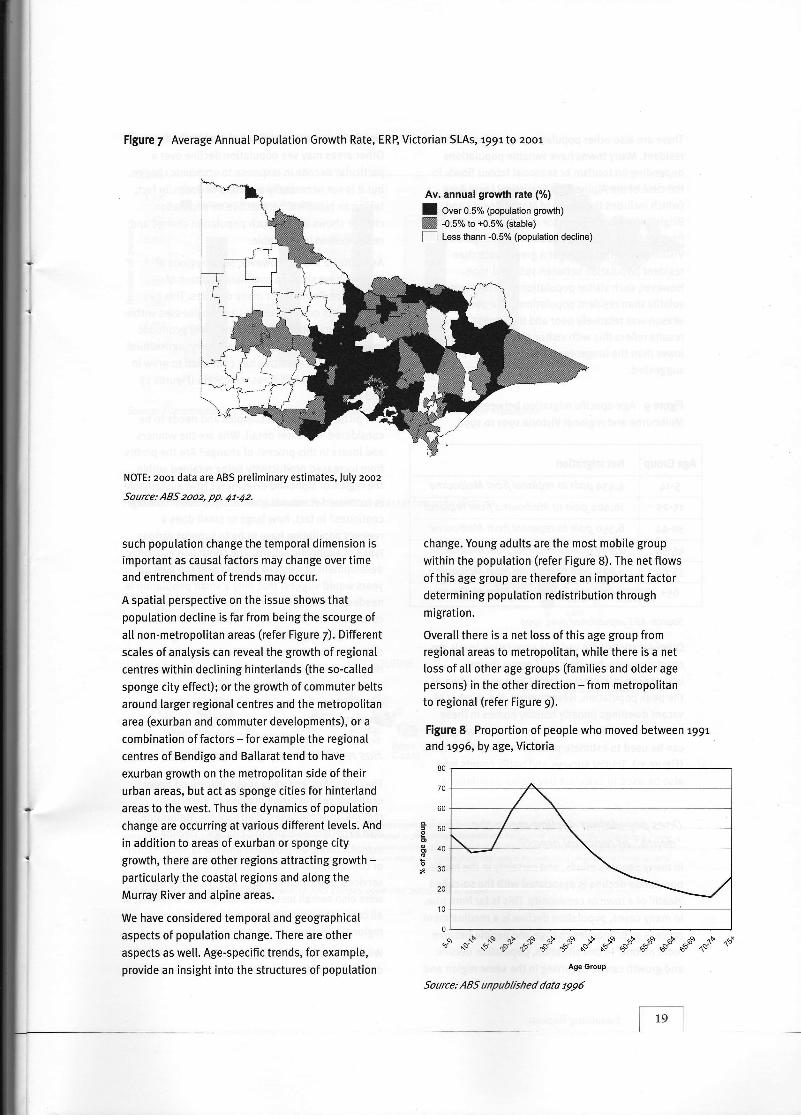
Figure 7 Average Annual Population Growth Rate, ERB Victorian SLAs, r99r to 2oo1
NOTE: zoor data are ABS preliminary estimates, July zooz
Source: ABS zooz, pp. 41-42.
such population change the temporal dimension is
important as causa[ factors may change over time
and entrenchment oftrends may occur.
A spatial perspective on the issue shows thatpopulation decline is far from being the scourge of
all non-metropolitan areas (refer Figure 7). Different
scales of analysis can reveal the growth of regional
centres within declining hinterlands (the so-ca[[ed
sponge city effect); or the growth of commuter belts
around larger regional centres and the metropolitan
area (exurban and commuter devetopments), or a
combination of factors - for example the regional
centres of Bendigo and Ballarat tend to have
exurban growth on the metropolitan side of their
urban areas, but act as sponge cities for hinterland
areas to the west. Thus the dynamics of population
change are occurring at various different levels. And
in addition to areas of exurban or sponge city
growth, there are other regions attracting growth -particularly the coastal regions and atong the
Murray River and alpine areas.
We have considered temporal and geographical
aspects of population change. There are other
aspects as wel[. Age-specific trends, for example,
provide an insight into the structures of population
change. Young adults are the most mobile group
within the population (refer Figure 8). The net flows
of this age group are therefore an important factor
determining population redistribution through
migration.
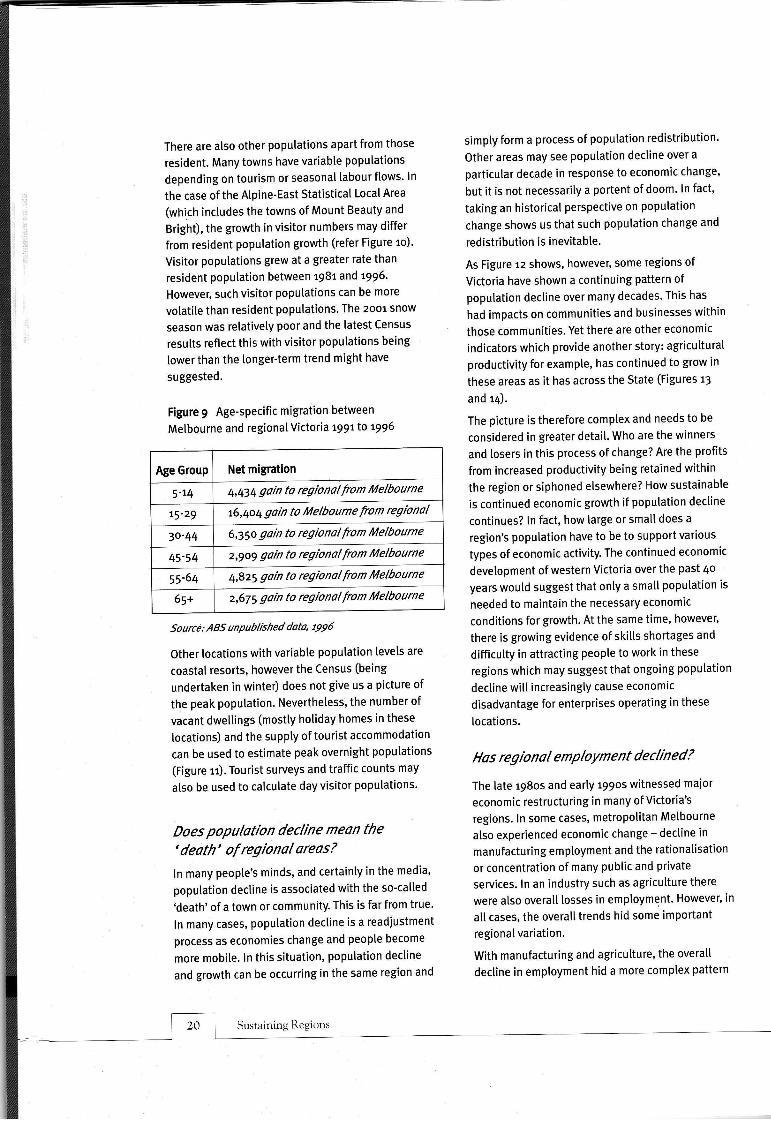
Overall there is a net loss of this age group from
regional areas to metropolitan, while there is a net
loss of all other age groups (famities and older age
persons) in the other direction - from metropolitan
to regional (refer Figure 9).
Figure 8 Proportion of people who moved between r99rand 1996, by age, Victoria
//
\ ./
0+
*o^" "",'" "-tt "-*t
*f +tr "J ,of ".r" ""f"
..d ate C no
Age Group
Source: ABS unpublRhed data ry96
oooooos
80
70
60
50
40
30
20
10
Av. annual growih rate (%)
I Over 0.S% (population grolvth)
ffi -O.Sol" to +0.5% (stable)
f-l Less thann -0.5% (population decline)
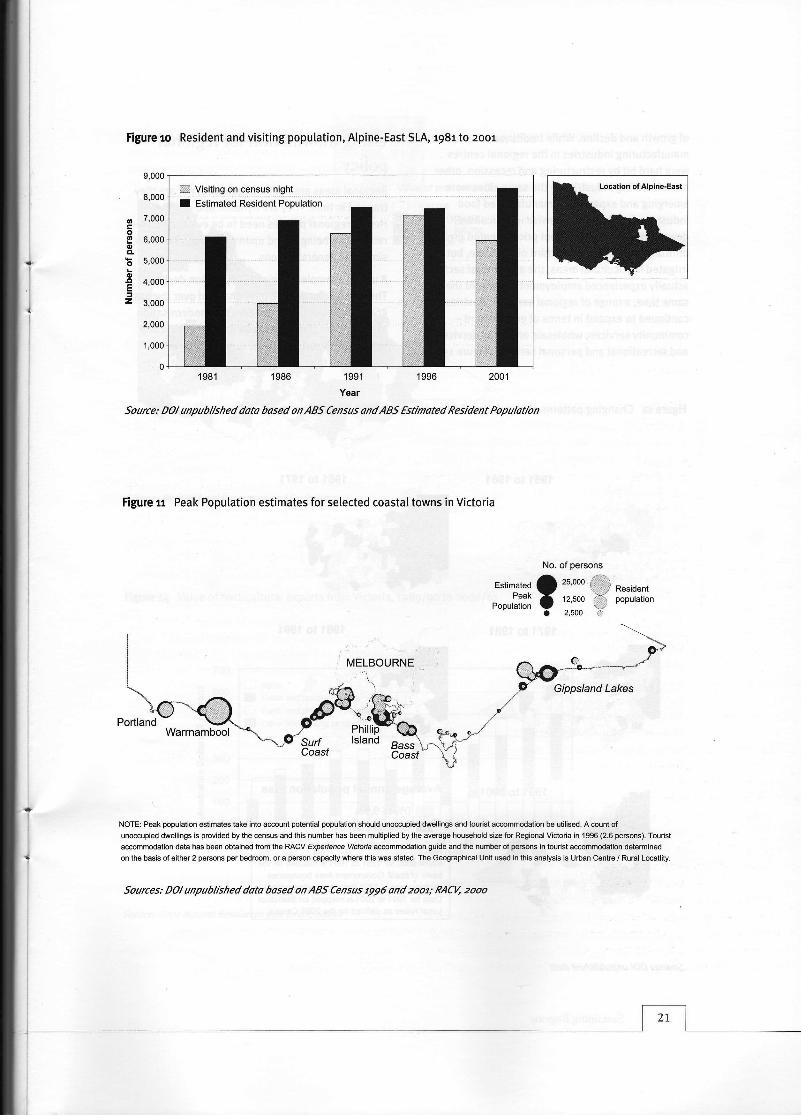
There are also other populations apart from those
resident. Many towns have variabte populations
depending on tourism or seasonal labour flows' ln
the case of the Alpine-East Statistical Local Area
(which includes the towns of Mount Beauty and
Bright), the growth in visitor numbers may differ
from resident poputation growth (refer Figure ro).
Visitor populations grew at a greater rate than
resident population between 98t and 1996.
However, such visitor populations can be more
votatile than resident populations. The zoor snow
season was relatively poor and the latest Census
results reflect this with visitor populations being
lower than the longer'term trend might have
suggested.
Figure 9 Age'specific migration between
Melbourne and regional Victoria r99r to t996
Source: ABS unPublrshed data' ry96
Other locations with variabte population levels are
coastal resorts, however the Census (being
undertaken in winter) does not give us a picture of
the peak population' Nevertheless, the number of
vacant dwellings (mostty hotiday homes in these
locations) and the suppty of tourist accommodation
can be used to estimate peak overnight populations
(Figure rr). Tourist surveys and traffic counts may
also be used to calculate day visitor populations'
Does population decline mean the
' death' of regional areas ?
ln many people's minds, and certainly in the media,
poputation dectine is associated with the so-called
'death' of a town or community. This is far from true'
ln many cases, population decline is a readiustment
process as economies change and people become
more mobile. ln this situation, population decline
and growth can be occurring in the same region and
simpty form a process of population redistribution'
Other areas may see population decline over a
particular decade in response to economic change'
but it is not necessarily a portent of doom' ln fact,
taking an historicat perspective on population
change shows us that such poputation change and
redistribution is inevitabte.
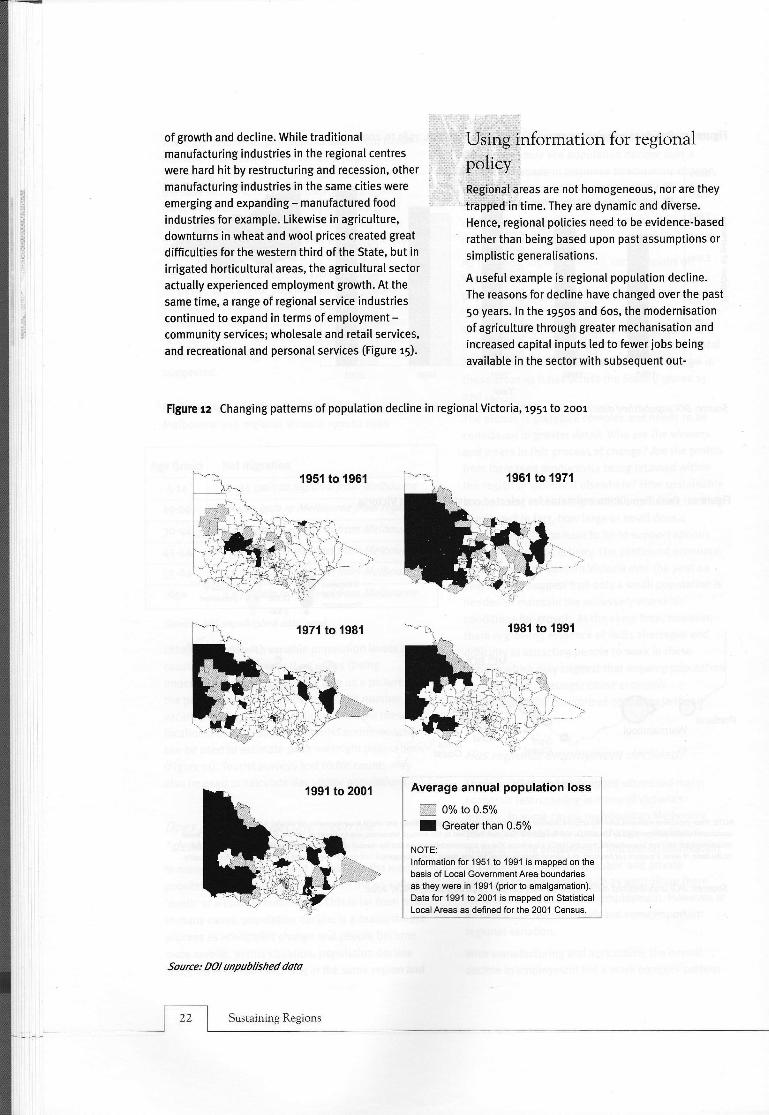
As Figure tz shows, however' some regions of
Victoria have shown a continuing pattern of
poputation dectine over many decades. This has
had impacts on communities and businesses within
those communities. Yet there are other economic
indicators which provide another story: agricultural
productivity for example, has continued to grow in
these areas as it has across the State (Figures r3
and r4).
The picture is therefore complex and needs to be
considered in greater detait. Who are the winners
and losers in this process ofchange? Are the profits
from increased productivity being retained within
the region or siphoned elsewhere? How sustainable
is continued economic growth if poputation decline
continues? ln fact, how large or small does a
region's population have to be to support various
types of economic activity' The continued economic
development of western Victoria over the past 40
years would suggest that onty a small poputation is
needed to maintain the necessary economic
conditions for growth. At the same time, however,
there is growing evidence of skitts shortages and
difficutty in attracting people to work in these
regions which may suggest that ongoing population
decline will increasingly cause economic
disadvantage for enterprises operating in these
locations.
Has regional emqloYment declined?
The late r98os and earty l99os witnessed maior
economic restructuring in many of Victoria's
regions. ln some cases, metropolitan Melbourne
also experienced economic change - dectine in
manufacturing employment and the rationalisation
or concentration of many public and private
services. ln an industry such as agriculture there
were also overall losses in employment. However, in
all cases, the overall trends hid some important
regionaI variation.
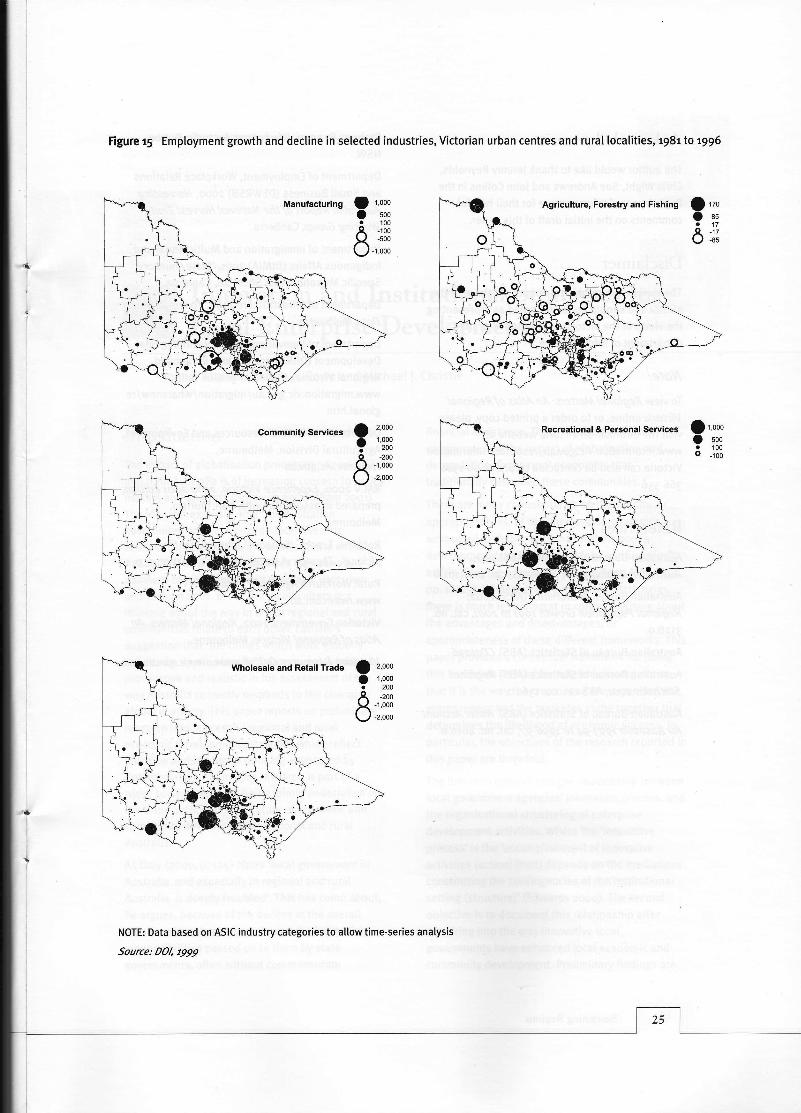
With manufacturing and agriculture, the overall
decline in employment hid a more complex pattern
Age Group Net migration
5'74 4,434 gain to regionol from Melbourne
15-29 16,4o4 gain to tl4elbourne from regbnol
30'44 535o gan to regional from /l4elbourne
45'54 2,9o9 gain to regbnol from /l4elbourne
55'64 4,825 gan to regional from tVelbourne
65+ 2,675 gah to regional from Melbourne
9,000
8,000
o 7,000Eog 6,000ottb 5,000
o
t 4,000
=z 3,ooo
2,000
'1,000
0
Figure ro Resident and visiting population, Alpine-East SLA, r98r to 2oo1
1981 1986 1991 1996 2001
Year
Source: DOl unpublished data based on ABS Census and ABS Estimated Resrdent Populatbn
Figure u Peak Population estimates for selected coastal towns in Victoria
EstimatedPeak
Population
No. of persons
O r5,ooo {_+(t 12'5oo Sa 2,500 o
Residentpopulation
MELBOURNE.\
Gippsland Lakes
PortlandWarrnambool
SurfCoasf
lsland
NOTE: Peak population estimates take into arcount potential population should unoccupied dwellings and tourist a@mmodalion be utilised, A count ofun@upied dwellings is provided by the census and this number has been multiplied by the aveEge household size for Regional Victoria in 1996 (2.6 peEons). Tourist
a@ommodation data has b€en obtained from the RACV Expelien@ Victoiaac@mmodation guide and the numberof pemns in tourist ac@mmodation determined
on lhe basis of either 2 persons per bedroom, or a person capacity wheB this was stated. The GeogEphi€l Unit used in this analysis is Urlran Centre / Rural Locatlity.
Sources: DOl unpublished data based on ABS Census t996 and zoot; R4Cl4, zooo
of growth and decline. While traditionalmanufacturing industries in the regional centres
were hard hit by restructuring and recession, other
manufacturing industries in the same cities were
emerging and expanding - manufactured food
industries for example. Likewise in agriculture,
downturns in wheat and wool prices created great
difficulties for the western third of the State, but in
irrigated horticultural areas, the agricultural sector
actually experienced employment growth. At the
same time, a range of regional service industries
continued to expand in terms of employment -community services; wholesale and retaiI services,
and recreational and personal services (Figure rS).
i t: ,::: . ,,i:,,:au,ii:'
UM$:i"f"rmation for regional
,,::::rr "r:t,
:r, ,a:r..
8,9-$pndereas are not homogeneous, nor are they
fiiipped in time. They are dynamic and diverse.
Hence, regional policies need to be evidence-based
rather than being based upon past assumptions or
simplistic generalisations.
A useful example is regional population decline.
The reasons for decline have changed over the past
50 years. ln the r95os and 6os, the modernisation
of agriculture through greater mechanisation and
increased capital inputs led to fewer jobs being
available in the sector with subsequent out-
Figure rz Changing patterns of population decline in regional Victoria, r95r to 2oo1
Source: DOI unpublished data
EI
NOTE:
Average annual population loss
0%to05%Greater than 0.5%
lnformation for 1951 to 1991 is mapped on thebasis of Local Government Area boundariesas they were in 1991 (prior to amalgamation).Data for 1991 to 2001 is mapped on StatisticalLocal Areas as defined for the 2001 Census.
Sustaining Regions
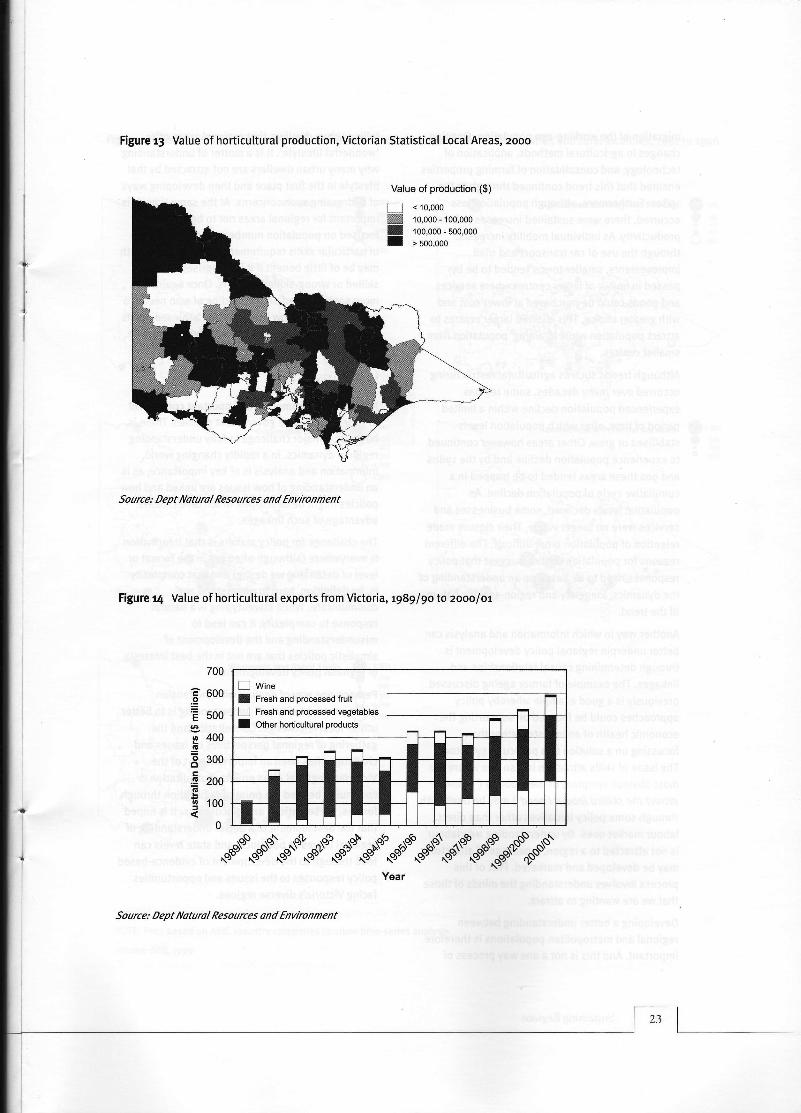
Figure r3 Value of horticultural production, Victorian Statistical Local Areas, zooo
Source: Dept lvatural Resources and Environment
Figure r4 Value of horticu ltural exports from Victoria, ry89 | 9o to zooo/or
E wine
I Freshandprocessedfruit
-
=ffi:i;::ffi:;il:H""*#{--lJJ T I tI
E
T I
II
T I.*tt**""\r$*r"€^rel"ir""ts."*tt".r""t
Year
Source: Dept lVatural Resources and Envt'ronment
700
e 600o
=E 500q
E 400sI soo
g 200(!
! roo
0
Value of production ($)
IffiII
migration of the working-age population. Ongoing
changes in agriculturaI methods, application of
technology, and consolidation of farming properties
ensured that this trend continued through to the
r98os. Furthermore, although population loss
occurred, there were sustained increases in farm
productivity. As individual mobility increased
through the use of car transport and road
improvements, smaller towns tended to be by'passed in favour of larger centres where services
and goods could be purchased at lower cost and
with greater choice. This allowed larger centres to
attract population while'draining' population from
smaller centres.
Although trends such as agriculturaI restructuring
occurred over many decades, some regions
experienced population decline within a limited
period of time, after which population levels
stabitised or grew. Other areas however continued
to experience population decline and by the r98os
and 9os these areas tended to be trapped in a
cumulative cycle of population decline. As
poputation levels declined, some businesses and
services were no longer viable. Their closure made
retention of population more difficult. The different
reasons for population decline suggest that policy
responses need to be based on an understanding of
the dynamics, [ongevity and region-specific nature
of the trend.
Another way in which information and analysis can
better underpin regional policy development is
through determining causaI relationships and
[inkages. The example of farmer ageing discussed
previously is a good example whereby policy
approaches could be focused on supporting the
economic health of an industry rather than
focussing on a solution to a particular symptom.
The issue of skills attraction is also one where the
most obvious symptom of the probtem (/ connot
attract the skilled labour / need') may be dealt with
through some policy initiatives other than direct
labour market ones. By understanding whylabour
is not attracted to a region, a package ofattractors
may be developed and marketed. Part of thisprocess involves understandingthe minds of those
that we are wanting to attract.
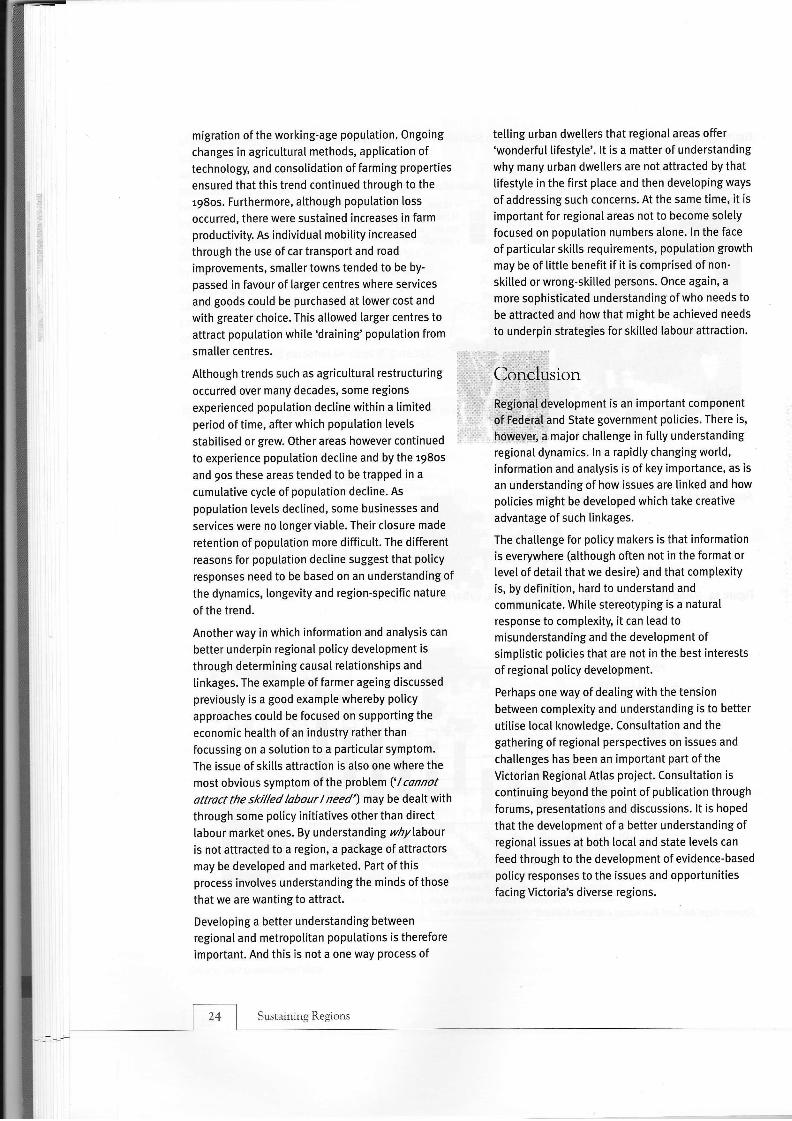
Developing a better understanding between
regionaI and metropolitan populations is therefore
important. And this is not a one way process of
telling urban dwellers that regionalareas offer
'wonderfu[ lifestyle'. lt is a matter of understanding
why many urban dwellers are not attracted by that
tifestyle in the first place and then developing ways
of addressing such concerns. At the same time, it is
important for regional areas not to become solely
focused on population numbers alone. ln the face
of particular ski[[s requirements, population growth
may be of tittle benefit if it is comprised of non-
skilled or wrong-skilted persons. Once again, a
more sophisticated understanding of who needs to
be attracted and how that might be achieved needs
to underpin strategies for skilled labour attraction.
10n
is an important component
ibnd State government policies. There is,
,d.maior chaltenge in fully understanding
regional dynamics. ln a rapidly changing world,
information and analysis is of key importance, as is
an understandingofhow issues are [inked and how
policies might be developed which take creative
advantage of such [inkages.
The challenge for policy makers is that information
is everywhere (although often not in the format or
level of detaiI that we desire) and that complexity
is, by definition, hard to understand and
communicate. While stereotyping is a natural
response to comptexity, it can lead to
misunderstanding and the development ofsimptistic policies that are not in the best interests
of regionaI policy development.
Perhaps one way of deating with the tension
between complexity and understanding is to better
utilise local knowledge. Consultation and thegathering of regional perspectives on issues and
challenges has been an important part oftheVictorian Regional Atlas project. Consultation is
continuing beyond the point of publication through
forums, presentations and discussions. lt is hoped
that the development of a better understanding ofregional issues at both locat and state levels can
feed through to the development of evidence-based
policy responses to the issues and opportunities
facing Victoria's diverse regions.
1,000
500100
-100-500
1,000
Figure r5 Employment growth and decline in selected industries, Victorian urban centres and rural localities, ry8tto t996
NOTE: Data based on ASIC industry categories to allow time-series analysis
Source: DO/, t999
2,000
1,000200
-2001,000
2,000
2,000
1,000200-200
-'1,000
-2,000
Achowledgements.:
.. '.: .':.. :
Ihb author woutd like to thank Jeremy Reynolds,
',;',qlri5 Wight, Sue Andrews and John Cottins in the
.:: :Department of lnfrastructure for their hetpfut
comments on the initial draft of this paper.
lDisolaimer
The vlews expressed in this paper are those of the
,,::3g1fi61':6nd should not be regarded as representing
the views of the Victorian Government or the
department of lnfrastructure
Note:
To view Regional l4afters: An Atlas of RegbnalVictormonline, orto order a printed copy, please
visit the lnformation Victoria website at
www.i nformation.vic. gov.au/ resources I nformation
Victoria can also be contacted by phone on 13oo
366 356
' ,. .,i...]l-.,..t,.
,'Refi nces
, Australian Bureau of Statistics (ABS) zoor,:',:, Aiastra:lmn Demogrophrc Statistrcs, cat. no. 31o1.o
,, Australian Bureau of Statistics (ABS) zooz,
Regional Population Growth t99t to 2ooL cat. no.
3rz8,o,
Australian Bureau ofStatistics (ABS) CDatag6
Australian Bureau of Statistics (ABS) RegbnalStotistics 2oo1, ABS cat. no. 136z.z
Australian Bureau of Statistics (ABS) WaterAccount
forAustralia ry9j-94 to z996-97, cat. no.46ro.o
Brebner, B. zooo, WorkaboutAustralia, Dubbo,
NSW.
Department of Employment, Workplace Relations
and Small Business (DEWRSB) zooo, Harvesting
Australia: Report of the l{atbnol Horvest Trail
Working Gro up, Can berra.
Department of lmmigration and Multicultural and
I nd i genous Affairs (D I M lA) zoor,'State/TerritorySpecific Migration' Fact Sheet 26, Canberra.
Department of lnfrastructure t999, Towns in Time:
Data, Melbourne.
Department of lnnovation, lndustry and Regional
Development (DllRD) zoor,'Skills in Demand,
Regional Victoria', Skilled Migration Unit,
www.m i gration.vic. gov.a u / mi gration /whatsnew/regiona[.htm
Department of Natural Resources and Environment,
Agricultural Division, Melbourne,
www.nre.vic.gov.au
RACV zooo, Expenence Victorn. zooo-zoot edition,
prepared in association with AAA Tourism,
Melbourne.
Robbins, T. zoor, 'Seasonal iobs ripe for the
picking', The Age ft December zoor, Section 7, p. r.
Rural Workforce Agency of Victoria,
www.rwav.com.au
Victorian Government zooz, Regronal Matters. An
Atlas of Regbnal Victoria. Melbourne.
Victo rmn Reso urces On lin e, www.n re.vic. gov.a u /vro
Sustaining Regions
Related Documents