Vienna Yearbook of Population Research 2007, pp. 237-270 New times, old beliefs: Projecting the future size of religions in Austria Anne Goujon, Vegard Skirbekk, Katrin Fliegenschnee and Pawel Strzelecki ∗ Abstract The relative sizes of secular and religious populations belong to the most important social characteristics of each country. In the wake of religious change, family behaviour, including marriage and childbearing, is likely to be altered. European demographic trends, including those of late childbearing and low fertility are also likely to change when there is a growth of religious groups where conversion/secularisation rates are low and childbearing levels are high. We project the membership size of the various religious groupings until 2051 for Austria, a country where the religion question is included in the census, allowing detailed and accurate projections to be made. We consider relative fertility rates, religion-specific emigration and immigration, conversion rates and intergenerational transmission of religious affiliation. Our estimates suggest that the Catholic proportion will decrease from 75% in 2001 to less than 50% in 2051. The Muslim population, which grew from 1% in 1981 to 4% in 2001, will represent 14% to 18% of the Austrian population by 2051, and could represent up to 32% of those below 15 years of age. The Protestants’ population share will be stable at around 4%, while up to 34% of the population will be without religion. 1 Religions in Austria: Past, present, prospects Austria was in the past—as it is today—predominantly Roman Catholic, though several religious minorities, in particular Jewish and Orthodox communities, have existed for many centuries. From the beginning of the sixteenth century, ∗ Anne Goujon, Vienna Institute of Demography, Austrian Academy of Sciences, Vienna, Austria and International Institute for Applied Systems Analysis, Laxenburg, Austria. Vegard Skirbekk, International Institute for Applied Systems Analysis, Laxenburg, Austria. Katrin Fliegenschnee (author for correspondence), Vienna Institute of Demography, Austrian Academy of Sciences, Wohllebengasse 12-14, 1040 Vienna, Austria. Email: [email protected] Pawel Strzelecki, Institute of Statistics and Demography, Warsaw School of Economics, Warsaw, Poland. DOI: 10.1553/populationyearbook2007s237

Welcome message from author
This document is posted to help you gain knowledge. Please leave a comment to let me know what you think about it! Share it to your friends and learn new things together.
Transcript

Vienna Yearbook of Population Research 2007, pp. 237-270
New times, old beliefs: Projecting the future size of religions in Austria
Anne Goujon, Vegard Skirbekk, Katrin Fliegenschnee and Pawel Strzelecki∗
Abstract
The relative sizes of secular and religious populations belong to the most important social characteristics of each country. In the wake of religious change, family behaviour, including marriage and childbearing, is likely to be altered. European demographic trends, including those of late childbearing and low fertility are also likely to change when there is a growth of religious groups where conversion/secularisation rates are low and childbearing levels are high. We project the membership size of the various religious groupings until 2051 for Austria, a country where the religion question is included in the census, allowing detailed and accurate projections to be made. We consider relative fertility rates, religion-specific emigration and immigration, conversion rates and intergenerational transmission of religious affiliation. Our estimates suggest that the Catholic proportion will decrease from 75% in 2001 to less than 50% in 2051. The Muslim population, which grew from 1% in 1981 to 4% in 2001, will represent 14% to 18% of the Austrian population by 2051, and could represent up to 32% of those below 15 years of age. The Protestants’ population share will be stable at around 4%, while up to 34% of the population will be without religion. 1 Religions in Austria: Past, present, prospects
Austria was in the past—as it is today—predominantly Roman Catholic, though several religious minorities, in particular Jewish and Orthodox communities, have existed for many centuries. From the beginning of the sixteenth century, ∗ Anne Goujon, Vienna Institute of Demography, Austrian Academy of Sciences, Vienna, Austria
and International Institute for Applied Systems Analysis, Laxenburg, Austria. Vegard Skirbekk, International Institute for Applied Systems Analysis, Laxenburg, Austria. Katrin Fliegenschnee (author for correspondence), Vienna Institute of Demography, Austrian
Academy of Sciences, Wohllebengasse 12-14, 1040 Vienna, Austria. Email: [email protected]
Pawel Strzelecki, Institute of Statistics and Demography, Warsaw School of Economics, Warsaw, Poland.
DOI: 10.1553/populationyearbook2007s237
Projecting the future size of religions in Austria 238
following the reformation, many Austrians converted to Protestantism, though the Habsburg emperors remained Roman Catholic. The Counter-Reformation, led by Ferdinand II around 1600, had the effect that Austria again became almost exclusively Roman Catholic. It was only on the force of the Tolerance Patent enacted by Joseph II in 1781 that the Protestant, Orthodox Christian and Jewish faiths ceased to be forbidden (Reingrabner 1981; Bundespressedienst 2004). However, most Austrians remained Roman Catholic, and the 1869 census reveals that the proportion of Catholics varied between 94.8% and 99.8%, depending on the region of the country1 (Flora 1983).
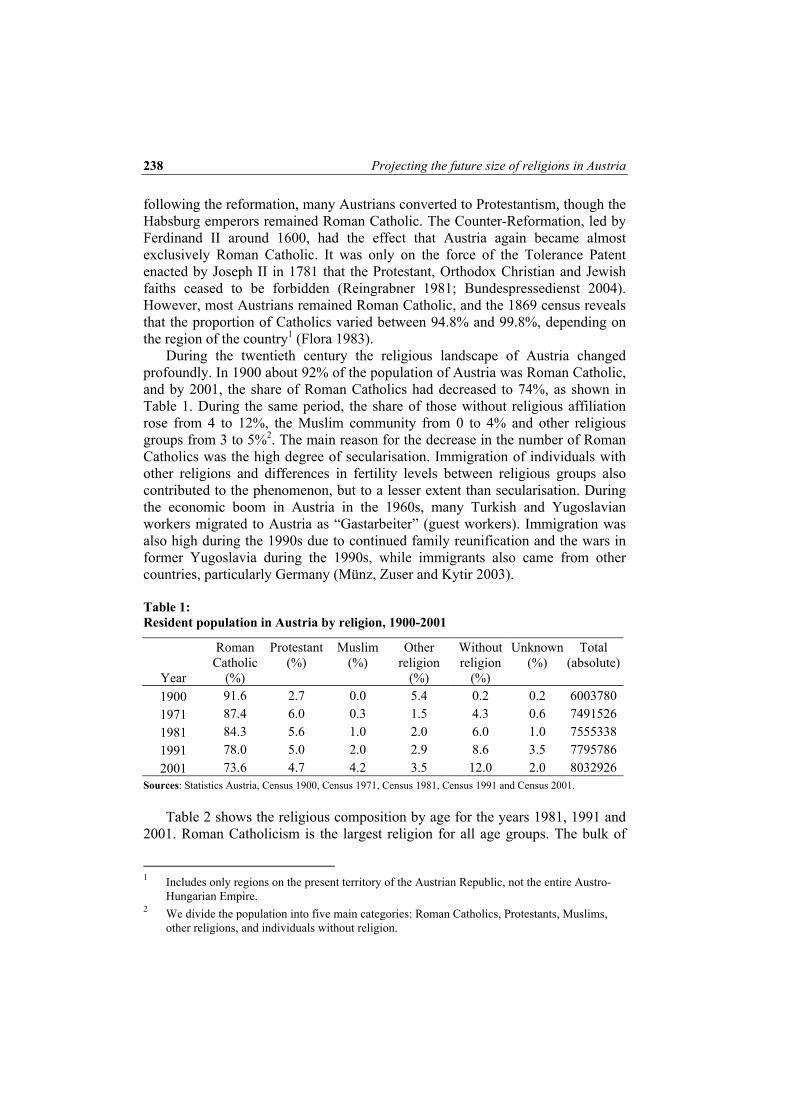
During the twentieth century the religious landscape of Austria changed profoundly. In 1900 about 92% of the population of Austria was Roman Catholic, and by 2001, the share of Roman Catholics had decreased to 74%, as shown in Table 1. During the same period, the share of those without religious affiliation rose from 4 to 12%, the Muslim community from 0 to 4% and other religious groups from 3 to 5%2. The main reason for the decrease in the number of Roman Catholics was the high degree of secularisation. Immigration of individuals with other religions and differences in fertility levels between religious groups also contributed to the phenomenon, but to a lesser extent than secularisation. During the economic boom in Austria in the 1960s, many Turkish and Yugoslavian workers migrated to Austria as “Gastarbeiter” (guest workers). Immigration was also high during the 1990s due to continued family reunification and the wars in former Yugoslavia during the 1990s, while immigrants also came from other countries, particularly Germany (Münz, Zuser and Kytir 2003).
Table 1: Resident population in Austria by religion, 1900-2001
Year
Roman Catholic
(%)
Protestant (%)
Muslim (%)
Other religion
(%)
Without religion
(%)
Unknown (%)
Total (absolute)
1900 91.6 2.7 0.0 5.4 0.2 0.2 6003780 1971 87.4 6.0 0.3 1.5 4.3 0.6 7491526 1981 84.3 5.6 1.0 2.0 6.0 1.0 7555338 1991 78.0 5.0 2.0 2.9 8.6 3.5 7795786 2001 73.6 4.7 4.2 3.5 12.0 2.0 8032926
Sources: Statistics Austria, Census 1900, Census 1971, Census 1981, Census 1991 and Census 2001.
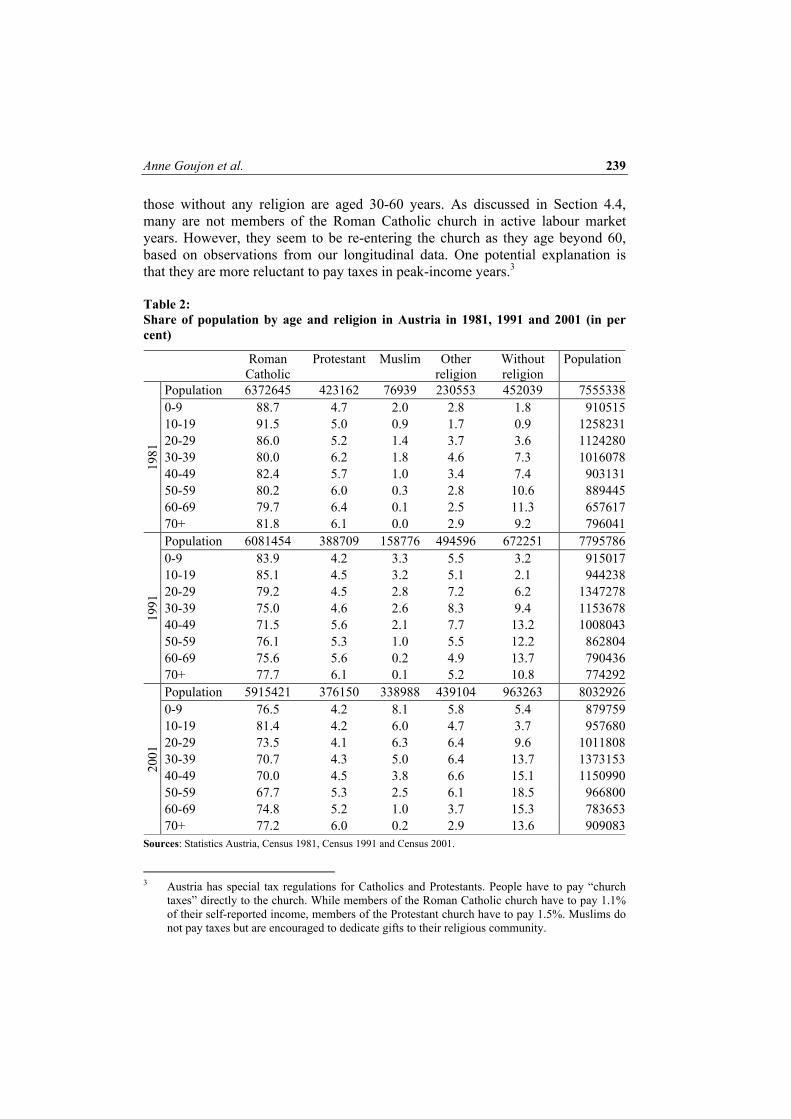
Table 2 shows the religious composition by age for the years 1981, 1991 and 2001. Roman Catholicism is the largest religion for all age groups. The bulk of
1 Includes only regions on the present territory of the Austrian Republic, not the entire Austro-
Hungarian Empire. 2 We divide the population into five main categories: Roman Catholics, Protestants, Muslims,
other religions, and individuals without religion.
Anne Goujon et al. 239
those without any religion are aged 30-60 years. As discussed in Section 4.4, many are not members of the Roman Catholic church in active labour market years. However, they seem to be re-entering the church as they age beyond 60, based on observations from our longitudinal data. One potential explanation is that they are more reluctant to pay taxes in peak-income years.3
Table 2: Share of population by age and religion in Austria in 1981, 1991 and 2001 (in per cent)
Roman Catholic
Protestant Muslim Other religion
Without religion
Population
Population 6372645 423162 76939 230553 452039 75553380-9 88.7 4.7 2.0 2.8 1.8 91051510-19 91.5 5.0 0.9 1.7 0.9 125823120-29 86.0 5.2 1.4 3.7 3.6 112428030-39 80.0 6.2 1.8 4.6 7.3 101607840-49 82.4 5.7 1.0 3.4 7.4 90313150-59 80.2 6.0 0.3 2.8 10.6 88944560-69 79.7 6.4 0.1 2.5 11.3 657617
1981
70+ 81.8 6.1 0.0 2.9 9.2 796041Population 6081454 388709 158776 494596 672251 77957860-9 83.9 4.2 3.3 5.5 3.2 91501710-19 85.1 4.5 3.2 5.1 2.1 94423820-29 79.2 4.5 2.8 7.2 6.2 134727830-39 75.0 4.6 2.6 8.3 9.4 115367840-49 71.5 5.6 2.1 7.7 13.2 100804350-59 76.1 5.3 1.0 5.5 12.2 86280460-69 75.6 5.6 0.2 4.9 13.7 790436
1991
70+ 77.7 6.1 0.1 5.2 10.8 774292Population 5915421 376150 338988 439104 963263 80329260-9 76.5 4.2 8.1 5.8 5.4 87975910-19 81.4 4.2 6.0 4.7 3.7 95768020-29 73.5 4.1 6.3 6.4 9.6 101180830-39 70.7 4.3 5.0 6.4 13.7 137315340-49 70.0 4.5 3.8 6.6 15.1 115099050-59 67.7 5.3 2.5 6.1 18.5 96680060-69 74.8 5.2 1.0 3.7 15.3 783653
2001
70+ 77.2 6.0 0.2 2.9 13.6 909083Sources: Statistics Austria, Census 1981, Census 1991 and Census 2001.
3 Austria has special tax regulations for Catholics and Protestants. People have to pay “church
taxes” directly to the church. While members of the Roman Catholic church have to pay 1.1% of their self-reported income, members of the Protestant church have to pay 1.5%. Muslims do not pay taxes but are encouraged to dedicate gifts to their religious community.
Projecting the future size of religions in Austria 240
In this study, we project the future religious composition in Austria using a set of scenarios that take into account age-specific fertility, migration and secularisation. We base our estimates on a rich set of data covering the entire Austrian population from 1981 to 2001. The dataset allows us to estimate age-, sex- and religion-specific migration and fertility in addition to the number of exiting and entering members from and to the different religions4.
An important caveat concerning the research presented over the next pages is that our categories of levels of religious affiliation do not reflect religious intensity. This explains why this analysis is purely quantitative. Standard value surveys such as the European Values Study show strong variation among countries and religious groups that could for example explain other differentials associated with religion. However, these measures of religious intensity are difficult to integrate into this exercise where the main purpose is to project the future relative size of religions in Austria.
2 Data collection on religions and projections
Most datasets on religion are based on surveys, and very few contain detailed information for the whole population over time. Surveys can be biased as it may be difficult to get a representative sample of the population of a nation with respect to religious affiliation. The Austrian dataset used in this study may overcome problems associated with potentially biased surveys, as it is based on census information for the complete Austrian population, rather than just a small sample.
The definition of the degree of adherence to a religious group is difficult, as some individuals may be intensely religious, while others are only superficially religious. Hence our census data information (which does not include the degree of religiosity) may conceal differences in the degree of religious intensity between religious groups. Thus religious adherence could more frequently be a dominant identity trait in certain religious groups, while only a secondary identity characteristic in other religions.
A number of countries, such as India, Israel, Canada, Mexico and the United Kingdom, include religion in their censuses (Statistics Austria ISIS, Statistics Canada 2001, Statistics India 2001, Statistics Israel 2004, INEGI 2000, Statistics United Kingdom 2001). Among the countries that omit the question about religious affiliation in their censuses, some consider it a violation of personal
4 In Austria, secularisation of Protestants and Catholics represents the main conversion flows
between religions. Switching religion is otherwise quite seldom. In keeping with this, the Muslim authorities in Austria report zero members exiting out of the Islam religion.

Anne Goujon et al. 241
freedom.5 However, some nations that omit the question, including the United States, collect information on religion from surveys6.
Projections were also made in Switzerland in the framework of a larger study on religious groups’ demographic characteristics in Switzerland (Bovay and Broquet 2004; Haug and Wanner 2000). However, these projections only go up to 2020, too short a period to take into account the impact of fertility differentials. Similarly, Statistics Canada (2005) made projections for the religious composition in Canada until 2017, which includes fertility and mortality differentials, as well as transfer of religion from mother to child, though conversion between religions is not considered.
Fliegenschnee, Goujon and Lutz (2004) project the future size of the Protestant population in Austria. They foresee a substantial decrease, partly because of secularisation and partly because of the conversion of children of mixed couples (where one partner is non-Protestant). The analysis reveals substantial differences especially between the capital Vienna and other regions in the rate of secularisation, where secularisation trends in Vienna are much stronger.
Barrett, Kurian and Johnson (2001) give extrapolations for the size of religions in most countries of the world. Their work for the Austrian projection suggested that the share of Christians would continue to decline, perhaps falling as low as 75% by 2050. This finding clearly contrasts with our results, which may be due to the fact that they are based on the 1991 census, and that they use simpler projection techniques. Our projections indicate that the share of Christians decreases below 75% for all scenarios.
Detailed projections on the population by religion are rare, and to our knowledge, no earlier projection of religions based on a complete census takes into account both differential fertility, migration, conversion rates as well as the impact of mixed-religious marriages on the religion of children.
5 In the United States, the question on religion was collected from religious organisations in the
beginning of the 20th century, but, for privacy reasons, the law prohibits the United States Bureau of the Census from asking a question on religious affiliation on a mandatory basis. Other countries, such as Nigeria, omit the census question “since each religious and ethnic group would prefer numerical superiority over the other, it might be safer to ignore religion and ethnicity since there would be the temptation by each group to explore ways to have an edge over the other”, according to the head of the National Population Commission, Samaila Makama (United Nations Office for the Coordination of Humanitarian Affairs 2005).
In Austria, there is a question on religion in the census but the information is not available to church tax authorities. The Catholic and Protestant churches collect the taxes by themselves. Hence, there are always more Roman Catholics and Protestants in the census than in the churches’ statistics. The difference is minimal, however: e.g., 5.89 millions Roman Catholics were registered by the church in 2001 whereas the census counted 5.92 millions.
6 Survey data from the United States suggest that the proportion of Protestants in the United States fell for the first time fell below 50% in 2004 (Smith and Kim 2004).
Projecting the future size of religions in Austria 242
3 Religious determinants of demographic events
Regulating sexuality and fertility is central in the teachings of most major religions, and religious beliefs are powerful determinants of marriage, childbearing, divorce and other events related to family formation and dissolution. Examples of such rules are those regulating the minimum age at first sexual union, the number of wives or whether non-marital childbearing is prohibited. Such forces can influence the changing religious composition of a population over time, and could affect relative fertility rates, religion-specific net migration as well as the rate of conversion between religions and transmission of religious affiliation from parents to children.
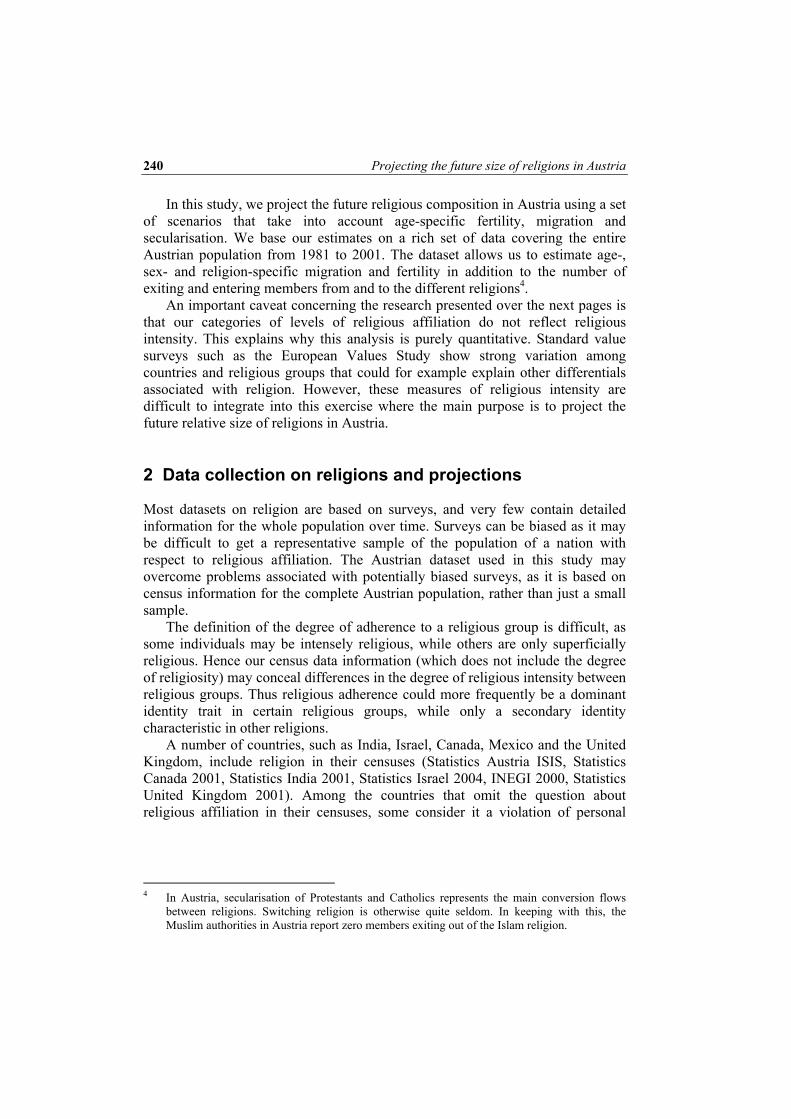
Religions differ in their emphasis on marital obligations, divorce rights, fertility demands and individual self-determination. As Figure 1 shows, religion could affect demographic patterns both due to directly expressed doctrines (e.g., that religious leaders forbid contraceptives) or indirect suggestions (e.g., promotion of early marriages which can lead to higher fertility). Moreover, beliefs expressed by religious leaders and religious texts make a difference only as long as the population is receptive and submissive to religious teachings (McQuillan 2004).
Figure 1: Influences of religion on demographic behaviour
Studies looking at the effects of religion are prone to be upward biased if
variables that are associated with, although not caused by, religious beliefs affect demographic behaviour (Sander 1992). Religious influence is contextual and is often mixed with politics and ideologies, to such an extent that the effects of religion can rarely be estimated without considering the social, geographic and economic circumstances of the given religious group. Poverty, low education levels, resource availability and political stability could cause demographic behaviour, and not necessarily only religion (Cohen 1996). Nevertheless, religion
Religious rules and traditions
Individuals’demographic behaviour
Effectiveness ofcommunication
Strength ofindividuals’ bond with religious community
Contextual andideologicalinterpretation
Social, political and economiccircumstances
Anne Goujon et al. 243
has been found to have an independent effect, net of any economic and social influences, on various demographic and economic outcomes (Borooah 2004; Driver 1963; Lehrer 2005; Morgan et al. 2002). Furthermore, religious beliefs are likely to influence educational attainment, income levels and political stability. Therefore, assuming exogeneity of such variables could lead to a downward bias in the estimated influence of religion.
Bivariate analyses suggest that there are differences in mortality rates between individuals adhering to different religions, but it is uncertain if this relation is causal. Moreover, whether various religious groups should live shorter or longer is uncertain. Individuals from several religious minorities in Austria are recent immigrants and the “healthy migrant argument” suggests that these migrants are positively selected and have a lower mortality than others coming from the same country. On the other hand, even positively selected migrants could have a shorter life expectancy than nationals of the new country due to large international differences in life expectancy which are attributable for example to exercise patterns or inherited diseases.
Studies that control for confounding factors find that differences in mortality by religion are insignificant or small (Hummer et al. 2004; Strawbridge et al. 2000). It is also highly uncertain if any such longevity differences will remain over time. We therefore assume equal life expectancy between members of different religions.
3.1 Fertility
We describe below the religious beliefs and practices in the order of the size of the denomination in the Austrian population according to the 2001 census. Hence, we describe the religious beliefs and practices first of the Roman Catholics, then of the Protestants and finally of the Muslims. Understanding differences in fertility patterns between religious groups is important as they have a reinforcing effect over time on the size of the different religions (lower/higher fertility leads to smaller/larger groups which in turn have fewer/more children).
The Bible encourages high fertility. It states (Bible, Gen 1:28), “And God blessed them, and God said unto them, Be fruitful, and multiply, and replenish the earth”. The only permitted form of contraception in the Catholic church is the “calendar method” where one does not have sexual intercourse on the days of the month with the highest conception risk. However, although pronatalist measures may have had a historic impact among Austrian Christians, current church attendance is low and decreasing, and religious influences are becoming weaker (Berghammer 2003).
Sander (1992) analyses American Roman Catholics born during the twentieth century and finds that from 1920 onwards, they no longer had higher fertility than the Protestant majority, but had adopted the same fertility patterns. This may be caused by the fact that despite the clear opposition to contraception and abortion
Projecting the future size of religions in Austria 244
by the Roman Catholic church, as many as 87% of American Catholics believe that individual choice should prevail in family formation choices (Noonan 1986). Also, Roman Catholic European countries are currently well represented among those with “lowest-low fertility” (total fertility rate below 1.3), including Spain and Italy (United Nations 2004).
The Protestant church does not have the same hierarchical structure as Catholicism7. As the influence of the church and religious leaders is generally weaker among Protestants (partly because of the emphasis on a direct relation to God), independent interpretation of the Bible and self-determination of faith has become central for this group. Protestants disfavour contraception and condom use to a much lower extent than other major religious groups. In contrast to the Catholic church (which is based on Bible and tradition), a Protestant turns to the Bible for answers to religious questions. As a consequence there are no universal binding clerical teachings on topics such as contraception, cohabitation or abortion, all of which are seen as private decisions. Acceptance of divorce and out-of-wedlock fertility as well as female heads of church are commonly accepted—and indeed have been for a longer time than in most major religions.
Islam is supportive of family formation, where marriage and childbearing represent central elements in the religion. Muhammad strongly supported marriage, remarriage and fertility. He endorsed polygyny as a way of allowing widowed fecund women the opportunity to have children, which would increase the number of his followers and strengthen the religion: “Marry women who are loving and very prolific for I shall outnumber the peoples by you” (Al-Masabih 1963). Additionally, a hadith states, that on the day of resurrection, the Prophet would be proud of the number of his community compared with other communities and that he admonishes his followers to reproduce and increase in number (Bakar 1995). Implications of Islam for fertility patterns may be stronger than for Christians in Austria as religiosity may be more intense (regular mosque attendance, stronger bond between the individual and the religious community, which often also share language and culture). Muslims’ distinct fertility patterns are evident in a number of different societies and many Muslims attribute their high fertility to their religion (Bovay and Broquet 2004; Borooah 2004; McQuillan 2004; Reynolds and Tanner 1995).
Most Muslims in Austria are first or second-generation immigrants. Although fertility levels of immigrants tend to be related to their country of origin (Abbasi-Shavazi 1998), the fertility rates of most immigrant groups tend to approach, if not converge to, the host country fertility patterns, which could decrease Muslim fertility in the coming decades (Nahmias 2004; Ram and George 1990).
7 The Protestant church does not have a central authority and there is a large degree of autonomy
even at lower levels in the church hierarchy. The Protestant church relies mainly on the principles of Luther of “Sola Fide, Solus Christus, Sola Gratia and Sola Scriptura” (Only Faith, Only Christ, Only Grace and Only the Scripture), and takes the Bible as its source in religious questions (Miklas 2005).
Anne Goujon et al. 245
There do not seem to exist any specific doctrinal prohibitions of contraception in Islam, which is supported by surveys of religious leaders and religious writings for example in Jordan (Underwood 2000). It is difficult to identify the official view due to the lack of a universal religious hierarchy. There is considerable support among many religious leaders for certain family planning practices, such as coitus interruptus or contraceptive pills, while substantial opposition exists against abortion and sterilisation (Chamie 1981; Simmons 2003). However, the Qur’an also includes advice that could lead to fertility depressing behaviour, including long nursing periods. Children should, according to the Qur’an, be nursed for two full years (Qur’an, Sura 2:233). 3.2 Marriage
Marriage is the only permitted form of living together and sexual union for Catholics. The Roman Catholic church describes marriage as a sacrament between man and woman originally founded by God (Catechism of the Catholic church 2005: 1603). The marriage consists of “conjugal fidelity, offspring, and the unbreakable union between the spouses.” (Martos 1997)
The Bible, influencing the views of both Catholics and Protestants, emphasises the link between leaving the parental home and forming a marriage; “That is why a man leaves his father and mother and unites with his wife, and they become a new family.” (Bible, Gen 2:24) Hence, the church encourages leaving home, marrying and founding a new family.
In Islam, marriage has a very high significance. Fitzgerald, Khoury and Wanzura (1976) argue that “[t]he Qur’an demands that every healthy believer has to marry.” Muhammad says in the traditions (Al-Massabih 1963), “Those of you who can support a wife should marry, for it keeps you from looking at strange women and preserves you from immorality”. Polygamy is often mentioned in the Qur’an (e.g., Qur’an, Sura 4:3), where a man is allowed to marry up to four wives if he can do justice between them all. However, when there is a difference between Islamic and public law, Western Muslim organisations such as the “Zentralrat der Muslime in Deutschland” argue that one should follow the laws of the country of residence as long as they do not contradict Islamic law. 3.3 Divorce
In the Catholic church, there is no divorce, only nullification of marriage. “[T]he Church maintains that a new union cannot be recognised as valid, if the first marriage was. If the divorced are remarried civilly, they find themselves in a situation that objectively contravenes God’s law.”(Catechism of the Catholic church 2005: 1650) People can have their marriage nullified, for example if the vow of fidelity was broken or if they can show that one partner was not willing to get children (Veitschegger 2004).

Projecting the future size of religions in Austria 246
Unlike the Catholic church, marriage is not a sacrament for Protestants, so it is possible to divorce and remarry. Of course family and marriage are part of the Protestant faith. However, central in Protestant teachings is a merciful God who will forgive mistakes (Miklas 2005), which implies that divorces are a possibility.
The Qur’an describes rules for divorce, and Mohammed characterised divorce as “the thing most hated by God”. It may be particularly difficult for women to cancel marriages, which may partly explain Muslims’ lower divorce rates (Fitzgerald, Khoury and Wanzura 1976). 3.4 Interreligious marriage and transmission of religion to children
Whether intra-religious marriages are accepted, and to what extent religion is transmitted from parents to children, is important in affecting the number of adherents in the longer term. Some religions encourage strict upbringing of children and leave little opportunity for opting out. Others are more tolerant and allow people to exit the religious community without facing any sanctions. For Britain, Voas and Crockett (2005) find that if both parents are affiliated the probability of passing the religion on to the child is about 50%, while absence of religion is almost always passed on.
For members of the Roman Catholic church in Austria, the impact of mixed marriages is not that important as 76% of Roman Catholic women who marry have a husband of the same faith (as shown in Table 3). The picture is however very different for the Protestant population where 84% of Austrian Protestants marry non-Protestant partners, mostly Roman Catholics (56%) or persons without religion (23%). Lutz and Uljas-Lutz (1998) estimated that only half of the children of these couples become Protestant. Lutz (1985) shows that the religion of the mother is more important than the religion of the father for the transmission of religion from parents to children.
Table 3: Religious adherence of grooms and brides, in 2004 (in per cent)
The bride Religious denomination of: Roman
Catholic Protestant Muslim Other religion
Without religion
Roman Catholic 76.2 56.4 7.9 33.6 29.5 Protestant 3.8 15.8 0.8 2.7 3.8 Muslim 4.1 3.5 84.8 5.9 5.4 Other religion 2.0 1.6 1.8 41.2 2.8 Without religion 13.9 22.7 4.7 16.6 58.5 Th
e gr
oom
Total 100% 100% 100% 100% 100% Source: Statistics Austria (2006).
Anne Goujon et al. 247
Table 3 reveals that for the smaller religious groups, there are generally fewer who marry within the same religion. Muslim women constitute an exception , where 85% of them have a Muslim husband, which could be because inter-religious marriages are strongly discouraged in Islam (Fitzgerald, Khoury and Wanzura 1976).
3.5 Acceptance of conversion to other religions and secularisation
Today the freedom of religious choice is greater than in the past when most people did not have a choice in deciding on their religion (Berger 1990). Catholics and Protestants have lost some members to smaller religious groups in Austria, while most who have left became secular. Crockett and Voas (2006) find that secularisation, at least in Britain, is characterised by each generation being less religious than the previous one. In sociology the meaning of secularisation and how religion (belief, practice, membership, etc.) has evolved during the last decades is much discussed (e.g., Knoblauch 1999). Berger (1988, 1990) argues that adherence to the main churches is declining and that people are searching for alternative religions. Luckmann (1991) on the other hand assumes that religion does not lose ground but only changes its form. However, analyses by Voas and Crockett (2005) suggest that the level and trends in religious belonging is strongly related to religious belief and attendance, based on evidence from British data. Our study does not address the theme of religiosity, but understands secularisation and religious belonging only as the self-reported religious affiliation and not as a measurement of religious beliefs.
Most religions have a negative outlook on those who leave their faith. The largest group of church leavers are those who leave all religious beliefs and substitute them with secular views (Schluchter 1991)8. Some individuals re-enter the church at a later age, but most of those who exit remain secular throughout their lives.
Active participation in the churches is likely to have decreased as secularisation became a mass movement in the late 1960s. The decline of the
8 Secularisation has been part of Austrian philosophy since the age of enlightenment (Schluchter
1991). The church is losing its exclusive right to settle the norms, because there are other value systems which can guide one’s beliefs and lifestyle. “The result of the secularisation is that faith is getting more and more subjective as a consequence of alternative lifestyles.” (Schluchter 1991) Many spheres such as economy, policy, and science are not under the control of the church any more (Schluchter 1991; Zulehner 1993). More and more people are leaving the church because they find their moral concepts somewhere else and individuals are largely free to choose which view fits best for them (Schluchter 1991). Today we can say we have two tendencies, „the religion’s view of the world views only part of the world, and faith is subjective.” (Schluchter 1991) But also the possible religious views have become more multifarious. People have access to different religions, even within the Christian church or the Islamic world (Schloz et al. 2003).
Projecting the future size of religions in Austria 248
number of Roman Catholics is a typical European phenomenon. In Latin America and Africa, the number of members of Christian churches is expected to increase because of demographic factors, i.e., high fertility. However, Latin America experiences a substantial amount of conversions from Catholicism to Protestantism (Saenz 2005).
Religious teachings can affect the transmission of religion from parents to children and the degree of secularisation. For example the Christian attitude concerning children is deduced from the Bible, especially from Jesus’ behaviour and teaching towards children: “Let the little children come to me and do not try to stop them, for the kingdom of God belongs to such as these” (Bible, Mark 10: 14).
In Islam, leaving one’s religion (apostasy) is strongly opposed, and can be sanctioned, even by death9. Several Muslim organisations promote a more tolerant view, where also the right to convert should be allowed without penalties (Ahmad Faiz bin Abdul Rahman 1998; Rahman 1986).
4 Projections
The projections of the population by religion status from 2001 to 2051 were created using the PDE Population Software10, a simplified multi-state population projection program for states interacting with one another. States are defined by the user and can be regions, educational categories, ethnic or language groups, or other user-defined dimensions. The software requires data on fertility, mortality, migration and transition probabilities between states, by age and sex. This software has been utilised in recent years in many settings (for a recent listing see Lutz et al. 2007).
The inputs required for the projections are the following: - Base year parameters: population by age, sex and religion status, age- and
religion-specific fertility rates, age-, sex- and religion-specific mortality rates, age-, sex- and religion-specific net migration numbers, and transition rates between religion groups.
- Scenario assumptions as to the future of the parameters listed above. The base-year population was taken from the 2001 census11. As mentioned
above, we aggregated the population into five main religious categories: Roman 9 31% of British Muslims agree to the statement “Muslim conversion is forbidden and punishable
by death” (Mirza et al. 2007). 10 The PDE Population Projection software has been developed by the World Population Project
at IIASA and is available at http://www.iiasa.ac.at/Research/POP/pub/software.html 11 The question about religious affiliation has been asked in the census at least since 1971. People
can choose between Roman Catholic, Protestant (Lutheran or Calvinist), Old Catholic, Muslim, Jewish or without religion. A blank space is provided to detail if they belong to another religion. The 2001 census tabulations are arranged in 35 religious categories in its most detailed version, aggregated to 11 categories as shown in table 4.
Anne Goujon et al. 249
Catholics, Protestants, Muslims, other religions and without religion. A definition of the categories is given in Table 4.
Table 4: Definition of the religious categories used in the projections
Categories Census categories Roman Catholic Roman Catholic church Protestant Protestant church Muslim Islamic religious community Other religion Other Catholic (united) churches
Orthodox churches Other Christian communities Jewish religious community Other non-Christian communities Not indicated Others (before 2001)
Without religion Individuals who declare no religious affiliation Source: Census 2001. 4.1 Base-year fertility
The base-year fertility is estimated from the census data on children ever born to women residing in Austria in 1981, 1991 and 2001. We do not have recent information on the intergenerational transmission of religion. Lutz (1985) showed that in the early 1980s in Austria, mothers were predominantly responsible for passing on their religious beliefs to their children in mixed couples with Roman Catholic and Protestant members. Therefore, we assume that children have the same religion as their mothers, regardless of the type of union, mono-religious or mixed.
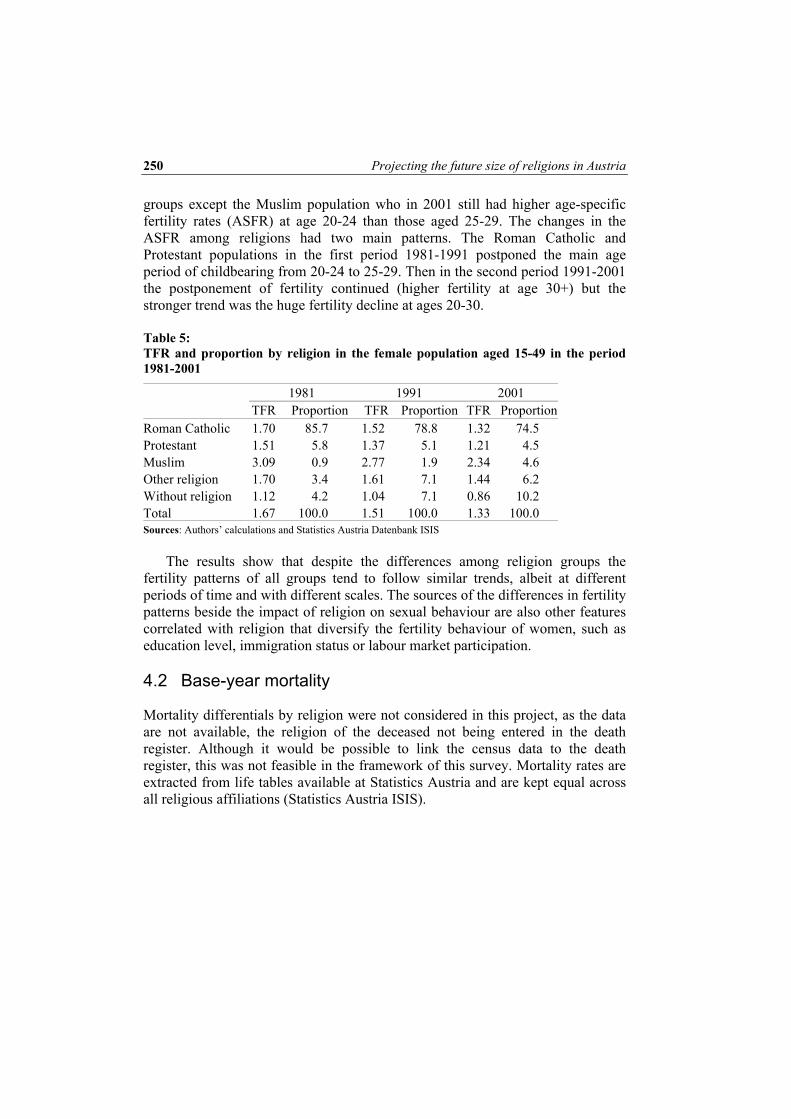
The methodology for calculating age-specific fertility differentials by religion is detailed in Appendix 1. Table 5 as well as Figures 2a-2f present the main results. In the period 1981-2001, the TFR in Austria declined from 1.7 to 1.3. Fertility declined for all religious affiliations. In absolute terms, the largest decrease of the TFR was observed among Muslims (by about 0.8), and the lowest among “other religions” (by about 0.3). The total number of children born in Austria was most strongly influenced by the declining fertility among Roman Catholics who constitute the major part of the Austrian population. The increasing number of persons without religious affiliation who have a significantly lower fertility than other groups also influenced the total decrease. The analysis also reveals that the population without religion had a very low fertility throughout the period observed, with a TFR of 1.1 children in 1981 and 0.9 in 2001.
Detailed analysis by age (see Figures 2a-2f) shows two main tendencies in all religion groups: postponement of the age of having children and the decline in total fertility rates. The postponement of having children was common to all
Projecting the future size of religions in Austria 250
groups except the Muslim population who in 2001 still had higher age-specific fertility rates (ASFR) at age 20-24 than those aged 25-29. The changes in the ASFR among religions had two main patterns. The Roman Catholic and Protestant populations in the first period 1981-1991 postponed the main age period of childbearing from 20-24 to 25-29. Then in the second period 1991-2001 the postponement of fertility continued (higher fertility at age 30+) but the stronger trend was the huge fertility decline at ages 20-30. Table 5: TFR and proportion by religion in the female population aged 15-49 in the period 1981-2001
1981 1991 2001 TFR Proportion TFR Proportion TFR Proportion
Roman Catholic 1.70 85.7 1.52 78.8 1.32 74.5 Protestant 1.51 5.8 1.37 5.1 1.21 4.5 Muslim 3.09 0.9 2.77 1.9 2.34 4.6 Other religion 1.70 3.4 1.61 7.1 1.44 6.2 Without religion 1.12 4.2 1.04 7.1 0.86 10.2 Total 1.67 100.0 1.51 100.0 1.33 100.0 Sources: Authors’ calculations and Statistics Austria Datenbank ISIS
The results show that despite the differences among religion groups the
fertility patterns of all groups tend to follow similar trends, albeit at different periods of time and with different scales. The sources of the differences in fertility patterns beside the impact of religion on sexual behaviour are also other features correlated with religion that diversify the fertility behaviour of women, such as education level, immigration status or labour market participation. 4.2 Base-year mortality
Mortality differentials by religion were not considered in this project, as the data are not available, the religion of the deceased not being entered in the death register. Although it would be possible to link the census data to the death register, this was not feasible in the framework of this survey. Mortality rates are extracted from life tables available at Statistics Austria and are kept equal across all religious affiliations (Statistics Austria ISIS).
Anne Goujon et al. 251
Figures 2a-2f: Age-specific fertility rates of the total population and of different religion groups in Austria in the period 1981-2001
Figure 2a: Total population Figure 2b: Roman Catholic
0.0
0.2
0.4
0.6
0.8
1.0
1.2
1.4
15-19 20-24 25-29 30-34 35-39 40-44 45-49
1981 1991 2001
0.0
0.2
0.4
0.6
0.8
1.0
1.2
1.4
15-19 20-24 25-29 30-34 35-39 40-44 45-49
1981 1991 2001
Figure 2c: Protestant Figure 2d: Muslim
0.0
0.2
0.4
0.6
0.8
1.0
1.2
1.4
15-19 20-24 25-29 30-34 35-39 40-44 45-49
1981 1991 2001
0.0
0.2
0.4
0.6
0.8
1.0
1.2
1.4
15-19 20-24 25-29 30-34 35-39 40-44 45-49
1981
1991
2001
Figure 2e: Other religion
Figure 2f: Without religion
0.0
0.2
0.4
0.6
0.8
1.0
1.2
1.4
15-19 20-24 25-29 30-34 35-39 40-44 45-49
1981 1991 2001
0.0
0.2
0.4
0.6
0.8
1.0
1.2
1.4
15-19 20-24 25-29 30-34 35-39 40-44 45-49
1981 1991 2001
Sources: Authors’ calculations and Statistics Austria Datenbank ISIS

Projecting the future size of religions in Austria 252
4.3 Base-year migration
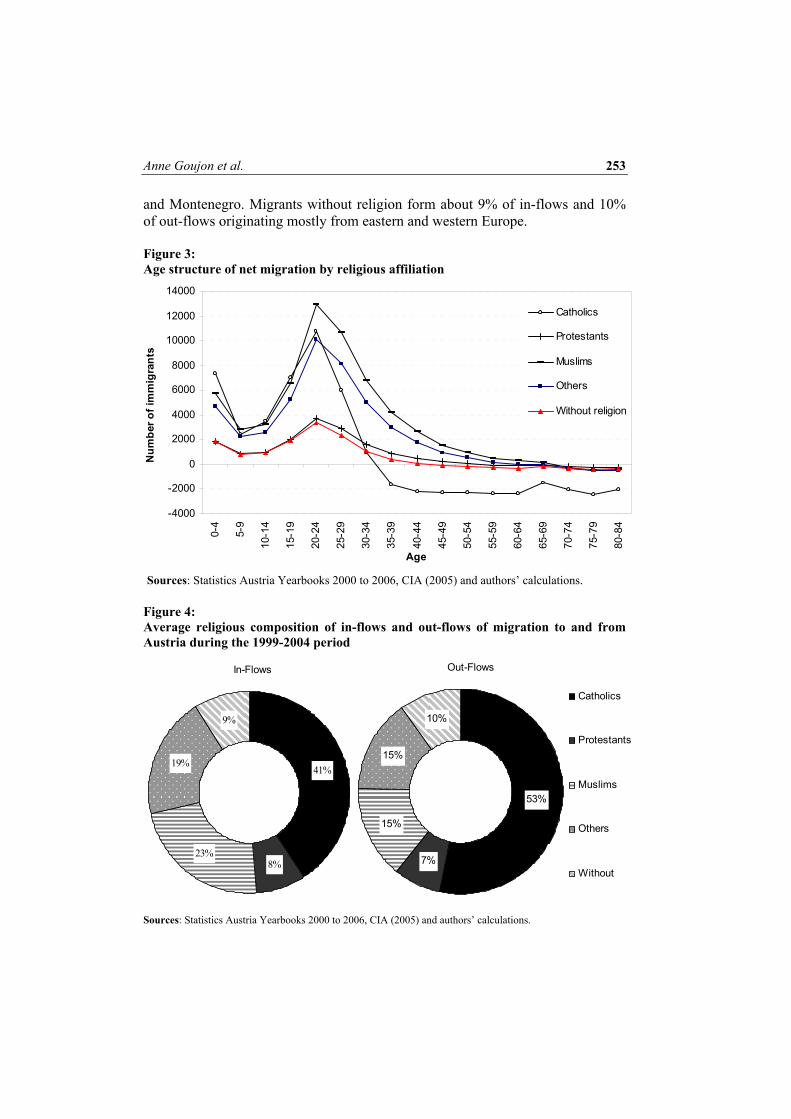
Migration is a key factor in the changing religious landscape of Austria. The number of migrants has been increasing importantly in the last years, and especially since 2002. The net number of migrants has more than doubled between 1999 and 2004 due to an important increase of migrants coming mostly from former Yugoslavia (Bosnia-Herzegovina, Croatia, and Serbia and Montenegro,), eastern Europe (Hungary, Poland, Romania, Russia and Slovakia), Germany and Turkey. Unfortunately we lack data on the faith of immigrants and/or emigrants in Austria. Religious affiliation was inferred from the country of origin. In a first step, we retrieved the number of in-migrants and out-migrants for the 40 countries with the highest absolute net-migration for the period 1999-2004, for which data is available. In a second step, we used the Central Intelligence Agency (CIA)-World Factbook (2005) that gives statistics on all the countries in the world to retrieve the shares of the population by religious affiliations. These shares were then applied to the flows for the period 1999-2004 to distribute the emigrants and immigrants according to the religious beliefs of their country of origin (see Figures 4 and 5). The assumption that migrants have the same distribution as the rest of the population in their country of origin is, of course, quite daring. In certain cases, ethnic or religious conflicts could affect outbound migration of specifically persecuted groups. However, in the absence of better information, this was felt to be the best approximation method. The stocks of migrants obtained for the two flows were then disaggregated by age and sex according to the overall share by age and sex of inflows and outflows. The resulting age structure of the net migration by religion is shown in Figure 3.
While the net-number of migrants has considerably increased in the last five years, the composition of migrants by religious categories is rather stable across those last six years. Catholics are principally out-migrants originating for a large extent from Austria. They represented 38 to 44% of the in-migration and about 48-54% of the out-migration during the 1999-2004 period. The share of the Protestant population is very stable in both stocks of immigrants and emigrants across the last six years, respectively around 8% and 7%, which makes migration an important source of new members for the Protestant church. Protestants mostly originate from Germany, and also from Slovakia and Romania. The proportion of Muslims moving into the country is fluctuating between 18 and 23% of all migrants, mostly originating from Iran, Nigeria, Bosnia-Herzegovina and Turkey. The proportion of those leaving Austria who are Muslim is around 15 %. Members of other religions are entering Austria increasingly—in fact this is the fastest growing religious group—and made up 16-26% of the total flow of immigrants during the 1999-2004 period. The in-flows of the category Other religions are mostly composed of Orthodox Christians from eastern Europe and former Yugoslavia, i.e., Bosnia-Herzegovina, Macedonia, Romania, and Serbia
Anne Goujon et al. 253
and Montenegro. Migrants without religion form about 9% of in-flows and 10% of out-flows originating mostly from eastern and western Europe.
Figure 3: Age structure of net migration by religious affiliation
-4000
-2000
0
2000
4000
6000
8000
10000
12000
14000
0-4
5-9
10-1
4
15-1
9
20-2
4
25-2
9
30-3
4
35-3
9
40-4
4
45-4
9
50-5
4
55-5
9
60-6
4
65-6
9
70-7
4
75-7
9
80-8
4
Age
Num
ber o
f im
mig
rant
s
Catholics
Protestants
Muslims
Others
Without religion
Sources: Statistics Austria Yearbooks 2000 to 2006, CIA (2005) and authors’ calculations.
Figure 4: Average religious composition of in-flows and out-flows of migration to and from Austria during the 1999-2004 period
Sources: Statistics Austria Yearbooks 2000 to 2006, CIA (2005) and authors’ calculations.
In-Flows
8%23%
19%
9%
41%
Out-Flows
53%
7%
15%
15%
10%
Catholics
Protestants
Muslims
Others
Without
Projecting the future size of religions in Austria 254
0
20
40
60
80
100
120
1999 2000 2001 2002 2003 2004
Inflows
0
20
40
60
80
100
120
1999 2000 2001 2002 2003 2004
Catholics ProtestantsMuslims OthersWithout
Outflows
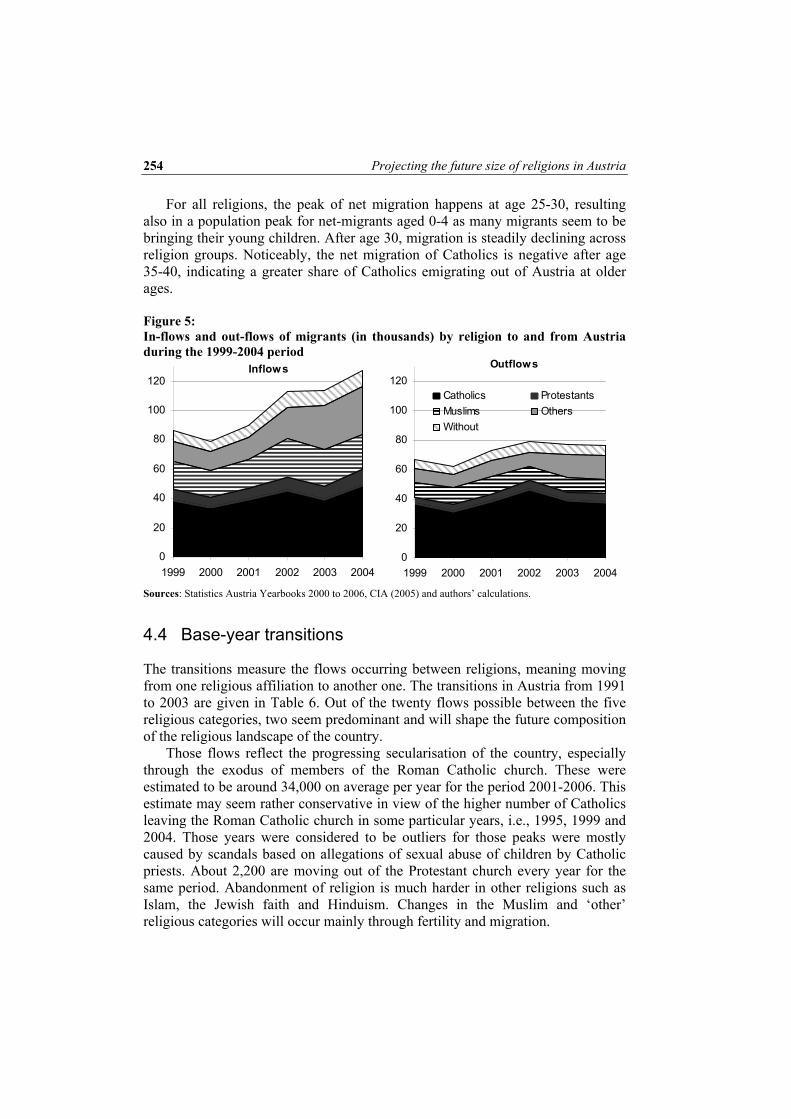
For all religions, the peak of net migration happens at age 25-30, resulting also in a population peak for net-migrants aged 0-4 as many migrants seem to be bringing their young children. After age 30, migration is steadily declining across religion groups. Noticeably, the net migration of Catholics is negative after age 35-40, indicating a greater share of Catholics emigrating out of Austria at older ages.
Figure 5: In-flows and out-flows of migrants (in thousands) by religion to and from Austria during the 1999-2004 period
Sources: Statistics Austria Yearbooks 2000 to 2006, CIA (2005) and authors’ calculations.
4.4 Base-year transitions
The transitions measure the flows occurring between religions, meaning moving from one religious affiliation to another one. The transitions in Austria from 1991 to 2003 are given in Table 6. Out of the twenty flows possible between the five religious categories, two seem predominant and will shape the future composition of the religious landscape of the country.
Those flows reflect the progressing secularisation of the country, especially through the exodus of members of the Roman Catholic church. These were estimated to be around 34,000 on average per year for the period 2001-2006. This estimate may seem rather conservative in view of the higher number of Catholics leaving the Roman Catholic church in some particular years, i.e., 1995, 1999 and 2004. Those years were considered to be outliers for those peaks were mostly caused by scandals based on allegations of sexual abuse of children by Catholic priests. About 2,200 are moving out of the Protestant church every year for the same period. Abandonment of religion is much harder in other religions such as Islam, the Jewish faith and Hinduism. Changes in the Muslim and ‘other’ religious categories will occur mainly through fertility and migration.
Anne Goujon et al. 255
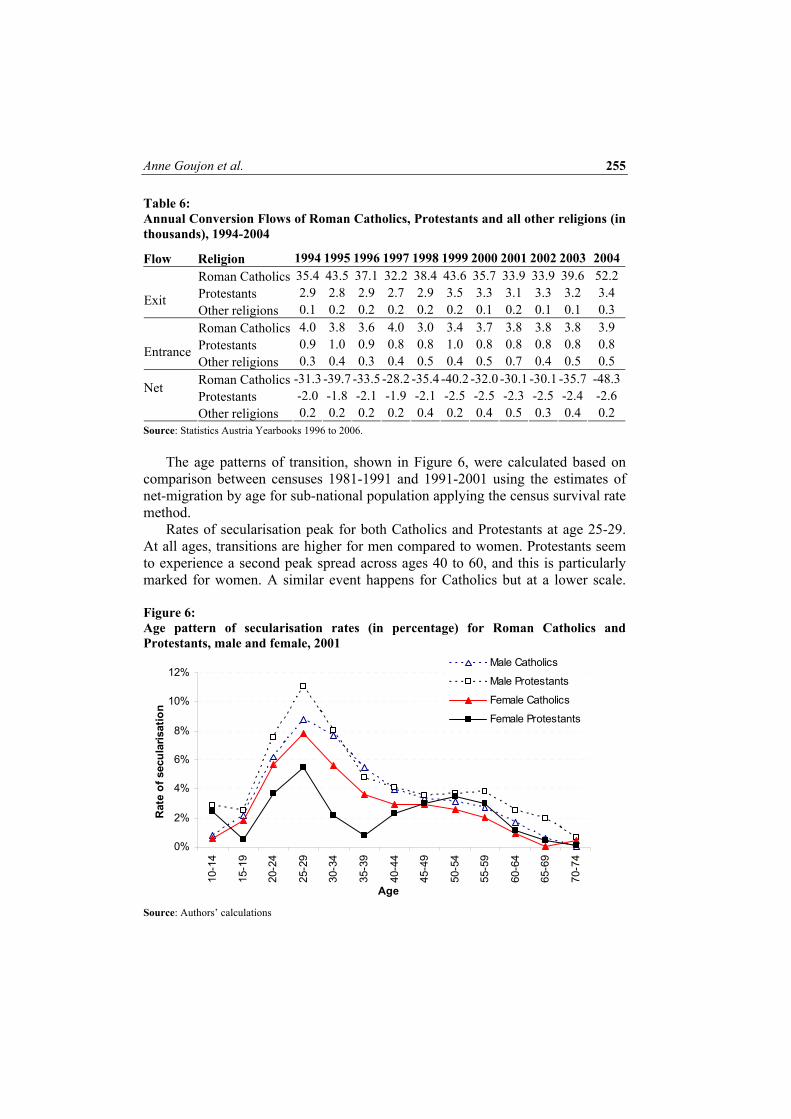
Table 6: Annual Conversion Flows of Roman Catholics, Protestants and all other religions (in thousands), 1994-2004
Flow Religion 1994 1995 1996 1997 1998 1999 2000 2001 2002 2003 2004 Roman Catholics 35.4 43.5 37.1 32.2 38.4 43.6 35.7 33.9 33.9 39.6 52.2 Protestants 2.9 2.8 2.9 2.7 2.9 3.5 3.3 3.1 3.3 3.2 3.4 Exit Other religions 0.1 0.2 0.2 0.2 0.2 0.2 0.1 0.2 0.1 0.1 0.3 Roman Catholics 4.0 3.8 3.6 4.0 3.0 3.4 3.7 3.8 3.8 3.8 3.9 Protestants 0.9 1.0 0.9 0.8 0.8 1.0 0.8 0.8 0.8 0.8 0.8 Entrance Other religions 0.3 0.4 0.3 0.4 0.5 0.4 0.5 0.7 0.4 0.5 0.5 Roman Catholics -31.3 -39.7 -33.5 -28.2 -35.4 -40.2 -32.0 -30.1 -30.1 -35.7 -48.3 Protestants -2.0 -1.8 -2.1 -1.9 -2.1 -2.5 -2.5 -2.3 -2.5 -2.4 -2.6 Net
Other religions 0.2 0.2 0.2 0.2 0.4 0.2 0.4 0.5 0.3 0.4 0.2
Source: Statistics Austria Yearbooks 1996 to 2006. The age patterns of transition, shown in Figure 6, were calculated based on
comparison between censuses 1981-1991 and 1991-2001 using the estimates of net-migration by age for sub-national population applying the census survival rate method.
Rates of secularisation peak for both Catholics and Protestants at age 25-29. At all ages, transitions are higher for men compared to women. Protestants seem to experience a second peak spread across ages 40 to 60, and this is particularly marked for women. A similar event happens for Catholics but at a lower scale. Figure 6: Age pattern of secularisation rates (in percentage) for Roman Catholics and Protestants, male and female, 2001
0%
2%
4%
6%
8%
10%
12%
10-1
4
15-1
9
20-2
4
25-2
9
30-3
4
35-3
9
40-4
4
45-4
9
50-5
4
55-5
9
60-6
4
65-6
9
70-7
4
Age
Rat
e of
sec
ular
isat
ion
Male Catholics
Male Protestants
Female Catholics
Female Protestants
Source: Authors’ calculations

Projecting the future size of religions in Austria 256
This phenomenon might be related to the higher incomes perceived by people in these age groups, pointing them to escape the church tax which is based on income. The age-specific secularisation rates were scaled up and down to reproduce the flows observed around the base-year.
4.5 Scenarios
The scenarios should help in answering the main questions we have about the future of religions in Austria:
Question 1: If secularisation and the increase of other religions in the population continue, when will Roman Catholics make up less than 50% of the total population?
Question 2: Will the Muslims or those without religion become the dominant group in Austria?
Question 3: What is the influence of migration on the religious structure of the country?
Question 4: Could a change in the religious composition lead to increased fertility in Austria?
We developed a matrix of twelve12 scenarios emerging from the combination
of several hypotheses on the different demographic determinants and the determinants of religious compositional change that is fertility, migration and transition/secularisation.
Fertility13: “Stable fertility” scenario (Fs): Fertility by religion remains constant at the levels observed in 2001. Hence, the Muslim population keeps at a higher fertility level than the rest of the population with a TFR of 2.34 children per woman.14 This scenario also implies that the secularised population maintains its
12 We have in fact looked at many other scenarios, particularly regarding the influence of a higher
share of Muslims migrating to Austria in the future. We have also considered an intermediate fertility path where the fertility of all religious groups would be not completely converging to the same level. Another set of scenarios looked at the possibility of Muslim secularisation. Results of those scenarios are not presented here in order to shorten the number of scenarios and to stick to actually visible trends. Details on other results are available from the authors upon request.
13 Children are born in the same category as their mother. This is consistent with several studies that show the mother is more influential in the choice of the religion of children, especially in the case of mixed marriages (Lutz 1985). However, we do not consider what could happen within a more balanced religious composition of the country where the rate of mixed marriages may increase and affect the choice of one or no religion for the children.
14 This scenario does not take into account tempo-effects, where postponement leads to a temporary increase in period fertility at later stages (see e.g., Sobotka 2004). The stable relatively high fertility among Muslims can be partly explained by the fact that parental leave in
Anne Goujon et al. 257
very low fertility, which may be unlikely in a situation of diffusion where more and more people move to this group, coming from different fertility backgrounds.
“Converging fertility” scenario (Fc): Fertility by religion converges to a TFR of 1.4 children by 2026-2031, and remains constant afterwards. This TFR is in accordance with the medium variant of the Austrian population projection. The convergence scenario implies three main assumptions. First, fertility in Austria will stay at very low levels at least until the middle of the century. Second, the different generations of migrants will rapidly adopt the low fertility pattern existing in Austria. And third, the population without any religion will increase its fertility.
Mortality: One single trend, following the medium variant of population projections for mortality of the Austrian Statistical Office (Statistics Austria 2003). All religions follow the same mortality pattern with an increase in life expectancy between 2001-2006 and 2046-2051 from 76 to 83 years for males and from 82 to 88 for females.
Migration: “Medium migration” scenario (Mm): The net number of migrants follows the medium variant for population projections of the Austrian Statistical Office. Under this scenario, net migration will increase strongly until 2011 when it will peak at 28,000 migrants each year, declining slowly thereafter until it reaches its lowest level in 2026 with 19,000 net migrants per year. A mild increase is envisaged for the second half of the projection period up to 22,000 by 2051. The age and sex patterns of migrants follow those observed in 2001. The religious affiliation of migrants is kept at levels similar to those observed in 2001: 18% are Catholics, 8% are Protestants, 38% are Muslims, 28% have another religion and 9% are without religion.
“High migration” scenario (Mh): Same as in Mm, except that the net number of migrants follows the high variant for migration stated in the population projections of the Austrian Statistical Office. The net number of migrants per year fluctuates between 27,000 and 38,000 during the 2001-2051 period in a sequence similar to that observed for the medium migration scenario.
Transition/Secularisation: “Constant secularisation” scenario (Tc): This scenario implies constant transition rates at the levels observed in 2001 for transitions of Catholics and Protestants to ‘without religion’ (as shown in Figure 6). In the 2001-2006 period, this means 34,000 leaving the Roman Catholic church and about 2,200 the Protestant church every year. This scenario mainly shows the depletion of the Roman Catholic and Protestant churches due to present trends in secularisation. This “business as usual” scenario allows us to observe the effect of present depletion on the future religious composition.
Austria since 2002 has been made available for all women, regardless of whether they had an employment contract before they get a child (Bundesministerium für soziale Sicherheit 2005).
Projecting the future size of religions in Austria 258
“High secularisation” scenario (Th): The transition rates double between 2001-2006 and 2026-2031 and remain constant afterwards. As in scenario Tc, the overall age pattern is kept constant. This shows a strengthening of the current trend where people are increasingly leaving the Protestant and Roman Catholic churches (see Table 6).
Scenario “Low secularisation” (Tl): The transition rates converge to zero by 2026-2031 so that by 2031, everybody stays in the religious groups he/she was born into. This scenario describes a reversal of the present trend over a rather long period of 25 years, for secularisation might just be a temporary phenomenon as argued for instance by Kaufmann (2006).
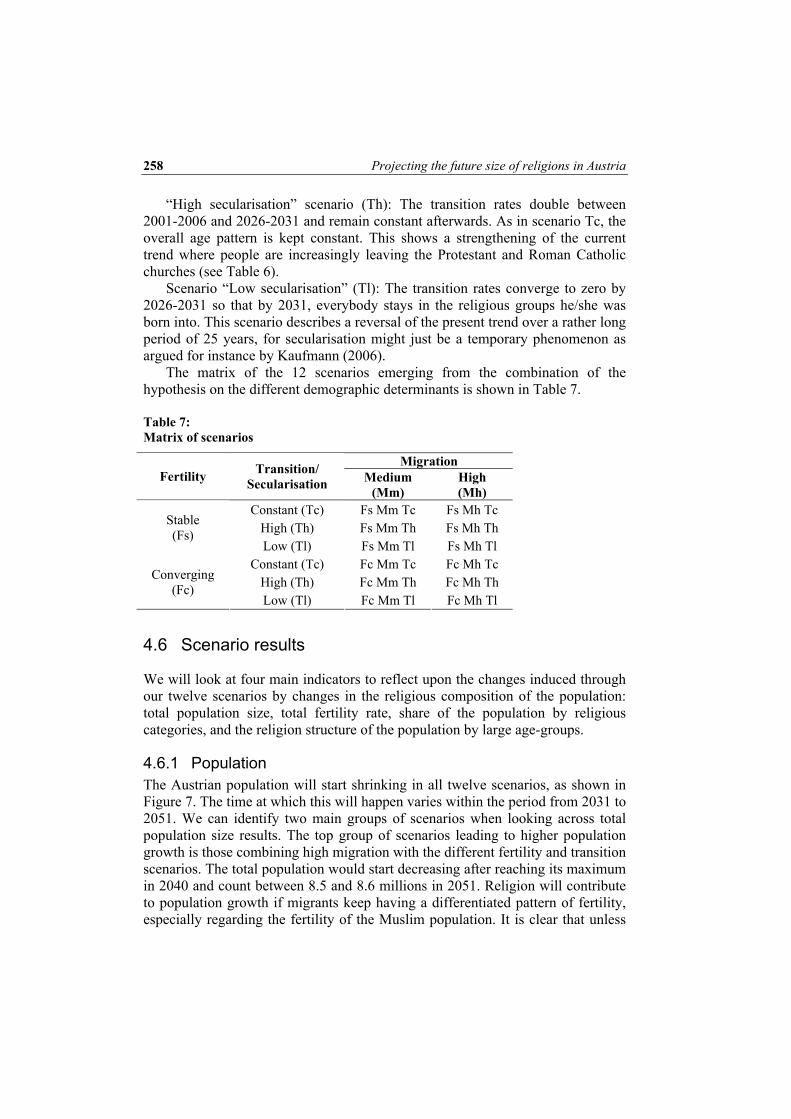
The matrix of the 12 scenarios emerging from the combination of the hypothesis on the different demographic determinants is shown in Table 7.
Table 7: Matrix of scenarios
Migration Fertility Transition/
Secularisation Medium (Mm)
High (Mh)
Constant (Tc) Fs Mm Tc Fs Mh Tc High (Th) Fs Mm Th Fs Mh Th Stable
(Fs) Low (Tl) Fs Mm Tl Fs Mh Tl
Constant (Tc) Fc Mm Tc Fc Mh Tc High (Th) Fc Mm Th Fc Mh Th Converging
(Fc) Low (Tl) Fc Mm Tl Fc Mh Tl
4.6 Scenario results
We will look at four main indicators to reflect upon the changes induced through our twelve scenarios by changes in the religious composition of the population: total population size, total fertility rate, share of the population by religious categories, and the religion structure of the population by large age-groups.
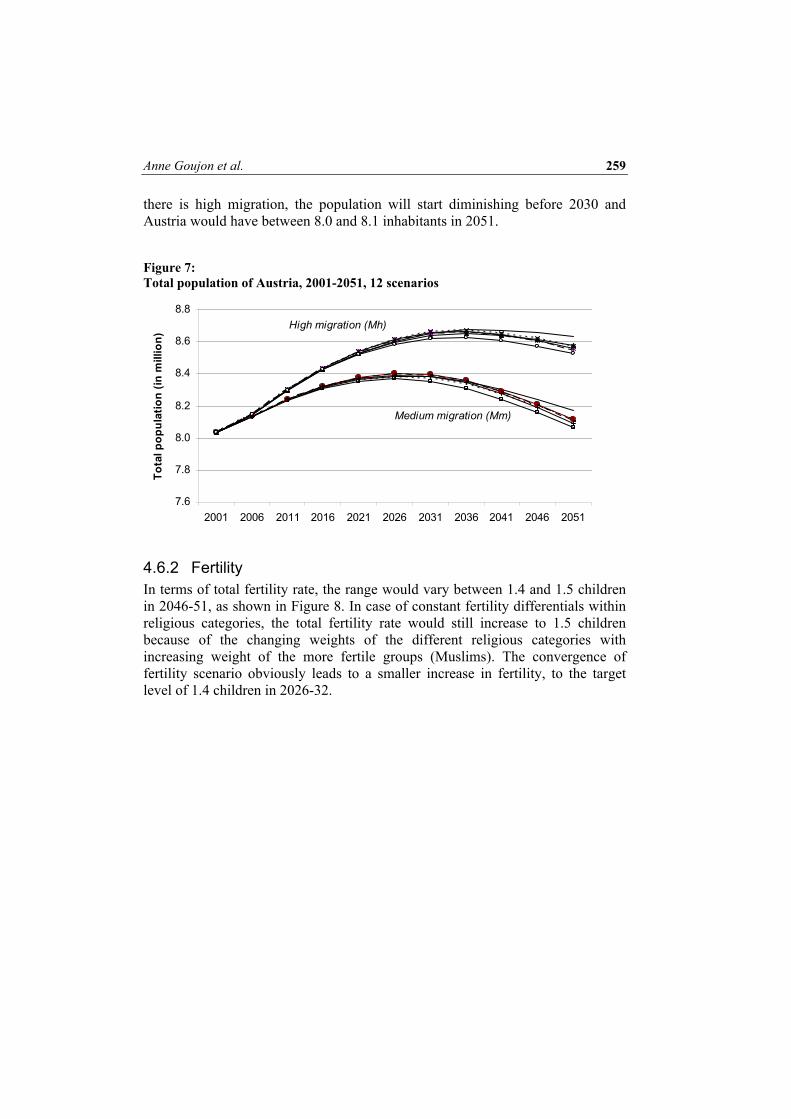
4.6.1 Population The Austrian population will start shrinking in all twelve scenarios, as shown in Figure 7. The time at which this will happen varies within the period from 2031 to 2051. We can identify two main groups of scenarios when looking across total population size results. The top group of scenarios leading to higher population growth is those combining high migration with the different fertility and transition scenarios. The total population would start decreasing after reaching its maximum in 2040 and count between 8.5 and 8.6 millions in 2051. Religion will contribute to population growth if migrants keep having a differentiated pattern of fertility, especially regarding the fertility of the Muslim population. It is clear that unless
Anne Goujon et al. 259
there is high migration, the population will start diminishing before 2030 and Austria would have between 8.0 and 8.1 inhabitants in 2051. Figure 7: Total population of Austria, 2001-2051, 12 scenarios
7.6
7.8
8.0
8.2
8.4
8.6
8.8
2001 2006 2011 2016 2021 2026 2031 2036 2041 2046 2051
Tota
l pop
ulat
ion
(in m
illio
n)
High migration (Mh)
Medium migration (Mm)
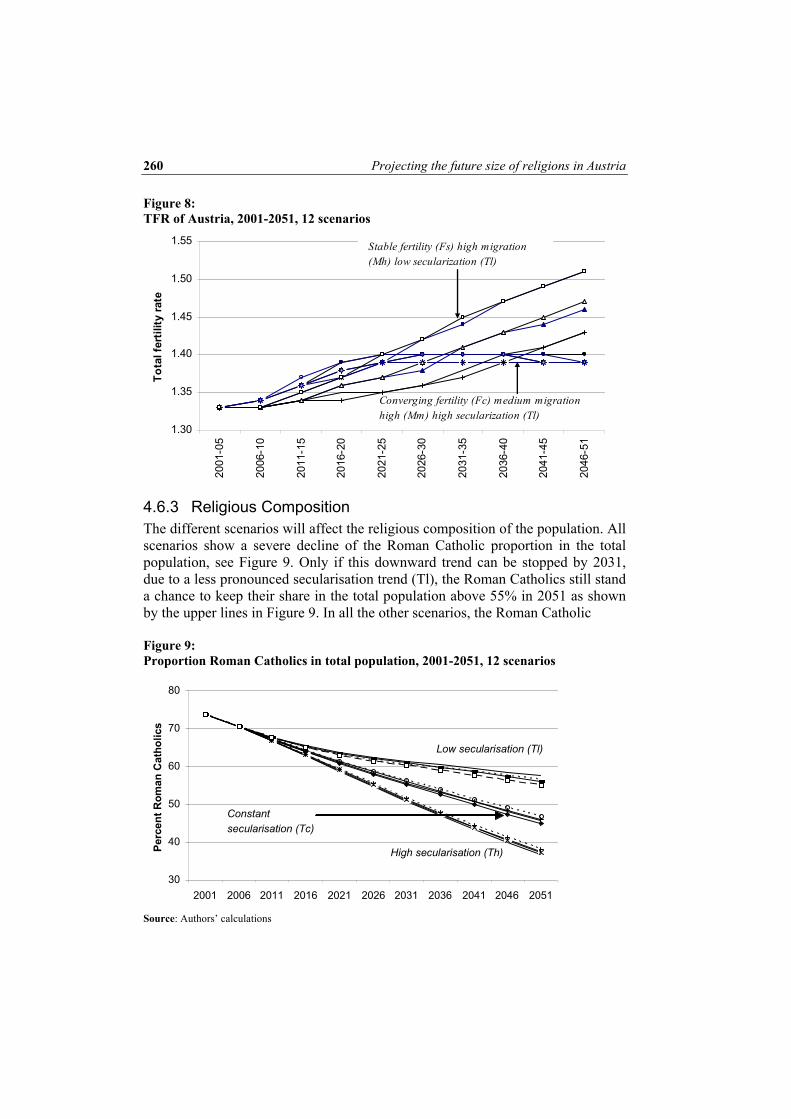
4.6.2 Fertility In terms of total fertility rate, the range would vary between 1.4 and 1.5 children in 2046-51, as shown in Figure 8. In case of constant fertility differentials within religious categories, the total fertility rate would still increase to 1.5 children because of the changing weights of the different religious categories with increasing weight of the more fertile groups (Muslims). The convergence of fertility scenario obviously leads to a smaller increase in fertility, to the target level of 1.4 children in 2026-32.
Projecting the future size of religions in Austria 260
Figure 8: TFR of Austria, 2001-2051, 12 scenarios
1.30
1.35
1.40
1.45
1.50
1.55
2001
-05
2006
-10
2011
-15
2016
-20
2021
-25
2026
-30
2031
-35
2036
-40
2041
-45
2046
-51
Tota
l fer
tility
rate
Stable fertility (Fs) high migration (Mh) low secularization (Tl)
Converging fertility (Fc) medium migration high (Mm) high secularization (Tl)
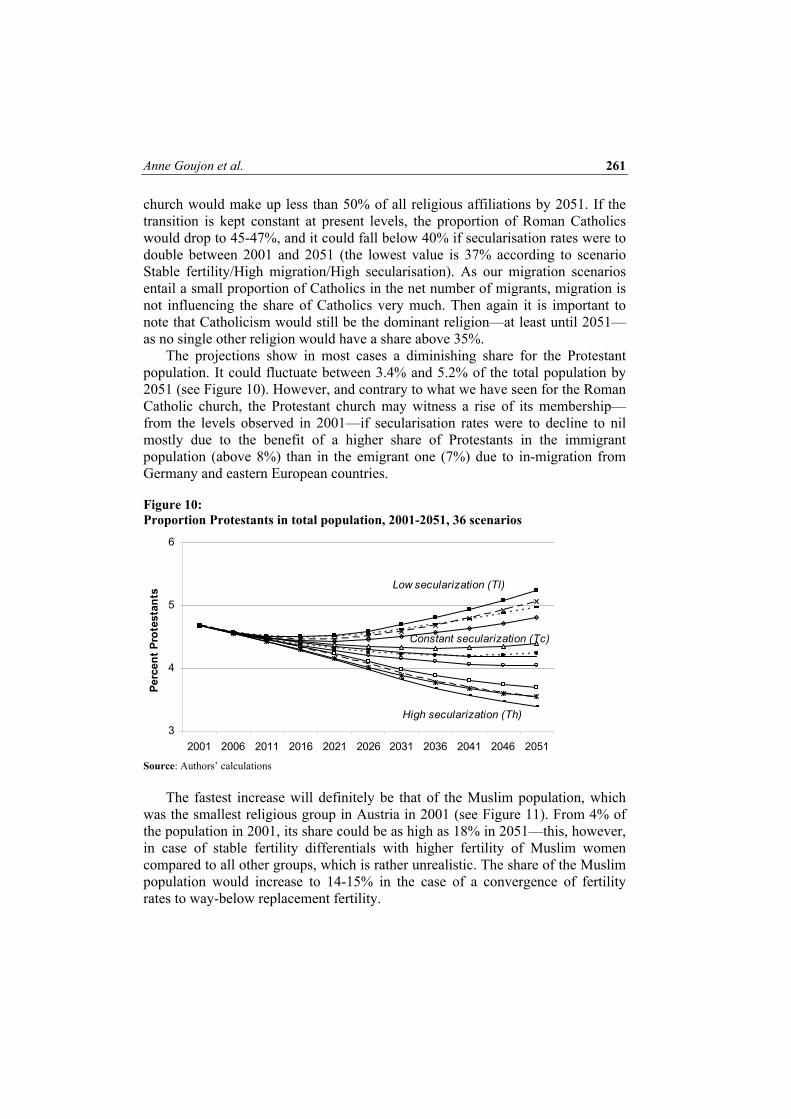
4.6.3 Religious Composition The different scenarios will affect the religious composition of the population. All scenarios show a severe decline of the Roman Catholic proportion in the total population, see Figure 9. Only if this downward trend can be stopped by 2031, due to a less pronounced secularisation trend (Tl), the Roman Catholics still stand a chance to keep their share in the total population above 55% in 2051 as shown by the upper lines in Figure 9. In all the other scenarios, the Roman Catholic
Figure 9: Proportion Roman Catholics in total population, 2001-2051, 12 scenarios
30
40
50
60
70
80
2001 2006 2011 2016 2021 2026 2031 2036 2041 2046 2051
Perc
ent R
oman
Cat
holic
s
Low secularisation (Tl)
Constant secularisation (Tc)
High secularisation (Th)
Source: Authors’ calculations
Anne Goujon et al. 261
church would make up less than 50% of all religious affiliations by 2051. If the transition is kept constant at present levels, the proportion of Roman Catholics would drop to 45-47%, and it could fall below 40% if secularisation rates were to double between 2001 and 2051 (the lowest value is 37% according to scenario Stable fertility/High migration/High secularisation). As our migration scenarios entail a small proportion of Catholics in the net number of migrants, migration is not influencing the share of Catholics very much. Then again it is important to note that Catholicism would still be the dominant religion—at least until 2051—as no single other religion would have a share above 35%.
The projections show in most cases a diminishing share for the Protestant population. It could fluctuate between 3.4% and 5.2% of the total population by 2051 (see Figure 10). However, and contrary to what we have seen for the Roman Catholic church, the Protestant church may witness a rise of its membership—from the levels observed in 2001—if secularisation rates were to decline to nil mostly due to the benefit of a higher share of Protestants in the immigrant population (above 8%) than in the emigrant one (7%) due to in-migration from Germany and eastern European countries. Figure 10: Proportion Protestants in total population, 2001-2051, 36 scenarios
3
4
5
6
2001 2006 2011 2016 2021 2026 2031 2036 2041 2046 2051
Perc
ent P
rote
stan
ts
Low secularization (Tl)
Constant secularization (Tc)
High secularization (Th)
Source: Authors’ calculations
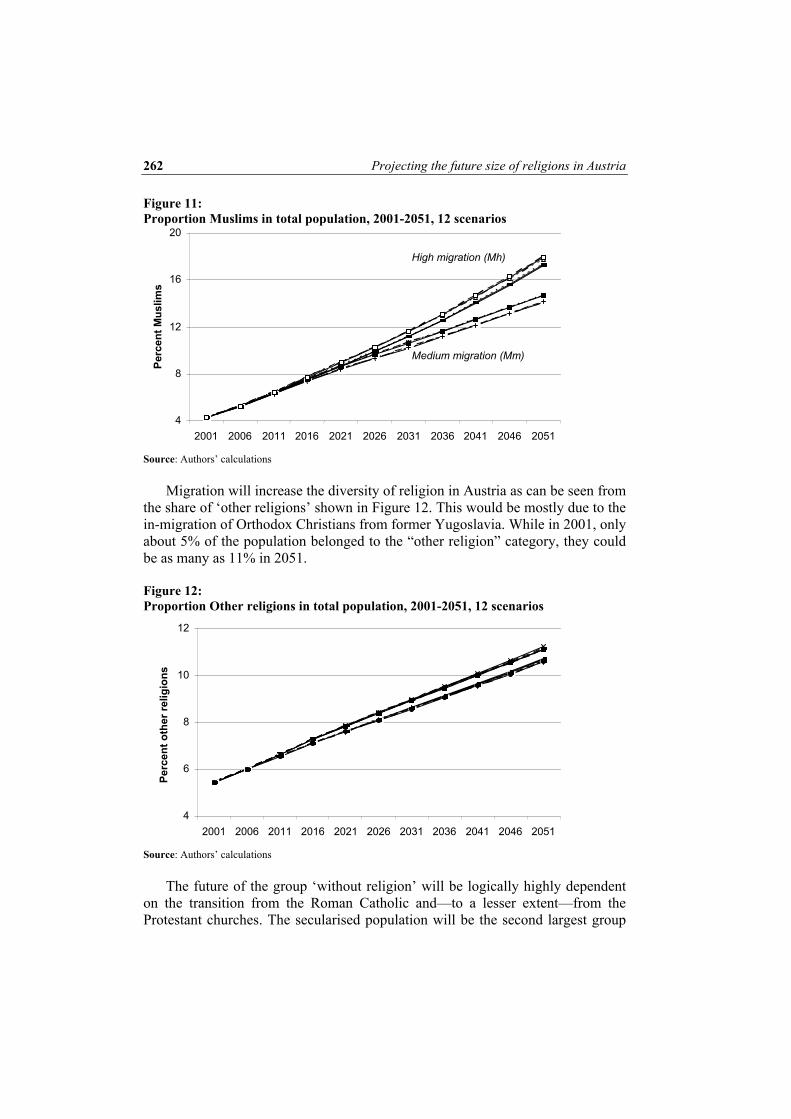
The fastest increase will definitely be that of the Muslim population, which
was the smallest religious group in Austria in 2001 (see Figure 11). From 4% of the population in 2001, its share could be as high as 18% in 2051—this, however, in case of stable fertility differentials with higher fertility of Muslim women compared to all other groups, which is rather unrealistic. The share of the Muslim population would increase to 14-15% in the case of a convergence of fertility rates to way-below replacement fertility.
Projecting the future size of religions in Austria 262
Figure 11: Proportion Muslims in total population, 2001-2051, 12 scenarios
4
8
12
16
20
2001 2006 2011 2016 2021 2026 2031 2036 2041 2046 2051
Perc
ent M
uslim
s
High migration (Mh)
Medium migration (Mm)
Source: Authors’ calculations
Migration will increase the diversity of religion in Austria as can be seen from
the share of ‘other religions’ shown in Figure 12. This would be mostly due to the in-migration of Orthodox Christians from former Yugoslavia. While in 2001, only about 5% of the population belonged to the “other religion” category, they could be as many as 11% in 2051.
Figure 12: Proportion Other religions in total population, 2001-2051, 12 scenarios
4
6
8
10
12
2001 2006 2011 2016 2021 2026 2031 2036 2041 2046 2051
Perc
ent o
ther
relig
ions
Source: Authors’ calculations
The future of the group ‘without religion’ will be logically highly dependent
on the transition from the Roman Catholic and—to a lesser extent—from the Protestant churches. The secularised population will be the second largest group
Anne Goujon et al. 263
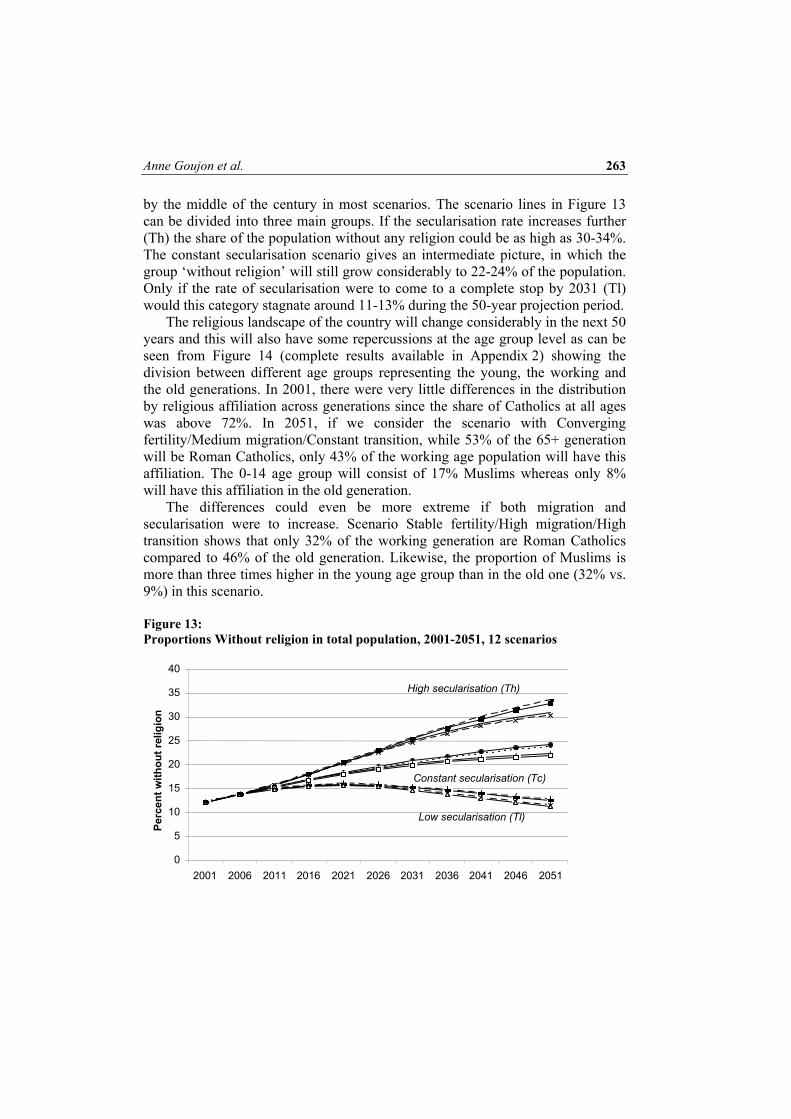
by the middle of the century in most scenarios. The scenario lines in Figure 13 can be divided into three main groups. If the secularisation rate increases further (Th) the share of the population without any religion could be as high as 30-34%. The constant secularisation scenario gives an intermediate picture, in which the group ‘without religion’ will still grow considerably to 22-24% of the population. Only if the rate of secularisation were to come to a complete stop by 2031 (Tl) would this category stagnate around 11-13% during the 50-year projection period.
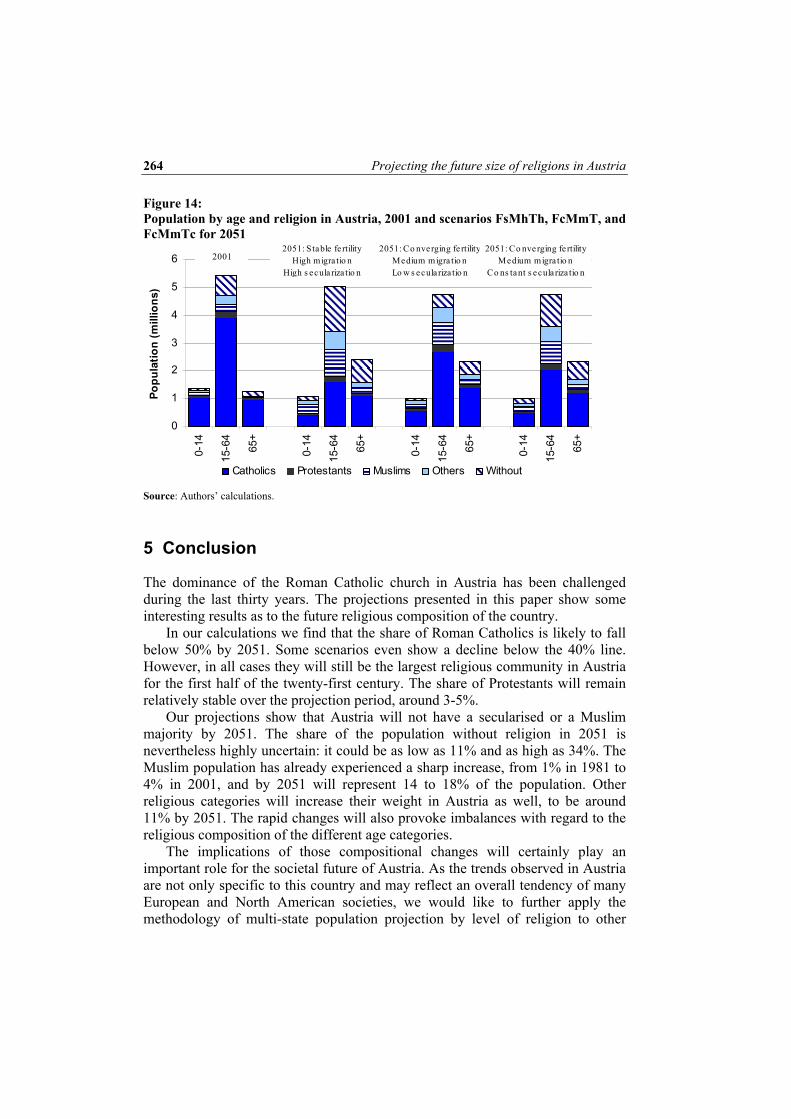
The religious landscape of the country will change considerably in the next 50 years and this will also have some repercussions at the age group level as can be seen from Figure 14 (complete results available in Appendix 2) showing the division between different age groups representing the young, the working and the old generations. In 2001, there were very little differences in the distribution by religious affiliation across generations since the share of Catholics at all ages was above 72%. In 2051, if we consider the scenario with Converging fertility/Medium migration/Constant transition, while 53% of the 65+ generation will be Roman Catholics, only 43% of the working age population will have this affiliation. The 0-14 age group will consist of 17% Muslims whereas only 8% will have this affiliation in the old generation.
The differences could even be more extreme if both migration and secularisation were to increase. Scenario Stable fertility/High migration/High transition shows that only 32% of the working generation are Roman Catholics compared to 46% of the old generation. Likewise, the proportion of Muslims is more than three times higher in the young age group than in the old one (32% vs. 9%) in this scenario.
Figure 13: Proportions Without religion in total population, 2001-2051, 12 scenarios
0 5
10 15 20 25 30 35 40
2001 2006 2011 2016 2021 2026 2031 2036 2041 2046 2051
Perc
ent w
ithou
t rel
igio
n
Low secularisation (Tl)
Constant secularisation (Tc)
High secularisation (Th)
Projecting the future size of religions in Austria 264
Figure 14: Population by age and religion in Austria, 2001 and scenarios FsMhTh, FcMmT, and FcMmTc for 2051
0
1
2
3
4
5
6
0-14
15-6
4
65+
0-14
15-6
4
65+
0-14
15-6
4
65+
0-14
15-6
4
65+
Popu
latio
n (m
illio
ns)
Catholics Protestants Muslims Others Without
2051 : Co nverging fe rtilityMedium migra tio nLo w s eculariza tio n
2051 : Co nverging fe rtilityMedium migra tio n
Co ns tant s ecula riza tio n
2051 : S table fe rtilityHigh migra tio n
High s ecula riza tio n
2001
Source: Authors’ calculations.
5 Conclusion
The dominance of the Roman Catholic church in Austria has been challenged during the last thirty years. The projections presented in this paper show some interesting results as to the future religious composition of the country.
In our calculations we find that the share of Roman Catholics is likely to fall below 50% by 2051. Some scenarios even show a decline below the 40% line. However, in all cases they will still be the largest religious community in Austria for the first half of the twenty-first century. The share of Protestants will remain relatively stable over the projection period, around 3-5%.
Our projections show that Austria will not have a secularised or a Muslim majority by 2051. The share of the population without religion in 2051 is nevertheless highly uncertain: it could be as low as 11% and as high as 34%. The Muslim population has already experienced a sharp increase, from 1% in 1981 to 4% in 2001, and by 2051 will represent 14 to 18% of the population. Other religious categories will increase their weight in Austria as well, to be around 11% by 2051. The rapid changes will also provoke imbalances with regard to the religious composition of the different age categories.
The implications of those compositional changes will certainly play an important role for the societal future of Austria. As the trends observed in Austria are not only specific to this country and may reflect an overall tendency of many European and North American societies, we would like to further apply the methodology of multi-state population projection by level of religion to other
Anne Goujon et al. 265
countries where similar data are available, such as Canada and Switzerland, in order to gain some comparative knowledge on the future religious composition of those countries and the impact it may have on many demographic indicators.
6 Acknowledgements We would like to thank Statistics Austria for providing the data, and Amela Ajonavic, Caroline Berghammer, Dalkhat Ediev, Marianne Fliegenschnee, Joshua Goldstein, Frank Landler and Wolfgang Lutz for making valuable comments; Sylvia Trnka for editing the first version of this paper and Werner Richter for editing the final version. We would also like to thank the participants of the UN-ECE Meeting in Vienna in September 2005 for asking the right questions.
References Abbasi-Shavazi, M.J. 1998. “The fertility of immigrant women in Australia”. People and
Place 6(3). Available online at «http://elecpress.monash.edu.au/pnp/free/pnpv6n3/» [5/12/2005].
Ahmad Faiz bin Abdul Rahman. 1998. “Malaysian laws on apostasy inadequate”. Belfast Islamic Centre News Global Newsletter Service. Available online at: «http://www.iol.ie/~afifi/BICNews/Afaiz/» [5/12/2005].
Al-Massabih. 1963. A collection of the most authentic traditions regarding the actions and sayings of Muhammad, Vol. 2. Ashraf, Lahore.
Bakar, O. 1995. “Abortion: Islamic Perspectives.” In: W. T. Reich (ed.). Encyclopedia of Bioethics, revised edition. New York, NY: Macmillan: vol. 1, pp. 38-42.
Barrett, D., G. Kurian, and T. Johnson. 2001. World Christian Encyclopedia. Oxford: Oxford University Press.
Berger, P. L., 1990. A Rumor of Angels: Modern Society and the Rediscovery of the Supernatural. New York: Doubleday & Company.
Berger, P. L., 1967. The Sacred Canopy: Elements of a Sociological Theory of Religion. New York: Doubleday Inc.
Berghammer, C. 2003. Formen gegenwärtiger Religiosität, institutionalisiert, privatisiert, sozial aktiviert. [Forms of current religiosity, institutionalised, privatised, socially accepted]. Master Thesis. Vienna: Department of Sociology, University of Vienna.
Borooah, V. 2004. “The politics of demography: a study of inter-community fertility differences in India”. European Journal of Political Economy 20(3): 551-578.
Bovay, C. and R. Broquet. 2004. Religionslandschaft in der Schweiz. Neuchatel: Bundesamt für Statistik.
Bundesministerium für soziale Sicherheit, Generationen und Konsumentenschutz. 2005. Kinderbetreuungsgeld. [Maternal benefits] Available online at: «http://www.help.gv.at/Content.Node/8/Seite.080600.html#Allgemein» [22/08/2005].
Bundespressedienst. 2004. Religionen in Österreich. [Religions in Austria] Bundeskanzleramt, Bundespressedienst.
Central Intelligence Agency (CIA). 2005. World Fact Book. Accessed 5 December 2005 from «http://www.cia.gov/cia/publications/factbook/index.html»
Projecting the future size of religions in Austria 266
Chamie, J. 1981. Religion and Fertility. Arab Christian – Muslim Differentials. Cambridge: Cambridge University Press.
Cohen, J. 1996. “How Many People Can the Earth Support?” New York, NY: W. W. Norton & Company.
Crockett, A. and D. Voas. 2006. “Generations of Decline: Religious Change in Twentieth-Century Britain” Journal for the Scientific Study of Religion 45(4).
Driver, E. D. 1963. Differential Fertility in Central India. Princeton, New Jersey: Princeton University Press.
Fitzgerald, M., A. T. Khoury, and W. Wanzura. 1976. “Moslems und Christen – Partner?” [Moslems and Christians – partners?] Vienna: Verlag Styria.
Fliegenschnee, K., A. Goujon, and W. Lutz. 2004. “Neue demographische Szenarien zur Zukunft der Evangelischen Kirche in Österreich. ” [New demographic scenarios, the future of the evangelic church in Austria]. VID Working Paper 01/2004. Vienna: Vienna Institute of Demography. Accessed 9 December 2005 at «http://www.oeaw.ac.at/vid/p_vid-workingpapers.shtml»
Flora, P. 1983. State, economy, and society in Western Europe 1815-1975. A data handbook, Volume I: The Growth of Mass Democracies and Welfare States. Frankfurt am Main: Campus Verlag.
Haug, W. and P. Wanner. 2000. “The demographic characteristics of linguistic and religious groups in Switzerland.” In: W. Haug, P. Compton, and Y. Courbage (Coordinators). The demographic characteristics of national minorities in certain European states. Vol. 2. Population Studies 31. Strasbourg: Council of Europe Publishing.
Hummer, R., C. Ellison, R. Rogers, B. Moulton, and R. Romero. 2004. “Religious involvement and adult mortality in the United States: Review and Perspective.” Southern Medical Journal 97(12): 1223-1230.
INEGI. 2000. Population and Housing Census. National Institute for Geography, Statistics, and Informatics. Mexico.
Kaufmann, E. 2006. “Breeding for God.” Prospect magazine 128 (November 2006). Accessed at «http://www.prospect-magazine.co.uk/article_details.php?id=7913».
Knoblauch, H. 1999. Religionssoziologie. Berlin: de Gruyter. Lehrer, E. 2005. “Religious Affiliation and Participation as Determinants of Women’s
Educational Attainment and Wages”. IZA Discussion Paper 1725. Bonn: Institute for the Study of Labor.
Luckmann, T. 1991. Die unsichtbare Religion. Frankfurt am Main: Suhrkamp. Lutz, W. 1985. “Gemischt-konfessionelle Familien in Österreich. Analyse
bevölkerungsstatistischer Daten.” [Families with mixed religious denominations in Austria, an analysis of population statistics] Demographische Informationen, Vienna Institute of Demography, pp. 77-80.
Lutz, W. and J. Uljas-Lutz. 1998. “Konfessions-verbindende Familien als vordringliches Lernfeld einer Minderheitskirche.” [Religious denomination connections families as important field for learning for a minority church.] In: M. Bünker and T. Krobath. Kirche: Lernfähig in die Zukunft? Festschrift für Johannes Dantine zum 60. Geburtstag.
Lutz, W., A. Goujon, and A. Wils. 2007 (forthcoming.) “The population dynamics of human capital accumulation.” In: A. Prskawetz, D. E. Bloom, and W. Lutz (eds.) Population Aging, Human Capital Accumulation, and Productivity Growth. A supplement to Population and Development Review 33.

Anne Goujon et al. 267
Martos, J. 1997. “The evolving ideal of the family in the Catholic tradition.” In: R. Carter and S. Isensberg (eds.) Essays on the person, family, society and environment. St Paul, Minnesota: Paragon House, pp. 233-252.
McQuillan, K. 2004. “When does religion influence fertility?” Population and Development Review 30(1): 25-56.
Miklas, H. 2005. “Wissen um die historische Bedingtheit gesellschaftlicher Konventionen, ein Positionspapier des Theologischen Ausschusses A.B. zum Eheverständnis.” [Knowledge about the historic conditionality of conventions in a society. A statement of the theological commission A.B about marriage.] Evangelische Kirchenzeitung für Österreich, no. 12/13: 52.
Mirza, A., A. Senthilkumaran, and Z. Ja'far 2007. “Living apart together.” Policy Exchange. «www.policyexchange.org.uk/images/libimages/246.pdf», Accessed 15.05.2007
Morgan, P., S. Stash, H. Smith, and K. O. Mason. 2002. “Muslim and Non-Muslim Differences in Female Fertility: Evidence From Four Asian Countries.” Population and Development Review 28(3): 515-537.
Münz, R., P. Zuser, and J. Kytir. 2003. “Grenzüberschreitende Wanderungen und ausländische Wohnbevölkerung.” In: H. Fassmann and I. Stacher (eds.) Österreichischer Migrations- und Integrationsbericht. Demographische Entwicklungen - sozioökonomische Strukturen - rechtliche Rahmenbedingungen. [Austrian Migration and Integration Report. Demographic developments – socio-economic structures – outline of legal conditions]. Klagenfurt: Drava-Verlag und Druckges: 20-61.
Nahmias, P. 2004. “Fertility behaviour of recent immigrants to Israel: A comparative analysis of immigrants from Ethiopia and the former Soviet Union”. Demographic Research 10(4).
Noonan, H. 1986. Contraception; a history of its treatment by the Catholic theologians and canonists. Cambridge, MA: Belknap Press of Harvard University Press.
Rahman, S.A. 1986. Punishment of apostasy in Islam. Lahore: Kazi Publications. Ram, B. and M.V. George. 1990. “Immigrant fertility patterns in Canada, 1961-1986.”
International Migration 28(4): 413-426. Reingrabner, G. 1981. Protestanten in Österreich, Geschichte und Dokumentation.
[Protestants in Austria, history and documentation] Vienna: Böhlau Verlag. Reynolds, V. and R. Tanner. 1995. The social ecology of population. New York, NY:
Oxford University Press. Saenz, R. 2005. “The Changing demographic of Roman Catholics.” Population Reference
Bureau. Accessed May 2007 from «http://www.prb.org/Articles/2005/TheChangingDemographicsofRomanCatholics.aspx»
Sander, W. 1992. “Catholicism and the economics of fertility”. Population Studies 46(3): 477-89.
Schloz, R., D. Pollack, T. Stahlberg, M. Wohlrab-Sahr, and F. Benthaus-Apel. 2003. “Kirche, Horizont und Lebensrahmen: Weltsichten, Kirchenbindungm Lebensstile. [Church, horizon and life frame: philosophies, church bonds, life styles.] Kirchenamt der Evangelischen Kirche in Deutschland.” Accessed 6 December 2005 from
«http://www.ekd.de/download/kmu_4_internet.pdf » Schluchter, W. 1991. Religion und Lebensführung: Band 2 [Religiosity and Lifestyle
Volume 2] Studien zu Max Weber Religions- und Herrschaftssoziologie. Frankfurt am Main: Suhrkamp.

Projecting the future size of religions in Austria 268
Simmons, J. 2003. “Population Doctrines of Religions.” In: P. Demeny and G. McNicoll (ed.) Encyclopedia of population Vol. 2. New York, NY: Macmillan.
Smith, T.W. and S. Kim. 2004. “The Vanishing Protestant Majority.” GSS Social Change Report No. 49. Chicago: NORC/University of Chicago. Accessed 6 December 2005 from «http://www.norc.uchicago.edu/issues/PROTSGO8.pdf».
Sobotka, T. 2004. “Is lowest-low fertility in Europe explained by the postponement of childbearing?” Population and Development Review 30(2): 195-220.
Statistics Austria ISIS. “Datenbank ISIS.” (Integriertes Statistisches Informationssystem). Accessed 5 December 2005 from «http://www.statistik.at/isis/current/isis_gui.shtml».
Statistics Austria. 1994-2006. Statistical yearbooks. Statistics Austria: Vienna. Statistics Canada. 2001. “Major religious denominations.” Toronto. Accessed 5 December
2005 from «http://www12.statcan.ca/english/census01/Products/Analytic/companion/rel/tables/canada/cdamajor.cfm »
Statistics Canada. 2005. Population Projections of Visible Minority Groups, Canada, Provinces and Regions 2001-2017. Toronto: Statistics Canada Demography Division.
Statistics India. 2001. “Census of India 2001 data on religion.” New Delhi. Accessed 5 December 2005 from «www.censusindia.net/religiondata/Introduction_2001_religion.pdf».
Statistics Israel. 2004. “Population by religion.” Jerusalem. Accessed 9 December 2005 from «http://www.cbs.gov.il».
Statistics United Kingdom. 2001. “Population by religion.” London. Accessed 9 December 2005 from «http://www.statistics.gov.uk/census2001/profiles/commentaries/ethnicity.asp#religion»
Strawbridge, W.J., R.D. Cohen, and S.J. Shema. 2000. “Comparative strength of association between religious attendance and survival.” International journal of psychiatry in medicine 30(4): 299-308.
Underwood, C. 2000. “Islamic precepts and family planning: The perceptions of Jordanian religious leaders and their constituents.” International Family Planning Perspectives, vol. 26, no. 3: 110-117.
United Nations Office for the Coordination of Humanitarian Affairs. 2005. Planned census facing boycott threats. IrinNews.org. Accessed 6 December 2005 from «http://www.irinnews.org/report.asp?ReportID=48498&SelectRegion=West_Africa&SelectCountry=NIGERIA»
United Nations. 2004. World population prospects 2004. New York, NY: United Nations. Veitschegger, K. 2004. “Eheannullierung: Scheidung auf katholisch?” [Nullification of
marriages: divorce in Catholic?] Accessed 6 December 2005 from «http://66.102.9.104/search?q=cache:KeIzA_CntcJ:members.surfeu.at/veitschegger/texte/annullierung.htm+katholisch+scheidung&hl=de»
Voas, D. and A. Crockett. 2005. “Religion in Britain: Neither Believing nor Belonging.” Sociology 39(1): 11-28.
Zulehner, P, H. Denz, M. Beham, and C. Friesl. 1993. Vom Untertan zum Freiheitskünstler: Eine Kulturdiagnose anhand der Untersuchungen; Religion im Leben der Österreicher 1970 bis 1990. [From subject to freedom artist: a cultural diagnosis based on the analysis of religion in the life of Austrians 1970 to 1990.] Europäische Wertestudie, Österreichteil 1990. Vienna: Herder.
Anne Goujon et al. 269
Appendix 1: Methodology for Estimating the Fertility by Religion of Mothers
The base-year fertility in different age groups was estimated from the census data on children ever born to women with different religious affiliation residing in Austria in 1981, 1991 and 2001 using data from Austrian censuses. The second data source was the TFR (Total Fertility Rates) and ASFR (Age-Specific Fertility Rates) for the whole population calculated by Statistics Austria for the years 1981, 1991 and 2001.
The calculation of ASFRs for different religion groups was based on the assumption that their fertility was proportional to the average increment of cohort parities between two censuses. The number of children ever born (by women with religious affiliation) was used to calculate the average parities and increment of cohort parities between two surveys (for method of calculation of the average parities, see: United Nations 1983 p. 58). Then these increments for different age groups were treated as the fertility of the hypothetical cohort. These results were the basis to calculate proportions between the fertility of mothers with each age group and the fertility of all mothers, called herein the relative fertility indicators. The ASFRs for different religion groups in 1991 and 2001 was reconstructed using these indicators for the periods 1981-1991 and 1991-2001 and the ASFR for the total population in 1981, 1991 and 2001.
The results of the method described above should be considered as rough estimations of the fertility rates for different religion groups, for a number of assumptions are made during this procedure: 1) The procedure assures that specific fertility rates for different religion groups are consistent with the age-specific fertility rate for the whole population published by Statistics Austria, but the relations between fertility figures can differ from the relations between the increment of cohort parities between two censuses. 2) It is assumed that parity increments are unaffected by migration and mortality. If the immigration is composed mainly of women with higher fertility, it can lead to overestimation of children born in Austria because some of the children of these women were born outside Austria. If women with higher fertility have a higher probability of death it could lead to underestimation of fertility because relatively more mothers with higher fertility die between censuses 3) It is assumed that the birth of a child does not affect religious conversion. If a change of religion is correlated with the birth of a child (for example. because of marriage), this could increase the fertility of the religion frequently chosen by mothers.
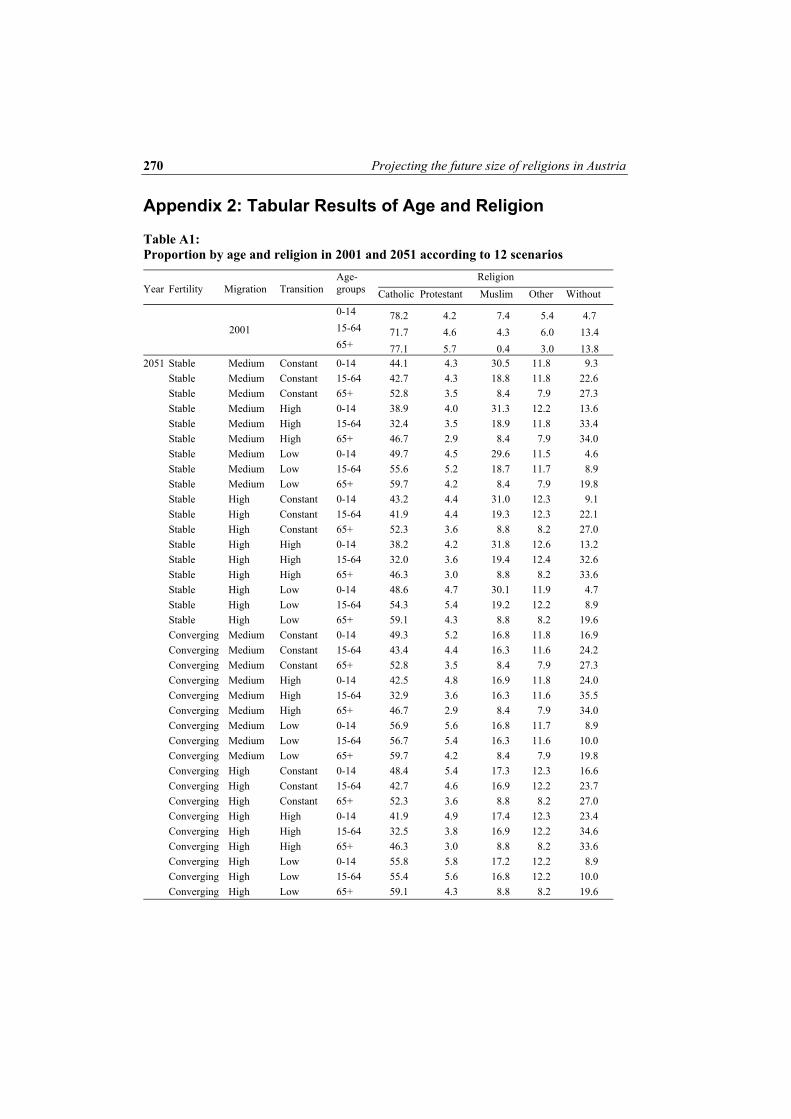
Projecting the future size of religions in Austria 270
Appendix 2: Tabular Results of Age and Religion
Table A1: Proportion by age and religion in 2001 and 2051 according to 12 scenarios
Religion Year
Fertility
Migration
Transition
Age-groups Catholic Protestant Muslim Other Without 0-14 78.2 4.2 7.4 5.4 4.7 15-64 71.7 4.6 4.3 6.0 13.4 2001 65+ 77.1 5.7 0.4 3.0 13.8
2051 Stable Medium Constant 0-14 44.1 4.3 30.5 11.8 9.3 Stable Medium Constant 15-64 42.7 4.3 18.8 11.8 22.6 Stable Medium Constant 65+ 52.8 3.5 8.4 7.9 27.3 Stable Medium High 0-14 38.9 4.0 31.3 12.2 13.6 Stable Medium High 15-64 32.4 3.5 18.9 11.8 33.4 Stable Medium High 65+ 46.7 2.9 8.4 7.9 34.0 Stable Medium Low 0-14 49.7 4.5 29.6 11.5 4.6 Stable Medium Low 15-64 55.6 5.2 18.7 11.7 8.9 Stable Medium Low 65+ 59.7 4.2 8.4 7.9 19.8 Stable High Constant 0-14 43.2 4.4 31.0 12.3 9.1 Stable High Constant 15-64 41.9 4.4 19.3 12.3 22.1 Stable High Constant 65+ 52.3 3.6 8.8 8.2 27.0 Stable High High 0-14 38.2 4.2 31.8 12.6 13.2 Stable High High 15-64 32.0 3.6 19.4 12.4 32.6 Stable High High 65+ 46.3 3.0 8.8 8.2 33.6 Stable High Low 0-14 48.6 4.7 30.1 11.9 4.7 Stable High Low 15-64 54.3 5.4 19.2 12.2 8.9 Stable High Low 65+ 59.1 4.3 8.8 8.2 19.6 Converging Medium Constant 0-14 49.3 5.2 16.8 11.8 16.9 Converging Medium Constant 15-64 43.4 4.4 16.3 11.6 24.2 Converging Medium Constant 65+ 52.8 3.5 8.4 7.9 27.3 Converging Medium High 0-14 42.5 4.8 16.9 11.8 24.0 Converging Medium High 15-64 32.9 3.6 16.3 11.6 35.5 Converging Medium High 65+ 46.7 2.9 8.4 7.9 34.0 Converging Medium Low 0-14 56.9 5.6 16.8 11.7 8.9 Converging Medium Low 15-64 56.7 5.4 16.3 11.6 10.0 Converging Medium Low 65+ 59.7 4.2 8.4 7.9 19.8 Converging High Constant 0-14 48.4 5.4 17.3 12.3 16.6 Converging High Constant 15-64 42.7 4.6 16.9 12.2 23.7 Converging High Constant 65+ 52.3 3.6 8.8 8.2 27.0 Converging High High 0-14 41.9 4.9 17.4 12.3 23.4 Converging High High 15-64 32.5 3.8 16.9 12.2 34.6 Converging High High 65+ 46.3 3.0 8.8 8.2 33.6 Converging High Low 0-14 55.8 5.8 17.2 12.2 8.9 Converging High Low 15-64 55.4 5.6 16.8 12.2 10.0 Converging High Low 65+ 59.1 4.3 8.8 8.2 19.6
Related Documents