Publ. Astron. Soc. Aust., 1999, 16, 113–23 New Structure in the Shapley Supercluster M. J. Drinkwater 1 , D. Proust 2 , Q. A. Parker 3 , H. Quintana 4 and E. Slezak 5 1 School of Physics, University of New South Wales, Sydney, NSW 2052, Australia Present address: School of Physics, University of Melbourne, Parkville, Vic. 3052, Australia [email protected] 2 DAEC, Observatoire de Meudon, 92195 Meudon Cedex, France 3 Anglo-Australian Observatory, Coonabarabran, NSW 2357, Australia Present address: Royal Observatory Edinburgh, Blackford Hill, Edinburgh, EH9 3HJ, UK [email protected] 4 Departamento de Astronomia y Astrofisica, Pontificia Universidad Cat´olica de Chile, Casilla 104, Santiago 22, Chile [email protected] 5 Observatoire de Nice, 06304 Nice, Cedex 4, France [email protected] Received 1998 June 10, accepted 1999 March 3 Abstract: We present new radial velocities for 306 bright (R< 16) galaxies in a 77 deg 2 region of the Shapley supercluster, measured with the FLAIR-II spectrograph on the UK Schmidt Telescope. The galaxies we measured were uniformly distributed over the survey area, in contrast to previous samples which were concentrated in several rich Abell clusters. Most of the galaxies (230) were members of the Shapley supercluster: they trace out two previously unknown sheets of galaxies linking the Abell clusters of the supercluster. In a 44 deg 2 area of the supercluster excluding the Abell clusters, these sheets alone represent an overdensity of a factor of 2 · 0 ± 0 · 2 compared to a uniform galaxy distribution. The supercluster is not flattened in the Declination direction as has been suggested in previous papers. Within our survey area the new galaxies contribute an additional 50% to the known contents of the Shapley supercluster, with a corresponding increase in its contribution to the motion of the Local Group. Keywords: galaxies: clusters, distances and redshifts — large-scale structure of universe 1 Introduction The Shapley supercluster (SSC) has been investigated by numerous authors since its discovery in 1930 (Quintana et al. 1995, hereafter Paper I). It lies in the general direction of the dipole anisotropy of the Cosmic Microwave Background (CMB), and is located at 130 h -1 75 Mpc beyond the Hydra-Centaurus supercluster (’ 50 h -1 75 Mpc away from us). It consists of many clusters and groups of galaxies in the redshift range 0 · 04 <z< 0 · 055. The central cluster A3558 has also been measured with a ROSAT PSPC observation by Bardelli et al. (1996), who derived a total mass of M tot =3 · 1 × 10 14 M fl within an Abell radius of 2 h -1 75 Mpc. Several other X-ray clusters form part of the Shapley supercluster (Pierre et al. 1994). The Shapley supercluster is recognised as one of the most massive concentrations of galaxies in the local universe (Scaramella et al. 1989; Raychaudhury 1989), so it is of particular interest to consider its effect on the dynamics of the Local Group. In Paper I it was estimated that for Ω 0 =0 · 3 and H 0 = 75 km s -1 Mpc -1 the gravitational pull of the supercluster may account for up to 25% of the peculiar velocity of the Local Group required to explain the dipole anisotropy of the CMB radiation, in which case the mass of the supercluster would be dominated by intercluster dark matter. Previous studies of the Shapley supercluster (Paper I; Quintana et al. 1997, hereafter Paper II) have concentrated on the various rich Abell galaxy clusters in the region, but this might give a very biased view of the supercluster. As was noted in Paper I, ‘the galaxy distribution inside the supercluster must be confirmed by the detection in redshift space of bridges or clouds of galaxies connecting the different clusters’. q Astronomical Society of Australia 1999 1323-3580/99/020113$05.00

Welcome message from author
This document is posted to help you gain knowledge. Please leave a comment to let me know what you think about it! Share it to your friends and learn new things together.
Transcript
Publ. Astron. Soc. Aust., 1999, 16, 113–23.
New Structure in the Shapley Supercluster
M. J. Drinkwater1, D. Proust2, Q. A. Parker3,
H. Quintana4 and E. Slezak5
1School of Physics, University of New South Wales, Sydney, NSW 2052, Australia
Present address: School of Physics, University of Melbourne,Parkville, Vic. 3052, Australia
[email protected], Observatoire de Meudon, 92195 Meudon Cedex, France
3Anglo-Australian Observatory, Coonabarabran, NSW 2357, Australia
Present address: Royal Observatory Edinburgh, Blackford Hill,Edinburgh, EH9 3HJ, UK
[email protected] de Astronomia y Astrofisica, Pontificia Universidad Catolica de Chile,
Casilla 104, Santiago 22, Chile
[email protected] de Nice, 06304 Nice, Cedex 4, France
Received 1998 June 10, accepted 1999 March 3
Abstract: We present new radial velocities for 306 bright (R < 16) galaxies in a 77deg2 region of the Shapley supercluster, measured with the FLAIR-II spectrographon the UK Schmidt Telescope. The galaxies we measured were uniformly distributedover the survey area, in contrast to previous samples which were concentrated inseveral rich Abell clusters. Most of the galaxies (230) were members of the Shapleysupercluster: they trace out two previously unknown sheets of galaxies linking theAbell clusters of the supercluster. In a 44 deg2 area of the supercluster excluding theAbell clusters, these sheets alone represent an overdensity of a factor of 2 ·0 ± 0 ·2compared to a uniform galaxy distribution. The supercluster is not flattened in theDeclination direction as has been suggested in previous papers. Within our surveyarea the new galaxies contribute an additional 50% to the known contents of theShapley supercluster, with a corresponding increase in its contribution to the motionof the Local Group.
Keywords: galaxies: clusters, distances and redshifts — large-scale structure of universe
1 Introduction
The Shapley supercluster (SSC) has been investigatedby numerous authors since its discovery in 1930(Quintana et al. 1995, hereafter Paper I). It liesin the general direction of the dipole anisotropy ofthe Cosmic Microwave Background (CMB), and islocated at 130 h−1
75 Mpc beyond the Hydra-Centaurussupercluster (' 50 h−1
75 Mpc away from us). Itconsists of many clusters and groups of galaxies inthe redshift range 0 ·04 < z < 0 ·055. The centralcluster A3558 has also been measured with a ROSATPSPC observation by Bardelli et al. (1996), whoderived a total mass of Mtot = 3 ·1×1014 M¯ withinan Abell radius of 2 h−1
75 Mpc. Several other X-rayclusters form part of the Shapley supercluster (Pierreet al. 1994).
The Shapley supercluster is recognised as one ofthe most massive concentrations of galaxies in the
local universe (Scaramella et al. 1989; Raychaudhury1989), so it is of particular interest to consider itseffect on the dynamics of the Local Group. InPaper I it was estimated that for Ω0 = 0 ·3 andH 0 = 75 km s−1Mpc−1 the gravitational pull of thesupercluster may account for up to 25% of thepeculiar velocity of the Local Group required toexplain the dipole anisotropy of the CMB radiation,in which case the mass of the supercluster wouldbe dominated by intercluster dark matter.
Previous studies of the Shapley supercluster(Paper I; Quintana et al. 1997, hereafter PaperII) have concentrated on the various rich Abellgalaxy clusters in the region, but this might givea very biased view of the supercluster. As wasnoted in Paper I, ‘the galaxy distribution inside thesupercluster must be confirmed by the detectionin redshift space of bridges or clouds of galaxiesconnecting the different clusters’.
q Astronomical Society of Australia 1999 1323-3580/99/020113$05.00
114 M. J. Drinkwater et al.
We are continuing this project, using data fromwide-field multi-fibre spectrographs to measure manymore galaxy redshifts and get a more complete pictureof the composition of the supercluster. Our mainaims are first to define the real topology of theSSC (in Paper I it was shown that the SSC issignificantly flattened, but the real extent of theconcentration is not well defined) and second toanalyse the individual X-ray clusters that are truemembers of the Shapley Supercluster, in order toestimate the cluster masses and investigate suspectedsubstructure. Additional observations are plannedbefore we present a full analysis of the dynamics(Proust et al. 1999, in preparation).
In Paper II we presented data from the MEFOSspectrograph on the European Southern Observatory3 ·60 m telescope. This has 30 fibres in a 1 degdiameter field, so the observations were again mainlyconcentrated on the known clusters, determining forseveral of them whether they were members of thesupercluster or not.
In this paper we present new data obtainedwith the FLAIR-II (Parker & Watson 1995; Parker1997) multi-fibre spectrograph on the UK SchmidtTelescope at the Anglo-Australian Observatory. Thishas 90 fibres in a 5 ·5×5 ·5 deg2 field and has allowedus to measure a much more uniform distribution ofgalaxies in the direction of the SSC, avoiding theprevious bias in favour of the rich clusters. Our datareveal the existence of a sheet of galaxies connectingthe main parts of the supercluster. We describe thesample and observations in Section 2. We present theresults along with previous measurements in Section 3and discuss the significance of the measurements inSection 4.
2 Observations
Although a large body of galaxy velocity datais available in the literature for the SSC, theexisting samples of redshifts in each cluster arehighly incomplete, even at the bright end of theluminosity function. We have therefore started acampaign to obtain complete samples down to thesame magnitude below L∗ for each cluster. Eachselected cluster has a projected diameter of 2 ·5 to3 ·0 degrees, so the FLAIR-II system on the UKST,with its 5 ·5× 5 ·5 deg2 field, is an ideal facility forthis project. The very wide field also permits usto probe the regions between the dominant clusters
that have been neglected in previous observations.In this paper we emphasise our results from theseregions.
We selected targets from red ESO/SRC skysurvey plates scanned by the MAMA machine atParis Observatory (as described in Paper II; seealso Infante, Slezak & Quintana 1996). The fieldsobserved (listed in Table 1) were the standardsurvey fields nearest to the centre of the cluster(13:25:00, −31:00:00 B1950). These covered an areaof 77 deg2, allowing us to probe the limits of theSSC out to radii as large as 8 deg.
We defined a sample of galaxies to a limit ofR < 16,corresponding (assuming a mean B − R = 1 ·5) toB < 17 ·5, the nominal galaxy limiting magnitudeof the FLAIR-II system. This corresponds to anabsolute magnitude of MB = −19 at the Shapleydistance of 200 h−1
75 Mpc. This gave samples of600–1000 galaxies per field. We then removedany galaxies with published measurements in theNED database or measured by H. Quintana andR. Carrasco (private communication, 1997): 46galaxies for F382, 81 for F383 and 200 for F444.For each observing run we then selected randomsubsamples of about 110 targets per field from theunobserved galaxies. When preparing each field forobservation at the telescope, we made a furtherselection of 80 targets to observe (10 fibres beingreserved for measurement of the sky background).This final selection was essentially random, but wedid reject any galaxies too close (less than about1 arcminute) to another target already chosen or abright star.
We observed a total of 3 fields with the FLAIR-IIspectrograph in 1997 May and two more in 1998April. The details of the observations are given inTable 1. In 1997, out of 6 allocated nights, we wereonly able to observe 3 FLAIR fields successfullydue to poor weather and the first of these wasrepeated over 3 nights. Field F444 was observed inparticularly poor weather, resulting in a much lowernumber of measured redshifts. In 1998 we againhad poor weather, and were only able to observetwo fields in an allocation of 8 half-nights.
The data were reduced as described in Drinkwateret al. (1996), using the dofibers package in IRAF
(Tody 1993). We measured the radial velocities withthe RVSAO package (Kurtz & Mink 1998) contributedto IRAF.
Table 1. Journal of FLAIR observations
Date Field RA (1950) Dec Exposure Seeing Weather Nz
1997 May 5 F382 13:12:00 −35:00:00 18 000s 2–3′′ cloud 691997 May 6 F444 13:25:00 −30:00:00 15 000s 2–3′′ cloud 471997 May 8 F383 13:36:00 −35:00:00 18 000s 3–5′′ clear 731998 April 25 F383 13:36:00 −35:00:00 15 000s 2–3′′ clear 611998 April 27 F382 13:12:00 −35:00:00 21 000s 3–5′′ cloud 56
Note: Nz is the number of galaxies with measured redshifts in each field.
New Structure in Shapley Supercluster 115
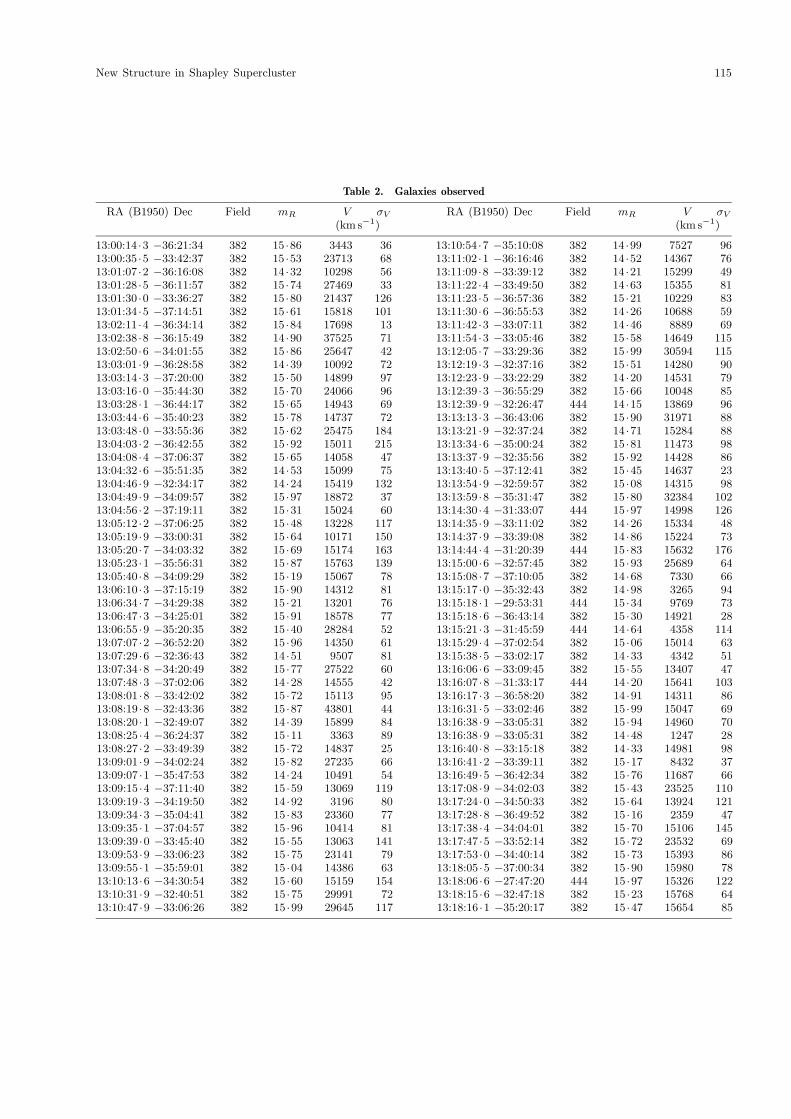
Table 2. Galaxies observed
RA (B1950) Dec Field mR V σV RA (B1950) Dec Field mR V σV(km s−1) (km s−1)
13:00:14 ·3 −36:21:34 382 15 ·86 3443 36 13:10:54 ·7 −35:10:08 382 14 ·99 7527 9613:00:35 ·5 −33:42:37 382 15 ·53 23713 68 13:11:02 ·1 −36:16:46 382 14 ·52 14367 7613:01:07 ·2 −36:16:08 382 14 ·32 10298 56 13:11:09 ·8 −33:39:12 382 14 ·21 15299 4913:01:28 ·5 −36:11:57 382 15 ·74 27469 33 13:11:22 ·4 −33:49:50 382 14 ·63 15355 8113:01:30 ·0 −33:36:27 382 15 ·80 21437 126 13:11:23 ·5 −36:57:36 382 15 ·21 10229 8313:01:34 ·5 −37:14:51 382 15 ·61 15818 101 13:11:30 ·6 −36:55:53 382 14 ·26 10688 5913:02:11 ·4 −36:34:14 382 15 ·84 17698 13 13:11:42 ·3 −33:07:11 382 14 ·46 8889 6913:02:38 ·8 −36:15:49 382 14 ·90 37525 71 13:11:54 ·3 −33:05:46 382 15 ·58 14649 11513:02:50 ·6 −34:01:55 382 15 ·86 25647 42 13:12:05 ·7 −33:29:36 382 15 ·99 30594 11513:03:01 ·9 −36:28:58 382 14 ·39 10092 72 13:12:19 ·3 −32:37:16 382 15 ·51 14280 9013:03:14 ·3 −37:20:00 382 15 ·50 14899 97 13:12:23 ·9 −33:22:29 382 14 ·20 14531 7913:03:16 ·0 −35:44:30 382 15 ·70 24066 96 13:12:39 ·3 −36:55:29 382 15 ·66 10048 8513:03:28 ·1 −36:44:17 382 15 ·65 14943 69 13:12:39 ·9 −32:26:47 444 14 ·15 13869 9613:03:44 ·6 −35:40:23 382 15 ·78 14737 72 13:13:13 ·3 −36:43:06 382 15 ·90 31971 8813:03:48 ·0 −33:55:36 382 15 ·62 25475 184 13:13:21 ·9 −32:37:24 382 14 ·71 15284 8813:04:03 ·2 −36:42:55 382 15 ·92 15011 215 13:13:34 ·6 −35:00:24 382 15 ·81 11473 9813:04:08 ·4 −37:06:37 382 15 ·65 14058 47 13:13:37 ·9 −32:35:56 382 15 ·92 14428 8613:04:32 ·6 −35:51:35 382 14 ·53 15099 75 13:13:40 ·5 −37:12:41 382 15 ·45 14637 2313:04:46 ·9 −32:34:17 382 14 ·24 15419 132 13:13:54 ·9 −32:59:57 382 15 ·08 14315 9813:04:49 ·9 −34:09:57 382 15 ·97 18872 37 13:13:59 ·8 −35:31:47 382 15 ·80 32384 10213:04:56 ·2 −37:19:11 382 15 ·31 15024 60 13:14:30 ·4 −31:33:07 444 15 ·97 14998 12613:05:12 ·2 −37:06:25 382 15 ·48 13228 117 13:14:35 ·9 −33:11:02 382 14 ·26 15334 4813:05:19 ·9 −33:00:31 382 15 ·64 10171 150 13:14:37 ·9 −33:39:08 382 14 ·86 15224 7313:05:20 ·7 −34:03:32 382 15 ·69 15174 163 13:14:44 ·4 −31:20:39 444 15 ·83 15632 17613:05:23 ·1 −35:56:31 382 15 ·87 15763 139 13:15:00 ·6 −32:57:45 382 15 ·93 25689 6413:05:40 ·8 −34:09:29 382 15 ·19 15067 78 13:15:08 ·7 −37:10:05 382 14 ·68 7330 6613:06:10 ·3 −37:15:19 382 15 ·90 14312 81 13:15:17 ·0 −35:32:43 382 14 ·98 3265 9413:06:34 ·7 −34:29:38 382 15 ·21 13201 76 13:15:18 ·1 −29:53:31 444 15 ·34 9769 7313:06:47 ·3 −34:25:01 382 15 ·91 18578 77 13:15:18 ·6 −36:43:14 382 15 ·30 14921 2813:06:55 ·9 −35:20:35 382 15 ·40 28284 52 13:15:21 ·3 −31:45:59 444 14 ·64 4358 11413:07:07 ·2 −36:52:20 382 15 ·96 14350 61 13:15:29 ·4 −37:02:54 382 15 ·06 15014 6313:07:29 ·6 −32:36:43 382 14 ·51 9507 81 13:15:38 ·5 −33:02:17 382 14 ·33 4342 5113:07:34 ·8 −34:20:49 382 15 ·77 27522 60 13:16:06 ·6 −33:09:45 382 15 ·55 13407 4713:07:48 ·3 −37:02:06 382 14 ·28 14555 42 13:16:07 ·8 −31:33:17 444 14 ·20 15641 10313:08:01 ·8 −33:42:02 382 15 ·72 15113 95 13:16:17 ·3 −36:58:20 382 14 ·91 14311 8613:08:19 ·8 −32:43:36 382 15 ·87 43801 44 13:16:31 ·5 −33:02:46 382 15 ·99 15047 6913:08:20 ·1 −32:49:07 382 14 ·39 15899 84 13:16:38 ·9 −33:05:31 382 15 ·94 14960 7013:08:25 ·4 −36:24:37 382 15 ·11 3363 89 13:16:38 ·9 −33:05:31 382 14 ·48 1247 2813:08:27 ·2 −33:49:39 382 15 ·72 14837 25 13:16:40 ·8 −33:15:18 382 14 ·33 14981 9813:09:01 ·9 −34:02:24 382 15 ·82 27235 66 13:16:41 ·2 −33:39:11 382 15 ·17 8432 3713:09:07 ·1 −35:47:53 382 14 ·24 10491 54 13:16:49 ·5 −36:42:34 382 15 ·76 11687 6613:09:15 ·4 −37:11:40 382 15 ·59 13069 119 13:17:08 ·9 −34:02:03 382 15 ·43 23525 11013:09:19 ·3 −34:19:50 382 14 ·92 3196 80 13:17:24 ·0 −34:50:33 382 15 ·64 13924 12113:09:34 ·3 −35:04:41 382 15 ·83 23360 77 13:17:28 ·8 −36:49:52 382 15 ·16 2359 4713:09:35 ·1 −37:04:57 382 15 ·96 10414 81 13:17:38 ·4 −34:04:01 382 15 ·70 15106 14513:09:39 ·0 −33:45:40 382 15 ·55 13063 141 13:17:47 ·5 −33:52:14 382 15 ·72 23532 6913:09:53 ·9 −33:06:23 382 15 ·75 23141 79 13:17:53 ·0 −34:40:14 382 15 ·73 15393 8613:09:55 ·1 −35:59:01 382 15 ·04 14386 63 13:18:05 ·5 −37:00:34 382 15 ·90 15980 7813:10:13 ·6 −34:30:54 382 15 ·60 15159 154 13:18:06 ·6 −27:47:20 444 15 ·97 15326 12213:10:31 ·9 −32:40:51 382 15 ·75 29991 72 13:18:15 ·6 −32:47:18 382 15 ·23 15768 6413:10:47 ·9 −33:06:26 382 15 ·99 29645 117 13:18:16 ·1 −35:20:17 382 15 ·47 15654 85
116 M. J. Drinkwater et al.
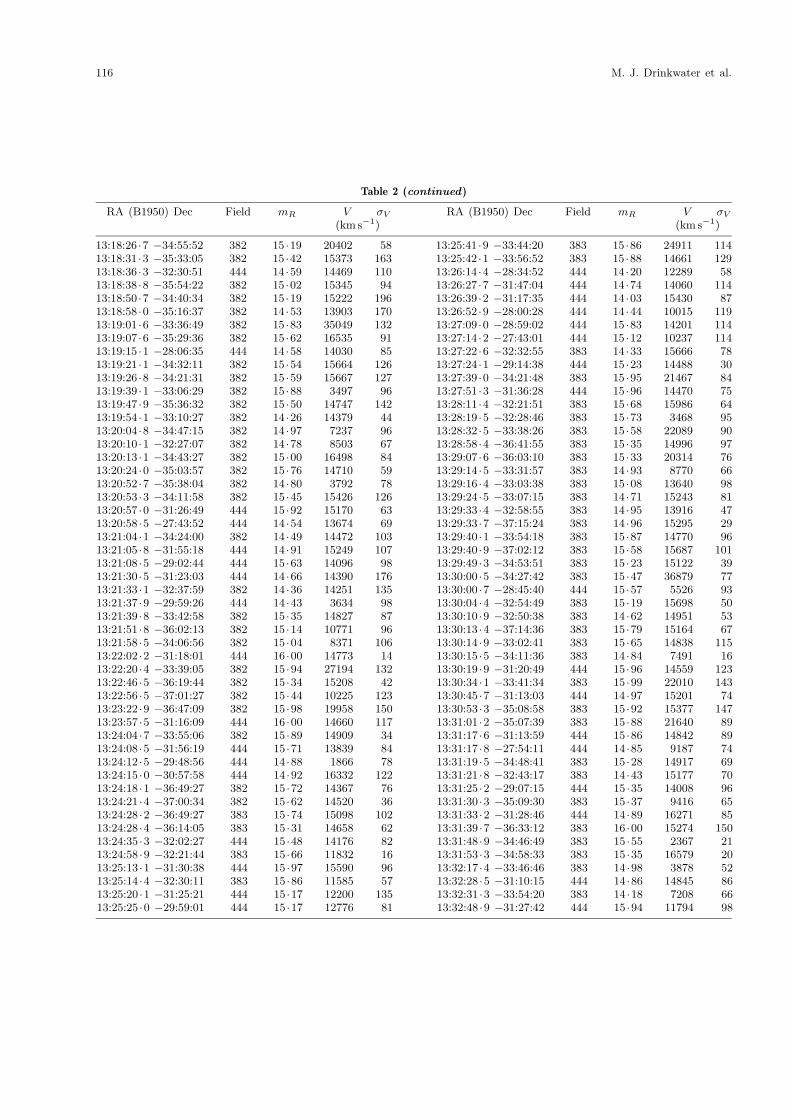
Table 2 (continued)
RA (B1950) Dec Field mR V σV RA (B1950) Dec Field mR V σV(km s−1) (km s−1)
13:18:26 ·7 −34:55:52 382 15 ·19 20402 58 13:25:41 ·9 −33:44:20 383 15 ·86 24911 11413:18:31 ·3 −35:33:05 382 15 ·42 15373 163 13:25:42 ·1 −33:56:52 383 15 ·88 14661 12913:18:36 ·3 −32:30:51 444 14 ·59 14469 110 13:26:14 ·4 −28:34:52 444 14 ·20 12289 5813:18:38 ·8 −35:54:22 382 15 ·02 15345 94 13:26:27 ·7 −31:47:04 444 14 ·74 14060 11413:18:50 ·7 −34:40:34 382 15 ·19 15222 196 13:26:39 ·2 −31:17:35 444 14 ·03 15430 8713:18:58 ·0 −35:16:37 382 14 ·53 13903 170 13:26:52 ·9 −28:00:28 444 14 ·44 10015 11913:19:01 ·6 −33:36:49 382 15 ·83 35049 132 13:27:09 ·0 −28:59:02 444 15 ·83 14201 11413:19:07 ·6 −35:29:36 382 15 ·62 16535 91 13:27:14 ·2 −27:43:01 444 15 ·12 10237 11413:19:15 ·1 −28:06:35 444 14 ·58 14030 85 13:27:22 ·6 −32:32:55 383 14 ·33 15666 7813:19:21 ·1 −34:32:11 382 15 ·54 15664 126 13:27:24 ·1 −29:14:38 444 15 ·23 14488 3013:19:26 ·8 −34:21:31 382 15 ·59 15667 127 13:27:39 ·0 −34:21:48 383 15 ·95 21467 8413:19:39 ·1 −33:06:29 382 15 ·88 3497 96 13:27:51 ·3 −31:36:28 444 15 ·96 14470 7513:19:47 ·9 −35:36:32 382 15 ·50 14747 142 13:28:11 ·4 −32:21:51 383 15 ·68 15986 6413:19:54 ·1 −33:10:27 382 14 ·26 14379 44 13:28:19 ·5 −32:28:46 383 15 ·73 3468 9513:20:04 ·8 −34:47:15 382 14 ·97 7237 96 13:28:32 ·5 −33:38:26 383 15 ·58 22089 9013:20:10 ·1 −32:27:07 382 14 ·78 8503 67 13:28:58 ·4 −36:41:55 383 15 ·35 14996 9713:20:13 ·1 −34:43:27 382 15 ·00 16498 84 13:29:07 ·6 −36:03:10 383 15 ·33 20314 7613:20:24 ·0 −35:03:57 382 15 ·76 14710 59 13:29:14 ·5 −33:31:57 383 14 ·93 8770 6613:20:52 ·7 −35:38:04 382 14 ·80 3792 78 13:29:16 ·4 −33:03:38 383 15 ·08 13640 9813:20:53 ·3 −34:11:58 382 15 ·45 15426 126 13:29:24 ·5 −33:07:15 383 14 ·71 15243 8113:20:57 ·0 −31:26:49 444 15 ·92 15170 63 13:29:33 ·4 −32:58:55 383 14 ·95 13916 4713:20:58 ·5 −27:43:52 444 14 ·54 13674 69 13:29:33 ·7 −37:15:24 383 14 ·96 15295 2913:21:04 ·1 −34:24:00 382 14 ·49 14472 103 13:29:40 ·1 −33:54:18 383 15 ·87 14770 9613:21:05 ·8 −31:55:18 444 14 ·91 15249 107 13:29:40 ·9 −37:02:12 383 15 ·58 15687 10113:21:08 ·5 −29:02:44 444 15 ·63 14096 98 13:29:49 ·3 −34:53:51 383 15 ·23 15122 3913:21:30 ·5 −31:23:03 444 14 ·66 14390 176 13:30:00 ·5 −34:27:42 383 15 ·47 36879 7713:21:33 ·1 −32:37:59 382 14 ·36 14251 135 13:30:00 ·7 −28:45:40 444 15 ·57 5526 9313:21:37 ·9 −29:59:26 444 14 ·43 3634 98 13:30:04 ·4 −32:54:49 383 15 ·19 15698 5013:21:39 ·8 −33:42:58 382 15 ·35 14827 87 13:30:10 ·9 −32:50:38 383 14 ·62 14951 5313:21:51 ·8 −36:02:13 382 15 ·14 10771 96 13:30:13 ·4 −37:14:36 383 15 ·79 15164 6713:21:58 ·5 −34:06:56 382 15 ·04 8371 106 13:30:14 ·9 −33:02:41 383 15 ·65 14838 11513:22:02 ·2 −31:18:01 444 16 ·00 14773 14 13:30:15 ·5 −34:11:36 383 14 ·84 7491 1613:22:20 ·4 −33:39:05 382 15 ·94 27194 132 13:30:19 ·9 −31:20:49 444 15 ·96 14559 12313:22:46 ·5 −36:19:44 382 15 ·34 15208 42 13:30:34 ·1 −33:41:34 383 15 ·99 22010 14313:22:56 ·5 −37:01:27 382 15 ·44 10225 123 13:30:45 ·7 −31:13:03 444 14 ·97 15201 7413:23:22 ·9 −36:47:09 382 15 ·98 19958 150 13:30:53 ·3 −35:08:58 383 15 ·92 15377 14713:23:57 ·5 −31:16:09 444 16 ·00 14660 117 13:31:01 ·2 −35:07:39 383 15 ·88 21640 8913:24:04 ·7 −33:55:06 382 15 ·89 14909 34 13:31:17 ·6 −31:13:59 444 15 ·86 14842 8913:24:08 ·5 −31:56:19 444 15 ·71 13839 84 13:31:17 ·8 −27:54:11 444 14 ·85 9187 7413:24:12 ·5 −29:48:56 444 14 ·88 1866 78 13:31:19 ·5 −34:48:41 383 15 ·28 14917 6913:24:15 ·0 −30:57:58 444 14 ·92 16332 122 13:31:21 ·8 −32:43:17 383 14 ·43 15177 7013:24:18 ·1 −36:49:27 382 15 ·72 14367 76 13:31:25 ·2 −29:07:15 444 15 ·35 14008 9613:24:21 ·4 −37:00:34 382 15 ·62 14520 36 13:31:30 ·3 −35:09:30 383 15 ·37 9416 6513:24:28 ·2 −36:49:27 383 15 ·74 15098 102 13:31:33 ·2 −31:28:46 444 14 ·89 16271 8513:24:28 ·4 −36:14:05 383 15 ·31 14658 62 13:31:39 ·7 −36:33:12 383 16 ·00 15274 15013:24:35 ·3 −32:02:27 444 15 ·48 14176 82 13:31:48 ·9 −34:46:49 383 15 ·55 2367 2113:24:58 ·9 −32:21:44 383 15 ·66 11832 16 13:31:53 ·3 −34:58:33 383 15 ·35 16579 2013:25:13 ·1 −31:30:38 444 15 ·97 15590 96 13:32:17 ·4 −33:46:46 383 14 ·98 3878 5213:25:14 ·4 −32:30:11 383 15 ·86 11585 57 13:32:28 ·5 −31:10:15 444 14 ·86 14845 8613:25:20 ·1 −31:25:21 444 15 ·17 12200 135 13:32:31 ·3 −33:54:20 383 14 ·18 7208 6613:25:25 ·0 −29:59:01 444 15 ·17 12776 81 13:32:48 ·9 −31:27:42 444 15 ·94 11794 98
New Structure in Shapley Supercluster 117
Table 2 (continued)
RA (B1950) Dec Field mR V σV RA (B1950) Dec Field mR V σV(km s−1) (km s−1)
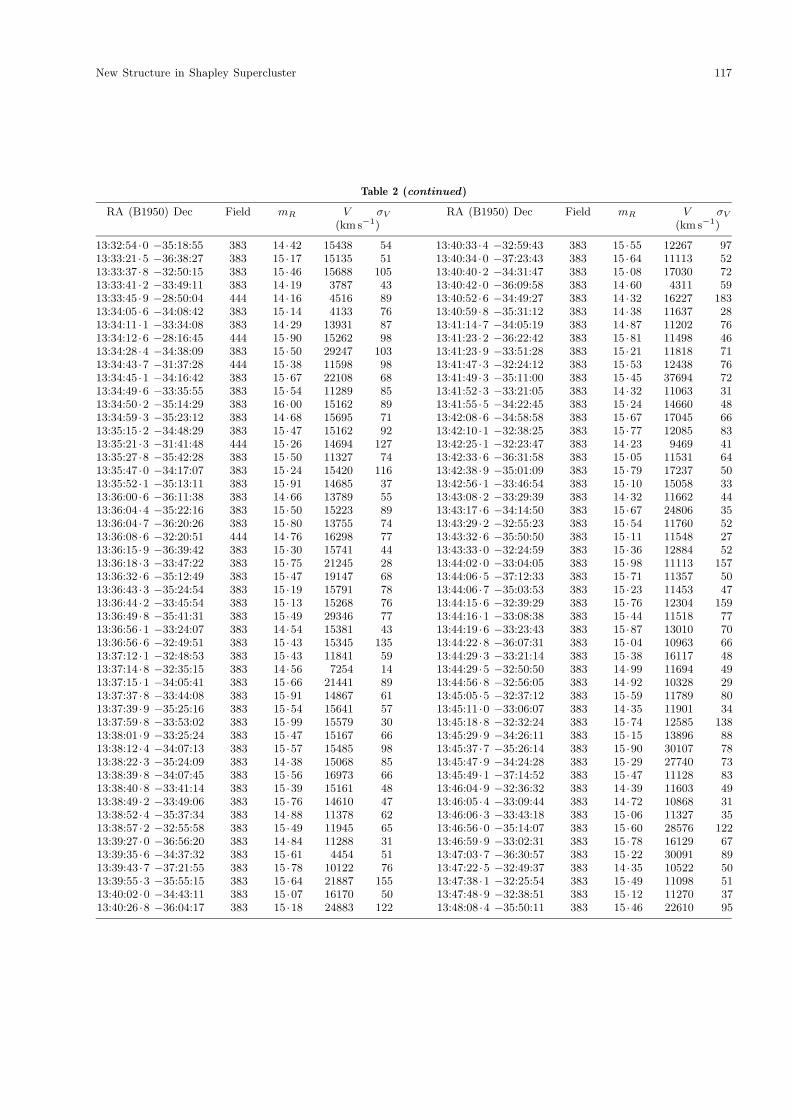
13:32:54 ·0 −35:18:55 383 14 ·42 15438 54 13:40:33 ·4 −32:59:43 383 15 ·55 12267 9713:33:21 ·5 −36:38:27 383 15 ·17 15135 51 13:40:34 ·0 −37:23:43 383 15 ·64 11113 5213:33:37 ·8 −32:50:15 383 15 ·46 15688 105 13:40:40 ·2 −34:31:47 383 15 ·08 17030 7213:33:41 ·2 −33:49:11 383 14 ·19 3787 43 13:40:42 ·0 −36:09:58 383 14 ·60 4311 5913:33:45 ·9 −28:50:04 444 14 ·16 4516 89 13:40:52 ·6 −34:49:27 383 14 ·32 16227 18313:34:05 ·6 −34:08:42 383 15 ·14 4133 76 13:40:59 ·8 −35:31:12 383 14 ·38 11637 2813:34:11 ·1 −33:34:08 383 14 ·29 13931 87 13:41:14 ·7 −34:05:19 383 14 ·87 11202 7613:34:12 ·6 −28:16:45 444 15 ·90 15262 98 13:41:23 ·2 −36:22:42 383 15 ·81 11498 4613:34:28 ·4 −34:38:09 383 15 ·50 29247 103 13:41:23 ·9 −33:51:28 383 15 ·21 11818 7113:34:43 ·7 −31:37:28 444 15 ·38 11598 98 13:41:47 ·3 −32:24:12 383 15 ·53 12438 7613:34:45 ·1 −34:16:42 383 15 ·67 22108 68 13:41:49 ·3 −35:11:00 383 15 ·45 37694 7213:34:49 ·6 −33:35:55 383 15 ·54 11289 85 13:41:52 ·3 −33:21:05 383 14 ·32 11063 3113:34:50 ·2 −35:14:29 383 16 ·00 15162 89 13:41:55 ·5 −34:22:45 383 15 ·24 14660 4813:34:59 ·3 −35:23:12 383 14 ·68 15695 71 13:42:08 ·6 −34:58:58 383 15 ·67 17045 6613:35:15 ·2 −34:48:29 383 15 ·47 15162 92 13:42:10 ·1 −32:38:25 383 15 ·77 12085 8313:35:21 ·3 −31:41:48 444 15 ·26 14694 127 13:42:25 ·1 −32:23:47 383 14 ·23 9469 4113:35:27 ·8 −35:42:28 383 15 ·50 11327 74 13:42:33 ·6 −36:31:58 383 15 ·05 11531 6413:35:47 ·0 −34:17:07 383 15 ·24 15420 116 13:42:38 ·9 −35:01:09 383 15 ·79 17237 5013:35:52 ·1 −35:13:11 383 15 ·91 14685 37 13:42:56 ·1 −33:46:54 383 15 ·10 15058 3313:36:00 ·6 −36:11:38 383 14 ·66 13789 55 13:43:08 ·2 −33:29:39 383 14 ·32 11662 4413:36:04 ·4 −35:22:16 383 15 ·50 15223 89 13:43:17 ·6 −34:14:50 383 15 ·67 24806 3513:36:04 ·7 −36:20:26 383 15 ·80 13755 74 13:43:29 ·2 −32:55:23 383 15 ·54 11760 5213:36:08 ·6 −32:20:51 444 14 ·76 16298 77 13:43:32 ·6 −35:50:50 383 15 ·11 11548 2713:36:15 ·9 −36:39:42 383 15 ·30 15741 44 13:43:33 ·0 −32:24:59 383 15 ·36 12884 5213:36:18 ·3 −33:47:22 383 15 ·75 21245 28 13:44:02 ·0 −33:04:05 383 15 ·98 11113 15713:36:32 ·6 −35:12:49 383 15 ·47 19147 68 13:44:06 ·5 −37:12:33 383 15 ·71 11357 5013:36:43 ·3 −35:24:54 383 15 ·19 15791 78 13:44:06 ·7 −35:03:53 383 15 ·23 11453 4713:36:44 ·2 −33:45:54 383 15 ·13 15268 76 13:44:15 ·6 −32:39:29 383 15 ·76 12304 15913:36:49 ·8 −35:41:31 383 15 ·49 29346 77 13:44:16 ·1 −33:08:38 383 15 ·44 11518 7713:36:56 ·1 −33:24:07 383 14 ·54 15381 43 13:44:19 ·6 −33:23:43 383 15 ·87 13010 7013:36:56 ·6 −32:49:51 383 15 ·43 15345 135 13:44:22 ·8 −36:07:31 383 15 ·04 10963 6613:37:12 ·1 −32:48:53 383 15 ·43 11841 59 13:44:29 ·3 −33:21:14 383 15 ·38 16117 4813:37:14 ·8 −32:35:15 383 14 ·56 7254 14 13:44:29 ·5 −32:50:50 383 14 ·99 11694 4913:37:15 ·1 −34:05:41 383 15 ·66 21441 89 13:44:56 ·8 −32:56:05 383 14 ·92 10328 2913:37:37 ·8 −33:44:08 383 15 ·91 14867 61 13:45:05 ·5 −32:37:12 383 15 ·59 11789 8013:37:39 ·9 −35:25:16 383 15 ·54 15641 57 13:45:11 ·0 −33:06:07 383 14 ·35 11901 3413:37:59 ·8 −33:53:02 383 15 ·99 15579 30 13:45:18 ·8 −32:32:24 383 15 ·74 12585 13813:38:01 ·9 −33:25:24 383 15 ·47 15167 66 13:45:29 ·9 −34:26:11 383 15 ·15 13896 8813:38:12 ·4 −34:07:13 383 15 ·57 15485 98 13:45:37 ·7 −35:26:14 383 15 ·90 30107 7813:38:22 ·3 −35:24:09 383 14 ·38 15068 85 13:45:47 ·9 −34:24:28 383 15 ·29 27740 7313:38:39 ·8 −34:07:45 383 15 ·56 16973 66 13:45:49 ·1 −37:14:52 383 15 ·47 11128 8313:38:40 ·8 −33:41:14 383 15 ·39 15161 48 13:46:04 ·9 −32:36:32 383 14 ·39 11603 4913:38:49 ·2 −33:49:06 383 15 ·76 14610 47 13:46:05 ·4 −33:09:44 383 14 ·72 10868 3113:38:52 ·4 −35:37:34 383 14 ·88 11378 62 13:46:06 ·3 −33:43:18 383 15 ·06 11327 3513:38:57 ·2 −32:55:58 383 15 ·49 11945 65 13:46:56 ·0 −35:14:07 383 15 ·60 28576 12213:39:27 ·0 −36:56:20 383 14 ·84 11288 31 13:46:59 ·9 −33:02:31 383 15 ·78 16129 6713:39:35 ·6 −34:37:32 383 15 ·61 4454 51 13:47:03 ·7 −36:30:57 383 15 ·22 30091 8913:39:43 ·7 −37:21:55 383 15 ·78 10122 76 13:47:22 ·5 −32:49:37 383 14 ·35 10522 5013:39:55 ·3 −35:55:15 383 15 ·64 21887 155 13:47:38 ·1 −32:25:54 383 15 ·49 11098 5113:40:02 ·0 −34:43:11 383 15 ·07 16170 50 13:47:48 ·9 −32:38:51 383 15 ·12 11270 3713:40:26 ·8 −36:04:17 383 15 ·18 24883 122 13:48:08 ·4 −35:50:11 383 15 ·46 22610 95
118 M. J. Drinkwater et al.
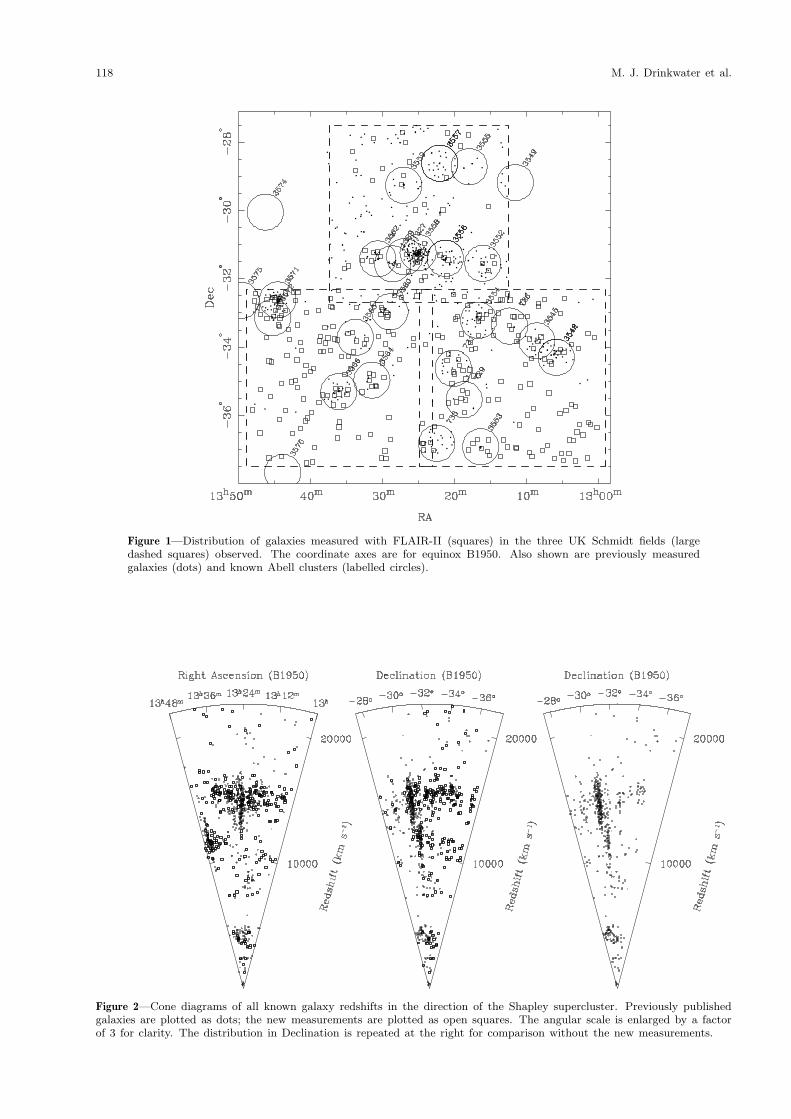
Figure 1—Distribution of galaxies measured with FLAIR-II (squares) in the three UK Schmidt fields (largedashed squares) observed. The coordinate axes are for equinox B1950. Also shown are previously measuredgalaxies (dots) and known Abell clusters (labelled circles).
Figure 2—Cone diagrams of all known galaxy redshifts in the direction of the Shapley supercluster. Previously publishedgalaxies are plotted as dots; the new measurements are plotted as open squares. The angular scale is enlarged by a factorof 3 for clarity. The distribution in Declination is repeated at the right for comparison without the new measurements.
New Structure in Shapley Supercluster 119
Redshifts were measured for absorption-featuredspectra using the cross-correlation task XCSAO inRVSAO. We decided to adopt as the absorptionvelocity the one associated with the minimum errorfrom the cross-correlation against the templates.In the great majority of cases, this coincided alsowith the maximum R parameter of Tonry & Davis(1979). The redshifts for the emission-line objectswere determined using the EMSAO task in RVSAO.EMSAO finds emission lines automatically, computesredshifts for each identified line and combines theminto a single radial velocity with error. Spectrashowing both absorption and emission features weregenerally measured with the two tasks XCSAO andEMSAO and the result with the lower error used.In two spectra with very poor signal (13:05:19 ·9,−33:00:31 and 13:23:22 ·9, −36:47:09) the emissionlines were measured manually and a conservativeerror of 150 km s−1 assigned. We measured velocitiessuccessfully for 306 galaxies in the sample; theseare presented in Table 2.
We have compared the distributions of the galaxieswe measured to the input samples to check that theyare fair samples. There is no significant differencein the distributions of the coordinates, but thereis a small difference in the magnitude distributionsin the sense that the measured sample does nothave as many of the faintest galaxies as the inputsample. This is to be expected, as these wouldhave the lowest signal in the FLAIR-II spectra,but this should not affect our study of the spatialdistribution significantly.
3 Results
Previous studies of the SSC have covered a very largeregion of sky, but we will limit our analysis in thispaper to the region of sky we observed with FLAIR-II: the three UK Schmidt fields in Table 1. In somecases we will further restrict our analysis to the twosouthern fields F382 and F383, where our observationswere much more complete. The distribution of thesefields and the galaxies we observed is shown in Figure1. We also show any previously observed galaxiesand the known Abell clusters.
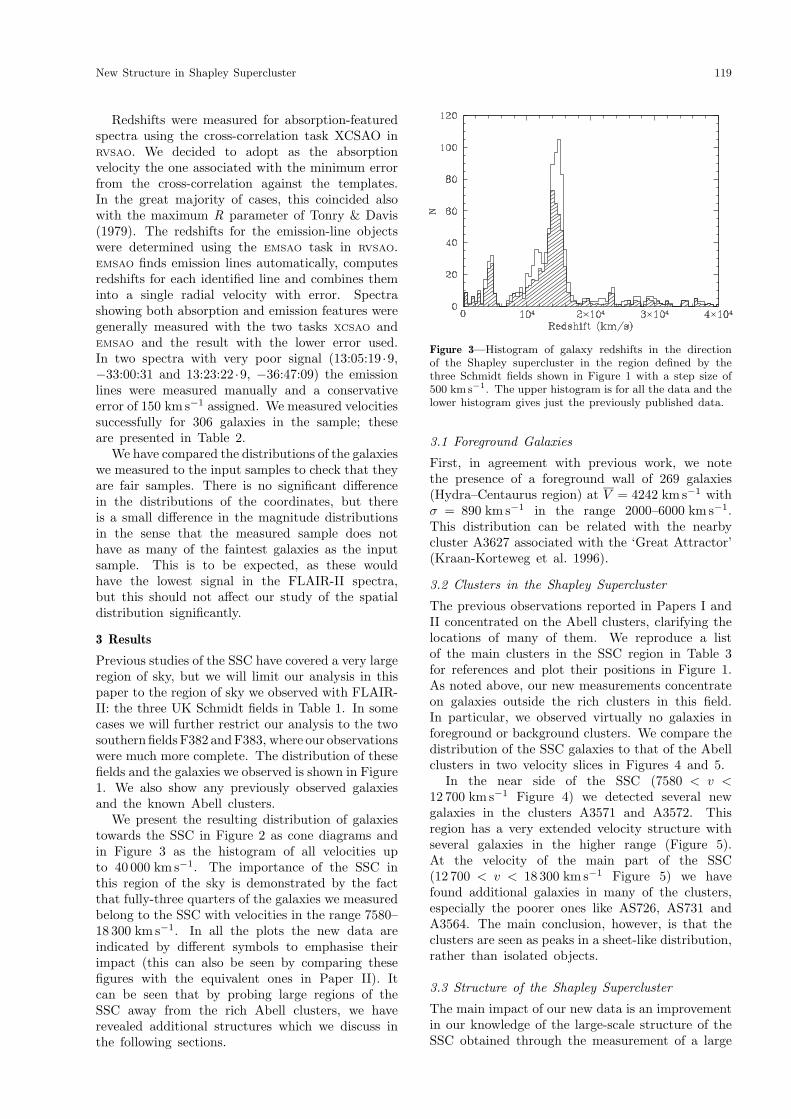
We present the resulting distribution of galaxiestowards the SSC in Figure 2 as cone diagrams andin Figure 3 as the histogram of all velocities upto 40 000 km s−1. The importance of the SSC inthis region of the sky is demonstrated by the factthat fully-three quarters of the galaxies we measuredbelong to the SSC with velocities in the range 7580–18 300 km s−1. In all the plots the new data areindicated by different symbols to emphasise theirimpact (this can also be seen by comparing thesefigures with the equivalent ones in Paper II). Itcan be seen that by probing large regions of theSSC away from the rich Abell clusters, we haverevealed additional structures which we discuss inthe following sections.
Figure 3—Histogram of galaxy redshifts in the directionof the Shapley supercluster in the region defined by thethree Schmidt fields shown in Figure 1 with a step size of500 km s−1. The upper histogram is for all the data and thelower histogram gives just the previously published data.
3.1 Foreground Galaxies
First, in agreement with previous work, we notethe presence of a foreground wall of 269 galaxies(Hydra–Centaurus region) at V = 4242 km s−1 withσ = 890 km s−1 in the range 2000–6000 km s−1.This distribution can be related with the nearbycluster A3627 associated with the ‘Great Attractor’(Kraan-Korteweg et al. 1996).
3.2 Clusters in the Shapley Supercluster
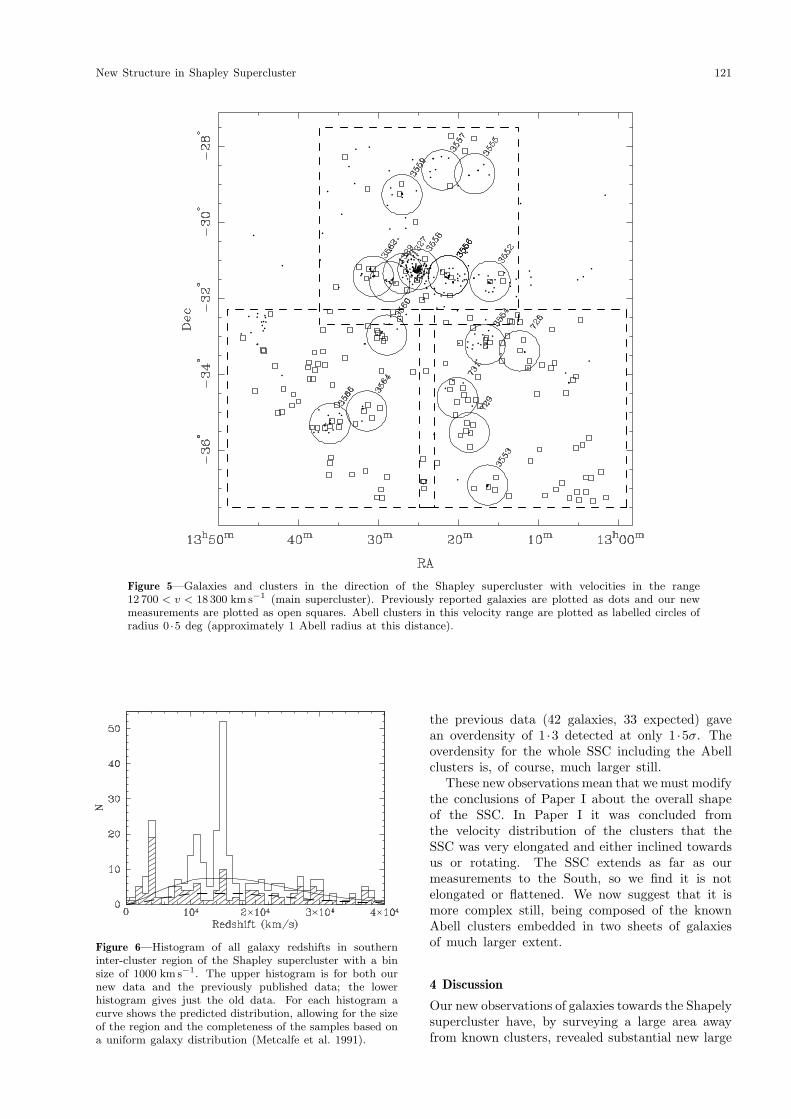
The previous observations reported in Papers I andII concentrated on the Abell clusters, clarifying thelocations of many of them. We reproduce a listof the main clusters in the SSC region in Table 3for references and plot their positions in Figure 1.As noted above, our new measurements concentrateon galaxies outside the rich clusters in this field.In particular, we observed virtually no galaxies inforeground or background clusters. We compare thedistribution of the SSC galaxies to that of the Abellclusters in two velocity slices in Figures 4 and 5.
In the near side of the SSC (7580 < v <12 700 km s−1 Figure 4) we detected several newgalaxies in the clusters A3571 and A3572. Thisregion has a very extended velocity structure withseveral galaxies in the higher range (Figure 5).At the velocity of the main part of the SSC(12 700 < v < 18 300 km s−1 Figure 5) we havefound additional galaxies in many of the clusters,especially the poorer ones like AS726, AS731 andA3564. The main conclusion, however, is that theclusters are seen as peaks in a sheet-like distribution,rather than isolated objects.
3.3 Structure of the Shapley Supercluster
The main impact of our new data is an improvementin our knowledge of the large-scale structure of theSSC obtained through the measurement of a large

120 M. J. Drinkwater et al.
Figure 4—Galaxies and clusters in the direction of the Shapley supercluster with velocities in the range7580 < v < 12 700 km s−1 (near side of the main supercluster). Previously reported galaxies are plotted as dotsand our new measurements are plotted as open squares. Abell clusters in this velocity range are plotted aslabelled circles of radius 0 ·5 deg (approximately 1 Abell radius at this distance).
number of galaxies away from the rich Abell clusterspreviously studied. The majority of the galaxieswe observed were part of the SSC, so our principalresult is that the SSC is bigger than previouslythought, with an additional 230 galaxies in thevelocity range 7580 < v < 18 300 km s−1 comparedto 492 previously known in our survey area.
Looking at the cone diagrams (Figure 2) andthe velocity histogram (Figure 3) our first newobservation is that the SSC is clearly separatedinto two components in velocity space, the nearerone at v = 10 800 kms−1 (σv = 1300 km s−1) to theEast of the main concentration at v = 14 920 km s−1
(σv = 1100 km s−1). The two regions contain 200and 522 galaxies respectively. Some evidence forthis separation was noted in the velocity distributionin Paper II, but it is much clearer our new data.
Secondly, it can be see from the Declination conediagram in Figure 2 as well as the sky plots inFigures 4 and 5 that the southern part of the SSCconsists of two large sheets of galaxies, of whichthe previously measured Abell clusters represent thepeaks of maximum density.
To consider the significance of this extendeddistribution of galaxies, it is helpful to define an
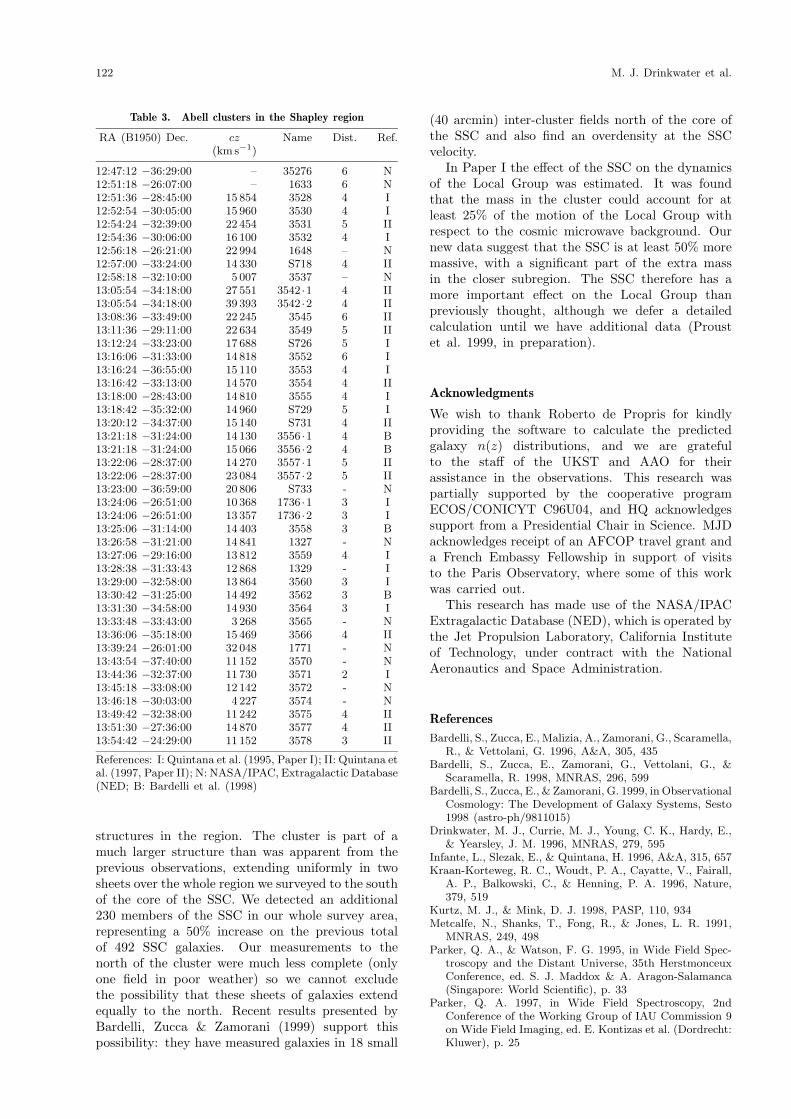
inter-cluster sample consisting of galaxies in thesouthern fields (F382 and F383) outside the knownAbell clusters in the SSC velocity range. Weeliminated all galaxies within a 0 ·5 degree radius(about 1 Abell radius) of all the clusters shownin Figures 4 and 5. Very few of the previouslymeasured galaxies remain in the sample. In Figure6 we plot a histogram of the galaxy velocities in thisinter-cluster sample compared to the predicted n(z)distribution of galaxies. The predicted distributionwas based on the number counts of Metcalfe et al.(1991), normalised to the area of the southern sampleafter removing clusters (44 deg2) and corrected forcompleteness (304 out of a possible 1194 galaxiesmeasured in total). We also show the histogram(shaded) and predictions (dashed) for the previouslymeasured galaxies in the same field (128 out of apossible 1194). The histogram shows that even forthe inter-cluster galaxies there is a large overdensityin the SSC region (7500 < cz < 18 500 km s−1):we measure 161 galaxies compared to 74 expected.This is an overdensity of 2 ·0± 0 ·2 detected at the10 sigma level. This is averaged over the wholeSSC velocity range; the overdensity in individual1000 km s−1 bins peaks at about 7. By comparison
New Structure in Shapley Supercluster 121
Figure 5—Galaxies and clusters in the direction of the Shapley supercluster with velocities in the range12 700 < v < 18 300 km s−1 (main supercluster). Previously reported galaxies are plotted as dots and our newmeasurements are plotted as open squares. Abell clusters in this velocity range are plotted as labelled circles ofradius 0 ·5 deg (approximately 1 Abell radius at this distance).
Figure 6—Histogram of all galaxy redshifts in southerninter-cluster region of the Shapley supercluster with a binsize of 1000 km s−1. The upper histogram is for both ournew data and the previously published data; the lowerhistogram gives just the old data. For each histogram acurve shows the predicted distribution, allowing for the sizeof the region and the completeness of the samples based ona uniform galaxy distribution (Metcalfe et al. 1991).
the previous data (42 galaxies, 33 expected) gavean overdensity of 1 ·3 detected at only 1 ·5σ. Theoverdensity for the whole SSC including the Abellclusters is, of course, much larger still.
These new observations mean that we must modifythe conclusions of Paper I about the overall shapeof the SSC. In Paper I it was concluded fromthe velocity distribution of the clusters that theSSC was very elongated and either inclined towardsus or rotating. The SSC extends as far as ourmeasurements to the South, so we find it is notelongated or flattened. We now suggest that it ismore complex still, being composed of the knownAbell clusters embedded in two sheets of galaxiesof much larger extent.
4 Discussion
Our new observations of galaxies towards the Shapelysupercluster have, by surveying a large area awayfrom known clusters, revealed substantial new large
122 M. J. Drinkwater et al.
Table 3. Abell clusters in the Shapley region
RA (B1950) Dec. cz Name Dist. Ref.(km s−1)
12:47:12 −36:29:00 – 35276 6 N12:51:18 −26:07:00 – 1633 6 N12:51:36 −28:45:00 15 854 3528 4 I12:52:54 −30:05:00 15 960 3530 4 I12:54:24 −32:39:00 22 454 3531 5 II12:54:36 −30:06:00 16 100 3532 4 I12:56:18 −26:21:00 22 994 1648 – N12:57:00 −33:24:00 14 330 S718 4 II12:58:18 −32:10:00 5 007 3537 – N13:05:54 −34:18:00 27 551 3542 ·1 4 II13:05:54 −34:18:00 39 393 3542 ·2 4 II13:08:36 −33:49:00 22 245 3545 6 II13:11:36 −29:11:00 22 634 3549 5 II13:12:24 −33:23:00 17 688 S726 5 I13:16:06 −31:33:00 14 818 3552 6 I13:16:24 −36:55:00 15 110 3553 4 I13:16:42 −33:13:00 14 570 3554 4 II13:18:00 −28:43:00 14 810 3555 4 I13:18:42 −35:32:00 14 960 S729 5 I13:20:12 −34:37:00 15 140 S731 4 II13:21:18 −31:24:00 14 130 3556 ·1 4 B13:21:18 −31:24:00 15 066 3556 ·2 4 B13:22:06 −28:37:00 14 270 3557 ·1 5 II13:22:06 −28:37:00 23 084 3557 ·2 5 II13:23:00 −36:59:00 20 806 S733 - N13:24:06 −26:51:00 10 368 1736 ·1 3 I13:24:06 −26:51:00 13 357 1736 ·2 3 I13:25:06 −31:14:00 14 403 3558 3 B13:26:58 −31:21:00 14 841 1327 - N13:27:06 −29:16:00 13 812 3559 4 I13:28:38 −31:33:43 12 868 1329 - I13:29:00 −32:58:00 13 864 3560 3 I13:30:42 −31:25:00 14 492 3562 3 B13:31:30 −34:58:00 14 930 3564 3 I13:33:48 −33:43:00 3 268 3565 - N13:36:06 −35:18:00 15 469 3566 4 II13:39:24 −26:01:00 32 048 1771 - N13:43:54 −37:40:00 11 152 3570 - N13:44:36 −32:37:00 11 730 3571 2 I13:45:18 −33:08:00 12 142 3572 - N13:46:18 −30:03:00 4 227 3574 - N13:49:42 −32:38:00 11 242 3575 4 II13:51:30 −27:36:00 14 870 3577 4 II13:54:42 −24:29:00 11 152 3578 3 II
References: I: Quintana et al. (1995, Paper I); II: Quintana etal. (1997, Paper II); N: NASA/IPAC, Extragalactic Database(NED; B: Bardelli et al. (1998)
structures in the region. The cluster is part of amuch larger structure than was apparent from theprevious observations, extending uniformly in twosheets over the whole region we surveyed to the southof the core of the SSC. We detected an additional230 members of the SSC in our whole survey area,representing a 50% increase on the previous totalof 492 SSC galaxies. Our measurements to thenorth of the cluster were much less complete (onlyone field in poor weather) so we cannot excludethe possibility that these sheets of galaxies extendequally to the north. Recent results presented byBardelli, Zucca & Zamorani (1999) support thispossibility: they have measured galaxies in 18 small
(40 arcmin) inter-cluster fields north of the core ofthe SSC and also find an overdensity at the SSCvelocity.
In Paper I the effect of the SSC on the dynamicsof the Local Group was estimated. It was foundthat the mass in the cluster could account for atleast 25% of the motion of the Local Group withrespect to the cosmic microwave background. Ournew data suggest that the SSC is at least 50% moremassive, with a significant part of the extra massin the closer subregion. The SSC therefore has amore important effect on the Local Group thanpreviously thought, although we defer a detailedcalculation until we have additional data (Proustet al. 1999, in preparation).
Acknowledgments
We wish to thank Roberto de Propris for kindlyproviding the software to calculate the predictedgalaxy n(z) distributions, and we are gratefulto the staff of the UKST and AAO for theirassistance in the observations. This research waspartially supported by the cooperative programECOS/CONICYT C96U04, and HQ acknowledgessupport from a Presidential Chair in Science. MJDacknowledges receipt of an AFCOP travel grant anda French Embassy Fellowship in support of visitsto the Paris Observatory, where some of this workwas carried out.
This research has made use of the NASA/IPACExtragalactic Database (NED), which is operated bythe Jet Propulsion Laboratory, California Instituteof Technology, under contract with the NationalAeronautics and Space Administration.
References
Bardelli, S., Zucca, E., Malizia, A., Zamorani, G., Scaramella,R., & Vettolani, G. 1996, A&A, 305, 435
Bardelli, S., Zucca, E., Zamorani, G., Vettolani, G., &Scaramella, R. 1998, MNRAS, 296, 599
Bardelli, S., Zucca, E., & Zamorani, G. 1999, in ObservationalCosmology: The Development of Galaxy Systems, Sesto1998 (astro-ph/9811015)
Drinkwater, M. J., Currie, M. J., Young, C. K., Hardy, E.,& Yearsley, J. M. 1996, MNRAS, 279, 595
Infante, L., Slezak, E., & Quintana, H. 1996, A&A, 315, 657Kraan-Korteweg, R. C., Woudt, P. A., Cayatte, V., Fairall,
A. P., Balkowski, C., & Henning, P. A. 1996, Nature,379, 519
Kurtz, M. J., & Mink, D. J. 1998, PASP, 110, 934Metcalfe, N., Shanks, T., Fong, R., & Jones, L. R. 1991,
MNRAS, 249, 498Parker, Q. A., & Watson, F. G. 1995, in Wide Field Spec-
troscopy and the Distant Universe, 35th HerstmonceuxConference, ed. S. J. Maddox & A. Aragon-Salamanca(Singapore: World Scientific), p. 33
Parker, Q. A. 1997, in Wide Field Spectroscopy, 2ndConference of the Working Group of IAU Commission 9on Wide Field Imaging, ed. E. Kontizas et al. (Dordrecht:Kluwer), p. 25

New Structure in Shapley Supercluster 123
Pierre, M., Bohringer, H., Ebeling, H., Voges, W., Schuecker,P., Cruddace, R., & MacGillivray, H. 1994, A&A, 290,725
Quintana, H., Ramirez, A., Melnick, J., Raychaudhury, S.,& Slezak, E. 1995, AJ, 110, 463 (Paper I)
Quintana, H., Melnick, J., Proust, D., & Infante, L. 1997,A&A Suppl, 125, 247 (Paper II)
Raychaudhury, S. 1989, Nature, 342, 251Scaramella, R., Baiesi-Pillastrini, G, Chincarini, G., Vet-
tolani, G., & Zamorani, G. 1989, Nature, 338, 562Tody, D. 1993, in Astronomical Data Analysis Software and
Systems II, ASP Conf. Ser., Vol. 52, ed. R. J. Hanischet al. (San Francisco: PASP), p. 173
Tonry, J., & Davis, M. 1979, AJ, 84, 1511
Related Documents