New Strategies to Improve the Expression of Recombinant Mammalian Proteins in Engineered Animal Cell Lines Von der Fakultät für Lebenswissenschaften der Technischen Universität Carolo‐Wilhelmina zu Braunschweig zur Erlangung des Grades einer Doktorin der Naturwissenschaften (Dr. rer. nat.) genehmigte Dissertation von Bahar Baser aus Gießen

Welcome message from author
This document is posted to help you gain knowledge. Please leave a comment to let me know what you think about it! Share it to your friends and learn new things together.
Transcript

New Strategies to Improve the Expression of Recombinant Mammalian Proteins in
Engineered Animal Cell Lines
Von der Fakultät für Lebenswissenschaften
der Technischen Universität Carolo‐Wilhelmina
zu Braunschweig
zur Erlangung des Grades
einer Doktorin der Naturwissenschaften
(Dr. rer. nat.)
genehmigte
D i s s e r t a t i o n
von Bahar Baser
aus Gießen

1. Referent: Prof. Dr. Wulf Blankenfeld
2. Referent: Prof. Dr. Stefan Dübel
eingereicht am: 02.03.2015
mündliche Prüfung (Disputation) am: 21.07.2015
Druckjahr 2015
Vorveröffentlichungen der Dissertation
Teilergebnisse aus dieser Arbeit wurden mit Genehmigung der Fakultät für
Lebenswissenschaften, vertreten durch den Mentor der Arbeit, in folgenden Beiträgen
vorab veröffentlicht:
Publikationen
Steffen Meyer, Carmen Lorenz, Bahar Baser, Mona Wördehoff, Volker Jäger, Joop van den
Heuvel (2013). Multi-Host Expression System for Recombinant Production of Challenging
Proteins. PLoS ONE 8(7): e68674.
Tagungsbeiträge und Seminarvorträge
Bahar Baser, Steffen Meyer, Sonja Wilke, Konrad Büssow and Joop van den Heuvel. New
Strategies to Improve the Expression of Recombinant Mammalian Proteins in Engineered
Animal Cell Lines, Progress Seminar, Braunschweig, Germany (2014)
Bahar Baser, Steffen Meyer, Sonja Wilke, Konrad Büssow and Joop van den Heuvel. New
Strategies to Improve the Expression of Recombinant Mammalian Proteins in Engineered
Animal Cell Lines, 4th Annual Retreat HZI Grad School, Goslar-Hahnenklee, Germany
(2013)
Bahar Baser, Steffen Meyer, Sonja Wilke, Konrad Büssow and Joop van den Heuvel. New
Strategies to Improve the Expression of Recombinant Mammalian Proteins in Engineered
Animal Cell Lines, 3ed Annual Retreat HZI Grad School, GSI Bad Bevensen, Germany (2012)
Bahar Baser, Steffen Meyer, Sonja Wilke, Konrad Büssow and Joop van den Heuvel. New
Strategies to Improve the Expression of Recombinant Mammalian Proteins in Engineered
Animal Cell Lines, Progress Seminar, Braunschweig, Germany (2012)
Posterbeiträge
Bahar Baser, Steffen Meyer, Sonja Wilke, Konrad Büssow and Joop van den Heuvel. New
Strategies to Improve the Expression of Recombinant Mammalian Proteins in Engineered
Animal Cell Lines, PEGS Europe 2013: Protein & Antibody Engineering Summit, Lisbon,
Portugal (2013)
Bahar Baser, Steffen Meyer, Sonja Wilke, Konrad Büssow and Joop van den Heuvel. New
Strategies to Improve the Expression of Recombinant Mammalian Proteins in Engineered
Animal Cell Lines, RPP7 – Laupheim , 7th Conference on Recombinant Protein Production,
Laupheim, Germany (2013) (1st Poster Award)
Bahar Baser, Steffen Meyer, Sonja Wilke, Konrad Büssow and Joop van den Heuvel. New
Strategies to Improve the Expression of Recombinant Mammalian Proteins in Engineered
Animal Cell Lines, 6th International PhD Symposium, Braunschweig, Germany (2013)
Bahar Baser, Steffen Meyer, Sonja Wilke, Konrad Büssow and Joop van den Heuvel. New
Strategies to Improve the Expression of Recombinant Mammalian Proteins in Engineered
Animal Cell Lines, 5th International PhD Symposium, Braunschweig, Germany (2011)
Bahar Baser, Steffen Meyer, Sonja Wilke, Konrad Büssow and Joop van den Heuvel.
Multi-Gene Expression of Recombinant Proteins in Engineered Cell Lines, 2nd Annual
Retreat HZI Grad School, Goslar-Hahnenklee, Germany (2011)
Bahar Baser, Steffen Meyer, Sonja Wilke, Konrad Büssow and Joop van den Heuvel. New
Strategies to Improve the Expression of Recombinant Mammalian Proteins in Engineered
Animal Cell Lines, 4th International PhD Symposium, Braunschweig, Germany (2010)
Content
I
Content
ABBREVIATIONS V
SYNOPSIS 1
1 INTRODUCTION 3
1.1 Recombinant protein expression 3
1.2 Glycosylation – friend or foe 4
1.3 Mammalian expression systems 6
1.3.1 Transient protein expression in HEK293 cell lines 7
1.3.2 Stable protein expression in CHO cell lines 9
1.4 Stable cell line development through targeted integration 12
1.4.1 Flp recombinase 14
1.4.2 Recombinase mediated cassette exchange (RMCE) 15
1.4.3 The use of FACS for stable cell line development 18
1.4.4 pFlp-Bac-to-Mam exchange vectors 18
1.5 Protein targets 20
1.5.1 Fluorescent proteins 20
1.5.2 Toll-like receptor (TLR) function 22
1.5.3 The hybrid LRR technique in TLR structural biology 24
1.5.4 TLR1 and TLR2 27
1.5.5 TLR5 28
1.5.6 Accessory proteins – GRP94 and PRAT4A 29
2 AIM OF THIS WORK 32
3 MATERIALS AND METHODS 33
3.1 Instruments 33
3.2 Chemicals, kits and reagents 33
3.2.1 Enzymes and molecular weight standards 33
3.2.2 Culture media and supplements 34
3.2.3 Transfection reagents 36
II
3.3 Oligonucleotides and plasmids 36
3.4 Bacterial strains and cell lines 42
3.4.1 Bacterial strains 42
3.4.2 Cell lines 42
3.5 Molecular biological methods 42
3.5.1 Polymerase chain reaction (PCR) 43
3.5.2 Agarose gel electrophoresis 44
3.5.3 DNA extraction 45
3.5.4 Digestion of DNA with restriction endonuclease 45
3.5.5 Ligation of DNA fragments 45
3.5.6 Preparation of electrocompetent cells 45
3.5.7 Transformation of competent bacteria 46
3.5.8 Bacterial pre-cultures 46
3.5.9 Glycerol stock 46
3.5.10 Plasmid preparation 47
3.5.11 Genomic DNA preparation 47
3.5.12 Photometric quantification of DNA and protein concentrations 47
3.6 Cell culture 48
3.6.1 Cell culture consumables 48
3.6.2 Maintaining cells in culture 48
3.6.3 Determination of cell number and viability 49
3.6.4 Cryopreservation 49
3.6.5 Revitalisation 49
3.6.6 Transfection of eukaryotic cells 50
3.6.7 Genomic tagging of CHO Lec3.2.8.1 cell lines for the generation of binary RMCE cell lines 50
3.6.8 Generation of producer cell lines by RMCE 51
3.6.9 Single cell cloning by serial dilution 51
3.6.10 Flow cytometry and preparative cell sorting 52
3.6.11 Resistance of SWI3_26 (CHO Lec3.2.8.1) cell line to antibiotics 52
3.7 Protein production and purification 53
3.7.1 Transient protein expression in HEK293-6E 53
3.7.2 Protein production in stable CHO Lec3.2.8.1 cell lines 53
3.7.3 Trichloroacetic acid (TCA) precipitation 55
Content
III
3.7.4 Cell lysis 55
3.7.5 Dialysis and diafiltration 55
3.7.6 Concentration of protein solutions with Vivaspin concentrators 56
3.7.7 Small scale purification of tagged proteins with magnetic beads 57
3.7.8 Affinity chromatography of tagged proteins 57
3.8 Protein analytical methods 59
3.8.1 SDS-PAGE 59
3.8.2 Native PAGE 60
3.8.3 Western blot 61
3.8.4 Fluorescent measurements with the Tecan MD 1000 plate reader 62
3.8.5 MALDI-TOF 63
3.9 Statistical methods 63
3.9.1 Standard deviation 63
3.9.2 Analysis of variance – ANOVA 64
4 RESULTS 65
4.1 Establishment of binary RMCE master cell lines 65
4.1.1 Resistance of the CHO Lec3.2.8.1 cell line SWI3_26 to antibiotics 65
4.1.2 Suitability of tdTomato as fluorescent marker 67
4.1.3 Cloning of tagging vector pEF-FS-tdTomato-dpuro 68
4.1.4 Generation of binary RMCE master cell lines 71
4.1.5 Determination of exchange cassette integrity in binary RMCE master cell lines via genomic PCR 74
4.1.6 Cloning of exchange vector pFlpBtM-II_F13-F14 76
4.2 Evaluation of (binary) RMCE master and producer cell lines expressing tdTomato 79
4.2.1 Genomic PCR of tdTomato expressing RMCE master and producer cell lines 80
4.2.2 Quantification of tdTomato expressing RMCE master and producer cell lines by fluorescence with the Tecan MD 1000 plate reader 82
4.2.3 Quantification and comparison of tdTomato expressing RMCE master and producer cell lines after affinity chromatography 85
4.2.4 Flowcytometric analysis of tdTomato expressing RMCE master and producer cell lines 87
4.2.5 Summary and conclusion – evaluation of tdTomato expressing RMCE master and producer cell lines 90

IV
4.3 mGRP94 and mPRAT4A 92
4.3.1 Cloning of mPRAT4A and mGRP94 into pFlpBtM-II_F13/F14 vector 92
4.3.2 Test expression of mPRAT4A and mGRP94 in HEK293-6E 94
4.3.3 Expression of mPRAT4A and mGRP94 in binary RMCE cell lines (CHO Lec3.2.8.1) 96
4.4 Toll-like receptors 98
4.4.1 Cloning of TLR constructs 98
4.4.2 CHO Lec3.2.8.1 TLR2 producer cell lines 102
4.4.3 CHO Lec3.2.8.1 TLR1 producer cell lines 108
4.4.4 CHO Lec3.2.8.1 TLR5 producer cell lines 111
4.4.5 Summary – expression and co-expression of TLR ECDs and chaperones 113
5 DISCUSSION 115
5.1 Stable cell line development 115
5.2 Generation of binary CHO Lec3.2.8.1 RMCE master and producer cell lines 116
5.3 Evaluation of binary RMCE cell lines expressing tdTomato 120
5.4 Expression of TLR ECD constructs 121
5.4.1 Expression of TLR2 ECD 121
5.4.2 Expression of TLR5 ECD 123
5.4.3 Expression of TLR1 ECD 124
5.4.4 Co-expression of TLR ECDs with molecular chaperones 125
6 OUTLOOK 127
7 BIBLIOGRAPHY 129
APPENDIX 145
A.1 Materials and Methods 145
A.2 Results 149
A.3 Protein Information 152
ACKNOWLEDGMENTS 155
CURRICULUM VITAE 156
Abbreviations
V
Abbreviations
ADP Adenosine diphosphate
Amp Ampicillin
AMPPNP Adenylyl-imidodiphosphate
ANOVA Analysis of variance
AP Alkaline phosphatase
Asn Asparagine
ATG Translation start codon
ATP Adenosintriphosphat
BCIP 5-Bromo-4-chloro-3-indoxyl phosphate
BD Becton Dickinson
BEVS Baculovirus expression vector system
BFP Blue fluorecent protein
BHK Baby hamster kidney
bp Base pair
BSA Bovine serum albumin
CaPi Calcium phosphate
CBD Client binding domain
CDG Congenital disorders of glycosylation
CFP Cyan fluorecent protein
CHO Chinese hamster ovary
CNPY3 Canopy FGF signalling regulator 3
CMV Cytomegalovirus
CpG C-phosphate-G
Cre Causes recombination
CRISPR/Cas Clustered, regulatory interspaced, short palindromic
repeats-associated
C-terminal Carboxy-terminal
VI
CV-1 Monkey kidney cell line from Cercopithecus aethiops
DAMP Damage-associated molecular pattern
DC Dendritic cell
DD Death domain
ddH2O H2O bidest
DHFR Dihydrofolate reductase
DMSO Dimethyl sulfoxide
DNA Deoxyribonucleic acid
dNTP Deoxy ribonucleosid-triphosphate
DS Dyad symmetry
DSB DNA double-strand break
dTomato Dimer Tomato
ε Extinctions coefficient [l ×g-1×cm-1]
EBNA-1 Epstein-Barr nuclear antigen 1
EBV Epstein-Barr virus
ECD Ectodomain
E. coli Escherichia coli
EDTA Ethylen diamine tetra acetic acid
eGFP Enhanced green fluorescent protein
Endo Endoglycosidase
ER Endoplasmic reticulum
ES Embryonic stem cells
EXIM Research group experimental immunology
fAβ β-amyloid plaques
FACS Fluorescence-activated cell sorting
FBS Foetal bovine serum
FCS Foetal calf serum
Flp Flippase
for Forward (-primer)

Abbreviations
VII
FR Family of repeats
FRT Flp recognition target
Fuc Fucose
G418 Geneticin
Gal Galactose
GalNAc N-Acetylgalactosamine
GFP Green fluorecent protein
Glc Glucose
GlcNAc N-Acetylglucoseamine
GNTI N-acetylglucosaminyltransferase I
GOI Gene of interest
gp96 Glycoprotein 96
GPCR G-protein-coupled receptor
GRP94 Glucose-regulated protein 94
GS Glutamine synthase
HDR Homology-directed repair
HEK Human embryonic kidney
HEPES 4-(2-hydroxyethyl)-1-piperazineethanesulfonic acid
Hisn n consecutive Histidin residues as affinity tag
HJ Holiday junction
HPLC High performance liquid chromatography
hpt Hours post transfection
HR Homologous recombination
HSP Heat shock protein
HTP High-throughput
HZI Helmholtz Centre for Infection Research
IFN Interferon
IKK IκB kinase
IL-1 Interleukin-1
VIII
IMAC Immobilised metal ion affinity chromatography
IPTG Isopropyl-β-D-thiogalactopyranoside
IRES Internal ribosomal entry site
IRF3 IFN-regulatory factor-3
Kan Kanamycin
kDa Kilodalton
LB Luria-Bertani
loxP Locus of crossing over (x), P1
LPS Lipopolysaccharide
LRR Leucin rich repeat
LTA Lipoteichoic acid
MAL MyD88-adaptor-like protein
MALDI Matrix assisted laser desorption ionisation
Man Mannose
MCS Multiple cloning site
MilliQ water Ultrapure (type 1) water
mRFP1 Monomeric red fluorecent protein-1
MS Mass spectrometry
MSX Methionine sulfoximine
MTX Methotrexate
MW Molecular weight
MWCO Molecular weight cut off
MyD88 Myeloid differentiation primary-response protein
N/A Not applicable
NB-DNJ N-butyl-deoxynojirimycin
NBT Nitro blue tetrazolium chloride
NEB New England Biolabs
Neo Neomycin phosphotransferase
NeuAc N-Acetylneuraminic acid
Abbreviations
IX
NF-κB Nuclear factor kappa-light-chain-enhancer of activated
B cells
NHEJ Non-homologous end joining
Ni-NTA Complex of nickel ions and nitriloacetic acid
NRCC National Research Council of Canada
N-terminal Amino-terminal
OD Optical density
OH hydroxyl group
oriP Origin of replication
pA Polyadenylation signal
PAGE Polyacrylamide gel electrophoresis
PAMP Pathogen associated molecular pattern
PBS Phosphate buffered saline
PCR Polymerase chain reaction
PDB Protein Data Bank
PE-DTPA 1,2-dimyristoyl-sn-glycero-3-phosphoethanolamine-N-
diethylenetriaminepentaacetic acid
PEI Polyethylenimine
PES Polyethersulfon
pFlpBtM pFlp-Bac-to-Mam
PGK Phosphoglycerate kinase
PGN Peptidoglycan
PNGase F Peptide-N-glycosidase F
PRAT4A Protein associated with toll-like receptor 4A
PRR Pattern recognition receptor
PTM Posttranslational modification
Puro Puromycin N-acetyl transferase
PVDF Polyvinylidene difluorid
rcf Relative centrifugal force

X
RDIF Research group gen regulation and differentiation
rev Reverse (-primer)
RMCE Recombinase-mediated cassette exchange
rpm Revolutions per minute
SAA Serum amyloid A
SD Standard deviation
SDS Sodium dodecyl sulphate
Ser Serine
Sf Spodoptera frugiperda
SM Selection marker
S/MAR scaffold/matrix attachment regions
SSR Site-specific recombinase
S. Typhimurium Salmonella enterica serotype Typhimurium
SV40 Simian virus 40
TAE Tris-acetate-EDTA
TALEN Transcription activator-like effector nuclease
TBS-T Tris buffered saline with Tween-20
TCA Trichloroacetic acid
tdTomato Tandem dimer Tomato
TE Tris-EDTA
TEMED N,N,N´,N´-Tetramethylethylendiamin
TH cell T-helper cell
Thr Threonine
TIL Toll/Interleukin-1-receptor-Like
TIR Toll/interleukin-1 (IL-I) receptor
TIRAP TIR-domain-containing adaptor protein
TLR Toll-like receptor
Tm Melting temperature
TN1 Tryptone
Abbreviations
XI
Tn7 Bacterial transposon Tn7
TNF Tumor-necrosis factor
TOF Time of flight
TRAM TRIF-related adaptor molecule
TRIF TIR-domain containing adaptor protein inducing IFN-β
Tris 2-Amino-2-hydroxymethyl-propane-1,3-diol
U Catalytical units
UPR Unfolded protein responses
UV Ultraviolet
VLR Variable lymphocyte receptor
v/v Volume fraction (volume per volume)
w/v Mass concentration (weight per volume)
×g Gravitational acceleration
ZNF Zinc-finger nuclease

Synopsis
1
Synopsis
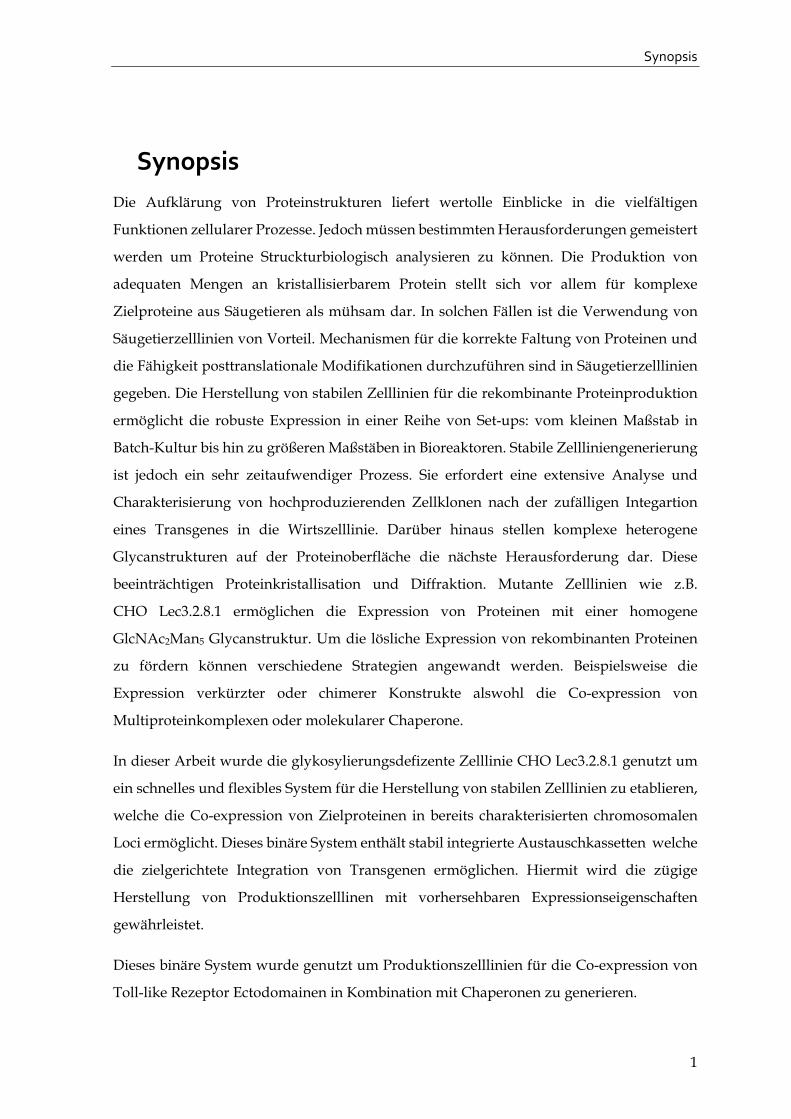
Die Aufklärung von Proteinstrukturen liefert wertolle Einblicke in die vielfältigen
Funktionen zellularer Prozesse. Jedoch müssen bestimmten Herausforderungen gemeistert
werden um Proteine Struckturbiologisch analysieren zu können. Die Produktion von
adequaten Mengen an kristallisierbarem Protein stellt sich vor allem für komplexe
Zielproteine aus Säugetieren als mühsam dar. In solchen Fällen ist die Verwendung von
Säugetierzelllinien von Vorteil. Mechanismen für die korrekte Faltung von Proteinen und
die Fähigkeit posttranslationale Modifikationen durchzuführen sind in Säugetierzelllinien
gegeben. Die Herstellung von stabilen Zelllinien für die rekombinante Proteinproduktion
ermöglicht die robuste Expression in einer Reihe von Set-ups: vom kleinen Maßstab in
Batch-Kultur bis hin zu größeren Maßstäben in Bioreaktoren. Stabile Zellliniengenerierung
ist jedoch ein sehr zeitaufwendiger Prozess. Sie erfordert eine extensive Analyse und
Charakterisierung von hochproduzierenden Zellklonen nach der zufälligen Integartion
eines Transgenes in die Wirtszelllinie. Darüber hinaus stellen komplexe heterogene
Glycanstrukturen auf der Proteinoberfläche die nächste Herausforderung dar. Diese
beeinträchtigen Proteinkristallisation und Diffraktion. Mutante Zelllinien wie z.B.
CHO Lec3.2.8.1 ermöglichen die Expression von Proteinen mit einer homogene
GlcNAc2Man5 Glycanstruktur. Um die lösliche Expression von rekombinanten Proteinen
zu fördern können verschiedene Strategien angewandt werden. Beispielsweise die
Expression verkürzter oder chimerer Konstrukte alswohl die Co-expression von
Multiproteinkomplexen oder molekularer Chaperone.
In dieser Arbeit wurde die glykosylierungsdefizente Zelllinie CHO Lec3.2.8.1 genutzt um
ein schnelles und flexibles System für die Herstellung von stabilen Zelllinien zu etablieren,
welche die Co-expression von Zielproteinen in bereits charakterisierten chromosomalen
Loci ermöglicht. Dieses binäre System enthält stabil integrierte Austauschkassetten welche
die zielgerichtete Integration von Transgenen ermöglichen. Hiermit wird die zügige
Herstellung von Produktionszelllinen mit vorhersehbaren Expressionseigenschaften
gewährleistet.
Dieses binäre System wurde genutzt um Produktionszelllinien für die Co-expression von
Toll-like Rezeptor Ectodomainen in Kombination mit Chaperonen zu generieren.
2
Synopsis
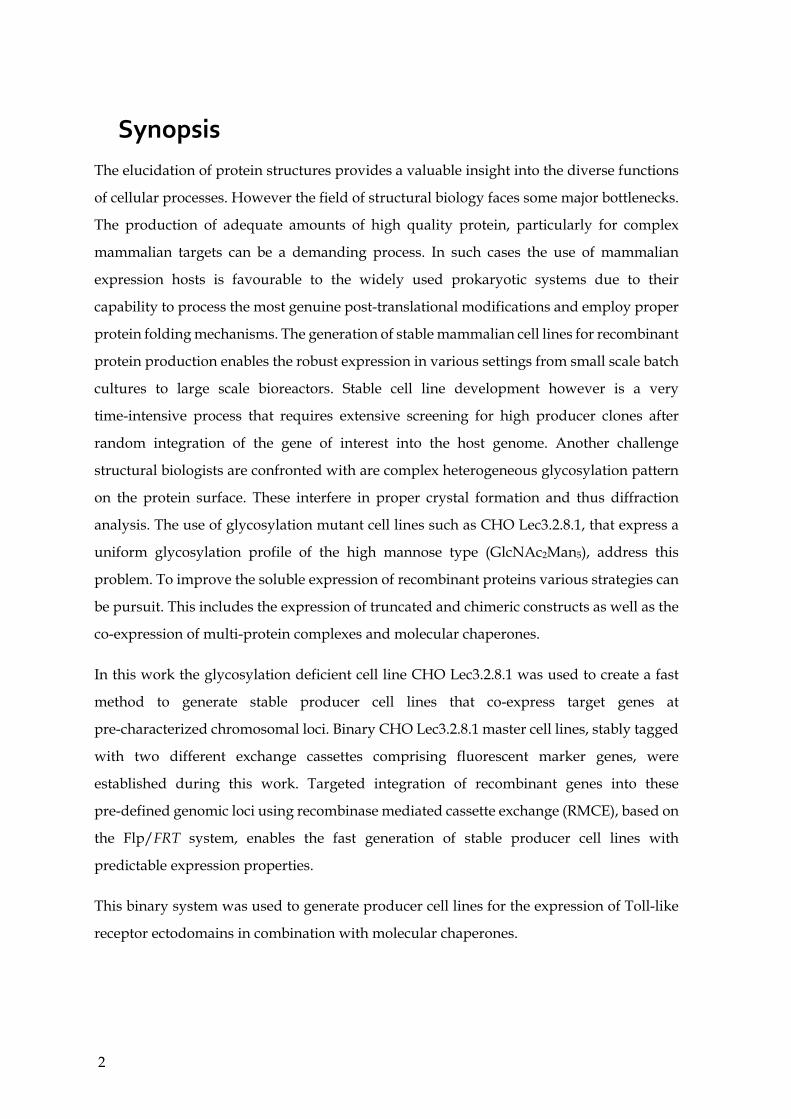
The elucidation of protein structures provides a valuable insight into the diverse functions
of cellular processes. However the field of structural biology faces some major bottlenecks.
The production of adequate amounts of high quality protein, particularly for complex
mammalian targets can be a demanding process. In such cases the use of mammalian
expression hosts is favourable to the widely used prokaryotic systems due to their
capability to process the most genuine post-translational modifications and employ proper
protein folding mechanisms. The generation of stable mammalian cell lines for recombinant
protein production enables the robust expression in various settings from small scale batch
cultures to large scale bioreactors. Stable cell line development however is a very
time-intensive process that requires extensive screening for high producer clones after
random integration of the gene of interest into the host genome. Another challenge
structural biologists are confronted with are complex heterogeneous glycosylation pattern
on the protein surface. These interfere in proper crystal formation and thus diffraction
analysis. The use of glycosylation mutant cell lines such as CHO Lec3.2.8.1, that express a
uniform glycosylation profile of the high mannose type (GlcNAc2Man5), address this
problem. To improve the soluble expression of recombinant proteins various strategies can
be pursuit. This includes the expression of truncated and chimeric constructs as well as the
co-expression of multi-protein complexes and molecular chaperones.
In this work the glycosylation deficient cell line CHO Lec3.2.8.1 was used to create a fast
method to generate stable producer cell lines that co-express target genes at
pre-characterized chromosomal loci. Binary CHO Lec3.2.8.1 master cell lines, stably tagged
with two different exchange cassettes comprising fluorescent marker genes, were
established during this work. Targeted integration of recombinant genes into these
pre-defined genomic loci using recombinase mediated cassette exchange (RMCE), based on
the Flp/FRT system, enables the fast generation of stable producer cell lines with
predictable expression properties.
This binary system was used to generate producer cell lines for the expression of Toll-like
receptor ectodomains in combination with molecular chaperones.
INTRODUCTION
3
1 Introduction
1.1 Recombinant protein expression
The importance of protein function in biological systems is evident by their diverse roles in
all cellular processes. Proteins do not only provide a structural matrix but are also directly
or indirectly involved in catalytic processes, cellular signalling, transport and storage as
well as the immune defence and cell-cell interactions (Alberts, 2008). Protein aberrations
due to genetic mutations can lead to malfunctioning of one or more cellular processes
resulting in a multitude of phenotypes with different levels of severity e.g. haemoglobin
disorders (Weatherall, 2004), neurodegenerative diseases (Chiti et al., 2006) and cancer
(Frank, 2004). Therefore, the elucidation of protein structure and function is essential for
the understanding of biological processes which will aid in the development of
therapeutical coping strategies.
The historically important protein insulin was not only the first protein to be sequenced
(Sanger, 1949) but also the first recombinant drug brought onto the market after its
successful recombinant expression in Escherichia coli (Goeddel et al., 1979). This eliminated
the need for cumbersome extraction from natural sources and met the increasing demands
with a qualitatively superior product. Since its initial use (Cohen et al., 1973) recombinant
deoxyribonucleic acid (DNA) technology evolved to a diverse tool for researchers as well
as for the life science industry. Recombinant proteins can now be manipulated to display
specific properties such as improved solubility, expressibility and affinity to
chromatographic resins using fusion-tags (Malhotra, 2009). Single domains, truncated and
chimeric proteins can be generated (Hudson et al., 2003, Jin et al., 2008) as well as completely
engineered proteins which do not occur naturally such as bispecific antibodies (Hudson et
al., 2003). Codon optimisation can be used to aid expressibility in different hosts (Angov et
al., 2008) and posttranslational modifications (PTM) can be optimized to influence a variety
of functions including plasma-half life, system clearance and protection from immunogenic
reactions (Walsh et al., 2006).
As specified before, the elucidation of protein structures is important. Since the first protein
structures were obtained for myoglobin (Kendrew et al., 1958) and haemoglobin (Muirhead

INTRODUCTION
4
et al., 1963), over 100,000 more entries were deposited in the Protein Data Bank (PDB) to
date. The continued development of new and improved expression systems, recombinant
engineering and technical tools results in the constant release of new structures that
contribute to a more holistic picture of cellular mechanisms. Nonetheless, recombinant
protein expression for structural biology applications is confronted with major bottlenecks.
For one, the soluble expressibility of protein is limited particularly for complex protein
structures. Moreover, heterogeneity resulting from complex glycosylation patterns makes
it difficult to obtain well diffracting crystals. Properties that influence protein expression
and crystallization are strongly impacted by the choice of expression system used for
heterologous protein production. So far bacterial expression hosts like E. coli are most
commonly used due to their inexpensive and uncomplicated technical and cultivation
requirements which makes them easy to handle. However, prokaryotes lack the secretory
pathway present in eukaryotes and thus the machinery necessary for PTMs. This results
often in incorrectly folded non-functional protein that accumulates in inclusion bodies.
Even though refolding procedures can be attempted, these are not always successful. Thus
the limit of bacterial expression systems is reached at this point for many protein targets.
Therefore the use of eukaryotic expression systems becomes more and more widespread.
While heterologous expression in yeast is still considered as relatively inexpensive the costs
of insect and mammalian systems are elevated due to complex media requirements. In
comparison to bacterial systems insect and mammalian systems are time-consuming
particularly when generating stable cell lines (Villaverde et al., 2003, Aricescu et al., 2006,
Nettleship et al., 2010, Aricescu et al., 2013).
1.2 Glycosylation – friend or foe
In this work the focus lies on the production of difficult to express protein targets for
structural biology. The importance and drawbacks of glycosylation for structural biology
as well as approaches that deal with protein glycosylation are described in this chapter.
Roughly 50 % of proteins found in humans are glycosylated which highlights the central
role of glycosylation for biological function. Deficiencies in the glycosylation pathway are
associated with medical condition such as congenital disorders of glycosylation (CDG)
including mucolipidosis II or Walker-Warburg syndrome (Freeze, 2006). However, at the
same time glycoform variations can be used as disease markers for the diagnostic
determination of medical conditions (Walsh et al., 2006). Protein glycosylation regulates
INTRODUCTION
5
structural stability, proper folding, endosomal trafficking, proteolytic processing and
protein solubility. Glycan patterns also influence protein-protein interactions and in vivo
protein functions such as signal transduction, functional activity, immunogenicity,
bioavailability, biodistribution and pharmacokinetics. Glycosylation patterns are divided
into N-linked and O-linked glycans which are either connected to nitrogen atoms of
asparagine residues comprising an Asn-X-Ser/Thr motif or hydroxyl groups of serine or
threonine residues respectively. N-linked glycosylation is initiated through the attachment
of branched glycan precursors in the endoplasmic reticulum (ER) which are further
modified when passing the Golgi apparatus whereas O-linked glycosylation takes place
through the sequential attachment of single N-Acetylgalactosamine (GalNAc)
monosaccharaides. While O-linked glycosylation sites are less problematic for structural
biology applications as they are mostly found in extended, unfolded serine-, threonine- and
proline-rich regions of proteins. N-linked glycosylation poses a problem as it interferes with
protein crystallization and diffraction. However, N-linked glycosylation sites are known to
be relevant for glycan-protein interactions and the protection of hydrophobic regions and
thus cannot be dismissed as easily (Walsh et al., 2006, Chang et al., 2007, Croset et al., 2012).
Therefore glycosylation deficient cell lines such as CHO Lec3.2.8.1 or HEK293-GNTI- cells
which only express truncated glycan patterns (Stanley, 1989, Reeves et al., 2002) as well as
glycosylation inhibitors are employed. N-glycosylation can be inhibited by the presence of
kifunensine which inhibits mannosidase I (Elbein et al., 1990) or swainsonine which inhibits
lysosomal α-mannosidase (Elbein et al., 1981) or N-butyl-deoxynojirimycin (NB-DNJ)
which inhibits α-glucosidase during expression. The truncated glycan chains attain a
sensitivity for enzymes including endoglycosidase (endo) H or endo F1 leaving a single
N-Acetylglucosamine (GlcNAc) residue. Butters et al., (1999) demonstrated that the
combined use of CHO Lec3.2.8.1 cells with ND-DNJ improved the deglycosylation
efficiency of glycoproteins with endoH from 12 % to almost 100 %. Finally, if all N-linked
glycans shall be removed peptide-N-glycosidase F (PNGase F) will do so. However
PNGase F will also convert the asparagine side chain-residue to aspartate which might
negatively affect protein interactions and thus often results in the aggregation of the protein
(Chang et al., 2007, Aricescu et al., 2013). An overview of glycosylation profiles is given in
Table 1-1.
INTRODUCTION
6
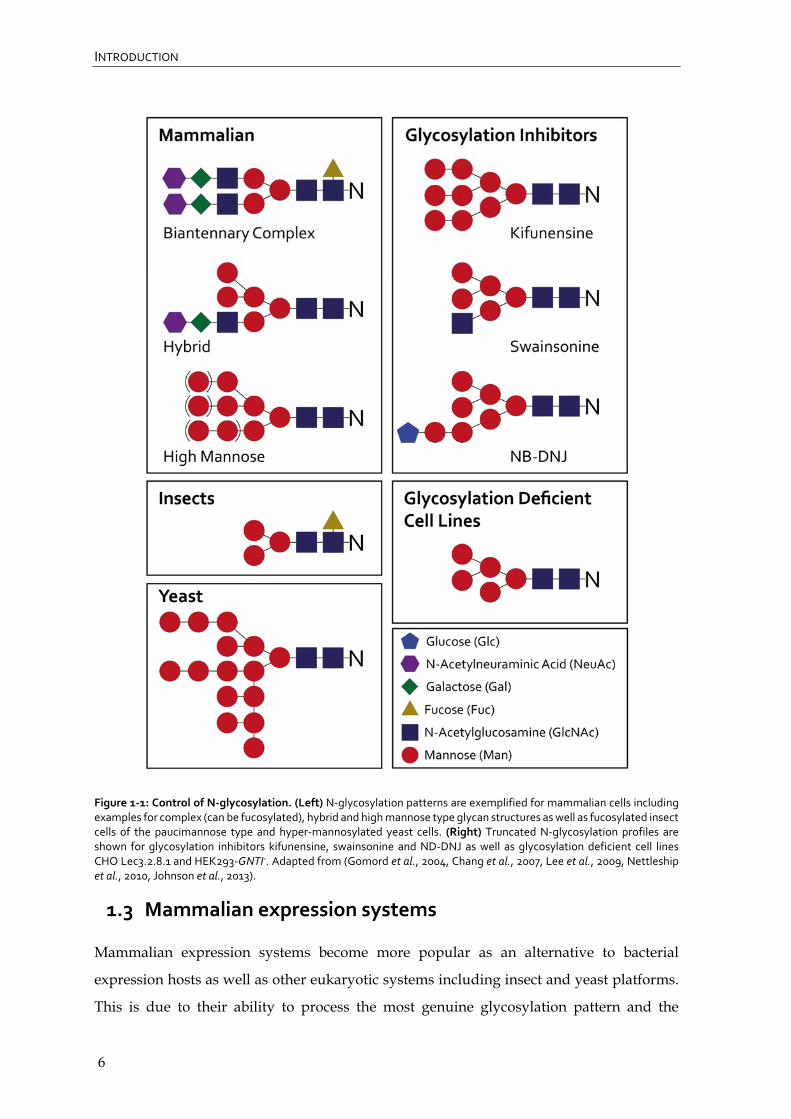
Figure 1‐1: Control of N‐glycosylation. (Left) N‐glycosylation patterns are exemplified for mammalian cells including examples for complex (can be fucosylated), hybrid and high mannose type glycan structures as well as fucosylated insect cells of the paucimannose type and hyper‐mannosylated yeast cells. (Right) Truncated N‐glycosylation profiles are shown for glycosylation inhibitors kifunensine, swainsonine and ND‐DNJ as well as glycosylation deficient cell lines CHO Lec3.2.8.1 and HEK293‐GNTI‐. Adapted from (Gomord et al., 2004, Chang et al., 2007, Lee et al., 2009, Nettleship et al., 2010, Johnson et al., 2013).
1.3 Mammalian expression systems
Mammalian expression systems become more popular as an alternative to bacterial
expression hosts as well as other eukaryotic systems including insect and yeast platforms.
This is due to their ability to process the most genuine glycosylation pattern and the
INTRODUCTION
7
availability of the cellular folding machinery necessary for complex human target proteins.
Those advantages ease the approval of biopharmaceuticals by regulatory agencies as well
as the soluble expression and proper folding of proteins for structural biology applications.
However, complex glycan structures need to be removed before crystallization.
Alternatively, mutant cell lines with truncated glycosylation profiles for structural biology
can be employed. Therefore, the glycosylation mutant cell line CHO Lec3.2.8.1 was used to
generate stable master and producer cell lines for the co-expression of demanding target
proteins during this work. For the transient screening of constructs and small scale test
expressions HEK293-6E cells were utilized.
Transient and stable protein expression in mammalian cell lines was optimized in the last
years as described in the following chapters (Durocher et al., 2002, Aricescu et al., 2006,
Nettleship et al., 2010). Transient expression in Human embryonic kidney (HEK) cells is
commonly used for construct screening in small scale formats. Chinese hamster ovary
(CHO) cells on the other hand are generally used for the generation of stable producer cell
lines which enables rapid scale-up in bioreactors and repeatable protein production.
Detailed information on HEK and CHO cells used for transient and stable protein
expression are given in the following chapters.
1.3.1 Transient protein expression in HEK293 cell lines
HEK293 cell lines are most commonly used for the transient expression of proteins. In our
lab the transient expression in HEK293-6E cells, described below, is established and
routinely used. HEK293 cells were originally derived from HEK cells transformed with
sheared adenovirus type 5 DNA (Graham et al., 1977). HEK293 derivative cell lines
followed, including HEK293T cells expressing the simian virus 40 (SV40) large T-antigen
(Lebkowski et al., 1985) and HEK293-EBNA cells expressing the Epstein-Barr virus (EBV)
Epstein-Barr nuclear antigen 1 (EBNA-1) (Young et al., 1988). These allow episomal
amplification of plasmids containing the viral SV40 or EBV origins of replication SV40 ori
and oriP respectively. As a result, a larger copy number of plasmid is retained within the
cell during expression which improves protein yields (Schlaeger et al., 1999, Aricescu et al.,
2006). Yates et al., (2000) demonstrated more specifically that the components DS (dyad
symmetry) and FR (family of repeats) within oriP comprise several EBNA-1 binding sites
which function as replicator and retain plasmids during cell division respectively after
binding of EBNA-1. Furthermore it was shown that the replicator DS only requires two

INTRODUCTION
8
EBNA-1 binding sites for proper functioning (Yates et al., 2000). HEK293-6E is a
HEK293-EBNA cell line which expresses a truncated version of the EBNA-1 protein
(Durocher et al., 2002). HEK293-6E cells were used in this work for the transient expression
and screening of protein targets before the generation of stable glycosylation mutant
CHO Lec3.2.8.1 cell lines since HEK293-6E cells are already routinely used in our
laboratory. However, glycosylation mutant HEK293-GnTI- cells unable to synthesise
complex N-linked glycans due to the lack of N-acetylglucosaminyltransferase are also
available and only express homogenous Man5GlcNAc2 residues on the glycoprotein surface
(Reeves et al., 2002, Chaudhary et al., 2012).
Transient expression protocols for HEK293 cell lines were optimized over the years as an
alternative to laborious stable cell line generation. The improvement of protein yields,
downstream processing and transient scalability as well as the reduction of cultivation
related costs for adherent culture methods and the setup of high-throughput (HTP)
applications were addressed. The use of inexpensive transfection reagents such as calcium
phosphate (CaPi) or polycationic linear and branched polyethylenimine (PEI) were
explored and improved over the years. In this work suspension adapted HEK293-6E cells
were used for transient test expressions in batch culture before the generation of stable
CHO Lec3.2.8.1 production cell lines. The HEK293-6E cells were cultivated under serum
free conditions (Meissner et al., 2001) and transfected with 25 kDa liner PEI with prior
DNA:PEI complex formation (Schlaeger et al., 1999, Durocher et al., 2002). Nonetheless, it
was demonstrated that the use of high cell densities (20x106 cells/mL) during transfection
without prior complex formation (Backliwal et al., 2008) can yield equally high results. Even
though CaPi co-precipitation is an equally efficient method for the transient transfection of
HEK cells compared to PEI, the presence of foetal calf serum (FCS) during transfection is a
major drawback for large scale applications as it requires the removal of serum through
complete medium exchange (Baldi et al., 2005). Furthermore, the supplementation with
valproic acid five days after transfection was used to improve transient protein expression
during this work. It was shown that supplementation with valproic acid a histone
deacetylase inhibitor was used to obtain volumetric yields up to 1 g/L of recombinant
antibody (Backliwal et al., 2008). The inhibition of histone deacetylases increases the level
of histone acetylation and thus endorses a relaxed conformation in the chromatin structure.
This results in higher transcription levels and thus increased protein yields (Kazantsev et
al., 2008).
INTRODUCTION
9
Transient transfection in various suspension adapted HEK293 cell lines is now used for
HTP screening of protein constructs in small scale multiwell formats with subsequent
purification (Davies et al., 2005) and crystallisation (Lee et al., 2009) as well as large scale
expression in WaveTM bioreactors (Geisse et al., 2005, Chaudhary et al., 2012). Nevertheless
the use of adherent HEK293T and HEK293-GNTI- cells for transient transfection was also
optimized for economic construct screening in T-flasks and consequent expansion into
roller-bottles for protein production. Through the adaption to affordable culture media
(Dulbecco’s Modified Eagle’s Medium, Sigma), costs were reduced significantly and are
extensively used until today for medium scale applications (Aricescu et al., 2006). Moreover,
automated sterile systems, such as the CompacT SelecT cell culture robot, enable the
transient transfection in adherent HEK293T and HEK293-GnTI-. Thus, user-specific
variations during the time-consuming manual handling and transfection steps are
eliminated and allow the continuous cultivation of backup cells and transient protein
production (Zhao et al., 2011).
1.3.2 Stable protein expression in CHO cell lines
Since the first clinical approval of a recombinant biopharmaceutical produced in CHO,
namely human tissue-type plasminogen activator (Kaufman et al., 1985), CHO cells became
the most commonly used cell line for stable protein production in the biopharmaceutical
industry in which 70 % of protein targets are expressed. Cellular processes in CHO cells
were genetically engineered over the years to exhibit specific properties such as improved
glycosylation pattern, proper gene amplification, reduced lactate production, resistance
against apoptosis and the adaptation to suspension culture. Methodological developments
including expression vector design, advanced cloning procedures, codon optimization,
superior transfection protocols, improvement of stable integration and clonal selection
methods as well as process improvements such as the optimization of media formulations,
feeds, additives, pH, temperature and bioreactor design were brought forward to enhance
growth and expression properties (Datta et al., 2013). Recent advances in the deciphering of
the CHO and CHO-K1 genomic sequence (Wurm et al., 2011, Xu et al., 2011, Lewis et al.,
2013) as well as proteome, secretome (Baycin-Hizal et al., 2012), transcriptome (Becker et al.,
2011), glycome (North et al., 2010, Tep et al., 2012) and metabolome (Dietmair et al., 2012)
open new doors for metabolic and proteomic engineering.
INTRODUCTION
10
CHO cells were originally isolated by Puck et al., (1958) as an alternative to the malignant
tissues derived cell lines available at that time. The low chromosome number of Chinese
hamsters 2n=22 made them an attractive choice for genetic studies (Puck et al., 1958).
Several CHO derived cell lines are currently employed for protein production. For example
subclone CHO-K1 (Kao et al., 1968) and CHO DHFR-deficient cells (dhfr-) that lack
dihydrofolate reductase (DHFR) activity that usually converts dihydrofolate to
tetrahydrofolate which is required for the de novo synthesis of purines (Urlaub et al., 1980).
CHO-dhfr- cells are used in combination with methotrexate (MTX) a DHFR antagonist
which blocks residual DHFR activity to select cells that regain DHFR activity through
co-amplification of the dhfr gene supplied on the expression vector (Kim et al., 1998).
To produce demanding protein targets for structural biology applications CHO Lec3.2.8.1
cells were used for the generation of stable master and producer cell lines in this work.
Glycosylation deficient CHO Lec3.2.8.1 cells are used when glycoproteins are desired with
a minimum of heterogeneity in there glycosylation pattern. Stanley, (1989) isolated the
CHO Lec3.2.8.1 cell line through sequential screening against several plant lectins from the
Pro-Lec3.6B mutant cell line derived from the CHO cell line Pro-5. Resistance against a
number of plant lectins, which were the consequence of reduced cell surface binding of
those lectins, accounted for several glycosylation deficient phenotypes with a cumulative
effect thus resulting in highly truncated and uniform glycosylation patterns. The lectin
resistant mutation Lec1 accounts for a lack in N-acetylglucosaminyltransferase-1 activity,
whereas the Lec2 and Lec3 phenotypes exhibit reduced transport of CMP-sialic acid into
the Golgi lumen. Similarly the Lec8 phenotype shows reduced transport of UDP-galactose
into the Golgi lumen (Stanley, 1989).
The generation of stable cell lines (Figure 1-2) follows a specific order; random integration
of the gene of interest (GOI) into the host chromosome is followed by a selection method of
choice. Popular selection methods include the use of the DHFR system described
previously which is based on the rescue of a defective nucleotide metabolism through the
over-expression of the enzyme DHFR (Urlaub et al., 1980, Kim et al., 1998) or the glutamine
synthase (GS) system which similarly compensates for the lack of glutamine in culture
media through the over-expression of GS thus strengthening the glutamine synthase
pathway. Methionine sulfoximine (MSX) a GS inhibitor is used to increase selection
stringency (Cockett et al., 1990). Alternatively resistance against antibiotics can be prompted
INTRODUCTION
11
through the integration of bacterial genes such as neo or puro. The puro gene is a codon
optimized version of Pac with reduced CpG (C-phosphate-G) motives and thus is less
affected by epigenetic silencing in mammalian cells. These encode neomycin
phosphotransferase and puromycin N-acetyl transferase respectively rendering the cell line
resistant to G418 or puromycin (Southern et al., 1982, Vara et al., 1986, InvivoGen, 2014).
After random chromosomal integration, of a recombinant gene and initial selection
procedures, several time-consuming rounds of extensive labour-intensive screening are
required to isolate stable isogenic high producer cell lines. To reduce development costs
and time in a pipeline that result from clonal screening and isolation, HTP automated
platforms were established in industrial setups (Shi et al., 2011). This HTP platform
combines fluorescence-activated cell sorting (FACS) as well as imaging and liquid handling
systems and thus allows screening of up to 10,000 clones in one run (Shi et al., 2011). In this
PhD thesis fluorescent marker genes were used for the isolation of stable CHO Lec3.2.8.1
master cell lines via FACS whereas the resistance genes neo or puro were used for the
isolation of stable producer cell lines.
Following random genomic integration within a transfected population of cells, expression
level between distinct cells of this population can vary strongly depending on the number
of transgene integrations and chromosomal integration sites (position effect). While
chromosomal integration into the loosely packed euchromatin favours protein expression,
integration into dense inactive heterochromatin does not (Wurm, 2004). Therefore clonal
isolation of single cell derived or phenotypically homogenous high producer cell lines from
the initially obtained pool of transfected cells is necessary to obtain isogenic clones with
constant expression level. However, even after the isolation of producer cell lines,
inter-clonal variation can be observed within these clonal isolates (Kim et al., 1998, Liu et al.,
2006, Kaufman et al., 2008, Pilbrough et al., 2009). These differences are attributed to genetic
mosaicism that results from specific cell intrinsic variations as well as gradual termination
of gene expression due to silencing effects that result from epigenetic downregulation of
exogenous DNA. To circumvent epigenetic silencing cis-regulatory elements such as
scaffold/matrix attachment regions (S/MARs) or ubiquitous chromatin opening elements
can be used to flank the GOI (Wurm, 2004). Furthermore additives such as butyrate (Davie,
2003) or valproic acid (Backliwal et al., 2008) which block histone deacetylase activity can
be employed to boost protein expression. Moreover, it was shown that the methodology
used for the isolation of isogenic clones does play a role in the constancy of homogenous

INTRODUCTION
12
expression. For example Liu et al., (2006) demonstrated that the removal of selective
pressure after clonal isolation can result in epigenetic silencing which was further
confirmed by Kaufman et al., (2008) who compared the use of drug-based selection pressure
to FACS. Thus clonal isolates obtained through cell sorting were shown to exhibit a higher
degree of uniformity (Kaufman et al., 2008). Nevertheless, the use of FACS for the isolation
of producer cell lines with a high level of fluorescence can also result in heterogeneity due
to non-genetic random stochastic fluctuations in expression during clonal isolation. Thus
a population of isolated high producers may also contain cells with lower expression
profiles that were temporary present within the isolated gate. This results in the co-isolation
of cells with a lower production yield. These low producer subpopulations may outgrow
the high producers over time. Vice versa when isolating producer cell lines with a low level
of fluorescence these might be outgrown from high producers (Pilbrough et al., 2009). To
ease the generation of homogenous high producer cell lines and cut down development
times, targeted integration approaches for stable cell line development are being pursuit
(described in Section 1.4).
Figure 1‐2: Conventional method for stable cell line development. A vector comprising the GOI and a selection marker (SM) of choice are randomly integrated into the genome. Application of selective pressure is followed by clonal isolation and extensive screening for high producers before large scale production and process optimization. Adapted from Wurm, (2004).
1.4 Stable cell line development through targeted integration
In this work the generation of stable CHO Lec3.2.8.1 producer cell lines is based on targeted
integration with site-specific recombinases (SSR). Site-specific recombination as well as
alternative approaches towards targeted integration are described below.
Site-specific targeted integration methods including nuclease based methods such as the
zinc-finger nuclease (ZFN) system, the transcription activator-like effector nucleases

INTRODUCTION
13
(TALEN) system and the clustered, regulatory interspaced, short palindromic repeats
associated (CRISPR/Cas) system were developed to enable efficient genomic alterations as
an alternative to homologous recombination (HR). While ZFNs and TALENs employ
linked arrays of proteomic DNA-binding domains which each recognize specific bases of a
desired DNA sequence to guide their chimeric nuclease to a specific chromosomal location,
DNA targeting of one or more loci with the CRISPR/Cas system is mediated by RNA using
base-pairing. Sequence-specific targeting is followed by the introduction of DNA
double-strand breaks (DSBs) which are repaired by the cellular machinery using either non-
homologous end joining (NHEJ) or homology-directed repair (HDR) which either leads to
the insertion or deletion of DNA sequences. Particularly ZFNs have been used for in vivo
gene-knockouts, replacements or repair in gene therapy as an alternative to gene silencing
(Gaj et al., 2013, Sander et al., 2014). However, neither ZFNs, TALENs nor CRISPR are ideal
for stable cell line development with the aim of high yield recombinant protein production
as this would require specific knowledge of genomic loci within an expression host which
is not yet available. Transposon based methods such as Sleeping Beauty (SB) or piggybac
similarly to nuclease based methods are used for in vivo modifications of animal models
and cell culture applications. Chromosomal integration is targeted to naturally occurring
sites with specific insertion pattern for each transposon. However, even though integration
is directed it may occur in several transcriptionally active or inactive sites (Ivics et al., 2010).
Nevertheless the use of piggyBac for protein expression was demonstrated for mixed stable
populations (Li et al., 2013). To target a GOI at a pre-characterised genomic locus with
predictable protein expression level, site specific recombinases (SSR) are the method of
choice for stable cell line development as they do not require previous knowledge of a
genomic locus but still enable the generation of isogenic cell lines.
Site-specific recombination systems are commonly found in bacteria, bacteriophages and
yeast but not in higher eukaryotes. They catalyse DNA integration, excision/resolution or
inversion through site specific recombination between specific DNA sequences. Depending
on the residue which catalyses the recombination, SSRs are divided into tyrosine-type or
serine-type recombinases. While the mechanism of tyrosine-type recombinases includes the
formation of a holiday junction (HJ) intermediate (Figure 1-3), serine-type recombinases
cause a 180 ° rotation of the substrate DNAs during recombination. According to the
directionality of their recombination tyrosine-type recombinases are further subdivided
into unidirectional tyrosine-type recombinases like λ and HK022 integrases which require

INTRODUCTION
14
non-identical recognition sites (attP and attB) or bidirectional tyrosine-type recombinases
like Cre and Flp recombinase which require identical recognition sites i.e. loxP or FRT
respectively. Serine-type integrases on the other hand are subdivided according to their
protein size into small serine-type recombinases which may act in a unidirectional or
bidirectional manner (e.g. γδ and Tn3 resolvases or Hin and Gin invertases respectively) or
large serine-type recombinases like ΦC31 and R4 integrases which act in an unidirectional
way (Hirano et al., 2011).
Figure 1‐3: Mechanism of tyrosine‐type recombinases. Four tyrosine‐type recombinase monomers (e.g. Cre or Flp) attach to their corresponding recombinase binding sites (loxP or FRT respectively) to catalyse a step‐wise strand exchange between two recombining DNA strands. First the nucleophilic tyrosine residue in the active catalytic centre (red) of one recombinase monomer on each DNA strand (dark grey) mediates cleavage of the first DNA strand between the linker and the recombinase binding site. This results in the formation of a covalent 3’‐phophotyrosine intermediate and free 5’‐OH (hydroxyl) groups. The 5’‐OH groups subsequently attack the covalent DNA‐Protein bond to exchange the first pair of DNA strands through the formation of a HJ intermediate. The exchange of the second pair of DNA strands is mediated by the remaining pair of recombinases (light grey) after isomerization of the HJ intermediate (not shown). Successful recombination does not destroy the recombination site and thus further exchanges are possible. Adapted from (Ghosh et al., 2002, Chen et al., 2003).
Since the early 90’s the tyrosine-type recombinases Flp and Cre were employed in
mammalian cells (O'Gorman et al., 1991, Fukushige et al., 1992). These were further
optimized (Buchholz et al., 1998, Raymond et al., 2007) and used for tag-and-target (targeted
integration) and tag-and-exchange (targeted replacement) strategies in in vitro and in vivo
applications to tailor mammalian genomes. In this work the tyrosine type recombinase Flp
is used for a tag-and-exchange approach in CHO Lec3.2.8.1 cells via recombinase mediated
cassette exchange (described in Section 1.4.2).
1.4.1 Flp recombinase
The eukaryotic flippase (Flp) recombinase originates from the 2µM plasmid of
Saccharomyces cerevisiae. Flp binds to Flp recognition target sites (FRT) comprising two 13 bp
inverted repeats separated by an 8 bp spacer region. A third 13 bp symmetry element was
shown to be non-essential (Andrews et al., 1985, McLeod et al., 1986) (Figure 1-4). However
as a yeast protein Flp is active at 30 °C, to adapt it for use in mammalian systems the
thermodynamic properties of Flp were improved through directed evolution strategies to
INTRODUCTION
15
be active at 37 °C resulting in the mutant Flpe (Buchholz et al., 1998). Flpe was further
enhanced by de novo synthesis of the mouse-codon optimised Flpo variant (Raymond et al.,
2007) which was shown to be 5x more active than Flpe in murine embryonic stem cells
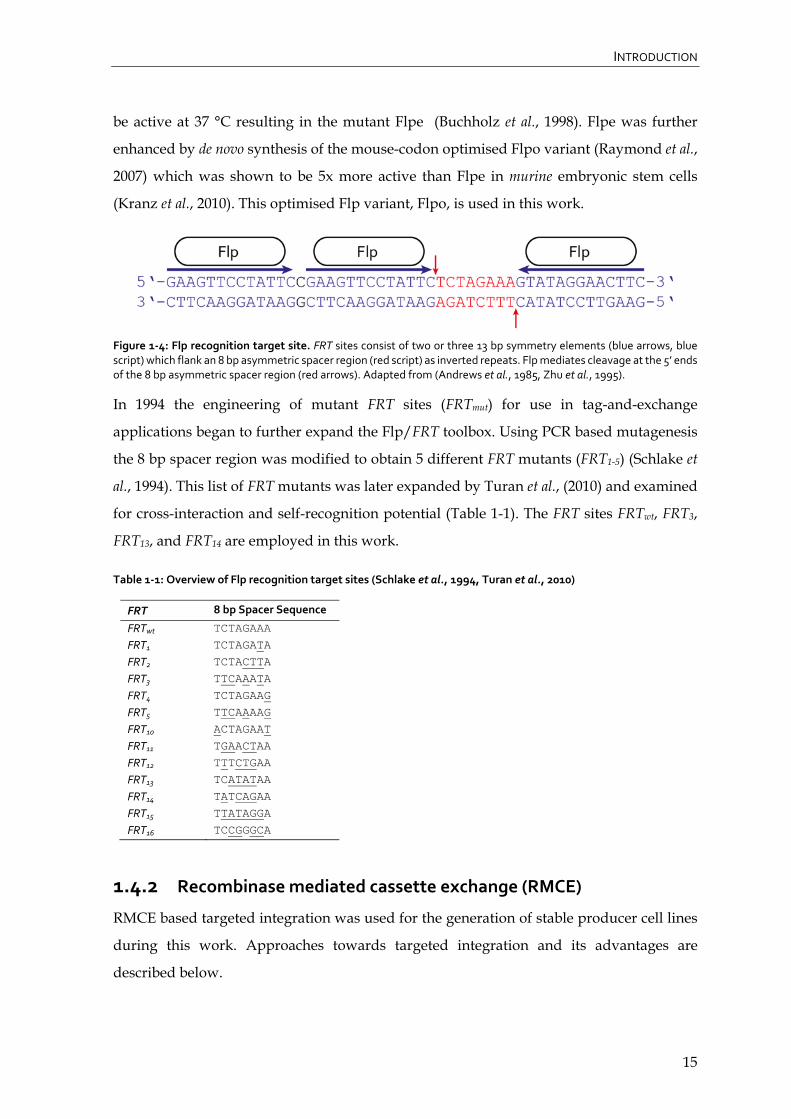
(Kranz et al., 2010). This optimised Flp variant, Flpo, is used in this work.
Figure 1‐4: Flp recognition target site. FRT sites consist of two or three 13 bp symmetry elements (blue arrows, blue script) which flank an 8 bp asymmetric spacer region (red script) as inverted repeats. Flp mediates cleavage at the 5’ ends of the 8 bp asymmetric spacer region (red arrows). Adapted from (Andrews et al., 1985, Zhu et al., 1995).
In 1994 the engineering of mutant FRT sites (FRTmut) for use in tag-and-exchange
applications began to further expand the Flp/FRT toolbox. Using PCR based mutagenesis
the 8 bp spacer region was modified to obtain 5 different FRT mutants (FRT1-5) (Schlake et
al., 1994). This list of FRT mutants was later expanded by Turan et al., (2010) and examined
for cross-interaction and self-recognition potential (Table 1-1). The FRT sites FRTwt, FRT3,
FRT13, and FRT14 are employed in this work.
Table 1‐1: Overview of Flp recognition target sites (Schlake et al., 1994, Turan et al., 2010)
FRT 8 bp Spacer Sequence
FRTwt TCTAGAAA
FRT1 TCTAGATA
FRT2 TCTACTTA
FRT3 TTCAAATA
FRT4 TCTAGAAG
FRT5 TTCAAAAG
FRT10 ACTAGAAT
FRT11 TGAACTAA
FRT12 TTTCTGAA
FRT13 TCATATAA
FRT14 TATCAGAA
FRT15 TTATAGGA
FRT16 TCCGGGCA
1.4.2 Recombinase mediated cassette exchange (RMCE)
RMCE based targeted integration was used for the generation of stable producer cell lines
during this work. Approaches towards targeted integration and its advantages are
described below.
INTRODUCTION
16
Random integration of gene targets into chromosomal loci can result in unpredictable gene
expression as the genomic environment as well as the co-introduction of prokaryotic vector
sequences may cause epigenetic silencing. The use of SSRs in tag-and-target and
tag-and-exchange systems enabled the targeted integration into a previously characterized
genomic locus to obtain suitable expression profiles. Tag-and-target systems based on the
Flp/FRT system employ one FRT site to integrate a GOI into a tagged locus (Flp-in)
(O'Gorman et al., 1991). The Flp-in system was also commercialised by Invitrogen which
now offers an array of cell lines for targeted exchange projects (Invitrogen, 2010). A
variation of the Flp-in system, the Flp-mediated DNA integration and rearrangement at
prearranged genomic targets (FLIRT) system was introduced by Huang et al., (1997). The
FLIRT system employs two tandemly oriented homospecifc FRT sites which can be used to
flank a marker gene, tag a cell line and remove the marker gene again using a Flp-out
reaction leaving only one FRT site in the genome. This single FRT site in turn can be used
for the Flp-in reactions of a transgene into this specific chromosomal locus. However,
during Flp-in reactions prokaryotic elements are still co-introduced which potentially
induces epigenetic silencing. As a Flp-in reaction results in the GOI being flanked with two
unidirectional homospecifc FRT sites, the reverse reaction (Flp-out) will be catalysed if
recombinase activity should be persistent i.e. through random integration of the
flippase-vector (Oumard et al., 2006, Turan et al., 2011). Therefore Schlake et al., (1994)
introduced a tag-and-exchange strategy, RMCE, which utilises a combination of wild type
FRT and mutant FRT sites flanking a selection marker. The use of heterospecific FRT sites
enabled the double-reciprocal crossover between a donor vector containing the GOI and a
genomic exchange cassette with a compatible set of heterospecific FRT sites. Thus a single
copy of a GOI without any prokaryotic elements could be integrated into a predefined
genomic locus. RMCE has been used by several groups for the generation of master cell
lines in embryonic stem (ES) cells (Seibler et al., 1998), CHO-K1, HEK293 (Nehlsen et al.,
2009), CHO (DUXX-B11) (Mayrhofer et al., 2014), CHO Lec3.2.8.1 (Wilke et al., 2011) and
Spodoptera frugiperda 9 (Sf9) cells (Fernandes et al., 2012). Industrial applications of the
Flp/FRT based RMCE system in CHO cells were described (Rehberger et al., 2013).
Similarly loxP and FRT sites can be used in combination (Froxing) if a non-reversible
approach is desired (Lauth et al., 2002). A strategy which combines the use of different FRT
variants in an inverse oriented homospecifc fashion as well as loxP variants is the
flip-excision (FlEx) system. FlExing introduces an inversely oriented GOI together with a

INTRODUCTION
17
correctly oriented marker gene in the first round of recombination. In the second round of
recombination the GOI and the marker gene are turned around thus reversing their
expressible status (Schnütgen et al., 2003, Schnütgen et al., 2005). The Flp/FRT system was
further brought forward by Turan et al., (2010) which generated additional FRT mutants
and evaluated their capability for self-recognition and level of cross-interaction to enable
their simultaneous use to the classic FRT3/FRTwt combination. The identification of
compatible sets of heterospecific FRT sites enabled the use of multiplexing which targets
two distinct chromosomal exchange cassettes in parallel. To obtain functional FRT mutants
the three rules listed in Table 1-2 needed to be considered when mutating the 8 bp spacer
region of a FRT site. Alternative approaches for the integration of two transgenes in distinct
loci using a combination of the Flp/FRT and the ФC31/attP system were demonstrate in
HEK293 cells (Waldner et al., 2011). An overview of Flp/FRT based methods is shown in
Figure 1-5.
Table 1‐2: Traditional rules determining FRT interaction potential (Turan et al., 2010)
Sequence AT content
Rule 1 No major interruptions of the 5’‐polypyrimidine‐tracts may occur 5’-TCTAGAAA-3’ 3’-AGATCTTT-5’
75 %
Rule 2 Bordering base pairs of the spacer sequence must be unchanged 5’-TCTAGAAA-3’ 3’-AGATCTTT-5’
75 %
Rule 3 The AT content of the spacer sequence must be over 75 % 5‘-TCTAGAAA-3‘ 3‘-AGATCTTT-5‘
75 %
Figure 1‐5: Flp mediated exchange reactions. (A) Flp recombinase can catalyse inversions between inversely oriented homospecific FRT sites which for example are utilized in the FlEx system (described in the text). (B) Equi‐oriented homospecific FRT sites on the other hand catalyse integration or excision reactions. Insertion is prompted against thermodynamic and kinetic hindrances (Flp‐in) whereas entropy driven excision (Flp‐out) reactions are favoured if recombinase activity persists. The FLIRT system (described in the text) is based on the Flp‐in/Flp‐out system. One drawback however is the integration of prokaryotic segments which may trigger heterochromatization and thus epigenetic silencing. (C) RMCE circumvents this problem through the use of heterospecific FRT sites which enable the integration of a GOI without co‐introducing prokaryotic vector elements. Adapted from Turan et al., (2011).
INTRODUCTION
18
1.4.3 The use of FACS for stable cell line development
In this work RMCE is used for the targeted integration of transgenes. No matter which
method is chosen for targeted integration, the appropriate isolation of master cell lines
needs to be put into consideration. The importance of proper master cell line selection and
isolation was highlighted by Liu et al., (2006). Not only should cell lines be screened for
locus integration but also for homogenous unenforced expression to ensure long-term
stability if selective pressure was used for clonal isolation which may otherwise result in
heterogeneous expression level as well as epigenetic silencing. Qiao et al., (2009) even
suggested two rounds of RMCE following FACS. The first after genomic tagging of the
master cell lines and one after a successful round of RMCE to isolate master cell lines with
the desired phenotype and reusable high expressible loci. Thus FACS based methods are
the most suitable for the isolation of master cell lines when avoiding drug selection marker.
The use of fluorescent marker genes for the FACS based isolation of cell lines was
demonstrated by several groups. For example Mancia et al., (2004) separated a eGFP marker
gene with an internal ribosomal entry site (IRES) element from the GOI to avoid direct
proteomic linkage which would otherwise require eGFP removal after purification.
Likewise the direct connection of a fluorescent marker gene to the GOI can be circumvented
when using a modified version of the FLIRT system. If a fluorescent marker gene flanked
with homospecifc FRT3 sites is followed by the GOI during genomic tagging, the fluorescent
marker gene can be removed after clonal isolation of a high producer cell line through
Flp-mediated excision (Kaufman et al., 2008, Wilke et al., 2010). Renschler relies entirely on
FACS for the isolation of RMCE master cell lines (Master TurboCellsTM) that contain an
eGFP marker flanked with heterospecific FRT sites as well as on the isolation of producer
cell line (Producer TurboCellsTM) pools that are 90-99% eGFP negative (Rehberger et al.,
2013). However many groups successfully employ selection traps for the isolation of
producer cell lines (Nehlsen et al., 2009, Wilke et al., 2011, Fernandes et al., 2012). In this
work fluorescent marker genes are used for the isolation of CHO Lec3.2.8.1 master cell lines
after genomic tagging. An introduced selection trap than is used for the isolation of
producer cell lines after successful RMCE to isolate stable producer cell lines.
1.4.4 pFlp‐Bac‐to‐Mam exchange vectors
The multi-host vector pFlp-Bac-to-Mam (pFlpBtM) and its derivative pFlpBtM-II were
developed in our group to enable the fast screening of protein constructs in several
INTRODUCTION
19
expression hosts (Meyer, 2012, Meyer et al., 2013). In this work pFlpBtM vectors were used
as exchange vectors for the generation of stable CHO Lec3.2.8.1 producer cell lines and as
expression vectors in HEK293-6E cells. For the RMCE based generation of stable
CHO Lec3.2.8.1 producer cell lines pFlpBtM vectors comprise heterospecific FRT sites
flanking a GOI as well as a phosphoglycerate kinase (PGK) promoter and a start codon
which activates a selection trap in the previously tagged chromosomal locus upon
successful integration (Wilke et al., 2011). For the transient expression in HEK293-6E
(Durocher et al., 2002) pFlpBtM vectors comprise the EBV origin of replication as well as a
cytomegalovirus (CMV) promoter. All pFlpBtM based vectors can also serve as donor
vectors for the generation of recombinant bacmids using the MultiBac system. Those
bacmids can be utilised for baculovirus expression vector system (BEVS) based protein
production in insect hosts (Berger et al., 2004, Fitzgerald et al., 2007). Detailed information
on the generation and evaluation of pFlpBtM vectors was described previously (Meyer,
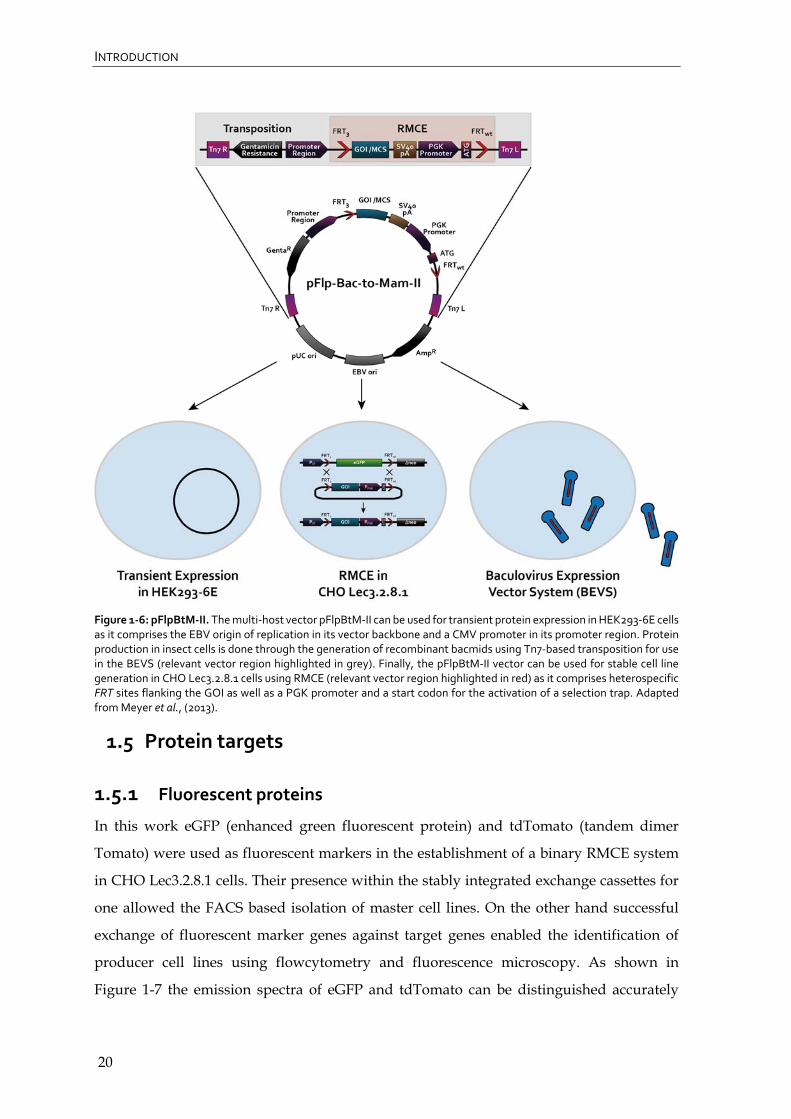
2012, Meyer et al., 2013). A schematic overview of pFlpBtM-II is given in Figure 1-6.
INTRODUCTION
20
Figure 1‐6: pFlpBtM‐II. The multi‐host vector pFlpBtM‐II can be used for transient protein expression in HEK293‐6E cells as it comprises the EBV origin of replication in its vector backbone and a CMV promoter in its promoter region. Protein production in insect cells is done through the generation of recombinant bacmids using Tn7‐based transposition for use in the BEVS (relevant vector region highlighted in grey). Finally, the pFlpBtM‐II vector can be used for stable cell line generation in CHO Lec3.2.8.1 cells using RMCE (relevant vector region highlighted in red) as it comprises heterospecific FRT sites flanking the GOI as well as a PGK promoter and a start codon for the activation of a selection trap. Adapted from Meyer et al., (2013).
1.5 Protein targets
1.5.1 Fluorescent proteins
In this work eGFP (enhanced green fluorescent protein) and tdTomato (tandem dimer
Tomato) were used as fluorescent markers in the establishment of a binary RMCE system
in CHO Lec3.2.8.1 cells. Their presence within the stably integrated exchange cassettes for
one allowed the FACS based isolation of master cell lines. On the other hand successful
exchange of fluorescent marker genes against target genes enabled the identification of
producer cell lines using flowcytometry and fluorescence microscopy. As shown in
Figure 1-7 the emission spectra of eGFP and tdTomato can be distinguished accurately
INTRODUCTION
21
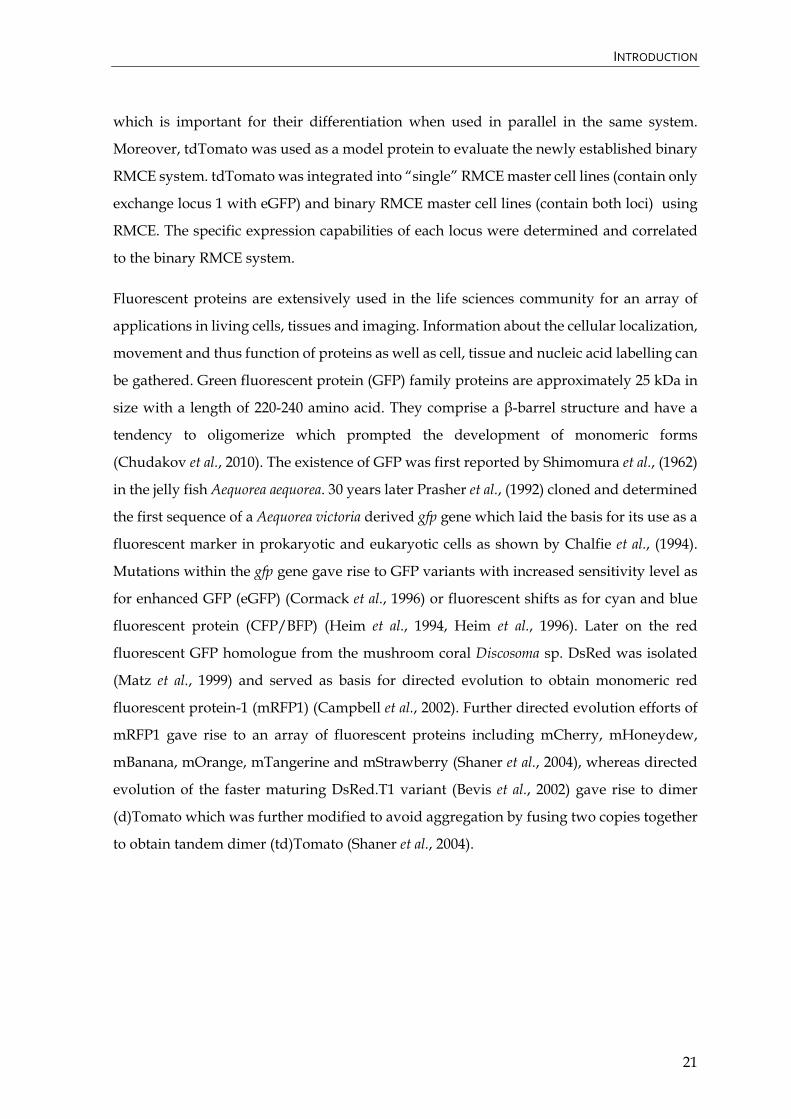
which is important for their differentiation when used in parallel in the same system.
Moreover, tdTomato was used as a model protein to evaluate the newly established binary
RMCE system. tdTomato was integrated into “single” RMCE master cell lines (contain only
exchange locus 1 with eGFP) and binary RMCE master cell lines (contain both loci) using
RMCE. The specific expression capabilities of each locus were determined and correlated
to the binary RMCE system.
Fluorescent proteins are extensively used in the life sciences community for an array of
applications in living cells, tissues and imaging. Information about the cellular localization,
movement and thus function of proteins as well as cell, tissue and nucleic acid labelling can
be gathered. Green fluorescent protein (GFP) family proteins are approximately 25 kDa in
size with a length of 220-240 amino acid. They comprise a β-barrel structure and have a
tendency to oligomerize which prompted the development of monomeric forms
(Chudakov et al., 2010). The existence of GFP was first reported by Shimomura et al., (1962)
in the jelly fish Aequorea aequorea. 30 years later Prasher et al., (1992) cloned and determined
the first sequence of a Aequorea victoria derived gfp gene which laid the basis for its use as a
fluorescent marker in prokaryotic and eukaryotic cells as shown by Chalfie et al., (1994).
Mutations within the gfp gene gave rise to GFP variants with increased sensitivity level as
for enhanced GFP (eGFP) (Cormack et al., 1996) or fluorescent shifts as for cyan and blue
fluorescent protein (CFP/BFP) (Heim et al., 1994, Heim et al., 1996). Later on the red
fluorescent GFP homologue from the mushroom coral Discosoma sp. DsRed was isolated
(Matz et al., 1999) and served as basis for directed evolution to obtain monomeric red
fluorescent protein-1 (mRFP1) (Campbell et al., 2002). Further directed evolution efforts of
mRFP1 gave rise to an array of fluorescent proteins including mCherry, mHoneydew,
mBanana, mOrange, mTangerine and mStrawberry (Shaner et al., 2004), whereas directed
evolution of the faster maturing DsRed.T1 variant (Bevis et al., 2002) gave rise to dimer
(d)Tomato which was further modified to avoid aggregation by fusing two copies together
to obtain tandem dimer (td)Tomato (Shaner et al., 2004).
INTRODUCTION
22
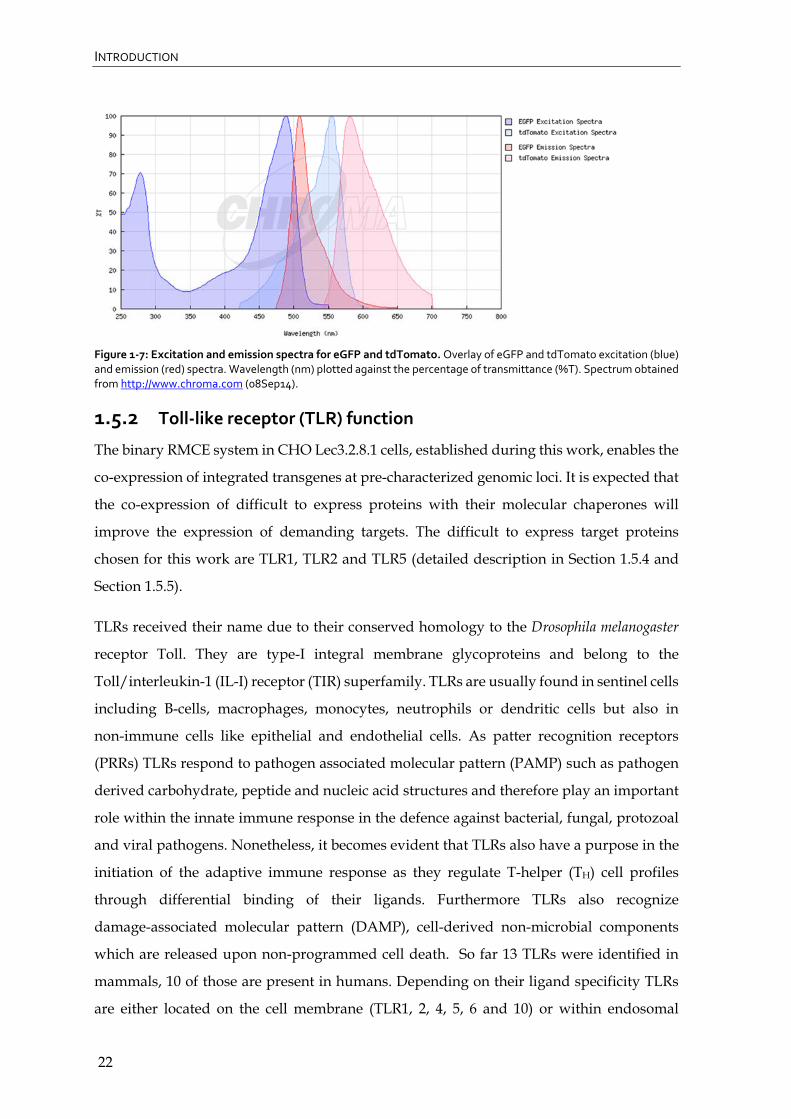
Figure 1‐7: Excitation and emission spectra for eGFP and tdTomato. Overlay of eGFP and tdTomato excitation (blue) and emission (red) spectra. Wavelength (nm) plotted against the percentage of transmittance (%T). Spectrum obtained from http://www.chroma.com (08Sep14).
1.5.2 Toll‐like receptor (TLR) function
The binary RMCE system in CHO Lec3.2.8.1 cells, established during this work, enables the
co-expression of integrated transgenes at pre-characterized genomic loci. It is expected that
the co-expression of difficult to express proteins with their molecular chaperones will
improve the expression of demanding targets. The difficult to express target proteins
chosen for this work are TLR1, TLR2 and TLR5 (detailed description in Section 1.5.4 and
Section 1.5.5).
TLRs received their name due to their conserved homology to the Drosophila melanogaster
receptor Toll. They are type-I integral membrane glycoproteins and belong to the
Toll/interleukin-1 (IL-I) receptor (TIR) superfamily. TLRs are usually found in sentinel cells
including B-cells, macrophages, monocytes, neutrophils or dendritic cells but also in
non-immune cells like epithelial and endothelial cells. As patter recognition receptors
(PRRs) TLRs respond to pathogen associated molecular pattern (PAMP) such as pathogen
derived carbohydrate, peptide and nucleic acid structures and therefore play an important
role within the innate immune response in the defence against bacterial, fungal, protozoal
and viral pathogens. Nonetheless, it becomes evident that TLRs also have a purpose in the
initiation of the adaptive immune response as they regulate T-helper (TH) cell profiles
through differential binding of their ligands. Furthermore TLRs also recognize
damage-associated molecular pattern (DAMP), cell-derived non-microbial components
which are released upon non-programmed cell death. So far 13 TLRs were identified in
mammals, 10 of those are present in humans. Depending on their ligand specificity TLRs
are either located on the cell membrane (TLR1, 2, 4, 5, 6 and 10) or within endosomal
INTRODUCTION
23
compartments (TLR3, 7, 8, 9, 11, 12 and 13). Malfunctioning of the TLR system is associated
with several clinical pictures; including allergies, cancer and inflammatory diseases as well
as neurodegenerative and autoimmune disorders. This makes the elucidation of TLR
signalling pathways, mechanisms and consequently their specific role in innate and
adaptive immunity essential for translational medical applications (Agrawal et al., 2003,
Ishii et al., 2005, Barton et al., 2009, Hidmark et al., 2012, Tang et al., 2012, Raetz et al., 2013).
TLRs are divided into three domains an N-terminal ectodomain (ECD), a single spanning
transmembrane domain and an intracellular TIR domain responsible for downstream
signal transduction. The N-terminal ECD adapts a horseshoe-like structure involved in
ligand recognition. It is composed of 16-28 leucine rich repeat (LRR) modules each
comprising 24 amino acid residues with conserved “LxxLxLxxN” motives (Figure 1-8). The
hydrophobic LRR domain is capped with C- and N-terminal disulphide-bonded caps
(LRR-CT and LRR-NT) which do not comprise any LRR motives and thus protect the
hydrophobic core from solvent and aid domain stabilisation (Jin et al., 2008).
TLR signalling follows two different paths; either the myeloid differentiation
primary-response protein 88 (MyD88)-dependent pathway triggering a nuclear factor
kappa-light-chain-enhancer of activated B cells (NF-κB) response followed by the
transcription of inflammatory cytokines or the MyD88-independent pathway triggering
either a NF-κB response as well as an interferon (IFN) regulatory factor (IRF3) response
followed by the transcription of IFN-β. Ligand binding initiates the dimerization of TLRs
accompanied by conformational changes which activate a downstream cascade. In the
MyD88-dependent pathway the adaptor molecule MyD88 is directly recruited to the TIR
domains of TLR5, 7, 8, 9 and 11 upon receptor dimerization through homodimerization of
its own C-terminal TIR domain. The association of MyD88 with TLR2 and TLR4 is bridged
through the adaptor molecule TIRAP (TIR-domain-containing adaptor protein also known
as MyD88-adaptor-like protein, MAL). In addition to the MyD88-dependent pathway TLR4
also employs the MyD88-independent pathway through the adaptor molecules TRIF
(TIR-domain containing adaptor protein inducing IFN-β) and TRAM (TRIF related adaptor
molecule). In contrast TLR3 employs only the adaptor molecule TRIF (Akira et al., 2004,
Liew et al., 2005, O'Neill et al., 2007, Trinchieri et al., 2007). A schematic overview of TLR
structure and signalling is given in Figure 1-8.
INTRODUCTION
24
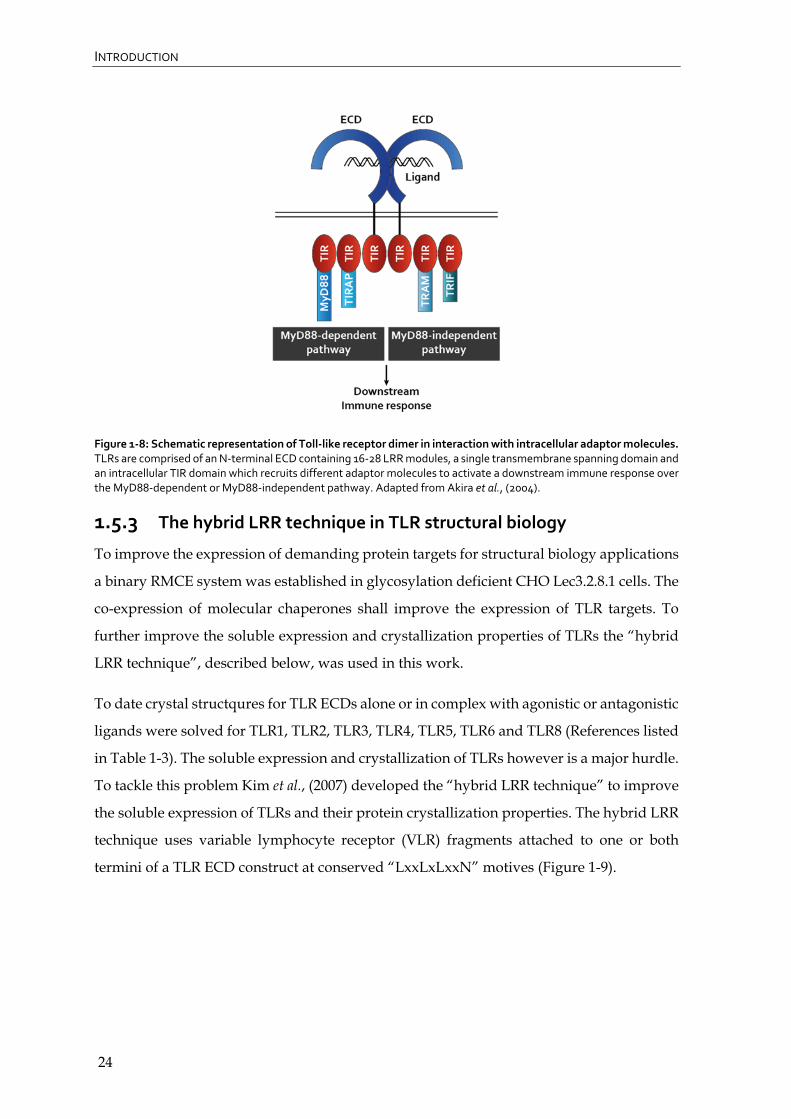
Figure 1‐8: Schematic representation of Toll‐like receptor dimer in interaction with intracellular adaptor molecules. TLRs are comprised of an N‐terminal ECD containing 16‐28 LRR modules, a single transmembrane spanning domain and an intracellular TIR domain which recruits different adaptor molecules to activate a downstream immune response over the MyD88‐dependent or MyD88‐independent pathway. Adapted from Akira et al., (2004).
1.5.3 The hybrid LRR technique in TLR structural biology
To improve the expression of demanding protein targets for structural biology applications
a binary RMCE system was established in glycosylation deficient CHO Lec3.2.8.1 cells. The
co-expression of molecular chaperones shall improve the expression of TLR targets. To
further improve the soluble expression and crystallization properties of TLRs the “hybrid
LRR technique”, described below, was used in this work.
To date crystal structqures for TLR ECDs alone or in complex with agonistic or antagonistic
ligands were solved for TLR1, TLR2, TLR3, TLR4, TLR5, TLR6 and TLR8 (References listed
in Table 1-3). The soluble expression and crystallization of TLRs however is a major hurdle.
To tackle this problem Kim et al., (2007) developed the “hybrid LRR technique” to improve
the soluble expression of TLRs and their protein crystallization properties. The hybrid LRR
technique uses variable lymphocyte receptor (VLR) fragments attached to one or both
termini of a TLR ECD construct at conserved “LxxLxLxxN” motives (Figure 1-9).

INTRODUCTION
25
Figure 1‐9: Hybrid LRR technique. TLR‐VLR hybrids can be obtained by fusion of truncated TLR constructs (blue) with VLR fragments (gray) at conserved LxxLxLxxN motives (red box) using (A) N‐terminal fusion (B) C‐terminal fusion or (C) fusion at both termini. Non‐native amino acids (black) result from the cloning site (Jin et al., 2008).
VLRs belong to the LRR family of proteins. They are found in jawless fish (Pancer et al.,
2004) where an abundant array of VLR variants derived from germline genes VLR-A, VLR-B
(Pancer et al., 2005) and VLR-C (Kasamatsu et al., 2010) regulate adaptive immune
responses. Crystal structures for inshore hagfish Eptatretus burger VLR-A and VLR-B
variants were described by Kim et al., (2007). VLRs are “typical” LRR family proteins
displaying a horseshoe-like structure. Their shape results from conserved asparagine
ladder and phenylalanine spine structures of the LRR module backbone. This hydrophobic
core is flanked by protective caps (LRR-NT and LRR-CT respectively). Sequence variations
are limited to the concave surface where ligand binding occurs (Kim et al., 2007). The hybrid
LRR technique employs the conserved “LxxLxLxxNxL” motive common to all LRR family
proteins. Residues annotated with “x” are exchangeable hydrophilic amino acids which are
exposed at the concave surface of the horseshoe-like structure whereas conserved residues
are responsible for the structural network (Jin et al., 2008). The hybrid LRR technique was
shown to maintain the structural integrity of fusion partners and thus enabled the
truncation of TLR constructs without loss of their protective LRR-NT or LRR-CT caps as
those were replaced by matching hybrid VLR fragments (Kim et al., 2007).
The hybrid LRR technique was used to solve crystal structures for TLR4 (Kim et al., 2007),
TLR1, TLR2, TLR6 (Jin et al., 2007, Kang et al., 2009) and TLR5 (Yoon et al., 2012). TLRs
interact with protein and non-protein ligands using their concave, lateral or convex surface
which induces the dimerization of TLR homo- or heterodimers forming a typical “m”-shape
demonstrated by several crystallographic studies (Jin et al., 2007, Liu et al., 2008, Kang et al.,

INTRODUCTION
26
2009, Park et al., 2009, Yoon et al., 2012, Tanji et al., 2013) (Figure 1-10). A list of currently
available TLR ECD structures with or without bound agonistic or antagonistic ligands is
summarized in Table 1-3.
Figure 1‐10: TLR homo‐and heterodimers. TLR homo‐and heterodimer structures in complex with their ligands are shown for hTLR2‐hTLR1‐Pam3CSK4 (PDB 2Z7X), mTLR2‐mTLR6‐Pam2CSK4 (PDB 3A79), drTLR5‐Flagellin (PDB 3V47), mTLR3‐dsRNA (PDB 3CIY) and hTLR4‐hMD2‐LPS (PDB 3FXI). A homodimer structure without bound ligand is shown for hTLR8 (PDB 3W3G). References are listed in Table 1‐3.
Table 1‐3: Overview of TLR ECD crystals structures with or without bound ligand.
Organism TLR/Complex PBD ID VLR Hybrid Reference
Human TLR1‐TLR2‐Pam3CSK4 2Z7X Yes (Jin et al., 2007)
Mouse TLR2‐mTLR6‐Pam2CSK4 3A79 Yes (Kang et al., 2009)
Mouse TLR2‐lipoteichoic acid 3A7B Yes (Kang et al., 2009)
Mouse TLR2‐PE‐DTPA 3A7C Yes (Kang et al., 2009)
Human TLR3 2A0Z No (Bell et al., 2005)
Human TLR3 1ZIW No (Choe et al., 2005)
Mouse TLR3/dsRNA 3CIY No (Liu et al., 2008)
Human TLR3/mAB1068/mAB12/mAb15 3ULV, 3ULU No (Luo et al., 2012)
Mouse TLR4/MD‐2 complex 2Z64 No (Kim et al., 2007)
Human TLR4 2Z63, 2Z62, 2Z66 Yes (Kim et al., 2007)
Human TLR4/MD‐2/Eritoran 2Z65 Yes (Kim et al., 2007)
Human TLR4‐MD‐2‐LPS dimer 3FXI No (Park et al., 2009)
Mouse TLR4/MD‐2/Re‐LPS 3VQ2 No (Ohto et al., 2012)
Mouse TLR4/MD‐2/lipid IVa 3VQ1 No (Ohto et al., 2012)
Human TLR4 (D299G/T399I)‐MD‐2‐LPS 4G84 No (Ohto et al., 2012)
Zebrafish TLR5 3V44 Yes (Yoon et al., 2012)
Zebrafish TLR5/FliC 3V47 Yes (Yoon et al., 2012)
Human TLR8/TLR8 3W3G No (Tanji et al., 2013)
Human TLR8/TLR8/CL097 3W3J, 3W3N No (Tanji et al., 2013)
Human TLR8/TLR8/CL075 3W3K No (Tanji et al., 2013)
Human TLR8/TLR8/R848 3W3L, 3W3M No (Tanji et al., 2013)
Human TLR8/Ds‐877 3WN4 No (Kokatla et al., 2014)
INTRODUCTION
27
1.5.4 TLR1 and TLR2
For the co-expression in the binary RMCE system established during this work ECD
constructs for mTLR1 and mTLR2 were selected. The co-expression with their molecular
chaperones (described in Section 1.5.6) was predicted to improve the soluble expression for
both. While crystal structures for TLR1 and TLR2 are already available in complex with
di- or tri-acylated lipopeptides (Jin et al., 2007, Kang et al., 2009) no structure for TLR1 or
TLR2 is yet available in complex with a protein ligand. The elucidation of TLR1 and TLR2
structures in complex with curli fibrils was of interest for collaboration partners and thus
was selected for the expression in the binary RMCE system.
TLR1 was first identified by Nomura et al., (1994) as KIAA0012, later on by Taguchi et al.,
(1996) as Toll/Interleukin-1-receptor-Like (TIL) and finally by Rock et al., (1998) as TLR1.
TLR2 was first identified by Chaudhary et al., (1998) as Toll/Interleukin-1-receptor-Like-4
(TIL-4) when searching for human Toll homologues and rediscovered together with other
TLRs by Rock et al., (1998). TLR1 and TLR2 are located on the cell surface of leukocytes,
dendritic cells (DCs), lymphatic endothelial cells and epithelial cells (Muzio et al., 2000,
Furrie et al., 2005, Pegu et al., 2008). TLR2, with TLR1 or TLR6 as co-receptor, recognizes
non-protein ligands including tri-acylated or di-acylated lipopeptides, LPS, lipoteichoic
acids and zymosan (Jin et al., 2007, Kang et al., 2009). Nonetheless a protein-ligand, CsgA,
the main component of amyloid-like curli fibrils expressed in a small subset of
Enterobacteriaceae including Salmonella enterica serotype Typhimurium (S. Typhimurium)
and E.coli was shown to be a TLR2 agonist (Tükel et al., 2005, Tükel et al., 2009, Oppong et
al., 2013). In cooperation with TLR1, TLR2 mediates a ligand induced immune response
upon CsgA recognition (Tükel et al., 2010). A stronger NF-κB response was observed when
CD14, serving as an accessory protein, binds to curli fibres before TLR2-TLR1 activation
(Rapsinski et al., 2013). Amyloid formation in bacteria is of biological importance as part of
the extracellular biofilm matrix. In humans however amyloid formation can cause
neurodegenerative disorders including Alzheimer’s and Huntington’s disease. These
phenotypes result from inflammation-mediated tissue damage from amyloid formation
and deposition (Tükel et al., 2009, Tükel et al., 2010). Interactions of TLR2 with fibrillar
β-amyloid plaques (fAβ) a component of plaques in Alzheimer’s disease (Jana et al., 2008,
Udan et al., 2008, Reed-Geaghan et al., 2009, Liu et al., 2012) and serum amyloid A (SAA)
(Cheng et al., 2008, He et al., 2009) were demonstrated.
INTRODUCTION
28
1.5.5 TLR5
To begin of this work no crystal structure for TLR5 was yet available. Thus the hTLR5 ECD
was chosen as a target for the expression in the binary RMCE system. Meanwhile the crystal
structure for dsTLR5 became available (Yoon et al., 2012). However the expression of human
TLR5 ECDs was shown to be a real challenge (Hong et al., 2012, Yoon et al., 2012) and thus
remained a worthwhile target.
TLR5 was first identified by Chaudhary et al., (1998) as Toll/Interleukin-1-receptor-Like-3
(TIL-3) when searching for human Toll homologues and rediscovered together with other
TLRs by (Rock et al., 1998). TLR5 is located on the cell surface of leukocytes, DCs, lymphatic
endothelial cells and epithelial cells (Chaudhary et al., 1998, Muzio et al., 2000, Miller et al.,
2005, Pegu et al., 2008). So far TLR5 is unique compared to other TLRs as it was shown to
recognize protein-ligands only, namely bacterial flagellin (Hayashi et al., 2001). However
only flagellin monomers are recognized by TLR5 as the 13 amino acid binding site of
flagellin is located within the flagellar filament. Each flagellin monomer comprises 4
domains (D0, D1, D2 and D3). D1, one of the most conserved domains interacts with TLR5
(Smith et al., 2003). This was further confirmed through mutation studies within the D1
domain which eliminated flagellin-TLR5 interactions (Andersen-Nissen et al., 2005) as well
as the flagellin-dsTLR5 crystal structure (Yoon et al., 2012). The flagellin binding site on
TLR5 was studied by several groups using truncation, mutation as well as in silico studies
(Jacchieri et al., 2003, Mizel et al., 2003, Andersen-Nissen et al., 2007). An in silico prediction
which postulated residues 552-561 as potential TLR5 binding site (Jacchieri et al., 2003)
could not be confirmed by in vivo studies which narrowed the TLR5 binding site down to
residues 386-407 including an accessory function of residues 408-425 (Mizel et al., 2003) and
residues 174-401 (Andersen-Nissen et al., 2007) respectively. The flagellin-dsTLR5 crystal
structure revealed two primary binding interfaces of dsTLR5 (Yoon et al., 2012) one within
the experimentally postulated binding sites as well as one located downstream. Moreover
it was revealed that TLR5 binding affinities within different species vary and thus each
species recognises and binds a certain set of bacterial flagellins more or less efficiently
(Andersen-Nissen et al., 2007, Keestra et al., 2008, Metcalfe et al., 2014). Besides its role in
innate and adaptive immunity in which TLR5 supports MHC class-II presentation of
flagellin fragments to CD4 T cells (Letran et al., 2011), the therapeutic relevance of TLR5 is
indicated by its increased presence on breast cancer carcinoma which are highly receptive

INTRODUCTION
29
to TLR5 mediated signal-transduction. Cai et al., (2011) demonstrated that flagellin can
induce anti-carcinogenic effects as a TLR5 agonist by inhibiting proliferation of
carcinogenic cells. Nonetheless TLR and cell-type specific differences have been observed
in tumorigenesis (Cai et al., 2011).
1.5.6 Accessory proteins – GRP94 and PRAT4A
The eukaryotic ER chaperone glucose-regulated protein 94 (GRP94) (alias: heat shock
protein 90b1 (HSP90b1), HSPC4, glycoprotein 96 (gp96), endoplasmin and ERp99) an ER
paralogue to the cytosolic HSP90 and the chaperone-like ER resident protein, protein
associated with toll-like receptor 4A (PRAT4A) (alias: canopy FGF signalling regulator 3
(CNPY3)) were shown to chaperone serval TLRs as described below. In this work mGRP94
and mPRAT4A were used for the co-expression of mTLR1, mTLR2 and hTLR5 ECDs in the
binary CHO Lec3.2.8.1 RMCE system. It was anticipated that the co-expression of TLRs
with molecular chaperones will improve their soluble expression.
GRP94 is divided into three domains. An N-terminal adenosintriphosphate (ATP)ase
domain with intrinsic ATPase activity which binds and hydrolyses ATP is separated by a
non-conserved highly charged intermediate domain from a C-terminal homodimerization
domain which influences enzymatic activity of the ATPase domain. GRP94 is expressed in
most cell types and is induced under stress conditions following the accumulation of
misfolded proteins. (Randow et al., 2001, Liu et al., 2010). The structural basis of GRP94 was
elucidated by Dollins et al., (2007) for canine (cl)GRP94 (73-754Δ287-327) in complex with
adenosine diphosphate (ADP) and the non-hydrolysable ATP analogue
adenylyl-imidodiphosphate (AMPPNP). GRP94 shows a left handed helical twist
(twisted V) conformation which allows C-terminal domain homodimerization but prevents
N-terminal homodimerization. A C-terminal client binding site was suggested and later
confirmed by Wu et al., (2012) which identified a C-terminal loop structure formed by
amino acid residues 652-678 (Figure 1-11). In contrary to GRP94, PRAT4A shows no
intrinsic ATPase activity nor does it influence ATPase activity of GRP94 as co-chaperone
(Liu et al., 2010). Mutation studies demonstrated that PRAT4A interacts differently with
different TLR clients (Kiyokawa et al., 2008).

INTRODUCTION
30
Figure 1‐11: Crystal structure of canine GRP94 dimer (PDB 2O1U). clGRP94 adapts an homodimeric twisted V structure. Each monomer (blue, green) is composed of 3 domains, an N‐terminal ATPase domain (bound ADP shown in red), a charged middle domain and a C‐terminal homodimerization domain. The client binding domain (CBD, yellow) ranges from amino acid residues 652‐678. Adapted from (Dollins et al., 2007, Wu et al., 2012)
The use of immune co-precipitation and knockdown studies typically in HEK cells, B-cells
or macrophages demonstrated that the conformational maturation of TLRs is dependent on
the ER chaperones GRP94 and PRAT4A which regulate TLR cell surface display or
trafficking to lysosomes. Randow et al., (2001) demonstrated that GRP94 is not required for
cell survival even though it represents one of the most abundant ER proteins in a cell.
However GRP94 was shown to be essential for the regulation of innate immunity as it
controls cell surface trafficking of TLR1, TLR2 and TLR4. It was observed that the GRP94
deficient mutant cell line E4.126 derived from murine pre-B-cells (70Z/3) retained expressed
TLRs within the ER and thus inhibited the response to bacterial toxins including LPS
(lipopolysaccharide), LTA (lipoteichoic acid) and PGN (peptidoglycan). A few years later
Yang et al., (2006) demonstrated that the response to TLR ligands is dependent on GRP94
expression for cell surface TLRs (TLR2, TLR4, TLR5) as well as endosomal TLRs (TLR7 and
TLR9) using macrophage-specific GRP94-deficient mice.
The same year Wakabayashi et al., (2006) described another protein which regulates cell
surface expression of TLRs. PRAT4A associates with the immature hypoglycosylated form
of TLR4, but not MD-2 or TLR2, thus regulating trafficking of TLR4 in HEK293, B-cells
and/or DCs. A similar protein which also associates with TLR4, PRAT4B, was identified
through database analysis as it shares 54 % amino acid sequence with PRAT4A (Konno et
al., 2006). In contrary to PRAT4A, PRAT4B was shown to be a negative regulator for TLR
trafficking (Hart et al., 2012). The importance of PRAT4A for innate and adaptive immunity
was demonstrated by the same group as gene-silencing of PRAT4A inhibits not only the
trafficking of TLR4 but also TLR1 to the cell surface as well as TLR9 trafficking to the

INTRODUCTION
31
lysosome. In contrary to their previous results cell surface trafficking of TLR2 trafficking is
also down-regulated but not inhibited (Takahashi et al., 2007). Functional loss of TLR4 and
TLR9 was confirmed by Liu et al., (2010) after PRAT4A knockdown. Furthermore, knock
down studies of PRAT4A added TLR2 and TLR7 to the list of PRAT4A clients (Liu et al.,
2010) as well as TLR5 (Shibata et al., 2012).
It was suggested that GRP94, in contrary to common expectations, does require PRAT4A
as a co-chaperone for TLR trafficking. This was supported by co-localization studies of
PRAT4A and GRP94 in the ER as well as the demonstration of adenosine nucleotide
sensitive chaperone interactions between both. Moreover, it was shown that TLR9 requires
both PRAT4A and GRP94 in a tri-molecular complex for maturation (Liu et al., 2010).
To improve the soluble expression of TLR ECDs in this work the molecular chaperones
mPRAT4A or mGRP94 are stably co-expressed in a binary CHO Lec3.2.8.1 RMCE system.
AIM OF THIS WORK
32
2 Aim of this work
Stable cell line development is a time-consuming process. The generation of homogenous
high producer cell lines does require extensive screening and needs to be repeated for each
individual target (Wurm, 2004). Targeted integration via RMCE however does cut the
timelines for stable cell line development significantly as the integrated gene is
incorporated into a previously tagged chromosomal locus (Wilke et al., 2011). The use of
stable cell lines for protein production does enable the convenient scale up into bioreactors
which is particularly useful for difficult to express protein targets with low volumetric
yields. Nevertheless, the expression of demanding protein targets can also be aided through
the co-expression of protein subunits or accessory molecules (Neuhaus et al., 2006,
Bieniossek et al., 2008). The level of protein production however is not the only bottleneck
that needs to be faced for structural biology applications. Heterogeneous glycosylation
patterns do interfere during crystal formation and thus need to be removed a priori or
glycosylation deficient cell lines such as CHO Lec3.2.8.1 need to be employed (Stanley, 1989,
Aricescu et al., 2006).
The aim of this work focuses on the stable co-expression of difficult to express protein
targets with accessory molecules for structural biology applications. This requires the
establishment of a binary master cell line in glycosylation deficient CHO Lec3.2.8.1 which
will enable the targeted integration of genes at two pre-defined genomic loci via RMCE.
RMCE will ease the generation of homogenous high producer cell lines by reducing
development times for their generation.
The binary RMCE system will be evaluated with the model protein tdTomato. Targeted
integration via RMCE of tdTomato into “single” RMCE master cell lines (with only one
exchange locus) and binary RMCE master cell lines (with both exchange loci) will enable
the determination of specific expression capabilities for each locus and its correlation to the
binary RMCE system. Moreover, the reproducibility of tdTomato expression for each locus
will be determined.
Producer cell lines co-expressing Toll-like receptors in combination with their chaperones
GRP94 or PRAT4A will be generated to improve volumetric yields of soluble protein
production.
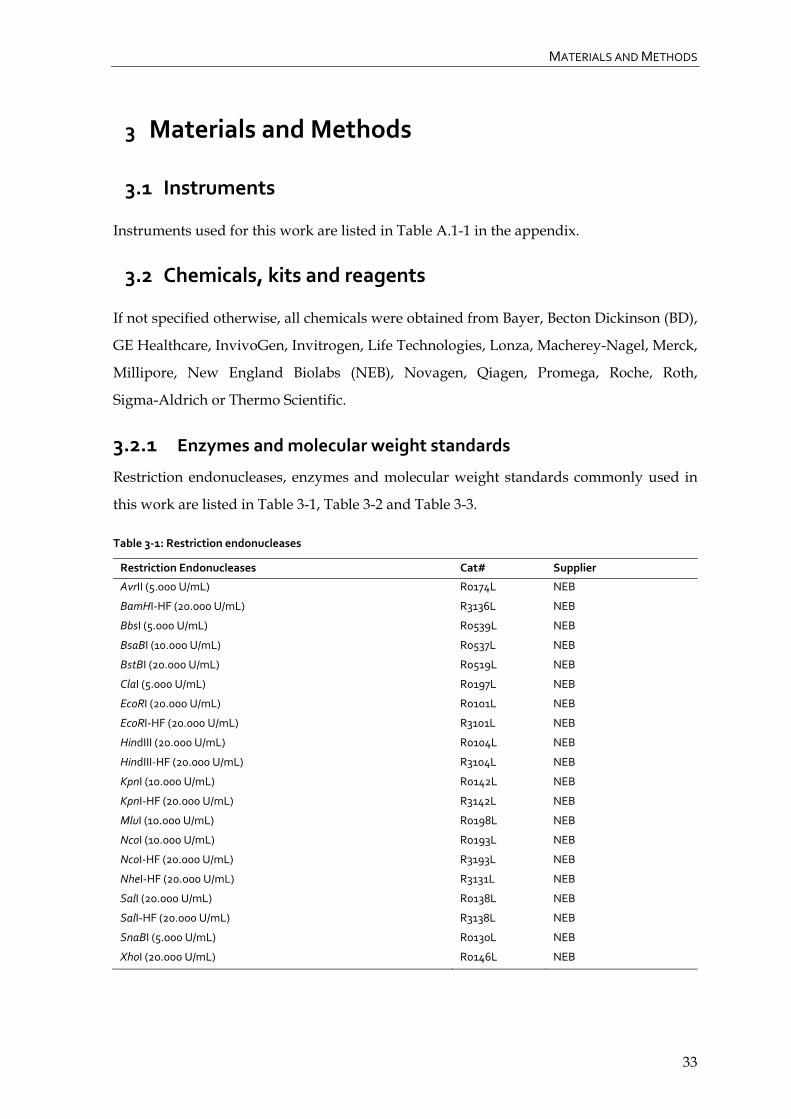
MATERIALS AND METHODS
33
3 Materials and Methods
3.1 Instruments
Instruments used for this work are listed in Table A.1-1 in the appendix.
3.2 Chemicals, kits and reagents
If not specified otherwise, all chemicals were obtained from Bayer, Becton Dickinson (BD),
GE Healthcare, InvivoGen, Invitrogen, Life Technologies, Lonza, Macherey-Nagel, Merck,
Millipore, New England Biolabs (NEB), Novagen, Qiagen, Promega, Roche, Roth,
Sigma-Aldrich or Thermo Scientific.
3.2.1 Enzymes and molecular weight standards
Restriction endonucleases, enzymes and molecular weight standards commonly used in
this work are listed in Table 3-1, Table 3-2 and Table 3-3.
Table 3‐1: Restriction endonucleases
Restriction Endonucleases Cat# Supplier
AvrII (5.000 U/mL) R0174L NEB
BamHI‐HF (20.000 U/mL) R3136L NEB
BbsI (5.000 U/mL) R0539L NEB
BsaBI (10.000 U/mL) R0537L NEB
BstBI (20.000 U/mL) R0519L NEB
ClaI (5.000 U/mL) R0197L NEB
EcoRI (20.000 U/mL) R0101L NEB
EcoRI‐HF (20.000 U/mL) R3101L NEB
HindIII (20.000 U/mL) R0104L NEB
HindIII‐HF (20.000 U/mL) R3104L NEB
KpnI (10.000 U/mL) R0142L NEB
KpnI‐HF (20.000 U/mL) R3142L NEB
MluI (10.000 U/mL) R0198L NEB
NcoI (10.000 U/mL) R0193L NEB
NcoI‐HF (20.000 U/mL) R3193L NEB
NheI‐HF (20.000 U/mL) R3131L NEB
SalI (20.000 U/mL) R0138L NEB
SalI‐HF (20.000 U/mL) R3138L NEB
SnaBI (5.000 U/mL) R0130L NEB
XhoI (20.000 U/mL) R0146L NEB

MATERIALS AND METHODS
34
Table 3‐2: Enzymes
Enzyme Cat# Supplier
T4 DNA Ligase (1.000 U/ mL) 11000324/
14395420
Roche
Antarctic Phosphatase (5.000 U/mL) M0289S NEB
Phusion® Hot Start II DNA Polymerase (2.000 U/mL) F‐549L/ M0530S/ B0515A
Finnzymes/ Thermo
Scientific/ NEB
KOD Hot Start DNA Polymerase (1.000 U/mL) 71086‐3 Novagen/Millipore
DNase I (1ng/µL) N/A MOSB, HZI
Trypsin/ EDTA (1x) L11‐004 PAA Laboratories GmbH
Trypsin/ EDTA (10x) L11‐003 PAA Laboratories GmbH
Table 3‐3: Molecular weight standards
Molecular weight standard Usage Cat# Supplier
Smart Ladder Agarose gel electrophoresis MW‐1700‐10
MW‐1700‐02
Eurogentech
PageRuler Plus prestained SDS‐PAGE SM1811/ 26620 Fermentas / Thermo Scientific
PageRuler unstained SDS‐PAGE SM0661/ 26614 Fermentas / Thermo Scientific
Precision Plus Protein
unstained
SDS‐PAGE 161‐0363 Bio‐Rad
Precision Plus Protein
All blue
SDS‐PAGE 161‐0373 Bio‐Rad
Precision Plus Protein Dual
Color
SDS‐PAGE 161‐0374 Bio‐Rad
3.2.2 Culture media and supplements
Culture media for bacteria (Table 3-4) were prepared in purified water (MilliQ) and
autoclaved at 121 °C before additional compounds were added after being sterile filtered
(0.2 µm). Antibiotics are listed in Table 3-5. Cell culture media and supplements for
mammalian cells are listed in Table 3-6 and Table 3-7; those were either obtained as
ready-to-use solutions or prepared from powdered formulations in MilliQ. Prepared media
were sterilized by a custom made filtration line containing the component Sealkleen
(ZLK702G23LHKH4, Pall) in which the medium is run through two nylon filters with
decreasing pore size (1 µm and 0.2 µm).
Table 3‐4: Media for bacterial cultures
Medium Composition Final concentration Cat# Supplier
LB‐medium
(Luria‐Bertani)
(Bertani, 1951)
BactoTM Tryptone
BactoTM Yeast Extract
NaCl
10 g/L
5 g/L
5 g/L
211705
212750
3957.2
BD
BD
Roth
LB‐agar LB‐medium
BactoTM‐Agar
‐
16 g/L
‐
214010
‐
BD
Medium Antibiotics Cat# Supplier
E. coli FAST‐Media TB Liquid Blas 100 µg/ mL blasticidin fas‐bl‐l InvivoGen
E. coli FastMedia BLAS AGAR 100 µg/ mL blasticidin fas‐bl‐s InvivoGen
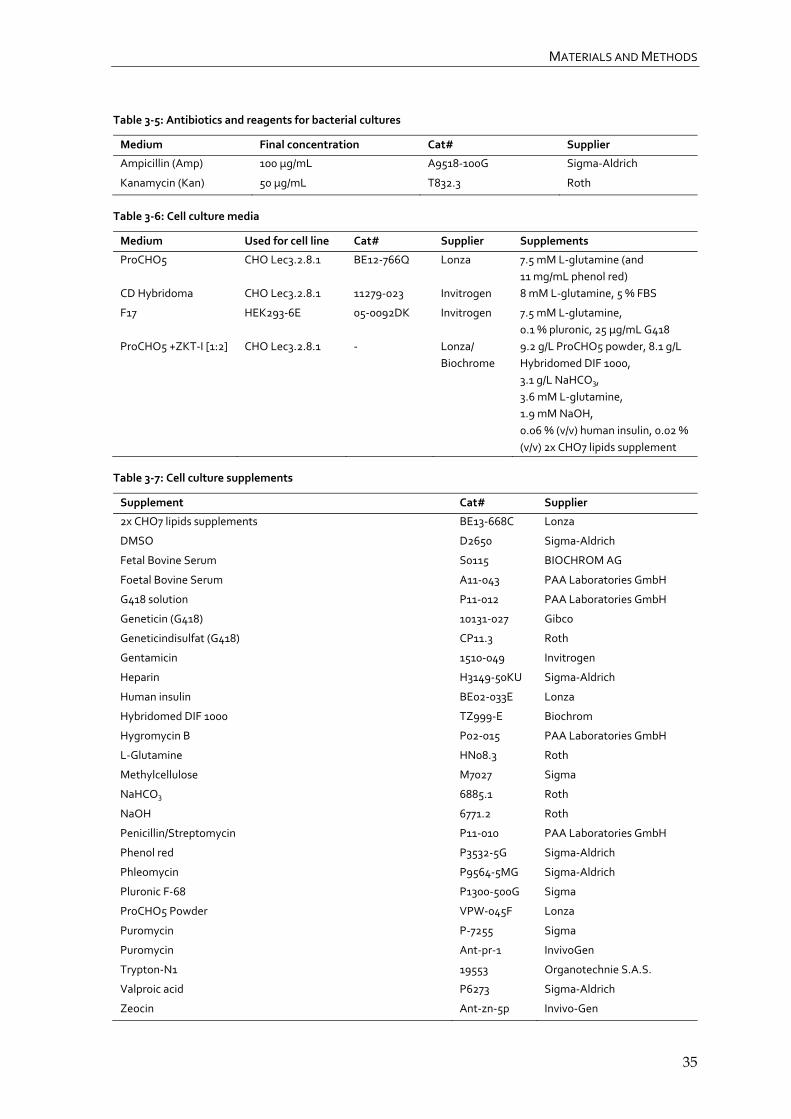
MATERIALS AND METHODS
35
Table 3‐5: Antibiotics and reagents for bacterial cultures
Medium Final concentration Cat# Supplier
Ampicillin (Amp) 100 µg/mL A9518‐100G Sigma‐Aldrich
Kanamycin (Kan) 50 µg/mL T832.3 Roth
Table 3‐6: Cell culture media
Medium Used for cell line Cat# Supplier Supplements
ProCHO5
CHO Lec3.2.8.1 BE12‐766Q Lonza 7.5 mM L‐glutamine (and
11 mg/mL phenol red)
CD Hybridoma CHO Lec3.2.8.1 11279‐023 Invitrogen 8 mM L‐glutamine, 5 % FBS
F17 HEK293‐6E 05‐0092DK Invitrogen 7.5 mM L‐glutamine,
0.1 % pluronic, 25 µg/mL G418
ProCHO5 +ZKT‐I [1:2] CHO Lec3.2.8.1 ‐ Lonza/
Biochrome
9.2 g/L ProCHO5 powder, 8.1 g/L
Hybridomed DIF 1000,
3.1 g/L NaHCO3,
3.6 mM L‐glutamine,
1.9 mM NaOH,
0.06 % (v/v) human insulin, 0.02 %
(v/v) 2x CHO7 lipids supplement
Table 3‐7: Cell culture supplements
Supplement Cat# Supplier
2x CHO7 lipids supplements BE13‐668C Lonza
DMSO D2650 Sigma‐Aldrich
Fetal Bovine Serum S0115 BIOCHROM AG
Foetal Bovine Serum A11‐043 PAA Laboratories GmbH
G418 solution P11‐012 PAA Laboratories GmbH
Geneticin (G418) 10131‐027 Gibco
Geneticindisulfat (G418) CP11.3 Roth
Gentamicin 1510‐049 Invitrogen
Heparin H3149‐50KU Sigma‐Aldrich
Human insulin BE02‐033E Lonza
Hybridomed DIF 1000 TZ999‐E Biochrom
Hygromycin B P02‐015 PAA Laboratories GmbH
L‐Glutamine HN08.3 Roth
Methylcellulose M7027 Sigma
NaHCO3 6885.1 Roth
NaOH 6771.2 Roth
Penicillin/Streptomycin P11‐010 PAA Laboratories GmbH
Phenol red P3532‐5G Sigma‐Aldrich
Phleomycin P9564‐5MG Sigma‐Aldrich
Pluronic F‐68 P1300‐500G Sigma
ProCHO5 Powder VPW‐045F Lonza
Puromycin P‐7255 Sigma
Puromycin Ant‐pr‐1 InvivoGen
Trypton‐N1 19553 Organotechnie S.A.S.
Valproic acid P6273 Sigma‐Aldrich
Zeocin Ant‐zn‐5p Invivo‐Gen

MATERIALS AND METHODS
36
3.2.3 Transfection reagents
Transfection of recombinant plasmid DNA into CHO cell lines was done using
electroporation based nucleofection (Lonza). A cationic lipofection technique on the other
hand was used for transfection in HEK cells (Table 3-8).
Table 3‐8: Transfection reagents
Reagent Used for cell line Cat# Supplier
Polyethylenimine (linear,
MW ~25 kDa)
HEK293‐6E 23966 Polysciences
Nucleofection solution CHO Lec3.2.8.1 VCV‐1003 Lonza
3.3 Oligonucleotides and plasmids
Plasmids used in this work are listed and explained in Table 3-9. Oligonucleotides are listed
in Table 3-10; these were purchased from MWG Eurofines Operon in HPLC purified quality
and used for cloning and sequencing.
Table 3‐9: Plasmids
pFlpBtM variants
pFlpBtM‐I (Steffen Meyer, HZI)
Vector used as exchange vector for stable genomic integration via RMCE into CHO Lec3.2.8.1 master cell lines
employing FRT3 and FRTwt sites. Also used as donor vector for the creation of bacmids via TN7 transposition sites and
transient expression in insect cells.
pFlpBtM‐II (Steffen Meyer,HZI)
Versatile multi‐host expression and donor vector for stable genomic integration via RMCE into CHO Lec3.2.8.1 master
cell lines employing FRT3 and FRTwt sites, transient expression in HEK293‐6E and TN7 based transposition for the
creation of bacmids. It also contains an inducible T7 promoter for the expression in E.coli. The version pFlpBtM‐II(beta)
lacks a Shine‐Dalgarno sequence and differs in the design of the MCS and included tags.
pFlpBtM‐II_F13/F14
Versatile multi host expression and donor vector derived from pFlpBtM‐II. FRT sites FRT3 and FRTwt were replaced
against FRT sites FRT13 and FRT14 to enable stable genomic integration via RMCE into binary CHO Lec3.2.8.1 master
cell lines. Cloning of pFlpBtM‐II_F13/F14 exchange vector is described in this work.
Tagging vectors
pEF‐FS‐eGFP‐dneo (Sonja Wilke, HZI)
Tagging vector originally used for genomic integration of an eGFP expressing exchange locus
(FRT3‐eGFP‐FRTwt‐Δneo) into CHO Lec3.2.8.1 cells resulting in the RMCE master cell lines SWI3_26 and
SMT_dneo(2)_24 used in this work.
pEF‐FS‐eGFP‐dpuro (Sonja Wilke, HZI)
Tagging vector derived from tagging vector pEF‐FS‐eGFP‐dneo containing a puromycin selection trap instead of a
neomycin selection trap. Tagging vector pEF‐FS‐eGFP‐dpuro was used for cloning of the tagging vector
pEF‐FS‐tdTomato‐dpuro described in this work.
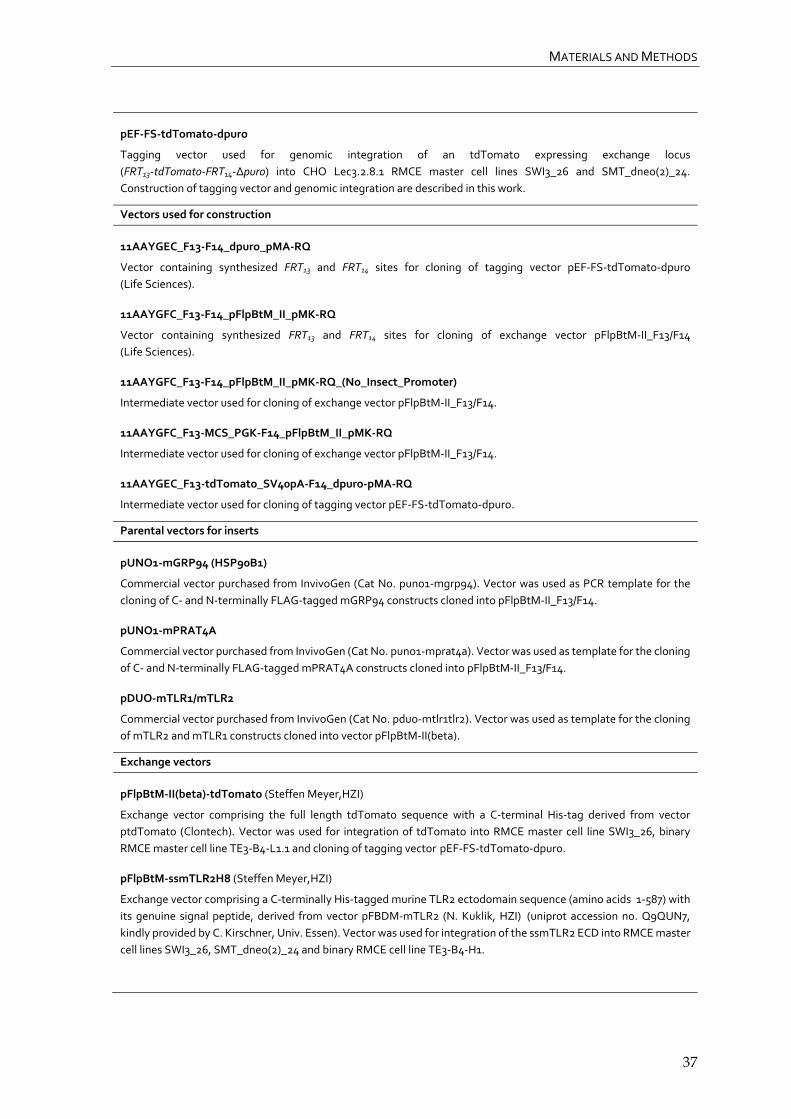
MATERIALS AND METHODS
37
pEF‐FS‐tdTomato‐dpuro
Tagging vector used for genomic integration of an tdTomato expressing exchange locus
(FRT13‐tdTomato‐FRT14‐Δpuro) into CHO Lec3.2.8.1 RMCE master cell lines SWI3_26 and SMT_dneo(2)_24.
Construction of tagging vector and genomic integration are described in this work.
Vectors used for construction
11AAYGEC_F13‐F14_dpuro_pMA‐RQ
Vector containing synthesized FRT13 and FRT14 sites for cloning of tagging vector pEF‐FS‐tdTomato‐dpuro
(Life Sciences).
11AAYGFC_F13‐F14_pFlpBtM_II_pMK‐RQ
Vector containing synthesized FRT13 and FRT14 sites for cloning of exchange vector pFlpBtM‐II_F13/F14
(Life Sciences).
11AAYGFC_F13‐F14_pFlpBtM_II_pMK‐RQ_(No_Insect_Promoter)
Intermediate vector used for cloning of exchange vector pFlpBtM‐II_F13/F14.
11AAYGFC_F13‐MCS_PGK‐F14_pFlpBtM_II_pMK‐RQ
Intermediate vector used for cloning of exchange vector pFlpBtM‐II_F13/F14.
11AAYGEC_F13‐tdTomato_SV40pA‐F14_dpuro‐pMA‐RQ
Intermediate vector used for cloning of tagging vector pEF‐FS‐tdTomato‐dpuro.
Parental vectors for inserts
pUNO1‐mGRP94 (HSP90B1)
Commercial vector purchased from InvivoGen (Cat No. puno1‐mgrp94). Vector was used as PCR template for the
cloning of C‐ and N‐terminally FLAG‐tagged mGRP94 constructs cloned into pFlpBtM‐II_F13/F14.
pUNO1‐mPRAT4A
Commercial vector purchased from InvivoGen (Cat No. puno1‐mprat4a). Vector was used as template for the cloning
of C‐ and N‐terminally FLAG‐tagged mPRAT4A constructs cloned into pFlpBtM‐II_F13/F14.
pDUO‐mTLR1/mTLR2
Commercial vector purchased from InvivoGen (Cat No. pduo‐mtlr1tlr2). Vector was used as template for the cloning
of mTLR2 and mTLR1 constructs cloned into vector pFlpBtM‐II(beta).
Exchange vectors
pFlpBtM‐II(beta)‐tdTomato (Steffen Meyer,HZI)
Exchange vector comprising the full length tdTomato sequence with a C‐terminal His‐tag derived from vector
ptdTomato (Clontech). Vector was used for integration of tdTomato into RMCE master cell line SWI3_26, binary
RMCE master cell line TE3‐B4‐L1.1 and cloning of tagging vector pEF‐FS‐tdTomato‐dpuro.
pFlpBtM‐ssmTLR2H8 (Steffen Meyer,HZI)
Exchange vector comprising a C‐terminally His‐tagged murine TLR2 ectodomain sequence (amino acids 1‐587) with
its genuine signal peptide, derived from vector pFBDM‐mTLR2 (N. Kuklik, HZI) (uniprot accession no. Q9QUN7,
kindly provided by C. Kirschner, Univ. Essen). Vector was used for integration of the ssmTLR2 ECD into RMCE master
cell lines SWI3_26, SMT_dneo(2)_24 and binary RMCE cell line TE3‐B4‐H1.

MATERIALS AND METHODS
38
pFlpBtM‐II(beta)‐sshTLR5‐1‐391‐VLR‐TEV‐STrEP‐H8
Exchange vector comprising a human TLR5 ectodomain sequence (amino acids 1‐391) with its genuine signal peptide,
derived from vector pFlpBtM‐II‐sshTLR5 wt‐c‐QC_R387Q_(Klon3) (Steffen Meyer,HZI). The sshTLR5 construct is
C‐terminally fused to a VLR fragment (amino acids 133‐200). The C‐terminal twin‐Strep‐tag and His‐tag are separated
through a TEV cleavage site. Vector was used for integration of the sshTLR5 ECD into RMCE master cell lines
SMT_dneo(2)_24 and binary RMCE cell line TE3‐B4‐H1.
pFlpBtM‐II‐sshTLR5 wt‐c‐QC_R387Q_(Klon3) (Steffen Meyer,HZI)
Exchange vector comprising a human TLR5 ectodomain sequence (amino acids 1‐639) with its genuine signal peptide.
Exchange vector was used as parental vector for the amplification of sshTLR5‐1‐391 and thus cloning of
pFlpBtM‐II(beta)‐sshTLR5‐1‐391‐VLR‐TEV‐STrEP‐H8.
pFlpBtM‐IIbeta‐mTLR1_1‐408‐VLR‐TEV‐Strep‐H8
Exchange vector comprising a murine TLR1 ectodomain sequence (amino acids 1‐408) with its genuine signal peptide,
derived from vector pDUO‐mTLR1/mTLR2 (InvivoGen). The mTLR1 construct is C‐terminally fused to a VLR fragment
(amino acids 133‐200). The C‐terminal twin‐Strep‐tag and His‐tag are separated through a TEV cleavage site. Cloning
of the vector is described in this work. Vector was used for transient expression of the mTLR1 ECD in HEK293‐6E.
pFlpBtM‐IIbeta‐mTLR1_1‐455‐VLR‐TEV‐Strep‐H8
Exchange vector comprising a murine TLR1 ectodomain sequence (amino acids 1‐455) with its genuine signal peptide,
derived from vector pDUO‐mTLR1/mTLR2 (InvivoGen). The mTLR1 construct is C‐terminally fused to a VLR fragment
(amino acids 133‐200). The C‐terminal twin‐Strep‐tag and His‐tag are separated through a TEV cleavage site. Cloning
of the vector is described in this work. Vector was used for transient expression of the mTLR1 ECD in HEK293‐6E and
stable integration into the binary RMCE master cell line TE3‐B4‐H1.
pFlpBtM‐IIbeta‐mTLR1_1‐500‐VLR‐TEV‐Strep‐H8
Exchange vector comprising a murine TLR1 ectodomain sequence (amino acids 1‐500) with its genuine signal peptide,
derived from vector pDUO‐mTLR1/mTLR2 (InvivoGen). The mTLR1 construct is C‐terminally fused to a VLR fragment
(amino acids 133‐200). The C‐terminal twin‐Strep‐tag and His‐tag are separated through a TEV cleavage site. Cloning
of the vector is described in this work. Vector was used for transient expression of the mTLR1 ECD in HEK293‐6E.
pFlpBtM II F13_FLAG_mGRP94_F14
Exchange vector comprising the full length murine GRP94 sequence with a N‐terminal FLAG‐tag, derived from vector
pUNO1‐mGRP94 (InvivoGen). Vector was used for transient expression of mGRP94 in HEK293‐6E.
pFlpBtM_II_F13_FLAG_mPRAT4A_F14
Exchange vector comprising the full length murine PRAT4A sequence with a N‐terminal FLAG‐tag, derived from
vector pUNO1‐mPRAT4A (InvivoGen). Vector was used for transient expression of mPRAT4A in HEK293‐6E.
pFlpBtM_II_F13_mGRP94_F14
Exchange vector comprising the full length murine GRP94 sequence with a C‐terminal FLAG‐tag, derived from vector
pUNO1‐mGRP94 (InvivoGen). Vector was used for transient expression of mGRP94 in HEK293‐6E and stable
integration into the binary RMCE cell line TE3‐B4‐H1.
pFlpBtM_II_F13_mPRAT4A_F14
Exchange vector comprising the full length murine PRAT4A sequence with a C‐terminal FLAG‐tag, derived from
vector pUNO1‐mPRAT4A (InvivoGen). Vector was used for transient expression of mPRAT4A in HEK293‐6E and
stable integration into the binary RMCE cell line TE3‐B4‐H1.
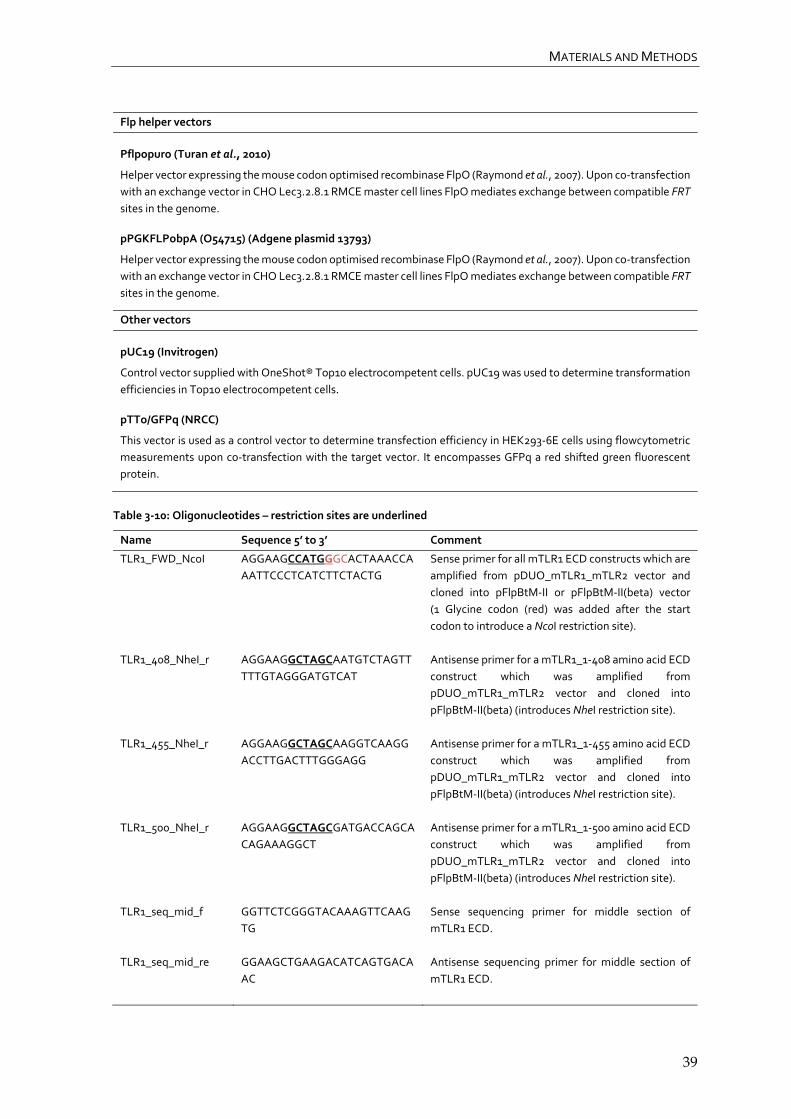
MATERIALS AND METHODS
39
Flp helper vectors
Pflpopuro (Turan et al., 2010)
Helper vector expressing the mouse codon optimised recombinase FlpO (Raymond et al., 2007). Upon co‐transfection
with an exchange vector in CHO Lec3.2.8.1 RMCE master cell lines FlpO mediates exchange between compatible FRT
sites in the genome.
pPGKFLPobpA (O54715) (Adgene plasmid 13793)
Helper vector expressing the mouse codon optimised recombinase FlpO (Raymond et al., 2007). Upon co‐transfection
with an exchange vector in CHO Lec3.2.8.1 RMCE master cell lines FlpO mediates exchange between compatible FRT
sites in the genome.
Other vectors
pUC19 (Invitrogen)
Control vector supplied with OneShot® Top10 electrocompetent cells. pUC19 was used to determine transformation
efficiencies in Top10 electrocompetent cells.
pTTo/GFPq (NRCC)
This vector is used as a control vector to determine transfection efficiency in HEK293‐6E cells using flowcytometric
measurements upon co‐transfection with the target vector. It encompasses GFPq a red shifted green fluorescent
protein.
Table 3‐10: Oligonucleotides – restriction sites are underlined
Name Sequence 5’ to 3’ Comment
TLR1_FWD_NcoI AGGAAGCCATGGGCACTAAACCA
AATTCCCTCATCTTCTACTG
Sense primer for all mTLR1 ECD constructs which are
amplified from pDUO_mTLR1_mTLR2 vector and
cloned into pFlpBtM‐II or pFlpBtM‐II(beta) vector
(1 Glycine codon (red) was added after the start
codon to introduce a NcoI restriction site).
TLR1_408_NheI_r AGGAAGGCTAGCAATGTCTAGTT
TTTGTAGGGATGTCAT
Antisense primer for a mTLR1_1‐408 amino acid ECD
construct which was amplified from
pDUO_mTLR1_mTLR2 vector and cloned into
pFlpBtM‐II(beta) (introduces NheI restriction site).
TLR1_455_NheI_r AGGAAGGCTAGCAAGGTCAAGG
ACCTTGACTTTGGGAGG
Antisense primer for a mTLR1_1‐455 amino acid ECD
construct which was amplified from
pDUO_mTLR1_mTLR2 vector and cloned into
pFlpBtM‐II(beta) (introduces NheI restriction site).
TLR1_500_NheI_r AGGAAGGCTAGCGATGACCAGCA
CAGAAAGGCT
Antisense primer for a mTLR1_1‐500 amino acid ECD
construct which was amplified from
pDUO_mTLR1_mTLR2 vector and cloned into
pFlpBtM‐II(beta) (introduces NheI restriction site).
TLR1_seq_mid_f GGTTCTCGGGTACAAAGTTCAAG
TG
Sense sequencing primer for middle section of
mTLR1 ECD.
TLR1_seq_mid_re GGAAGCTGAAGACATCAGTGACA
AC
Antisense sequencing primer for middle section of
mTLR1 ECD.

MATERIALS AND METHODS
40
TLR5_1‐391NheRev AGGAGCTAGCGAGATCCAAGGTC
TGTAATTTTTCCAG
Antisense primer for a sshTLR5_1‐391 amino acid
ECD construct which was amplified from pFlpBtM‐II‐
sshTLR5 wt‐c‐QC_R387Q_(Klon3) (introduces NheI
restriction site).
BamHI‐Nco‐For AGGAGGATCCAACCATGGGAGAT
CATCTTCACCTTCTCCTAGGAGTG
GTGC
Sense primer for a sshTLR5_1‐391 amino acid ECD
construct which was amplified from pFlpBtM‐II‐
sshTLR5 wt‐c‐QC_R387Q_(Klon3) (introduces BamHI
and NcoI restriction sites). Primer also introduces 4
silent mutations.
PRAT_Nco_F_FLAG AGGAAGCCATGGACTACAAGGAC
GACGACGACAAGGAGTCCATGTC
TGAGCTCGCG
Sense primer for mPRAT4A construct with
N‐terminal FLAG tag (red). For amplification from
pUNO1‐mPRAT4A vector. Introducing a N‐terminal
FLAG‐tag between start codon and mPRAT4A and an
NcoI restriction site. Cloned into pFlpBtM‐II_F13/F14.
mPRAT4A_NcoI_F AGGAAGCCATGGAGTCCATGTCT
GAGCTCGCG
Sense primer for mPRAT4A construct with
C‐terminal FLAG tag. For amplification from
pUNO1‐mPRAT4A vector. Introducing a NcoI
restriction site. Cloned into pFlpBtM‐II_F13/F14.
PRAT_MluI_R_FLAG CTTCCTACGCGTTACTTGTCGTCG
TCGTCCTTGTAGTCCAGCTCATCA
GGGGGGCTGTGTGGGA
Antisense primer mPRAT4A construct with
C‐terminal FLAG tag. For amplification from
pUNO1‐mPRAT4A vector. Cloned into
pFlpBtM‐II_F13/F14, this primer removes the
Strep‐tag, His‐tag and the original stop codon from
pFlpBtM‐II_F13/F14 vector. Instead, a FLAG‐tag (red)
is introduced followed by a stop codon as part of the
MluI site.
mPRAT4A_MluI_R CTTCCTACGCGTTACAGCTCATCA
GGGGGGCTG
Antisense primer for mPRAT4A construct with
N‐terminal FLAG tag. For amplification from
pUNO1‐mPRAT4A vector. Includes a MluI restriction
site. When cloned into pFlpBtM‐II_F13/F14 it removes
the Strep‐tag, His‐tag and the original stop codon
from pFlpBtM‐II_F13/F14 vector. Instead a stop
codon is introduced as part of the MluI site.
GRP_MluI_R_FLAG CTTCCTACGCGTTACTTGTCGTCG
TCGTCCTTGTAGTCCAATTCATCC
TTCTCTGTAGATTCC
Antisense primer for mGRP94 with C‐terminal FLAG
tag (red). For amplification from pUNO1‐mGRP94
vector. Introduces a MluI restriction site for cloning
into pFlpBtM‐II_F13/F14 which removes the Strep‐
tag, His‐tag and the original Stop codon from
pFlpBtM‐II_F13/F14 vector. Instead a FLAG‐tag is
introduced followed by a stop codon as part of the
MluI site.
mGRP94_MluI_R CTTCCTACGCGTTACAATTCATCC
TTCTCTGTAGATTCC
Antisense primer for mGRP94 with C‐terminal FLAG
tag. For amplification from pUNO1‐mGRP94 vector.
Introduces MluI restriction site for cloning into
pFlpBtM‐II_F13/F14 which removes the Strep‐tag,
His‐tag and the original Stop codon from

MATERIALS AND METHODS
41
pFlpBtM‐II_F13/F14 vector. Therefore a stop codon is
introduced as part of the MluI site.
GRP_ClaI_F_FLAG AGGAAGATCGATTTAAAGGAGAT
ATACCATGGACTACAAGGACGAC
GACGACAAGAGGGTCCTGTGGGT
GTTGG
Sense primer for mGRP94 with N‐terminal FLAG tag.
For amplification from pUNO1‐mGRP94 vector.
Primer contains a ClaI site as the NcoI site cannot be
used for cloning as it is present within mGRP94.
Instead the BstBI site within pFlpBtM‐II_F13/F14 will
be used for cloning, however as the PCR fragment
cannot be cut with BstBI either, the compatible ClaI
site will be introduced which will destroy the BstBI
site after cloning into pFlpBtM‐II_F13/F14.
Furthermore the Shine Dalgarno sequence (orange)
needs to be reintroduced as it will be cut out using the
BstBI cloning site in pFlpBtM‐II. Furthermore a N‐
terminal FLAG‐tag (red) is introduced between the
start codon and mGRP94.
mGRP94_ClaI_F AGGAAGATCGATTTAAAGGAGAT
ATACCATGAGGGTCCTGTGGGTG
TT
Sense primer for mGRP94 with C‐terminal FLAG tag.
For amplification from pUNO1‐mGRP94 vector.
Primer contains a ClaI site as the NcoI site cannot be
used for cloning as it is present within mGRP94.
Instead the BstBI site within pFlpBtM‐II_F13/F14 will
be used for cloning, however as the PCR Fragment
cannot be cut with BstBI either, the compatible ClaI
site will be introduced which will destroy the BstBI
site after cloning into pFlpBtM‐II_F13/F14.
Furthermore the Shine Dalgarno sequence (orange)
needs to be reintroduced as it will be cut out using the
BstBI cloning site in pFlpBtM‐II.
pFlpBtN13_seq GGATCCGAAGTTCCTATTCCG Sense sequencing primer for pFlpBtM‐II_13/14
vector.
pFlpBtM_seq_for CGGATCGGGAGATCAGCTTGAAG Sense sequencing primer for pFlpBtM vector.
pFlpBtM_Seq_rev CAGCCATACCACATTTGTAGAGG Antisense sequencing primer for pFlpBtM vector.
TLR1_seq_mid_f GGTTCTCGGGTACAAAGTTCAAG
TG
Sense sequencing primer for internal section of
mTLR1.
TLR1_seq_mid_re GGAAGCTGAAGACATCAGTGACA
AC
Antisense sequencing primer for internal section of
mTLR1.
Cassette‐neo‐AS TCAGAAGAACTCGTCAAGAAGGC
GATAG
Antisense primer for genomic PCR annealing at the
end of the Δneo selection trap.
Cassett‐puro‐AS TCAGGCACCGGGCTTGCGGGTCA
TGC
Antisense primer for genomic PCR annealing at the
end Δpuro selection trap.
Cassette‐pEF‐S GCTCCGGTGCCCGTCAGTGGGCA
GAGCG
Sense primer for genomic PCR annealing at the
beginning of the pEF promoter.
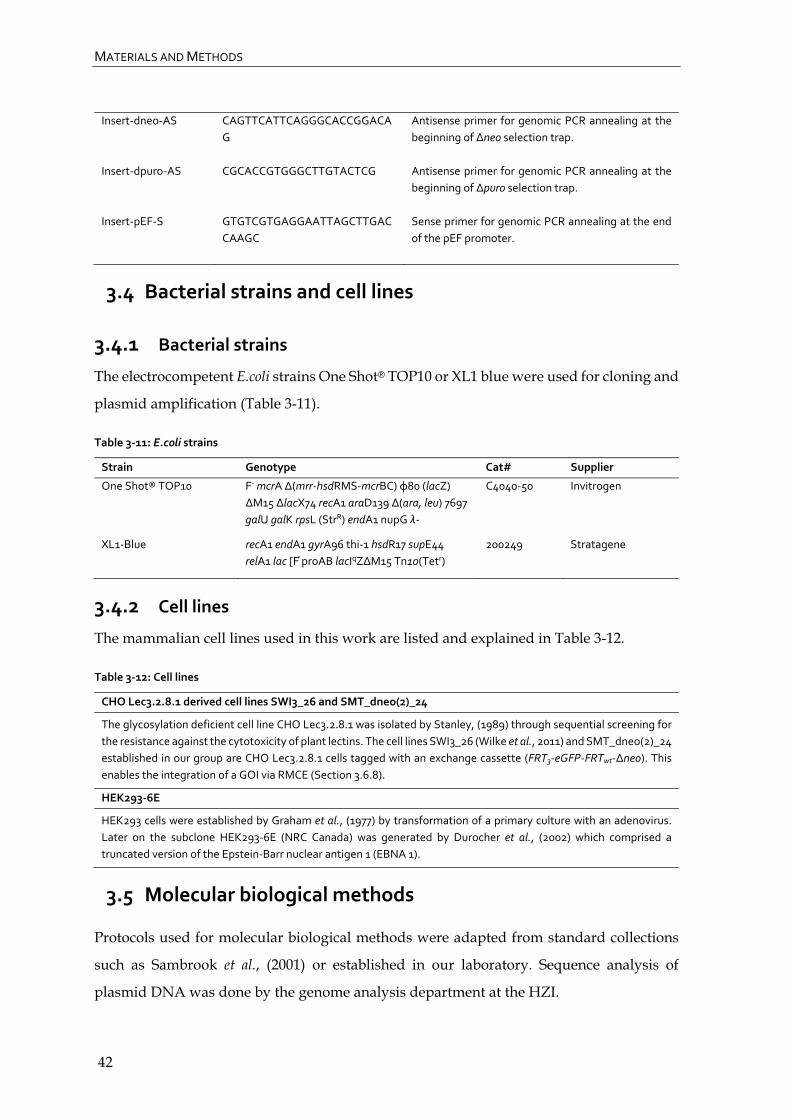
MATERIALS AND METHODS
42
Insert‐dneo‐AS CAGTTCATTCAGGGCACCGGACA
G
Antisense primer for genomic PCR annealing at the
beginning of Δneo selection trap.
Insert‐dpuro‐AS CGCACCGTGGGCTTGTACTCG Antisense primer for genomic PCR annealing at the
beginning of Δpuro selection trap.
Insert‐pEF‐S GTGTCGTGAGGAATTAGCTTGAC
CAAGC
Sense primer for genomic PCR annealing at the end
of the pEF promoter.
3.4 Bacterial strains and cell lines
3.4.1 Bacterial strains
The electrocompetent E.coli strains One Shot® TOP10 or XL1 blue were used for cloning and
plasmid amplification (Table 3-11).
Table 3‐11: E.coli strains
Strain Genotype Cat# Supplier
One Shot® TOP10 F‐ mcrA Δ(mrr‐hsdRMS‐mcrBC) φ80 (lacZ)
ΔM15 ΔlacΧ74 recA1 araD139 Δ(ara, leu) 7697
galU galK rpsL (StrR) endA1 nupG λ‐
C4040‐50 Invitrogen
XL1‐Blue recA1 endA1 gyrA96 thi‐1 hsdR17 supE44
relA1 lac [F proAB lacIqZ∆M15 Tn10(Tetr)
200249 Stratagene
3.4.2 Cell lines
The mammalian cell lines used in this work are listed and explained in Table 3-12.
Table 3‐12: Cell lines
CHO Lec3.2.8.1 derived cell lines SWI3_26 and SMT_dneo(2)_24
The glycosylation deficient cell line CHO Lec3.2.8.1 was isolated by Stanley, (1989) through sequential screening for
the resistance against the cytotoxicity of plant lectins. The cell lines SWI3_26 (Wilke et al., 2011) and SMT_dneo(2)_24
established in our group are CHO Lec3.2.8.1 cells tagged with an exchange cassette (FRT3‐eGFP‐FRTwt‐Δneo). This
enables the integration of a GOI via RMCE (Section 3.6.8).
HEK293‐6E
HEK293 cells were established by Graham et al., (1977) by transformation of a primary culture with an adenovirus.
Later on the subclone HEK293‐6E (NRC Canada) was generated by Durocher et al., (2002) which comprised a
truncated version of the Epstein‐Barr nuclear antigen 1 (EBNA 1).
3.5 Molecular biological methods
Protocols used for molecular biological methods were adapted from standard collections
such as Sambrook et al., (2001) or established in our laboratory. Sequence analysis of
plasmid DNA was done by the genome analysis department at the HZI.
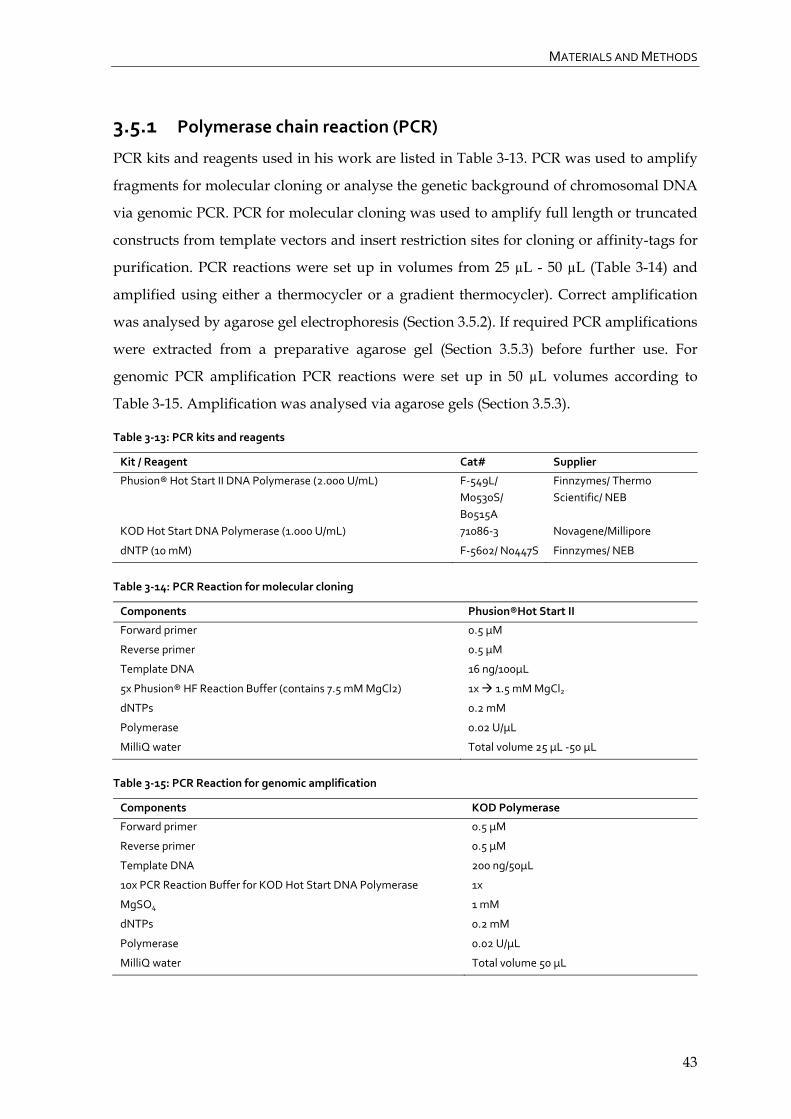
MATERIALS AND METHODS
43
3.5.1 Polymerase chain reaction (PCR)
PCR kits and reagents used in his work are listed in Table 3-13. PCR was used to amplify
fragments for molecular cloning or analyse the genetic background of chromosomal DNA
via genomic PCR. PCR for molecular cloning was used to amplify full length or truncated
constructs from template vectors and insert restriction sites for cloning or affinity-tags for
purification. PCR reactions were set up in volumes from 25 µL - 50 µL (Table 3-14) and
amplified using either a thermocycler or a gradient thermocycler). Correct amplification
was analysed by agarose gel electrophoresis (Section 3.5.2). If required PCR amplifications
were extracted from a preparative agarose gel (Section 3.5.3) before further use. For
genomic PCR amplification PCR reactions were set up in 50 µL volumes according to
Table 3-15. Amplification was analysed via agarose gels (Section 3.5.3).
Table 3‐13: PCR kits and reagents
Kit / Reagent Cat# Supplier
Phusion® Hot Start II DNA Polymerase (2.000 U/mL) F‐549L/ M0530S/ B0515A
Finnzymes/ Thermo
Scientific/ NEB
KOD Hot Start DNA Polymerase (1.000 U/mL) 71086‐3 Novagene/Millipore
dNTP (10 mM) F‐5602/ N0447S Finnzymes/ NEB
Table 3‐14: PCR Reaction for molecular cloning
Components Phusion®Hot Start II
Forward primer 0.5 µM
Reverse primer 0.5 µM
Template DNA 16 ng/100µL
5x Phusion® HF Reaction Buffer (contains 7.5 mM MgCl2) 1x 1.5 mM MgCl2
dNTPs 0.2 mM
Polymerase 0.02 U/µL
MilliQ water Total volume 25 µL ‐50 µL
Table 3‐15: PCR Reaction for genomic amplification
Components KOD Polymerase
Forward primer 0.5 µM
Reverse primer 0.5 µM
Template DNA 200 ng/50µL
10x PCR Reaction Buffer for KOD Hot Start DNA Polymerase 1x
MgSO4 1 mM
dNTPs 0.2 mM
Polymerase 0.02 U/µL
MilliQ water Total volume 50 µL

MATERIALS AND METHODS
44
Table 3‐16: (Gradient) Thermocycler conditions for molecular cloning
Program Steps Temperature Time Cycles
Initial denaturation 98 °C 1 min
Denaturation 98 °C 30 sec
Annealing
(adjusted using gradient PCR in a range
suitable for the primers Tm)
49 °C – 72°C 30 sec x 30 cycles
Extension 72 °C 1 min
Final extension 72 °C 10 min
Pause 10 °C For ever
Table 3‐17: (Gradient) Thermocycler conditions for genomic PCR
Program Steps Temperature Time Cycles
Initial denaturation 94 °C 5 min
Denaturation 94 °C 1 sec
Annealing 72 °C 1 min x 35 cycles
Extension 68 °C 4 min
Final extension 68 °C 10 min
Pause 10 °C For ever
3.5.2 Agarose gel electrophoresis
DNA samples obtained from PCR amplifications (Section 3.5.1) or restriction digests
(Section 3.5.4) were analysed using agarose gel electrophoresis. 0.8 % (w/v) agarose in TAE
buffer was boiled in a microwave and cooled down to approximately 60 °C before the
addition of 5-10 µL ethidium bromide. Well number and sizes were adjusted with the
appropriate combs. DNA samples were mixed with 6x DNA loading buffer, applied to the
wells and run at 70 V - 100 V. The gels were documented under UV illumination at 254 nm.
Consumables for agarose gel electrophoresis are listed in Table 3-18.
Table 3‐18: Consumables for agarose gel electrophoresis
Reagent Cat# Supplier
LE Agarose 840004 Biozymes
LE GP Agarose 850074 Biozymes
LE Agarose 500042 Lonza
Ethidium bromide (10 mg/mL) E1510‐10ML Sigma
Buffer Composition Cat# Supplier
TAE buffer 35.4 mM Trizma® base T1503‐1KG Sigma
0.1 % acetic acid 3738.5 Roth
1 mM EDTA A1103.1000 AppliChem
pH 8.5
6 x DNA loading buffer 0.4 % (w/v) glycerol p.A. 1.04092.1000 Merck
10 % (v/v) 100x bromphenol blue A512.1 Roth
0.03 M EDTA A1103.1000 AppliChem

MATERIALS AND METHODS
45
3.5.3 DNA extraction
The NucleoSpin® Extract II kit (MN, Cat# 740609.150) was used for the extraction of
linearized plasmids, DNA fragments and PCR products. The DNA extraction was done
according to the manufacturer’s protocol.
3.5.4 Digestion of DNA with restriction endonuclease
Restriction digests were generally set up in a 40 µL reaction volume with 5 µg – 10 µg
plasmid DNA in an appropriate NEBuffer, 0.5 U/µL – 1.0 U/µL of the required restriction
endonucleases and 1x BSA (bovine serum albumin) if required. The reaction mixtures were
incubated for 2 h – 3.5 h at the temperature instructed from the manufacturer and heat-
inactivated afterwards if possible. If required the digests were done sequentially with either
adding a second enzyme after the first digest directly to the reaction mixture and adjusting
the temperature or isolating the required fragment from an preparative 0.8 % agarose gel
(Sections 3.5.2) and setting up a new restriction digest. Plasmid backbones were
dephosphorylated to avoid religation by adding 10 U antarctic phosphatase (NEB, Cat#
M0289S) and NEBuffer for antarctic phosphatase to the restriction digest and incubating it
for 20 min at 37 °C. All digests were stored at -20 °C for storage. Restriction digests made
for testing plasmid construct integrity were typically made with 500 ng plasmid DNA in a
30 µL reaction volume.
3.5.5 Ligation of DNA fragments
To prepare a ligation as well as controls for re-ligation and no ligation, a ligation master
mix was prepared containing the ligation buffer (Roche, Cat# 14028100), 20 ng/µL
linearized vector DNA. For the ligation the insert DNA in a 1:3 molar ration and 1 U T4
DNA ligase (Roche, Cat# 14295420) were added to 20 µL ligation master mix, only 1 U T4
DNA ligase into the re-ligation control and neither T4 DNA ligase nor insert DNA into the
negative control. The samples were ligated for 16 h at 12 °C in a Thermocycler.
3.5.6 Preparation of electrocompetent cells
For the preparation of electrocompetent cells glycerol stocks of E.coli One Shot® TOP10 or
XL1 blue were stroke out on non-selective LB-agar plates and incubated overnight at 37 °C.
An isolated colony was used to inoculate a 40 mL pre-culture at 37 °C overnight shaking at
130-160 rpm. The pre-culture was used in a 1:100 or 1:50 dilution to inoculate the main

MATERIALS AND METHODS
46
culture (500 mL – 2 L of bacterial culture) and grown at 37 °C and 130-160 rpm until an
optical density (OD)600 between 0.5-1.0 was reached. Sterile centrifuge tubes were used to
chill the cell suspension on ice for at least 30 min and mixed occasionally to avoid a
temperature gradient. Centrifugation of the chilled bacterial suspension for 10 min at 4 °C
and 3000 rpm was followed by a washing step with sterile ice-cold HEPES-glycerol wash
buffer (1 mM HEPES, 10 % (v/v) glycerol, pH 7.0). For each pellet obtained from 1 L of
bacterial culture 500 mL of sterile ice-cold HEPES-glycerol wash buffer were used. The
centrifugation and washing step was repeated after pooling the cell pellets if required in
250 mL HEPES-glycerol wash buffer. The newly obtained pellet was resuspended in 20 mL
ice-cold 10 % glycerol and transferred to sterile Oak Ridge SS34 centrifuge tubes and
centrifuged again at 3000 rpm for 10 min. The harvested pellet was take up in 1 mL – 3 mL
ice-cold sterile 10 % glycerol and aliquoted in sterile Eppendorf tubes, shock frozen in liquid
nitrogen and stored at -80 °C.
3.5.7 Transformation of competent bacteria
Before electroporation the Gene Pulser® Cuvette (Cat# 165-2086, Bio-Rad) was chilled on
ice. 2 µL (~4 ng) of plasmid DNA were mixed with 50 µL – 60 µL of electrocompetent cells
and incubated on ice for 1 min. The Bio-Rad Gene PulseTM was set to a capacitance of 25 µFD
and 2.5 kV. The Bio-Rad Controller was set to 200 Ω and the Bio-Rad capacity extender to
126 µFD. The dried cuvette was placed in the chamber slide and a pulse applied once. After
addition of 1 mL LB-medium the cells were incubated between 30 min – 60 min at 37 °C
and 300 rpm. 20 µL – 200 µL of bacterial suspension were plated on selective LB-agar plates
and incubated overnight at 37 °C.
3.5.8 Bacterial pre‐cultures
Bacterial pre-cultures were prepare by inoculation of 3 mL – 4 mL LB medium containing
the appropriate antibiotics with a colony picked from an LB agar plate or a 1:1000 dilution
of an existing bacterial culture. The pre-cultures were grown at 37 °C and 130 rpm overnight
and can be used for the inoculation of larger volumes of LB medium for the preparation of
glycerol stocks or plasmid preparations.
3.5.9 Glycerol stock
To enable the quick preparation of new plasmids, 8 % glycerol stocks were prepared and
stored at -80 °C. To do so 50 mL LB medium with the appropriate antibiotics were
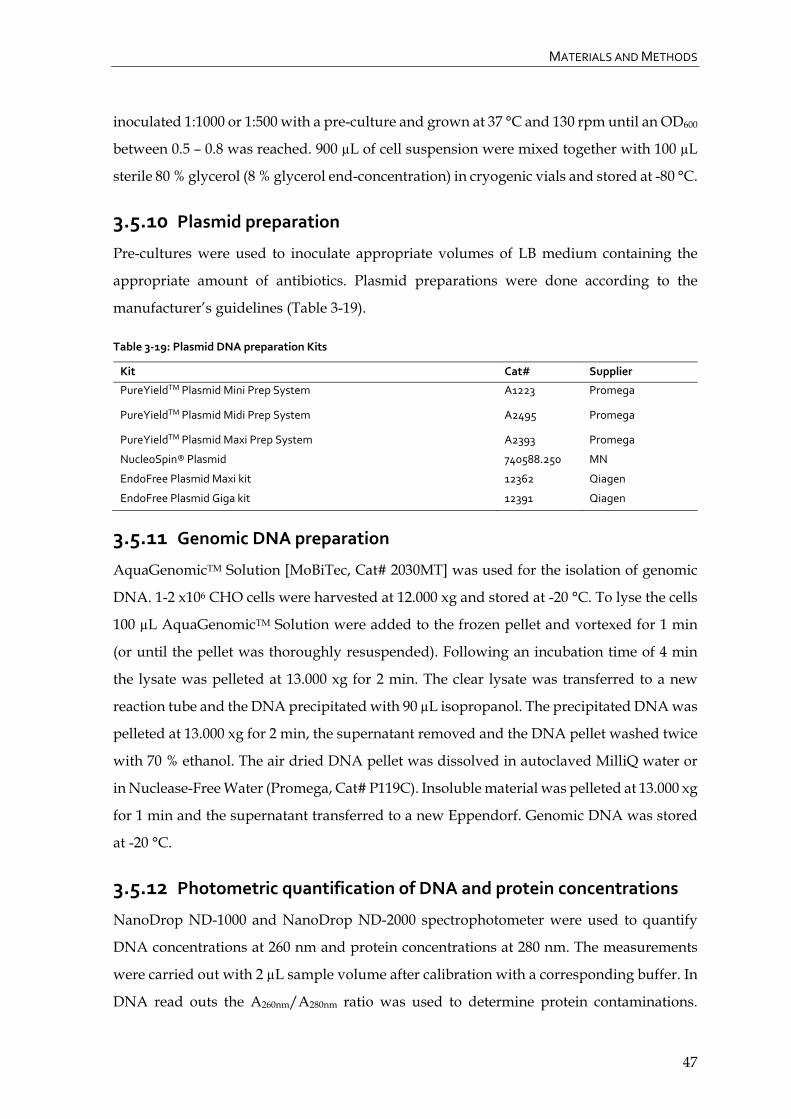
MATERIALS AND METHODS
47
inoculated 1:1000 or 1:500 with a pre-culture and grown at 37 °C and 130 rpm until an OD600
between 0.5 – 0.8 was reached. 900 µL of cell suspension were mixed together with 100 µL
sterile 80 % glycerol (8 % glycerol end-concentration) in cryogenic vials and stored at -80 °C.
3.5.10 Plasmid preparation
Pre-cultures were used to inoculate appropriate volumes of LB medium containing the
appropriate amount of antibiotics. Plasmid preparations were done according to the
manufacturer’s guidelines (Table 3-19).
Table 3‐19: Plasmid DNA preparation Kits
Kit Cat# Supplier
PureYieldTM Plasmid Mini Prep System A1223 Promega
PureYieldTM Plasmid Midi Prep System A2495 Promega
PureYieldTM Plasmid Maxi Prep System A2393 Promega
NucleoSpin® Plasmid 740588.250 MN
EndoFree Plasmid Maxi kit 12362 Qiagen
EndoFree Plasmid Giga kit 12391 Qiagen
3.5.11 Genomic DNA preparation
AquaGenomicTM Solution [MoBiTec, Cat# 2030MT] was used for the isolation of genomic
DNA. 1-2 x10⁶ CHO cells were harvested at 12.000 xg and stored at -20 °C. To lyse the cells
100 µL AquaGenomicTM Solution were added to the frozen pellet and vortexed for 1 min
(or until the pellet was thoroughly resuspended). Following an incubation time of 4 min
the lysate was pelleted at 13.000 xg for 2 min. The clear lysate was transferred to a new
reaction tube and the DNA precipitated with 90 µL isopropanol. The precipitated DNA was
pelleted at 13.000 xg for 2 min, the supernatant removed and the DNA pellet washed twice
with 70 % ethanol. The air dried DNA pellet was dissolved in autoclaved MilliQ water or
in Nuclease-Free Water (Promega, Cat# P119C). Insoluble material was pelleted at 13.000 xg
for 1 min and the supernatant transferred to a new Eppendorf. Genomic DNA was stored
at -20 °C.
3.5.12 Photometric quantification of DNA and protein concentrations
NanoDrop ND-1000 and NanoDrop ND-2000 spectrophotometer were used to quantify
DNA concentrations at 260 nm and protein concentrations at 280 nm. The measurements
were carried out with 2 µL sample volume after calibration with a corresponding buffer. In
DNA read outs the A260nm/A280nm ratio was used to determine protein contaminations.
MATERIALS AND METHODS
48
Ratios of 1.8 -2.0 were considered pure. In protein read outs the Beer-Lambert law (equation
below) had to be considered and the acquired absorbance values needed to be divided
through the molar extension coefficient (ε) of each target protein to obtain the correct
protein concentration. The molar extinction coefficients for each protein target were
calculated by VectorNTI.
c Protein concentration [mg/mL]
A280 Absorbance at 280 nm
ε Molar extinction coefficient [mL mg‐1 cm‐1]
l Length [cm]
3.6 Cell culture
3.6.1 Cell culture consumables
Cell culture consumables are listed in Table A.1-2 in the appendix.
3.6.2 Maintaining cells in culture
Cell lines were maintained as suspension cultures in flat bottom shake flasks on orbital
shakers. Media and supplements were used according to Table 3-6 and Table 3-7.
CHO Lec3.2.8.1 cells were cultivated at 37 °C and 110 rpm in a humidified atmosphere with
5 % CO2. Adherent CHO Lec3.2.8.1 cells were incubated at 37 °C at 8 % CO2. Cells were
routinely split every 3-4 days with a seeding cell density of 2-3 x10⁵ cells/mL to maintain
an exponential growth phase. Adherent cells were expanded to larger multi-well plates or
transferred to suspension culture when reaching a confluency of approximately 80 %.
Expansion of adherent cells was done as follows; the culture medium was removed and the
cell layer trypsinized with 50 µL – 1 mL 1x trypsin/EDTA. The cells were pelleted at 180 xg
for 4 min and resuspended in culture medium.
HEK293-6E were cultivated at 37 °C and 110 rpm in a humidified atmosphere with 5 % CO2.
Cells were routinely split every 3-4 days with a seeding cell density of 3 x10⁵ cells/mL to
maintain an exponential growth phase.

MATERIALS AND METHODS
49
3.6.3 Determination of cell number and viability
Determination of cell number and cell viability was done by the trypan blue dye exclusion
method with a Neubauer hemocytometer or flowcytometry after propidium iodide
staining. If cells contained mCherry or tdTomato cassettes no propidium iodide staining
was used and thus only a measure of cell density but no measure of cell viability was
performed in such cases. Both dyes can only permeate the cell membranes of dead cells and
thus cause staining (blue and red respectively).
Using the trypan blue exclusion method cell suspensions were mixed 1:1 with 0.5 % trypan
blue, transferred to one chamber of the Neubauer hemocytometer and viable (white) and
non-viable (blue) cells were counted in 2 or 4 big squares under the light microscope. Cell
density and viability were calculated according to the equations below.
10 .
% 100
Using the flow cytometer (Guava EasyCyteTM) cell suspensions were mixed 1:10 with
1x PBS (phosphate buffer saline) if cell viability was also determined a final concentration
of 50 µg/mL propidium iodide was added. (Section 3.6.10).
3.6.4 Cryopreservation
For long term storage cell banks were kept in vapour phase over liquid nitrogen. Cells were
harvested from suspension culture by centrifugation at 180 xg for 4 min. The pellets were
resuspended in freezing medium (80 % culture medium, 10 % dimethylsulfoxid (DMSO,
Sigma, Cat# D2650) and 0.01 % methylcellulose) at a cell density of 0.5 x10⁷ cells/mL.
Cryogenic vials were filled with 1.8 mL cell suspension and transferred to a special freezing
container in isopropanol which constantly decreases the temperature for -1 °C/min.
Freezing container were stored at -70 °C for 24 h before transferring the cryogenic vials to
the nitrogen tank.
3.6.5 Revitalisation
Cells were thawed and washed with 10 mL of culture medium, mixed and centrifuged
again at 180 xg for 4 min. The pellet was resuspended in 30 mL culture medium.
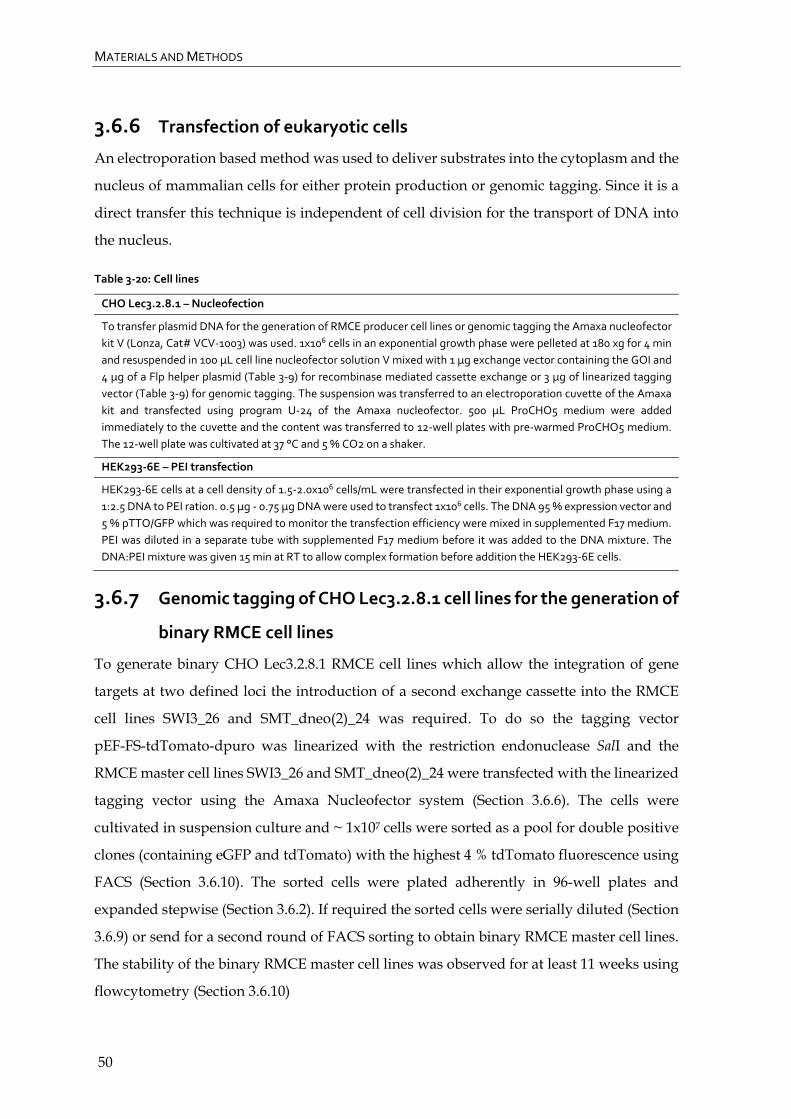
MATERIALS AND METHODS
50
3.6.6 Transfection of eukaryotic cells
An electroporation based method was used to deliver substrates into the cytoplasm and the
nucleus of mammalian cells for either protein production or genomic tagging. Since it is a
direct transfer this technique is independent of cell division for the transport of DNA into
the nucleus.
Table 3‐20: Cell lines
CHO Lec3.2.8.1 – Nucleofection
To transfer plasmid DNA for the generation of RMCE producer cell lines or genomic tagging the Amaxa nucleofector
kit V (Lonza, Cat# VCV‐1003) was used. 1x10⁶ cells in an exponential growth phase were pelleted at 180 xg for 4 min
and resuspended in 100 µL cell line nucleofector solution V mixed with 1 µg exchange vector containing the GOI and
4 µg of a Flp helper plasmid (Table 3‐9) for recombinase mediated cassette exchange or 3 µg of linearized tagging
vector (Table 3‐9) for genomic tagging. The suspension was transferred to an electroporation cuvette of the Amaxa
kit and transfected using program U‐24 of the Amaxa nucleofector. 500 µL ProCHO5 medium were added
immediately to the cuvette and the content was transferred to 12‐well plates with pre‐warmed ProCHO5 medium.
The 12‐well plate was cultivated at 37 °C and 5 % CO2 on a shaker.
HEK293‐6E – PEI transfection
HEK293‐6E cells at a cell density of 1.5‐2.0x10⁶ cells/mL were transfected in their exponential growth phase using a
1:2.5 DNA to PEI ration. 0.5 µg ‐ 0.75 µg DNA were used to transfect 1x10⁶ cells. The DNA 95 % expression vector and
5 % pTTO/GFP which was required to monitor the transfection efficiency were mixed in supplemented F17 medium.
PEI was diluted in a separate tube with supplemented F17 medium before it was added to the DNA mixture. The
DNA:PEI mixture was given 15 min at RT to allow complex formation before addition the HEK293‐6E cells.
3.6.7 Genomic tagging of CHO Lec3.2.8.1 cell lines for the generation of
binary RMCE cell lines
To generate binary CHO Lec3.2.8.1 RMCE cell lines which allow the integration of gene
targets at two defined loci the introduction of a second exchange cassette into the RMCE
cell lines SWI3_26 and SMT_dneo(2)_24 was required. To do so the tagging vector
pEF-FS-tdTomato-dpuro was linearized with the restriction endonuclease SalI and the
RMCE master cell lines SWI3_26 and SMT_dneo(2)_24 were transfected with the linearized
tagging vector using the Amaxa Nucleofector system (Section 3.6.6). The cells were
cultivated in suspension culture and ~ 1x10⁷ cells were sorted as a pool for double positive
clones (containing eGFP and tdTomato) with the highest 4 % tdTomato fluorescence using
FACS (Section 3.6.10). The sorted cells were plated adherently in 96-well plates and
expanded stepwise (Section 3.6.2). If required the sorted cells were serially diluted (Section
3.6.9) or send for a second round of FACS sorting to obtain binary RMCE master cell lines.
The stability of the binary RMCE master cell lines was observed for at least 11 weeks using
flowcytometry (Section 3.6.10)
MATERIALS AND METHODS
51
3.6.8 Generation of producer cell lines by RMCE
RMCE master cell lines were cultivated in ProCHO5 medium. Three days before
transfection the cells were split to 2x10⁵ cells/mL to ensure an exponential growth phase.
Transfection of the RMCE master cell lines was done with the Amaxa nucleofector kit V
(Section 3.6.6). The next day the cells were pelleted at 180 xg for 4 min, resuspended in
10 mL CD Hybridoma medium and transferred to a 100 mm cell culture dish to grow
adherently. The Corning dish was cultivated at 37 °C and 8 % CO2. The CD Hybridoma
medium was exchanged every 2-3 days. From day 5 after transfection antibiotic pressure
was applied through the addition of 2 mg/mL G418 to the CD Hybridoma medium during
medium exchange. 1-2 weeks after application of antibiotic pressure the colonies were
picked from the Corning dish and transferred to 96-well plates containing CD Hybridoma
medium with G418 and left to grow at 37 °C and 8 % CO2 . At a cell density of approximately
50 % - 80 % positive cell clones were isolated using serial dilutions (Section 3.6.9) in 96-well
plates with CD Hybridoma medium. To obtain clonal isolates this step was repeated as
often as required. Alternatively cells were directly picked semi-sterile under the microscope
and transferred to 96-well plates after florescence analysis. After clonal isolation the cells
were stepwise expanded to 6-well plates. To transfer the cells to suspension culture the cells
were trypsinized, pelleted at 180 xg for 4 min and resuspended in ProCHO5 medium with
0.01 U/mL heparin to avoid clumping but antibiotic pressure was removed. Flowcytometry
was used to confirm the successful cassette exchange as this resulted in the loss of the stably
integrated fluorescent marker gene.
Binary RMCE cell lines (Section 3.6.7) were produced similarly. However, the cassettes
were exchanged sequentially as the simultaneous exchange of both loci against a GOI did
not yield enough positive clones to enable their isolation (data not shown). Thus locus 2
(FRT13-tdTomato-FRT14-Δpuro) was generally exchanged first as the puromycin selection
trap is more selective than the neomycin selection trap. Thus the isolation of positive clones
was completed quicker. For the same reason selective pressure with 150 µg/mL puromycin
was applied 7 days after transfection instead of 5 days. The isolated cell lines were than
used for a second round of RMCE to exchange the other locus.
3.6.9 Single cell cloning by serial dilution
To obtain isolated clones serial dilutions in 96-well plates were used. To do so 100 µL
CD Hybridoma medium with the required antibiotics was aliquoted into a 96-well plate
MATERIALS AND METHODS
52
and incubated at 37 °C and 8 % CO2 for 15 min. The 100 µL medium from well A1 was
removed again. The cells from a 96-well plate grown to approximately 50 % - 80 %
confluency were transferred to well A1 (~ 200 µL) and diluted 1:2 down the column from
well A1 to well H1. With a multichannel pipette 100 µL CD Hybridoma medium with
antibiotics was added to the wells A1 – H1 and diluted 1:2 across the rows of the plate.
100 µL CD Hybridoma medium was added to the wells to obtain a total volume of 200 µL
in each well. The 96-well plates were incubated for about a week at 37 °C at 8 % CO2 before
the next round of clonal isolation or expansion.
3.6.10 Flow cytometry and preparative cell sorting
The Guava EasyCyteTM Mini System is a flowcytometer which uses a 488 nm diode laser
for the excitation of samples and 3 fluorescence detectors (525 nm (green), 583 nm (yellow)
and 680 nm (red)) to measure emission signals. The Guava EasyCyteTM was used to analyse
the fluorescent level of eukaryotic cells after transient transfection or stable integration of
gene targets. Cells were diluted 1:10 with 1x PBS; non-florescent cells could also be stained
with 50 µg/mL propidumiodid to determine cell viability and exclude dead cells from the
analysis.
Preparative cell sorting was done with the MoFlo XDP, Aria-II or Vantage SE by Lothar
Gröbe research group experimental immunology (EXIM) at the HZI or Maria Höxter
research group gen regulation and differentiation (RDIF) at the HZI. To obtain binary
RMCE cell lines 1x10⁷ tdTomato tagged cells (Section 3.6.7) were sorted for tdTomato
positive cells and/or the highest 4 % fluorescence for tdTomato as a pool in 1-2 mL
ProCHO5 medium using a 100 µm tip.
3.6.11 Resistance of SWI3_26 (CHO Lec3.2.8.1) cell line to antibiotics
Objective was to determine the antibiotic concentration which causes total cell death of the
CHO Lec3.2.8.1 RMCE master cell line SWI3_26. To determine the resistance of the
CHO Lec3.2.8.1 RMCE master cell line SWI3_26 against antibiotics; 2x10⁴ cells were seeded
in 24-well plates (BD Falcon) and cultivated at 37 °C at 8 % CO2. After one day antibiotic
pressure was applied according to Table 3-21. Every 3-4 days the antibiotic containing
CD-Hybridoma medium (Lonza) was exchanged. The change in cell density was observed
under the light microscope (Olympus CKX41) over 17 days and estimated visually as the
percentage of density.

MATERIALS AND METHODS
53
Table 3‐21: Antibiotic pressure applied to SWI3_26 (CHO Lec3.2.8.1)
G418 [µg/µL] Hygromycin B [µg/µL] Zeocin [µg/µL] Phleomycin [µg/µL] Puromycin [µg/µL]
0 0 0 0 0
150 50 50 2.5 1
300 100 100 5 2
450 150 150 7.5 3
600 200 200 10 4
900 300 300 15 5
1200 400 400 20 6
1500 500 500 25 8
1800 600 600 30 10
2100 700 700 40 12
2400 800 800 50 15
2700 900 900 100 20
3.7 Protein production and purification
3.7.1 Transient protein expression in HEK293‐6E
Transient expression in HEK293-6E cells was used for the screening of constructs as well as
for test expressions in batch culture. Transfections of HEK293-6E cells were carried out
according to Section 3.6.6. The transfection efficiency was monitored daily using
flowcytometry (Section 3.6.10) as well as cell number and viability (Section 3.6.3). The
starting culture volume used during transfection was expanded 48 h post transfection by
adding the same amount of fresh F17 medium to the culture. Furthermore the culture was
supplemented with tryptone (TN1) to a final concentration of 0.5 %. Supplementations
with a final concentration of 4.5 g/L glucose at 72 hpt to avoid nutrient depletion and
3.75 mmol/L valproic acid at 96 hpt to boost expression rates in the stationary phase
(Backliwal et al., 2008). Cells were typically harvested at 4.000 rpm in a bench top centrifuge
using 50 mL Falcon tubes, if necessary the culture supernatants were pooled and
supplemented with 0.1 % sodium acid for storage at 4 °C. If the cell pellets were needed
those were washed with 1x PBS pooled in one Falcon tube and centrifuged again. The
supernatant was removed and stored at -20 °C.
3.7.2 Protein production in stable CHO Lec3.2.8.1 cell lines
For small scale protein production producer cell lines generated in Section 3.6.8 were
expanded to a volume of 150 mL - 1.5 L and cultivated for 3-5 days in shaker flasks. Culture
supernatants or cell pellets were typically harvested at 7330 rcf for 30 min or at 4.000 rpm
in a bench top centrifuge using 50 mL Falcon tubes. Cell pellets were further washed with
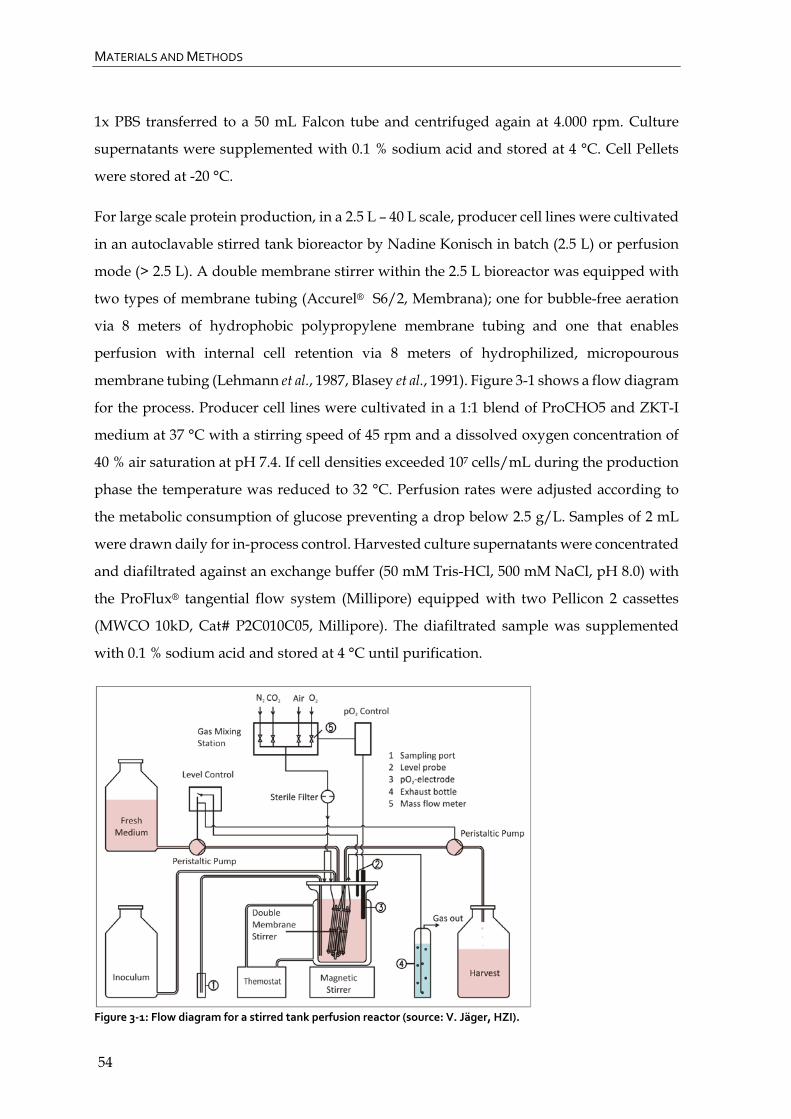
MATERIALS AND METHODS
54
1x PBS transferred to a 50 mL Falcon tube and centrifuged again at 4.000 rpm. Culture
supernatants were supplemented with 0.1 % sodium acid and stored at 4 °C. Cell Pellets
were stored at -20 °C.
For large scale protein production, in a 2.5 L – 40 L scale, producer cell lines were cultivated
in an autoclavable stirred tank bioreactor by Nadine Konisch in batch (2.5 L) or perfusion
mode (> 2.5 L). A double membrane stirrer within the 2.5 L bioreactor was equipped with
two types of membrane tubing (Accurel® S6/2, Membrana); one for bubble-free aeration
via 8 meters of hydrophobic polypropylene membrane tubing and one that enables
perfusion with internal cell retention via 8 meters of hydrophilized, micropourous
membrane tubing (Lehmann et al., 1987, Blasey et al., 1991). Figure 3-1 shows a flow diagram
for the process. Producer cell lines were cultivated in a 1:1 blend of ProCHO5 and ZKT-I
medium at 37 °C with a stirring speed of 45 rpm and a dissolved oxygen concentration of
40 % air saturation at pH 7.4. If cell densities exceeded 107 cells/mL during the production
phase the temperature was reduced to 32 °C. Perfusion rates were adjusted according to
the metabolic consumption of glucose preventing a drop below 2.5 g/L. Samples of 2 mL
were drawn daily for in-process control. Harvested culture supernatants were concentrated
and diafiltrated against an exchange buffer (50 mM Tris-HCl, 500 mM NaCl, pH 8.0) with
the ProFlux® tangential flow system (Millipore) equipped with two Pellicon 2 cassettes
(MWCO 10kD, Cat# P2C010C05, Millipore). The diafiltrated sample was supplemented
with 0.1 % sodium acid and stored at 4 °C until purification.
Figure 3‐1: Flow diagram for a stirred tank perfusion reactor (source: V. Jäger, HZI).

MATERIALS AND METHODS
55
3.7.3 Trichloroacetic acid (TCA) precipitation
To preliminary test protein expression using small volumes of culture supernatant or total
cell lysate, TCA precipitation is used to concentrate the protein for Western blot analysis.
To do so 1 mL of culture supernatant or total cell lysate are mixed with 100 µL 100 % TCA
and incubated on ice for 30 min. The precipitated protein is centrifuged down at 13.000 rpm
for 15 min. the protein pellet is washed with 1 mL ice-cold 70 % ethanol and pelleted again
for 5 min at 13.000 rpm. The protein pellet is dissolved in 50 µL water and 50 µL 2x Laemmli
buffer.
3.7.4 Cell lysis
To lyse mammalian cell pellets 10 mL - 50 mL lysis buffer together with one Roche complete
EDTA-free protease inhibitor cocktail tablet and 2 µg – 5 µg DNase I (Table 3-22) were
added to a frozen cell pellet in a Falcon tube and vortexed. The tube was left on ice for
approximately 40 min – 60 min and the content centrifuged at 30.000 xg for 20 min - 60 min
and eventually filtered with a 0.45 µm syringe filter. Small cell pellets in Eppendorf tubes
were lysed with 50 µL – 700 µL lysis buffer, kept on ice for 15 min and centrifuged at
12.000 rpm for 10 min.
Table 3‐22: Lysis buffers
Buffer Composition
Lysis buffer, pH 8.0 50 mM NaxHyPO4, 300 mM NaCl, 5 mM– 20 mM imidazole, 0.5 % IGEPAL CA‐630
(Cat# 13021‐100mL, Sigma), 3 mM 3‐β‐mercaptoethanol
FLAG‐Lysis buffer, pH 8.0
(magnetic beads)
50 mM NaxHyPO4, 300 mM NaCl, 0.1% IGEPAL CA‐630
FLAG‐Lysis buffer, pH 7.4
(affinity resin)
50 mM Tris‐HCl, 150 mM NaCl, 1 mM EDTA, 1 % Triton X‐100 (Cat# 1.08605.0050,
Merck)
Ni‐NTA Lysis buffer, pH 8.0 50 mM Na2HPO4, pH 8.0, 300 mM NaCl, 10 mM imidazole, 0.1 % IGEPAL CA‐630,
1 mM KH2HPO4, 1.35 mM KCl
* 1 Roche complete EDTA‐free protease inhibitor cocktail tablet and 2 µg – 5 µg DNase I were added either directly
to the sample or to 50 mL lysis buffer and aliquoted.
3.7.5 Dialysis and diafiltration
The VIVAflow 200 system or the KrosFlow® research IIi TFF system were set up according
Figure 3-2 or Figure 3-3 respectively. The 10 % storage ethanol was removed from the
VIVAflow 200 cartridge or MidiKros column and the system cleaned with at least 500 mL
MilliQ water to remove residual ethanol. The MilliQ water was drained from the system
and approximately 200 mL of the cell culture supernatant were placed into the concentrate
reservoir. The remaining cell culture supernatant was connected as feed reservoir to the
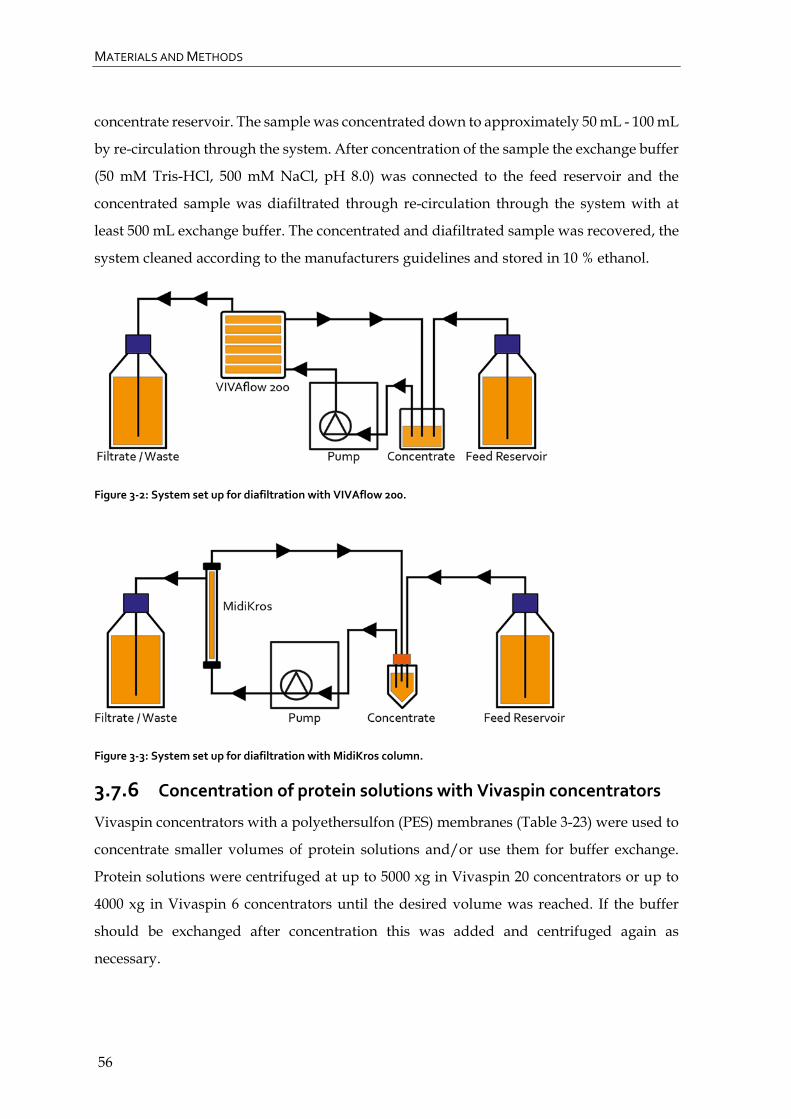
MATERIALS AND METHODS
56
concentrate reservoir. The sample was concentrated down to approximately 50 mL - 100 mL
by re-circulation through the system. After concentration of the sample the exchange buffer
(50 mM Tris-HCl, 500 mM NaCl, pH 8.0) was connected to the feed reservoir and the
concentrated sample was diafiltrated through re-circulation through the system with at
least 500 mL exchange buffer. The concentrated and diafiltrated sample was recovered, the
system cleaned according to the manufacturers guidelines and stored in 10 % ethanol.
Figure 3‐2: System set up for diafiltration with VIVAflow 200.
Figure 3‐3: System set up for diafiltration with MidiKros column.
3.7.6 Concentration of protein solutions with Vivaspin concentrators
Vivaspin concentrators with a polyethersulfon (PES) membranes (Table 3-23) were used to
concentrate smaller volumes of protein solutions and/or use them for buffer exchange.
Protein solutions were centrifuged at up to 5000 xg in Vivaspin 20 concentrators or up to
4000 xg in Vivaspin 6 concentrators until the desired volume was reached. If the buffer
should be exchanged after concentration this was added and centrifuged again as
necessary.

MATERIALS AND METHODS
57
Table 3‐23: Vivaspin concentrators
3.7.7 Small scale purification of tagged proteins with magnetic beads
Small scale purifications of cell extracts or cell culture supernatants were done using
magnetic beads. All fractions were collected and analysed by SDS-PAGE and Western blot
(Sections 3.8.1 and 3.8.2).
Table 3‐24: Small scale purification methods
MagneHisTM Ni‐Particles (Promega, Cat# V8560)
An appropriate amount of MagneHis TM beads were added to dialysed culture supernatant and incubated. The
magnetic beads were captured with a magnetic rack and washed 3x with MagneHisTM Binding/Wash buffer containing
500 mM NaCl. MagneHisTM elution buffer was used for elution in volumes from 50‐100 µL.
MagStrep “type2” beads (IBA, Cat# 2‐1611‐002)
An appropriate amount of MagStrep beads were equilibrated with 200 µL Buffer W and added directly to the culture
supernatant. After incubation beads were captured with a magnetic rack and washed 3x with 100 µL buffer W before
elution with buffer BE in 50‐100 µL volume.
ANTI‐FLAG® M2 Magnetic beads (Sigma, Cat# M8823‐1ML)
100 µL suspended beads (= 50 µL beads with a binding capacity of ~ 30 µg protein) were transferred to a 2 mL
Eppendorf. The beads were separated from the suspension using a magnetic stand and the beads equilibrated twice
with TBS buffer (50 mM Tris‐Cl, 150 mM NaCl, pH 7.5). The beads were recovered with the magnetic stand 2 mL cell
lysate (Section 3.7.4) were added to the magnetic beads and incubated for 2 h on a shaker. The magnetic beads were
washed 3x with TBS buffer and the protein eluted with 200 µL elution buffer (0.1 M glycine/HCl pH 3.0) and the eluate
transferred to 60 µL 1 M Tris pH 8.0. The elution step was repeated with 150 µL elution buffer.
3.7.8 Affinity chromatography of tagged proteins
Purifications of cell extracts or cell culture supernatants were done using commercially
available or stacked columns. Fractions were collected and analysed by SDS-PAGE and
Western blot (Sections 3.8.1 and 3.8.2).
Concentrator MWCO (kDa) Cat# Supplier
Vivaspin 20 30.000 VS2022 Vivascience /Satorius
Vivaspin 20 10.000 VS2002 Vivascience /Satorius
Vivaspin 20 5.000 VS2012 Vivascience /Satorius
Vivaspin 20 3.000 VS2092 Vivascience /Satorius
Vivaspin 6 30.000 VS0622 Vivascience /Satorius
Vivaspin 6 10.000 VS0602 Vivascience /Satorius
Vivaspin 6 5.000 VS0612 Vivascience /Satorius
Vivaspin 6 3.000 VS0692 Vivascience /Satorius

MATERIALS AND METHODS
58
Table 3‐25: Small scale purification methods
Ni‐NTA His‐Bind® SuperflowTM Resin (Novagen, Cat# 70691)
A 5 mL columns (MoBiTec, Cat# S1013) with 35 µm filter were stacked 500 µL Ni‐NTA His‐Bind® SuperflowTM resin
and a 20 mL syringe was screwed on top of the column as a reservoir. The resin was equilibrated with 10 CV binding
buffer (50 mM Na2HPO4, 300 mM NaCl, 10 mM imidazole, pH 8.0) before loading the cell extract via gravity flow. The
resin was washed with 10 CV of binding buffer followed by 10 CV of wash buffer (50 mM Na2HPO4, 300 mM NaCl,
20 mM imidazole, pH 8.0) to remove unspecifically bound protein. Protein was eluted with 10 CV of elution buffer
(50 mM Na2HPO4, 300 mM NaCl, 250 mM imidazole, pH 8.0). As the column was overloaded a second round of
purification was necessary, so the resin was equilibrated again with 10 CV of binding buffer and the flowthrough
loaded 3x consecutively to the column to assure complete protein binding. The resin was washed with 10 CV of
binding buffer followed by 10 CV of wash buffer to remove unspecifically bound protein and the protein eluted with
8 CV of elution buffer.
Ni‐IMAC with ProfiniaTM Protein Purification System
For the purification of His‐tagged proteins with the Profinia protein purification system Bio‐ScaleTM Mini ProfinityTM
IMAC Cartridges with 1 mL (Cat# 732‐4610, Bio‐Rad) or 5 mL (Cat# 732‐4614, Bio‐Rad) bed volume were used. The
purification step was followed by desalting of the eluate with Bio‐ScaleTM Mini Bio‐Gel® P‐6 Desalting Cartridge with
10 mL (Cat# 732‐5304, Bio‐Rad) or 50 mL (Cat# 732‐5314, Bio‐Rad) bed volume. Pre‐programmed methods were used
for the purification and desalting of target proteins. Buffers for purification are listed in Table 3‐26.
Ni‐NTA with ÄKTApilot
Ni‐NTA His‐Bind® SuperflowTM resin was used to purify larger volumes of His‐tagged protein. After application of the
diafiltrated and concentrated sample to the column a wash with 200 mL binding buffer (50 mM Tris‐HCl, 500 mM
NaCl, pH 8.0) was used to remove unspecifically bound protein. The target protein was eluted with a step gradient
mixing binding buffer with elution buffer (50 mM Tris‐HCl, 500 mM NaCl, 500 mM imidazole, pH 8.0).
StrepTactin Superflow Cartridge H‐PR (IBA, Cat# 2‐1231‐001)
Concentrated dialysed culture supernatant is loaded to the column washed with washing buffer (100 mM Tris‐Cl,
150 mM NaCl, 1 mM EDTA, pH 8.0), and eluted with 4 mL elution buffer (100 mM Tris‐Cl, 150 mM NaCl, 1 mM EDTA,
2.5 mM desthiobiotin, pH 8.0).
Anti‐FLAG® M2 Affinity Gel (Sigma, Cat# A2220)
A 1 mL column (Mobicol classic, MoBiTec, Cat# M1002) with a 35 µm filter was stacked with 300 µL Anti‐FLAG® M2
affinity gel resin. The resin was washed 3x with 1 CV of regeneration buffer (0.1 M glycine HCl, pH 3.5) followed by
equilibration with 5 CV of TBS (50 mM Tris‐HCl, 150 mM NaCl, pH7.4). Proper equilibration was tested with pH strips
and the cell extract was slowly applied with a syringe passing it consecutively 3x over the column. The column was
washed with 20 CV of TBS to remove unspecifically bound protein. Protein was eluted in six 1 mL aliquots of elution
buffer (0.1 M glycine HCl, pH 3.5) into 25 µL 1 M Tris, pH 8.0 for neutralization. These steps were repeated a second
time using the flowthrough from the first round of purification to assure that all present protein was purified.
Table 3‐26: Buffers used for Ni‐IMAC with the Profinia Protein Purification system
Buffer Working formulation
Native IMAC wash buffer 1 300 mM KCl, 50 mM KH2PO4, 5 mM imidazole, pH 8.0
Native IMAC wash buffer 2 300 mM KCl, 50 mM KH2PO4, 10 mM imidazole, pH 8.0
Native IMAC elution buffer 300 mM KCl, 500 mM KH2PO4, 250 mM imidazole, pH 8.0
Cleaning solution 1 500 mM NaCl, 50 mM Tris, pH 8.0
Cleaning solution 2 500 mM NaCl, 100 mM sodium acetate, pH 4.5
Storage solution 2% C6H5CH2OH (benzyl alcohol)
Desalting buffer 50 mM Tris‐HCl, 500 mM NaCl, pH 8.0

MATERIALS AND METHODS
59
Table 3‐27: Buffer for Ni‐IMAC with the ÄKTApilot
Buffer Working formulation
Binding buffer 50 mM Tris‐HCl, 500 mM NaCl, pH 8.0
Elution buffer 50 mM Tris‐HCl, 500 mM NaCl, 500 mM imidazole, pH 8.0
3.8 Protein analytical methods
3.8.1 SDS‐PAGE
To analyse protein purity and yield as well as expression kinetics SDS-PAGE (sodium
dodecyl sulphate polyacrylamide gel electrophoresis) was used under denaturing
conditions (Laemmli et al., 1970). 12 % or 10 % gels were either made according to Table 3-28
or precast gels from Bio-Rad were used. Samples were mixed with 8x SDS loading buffer
and boiled for 5 min at 90 °C before applying them to a SDS-gel. Typically 10 µL - 15 µL of
sample were loaded to 15-well SDS-gels and 15 µL - 20 µL to 10-well SDS-gels.
Mini-Protean® TGXTM were loaded with 15 µL or 30 µL sample (15-well and 10-well
respectively). The gels were pre-focused under constant voltage of 120 V for 5 min and run
at 160 V until the dye front reached the end of the gel. To remove the SDS the gel was
washed in water and then stained with either Instant blue or coomassie staining solution.
The buffers used for SDS-PAGE are listed in Table 3-29. The molecular weight standards
used are listed in Table 3-3.
Enzyme Cat# Supplier
T4 DNA Ligase (1.000 U/ mL) 11000324/
14395420
Roche
Antarctic Phosphatase (5.000 U/mL) M0289S NEB
Phusion® Hot Start II DNA Polymerase (2.000 U/mL) F‐549L/ M0530S/ B0515A
Finnzymes/ Thermo
Scientific/ NEB
KOD Hot Start DNA Polymerase (1.000 U/mL) 71086‐3 Novagen/Millipore
DNase I (1ng/µL) N/A MOSB, HZI
Trypsin/ EDTA (1x) L11‐004 PAA Laboratories GmbH
Trypsin/ EDTA (10x) L11‐003 PAA Laboratories GmbH
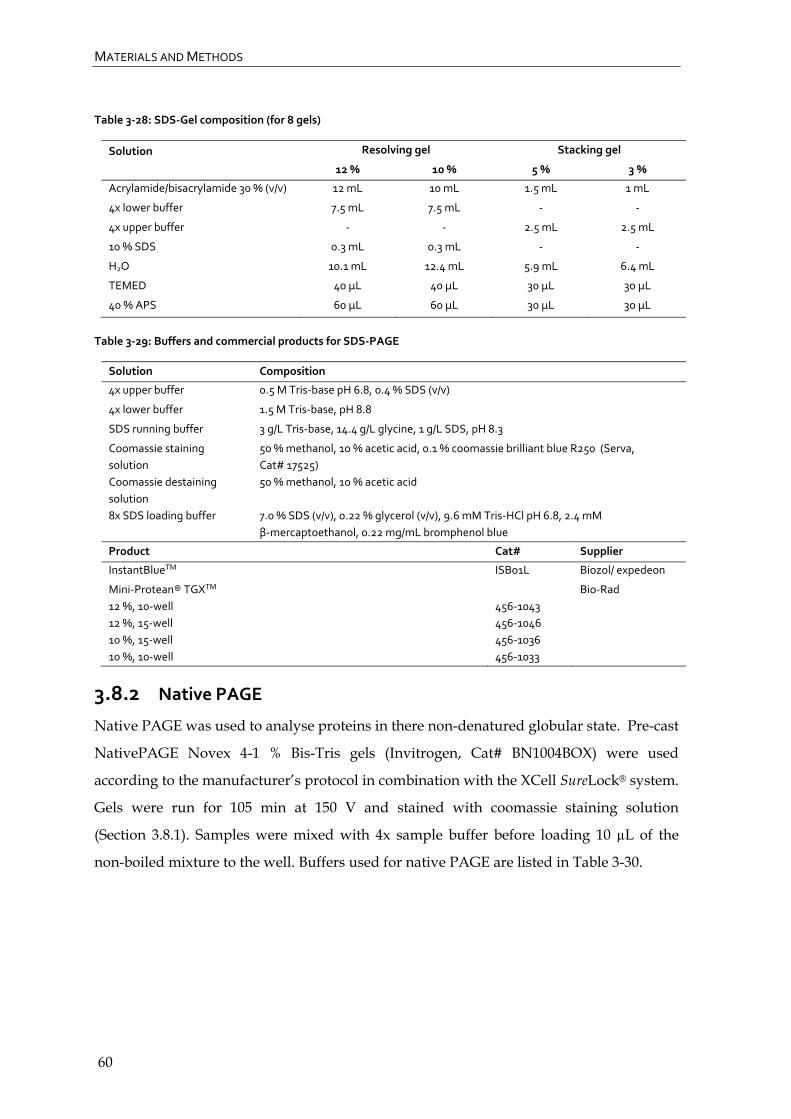
MATERIALS AND METHODS
60
Table 3‐28: SDS‐Gel composition (for 8 gels)
Solution Resolving gel Stacking gel
12 % 10 % 5 % 3 %
Acrylamide/bisacrylamide 30 % (v/v) 12 mL 10 mL 1.5 mL 1 mL
4x lower buffer 7.5 mL 7.5 mL ‐ ‐
4x upper buffer ‐ ‐ 2.5 mL 2.5 mL
10 % SDS 0.3 mL 0.3 mL ‐ ‐
H2O 10.1 mL 12.4 mL 5.9 mL 6.4 mL
TEMED 40 µL 40 µL 30 µL 30 µL
40 % APS 60 µL 60 µL 30 µL 30 µL
Table 3‐29: Buffers and commercial products for SDS‐PAGE
Solution Composition
4x upper buffer 0.5 M Tris‐base pH 6.8, 0.4 % SDS (v/v)
4x lower buffer 1.5 M Tris‐base, pH 8.8
SDS running buffer 3 g/L Tris‐base, 14.4 g/L glycine, 1 g/L SDS, pH 8.3
Coomassie staining
solution
50 % methanol, 10 % acetic acid, 0.1 % coomassie brilliant blue R250 (Serva,
Cat# 17525)
Coomassie destaining
solution
50 % methanol, 10 % acetic acid
8x SDS loading buffer 7.0 % SDS (v/v), 0.22 % glycerol (v/v), 9.6 mM Tris‐HCl pH 6.8, 2.4 mM
β‐mercaptoethanol, 0.22 mg/mL bromphenol blue
Product Cat# Supplier
InstantBlueTM ISB01L Biozol/ expedeon
Mini‐Protean® TGXTM
12 %, 10‐well
12 %, 15‐well
10 %, 15‐well
10 %, 10‐well
456‐1043
456‐1046
456‐1036
456‐1033
Bio‐Rad
3.8.2 Native PAGE
Native PAGE was used to analyse proteins in there non-denatured globular state. Pre-cast
NativePAGE Novex 4-1 % Bis-Tris gels (Invitrogen, Cat# BN1004BOX) were used
according to the manufacturer’s protocol in combination with the XCell SureLock® system.
Gels were run for 105 min at 150 V and stained with coomassie staining solution
(Section 3.8.1). Samples were mixed with 4x sample buffer before loading 10 µL of the
non-boiled mixture to the well. Buffers used for native PAGE are listed in Table 3-30.
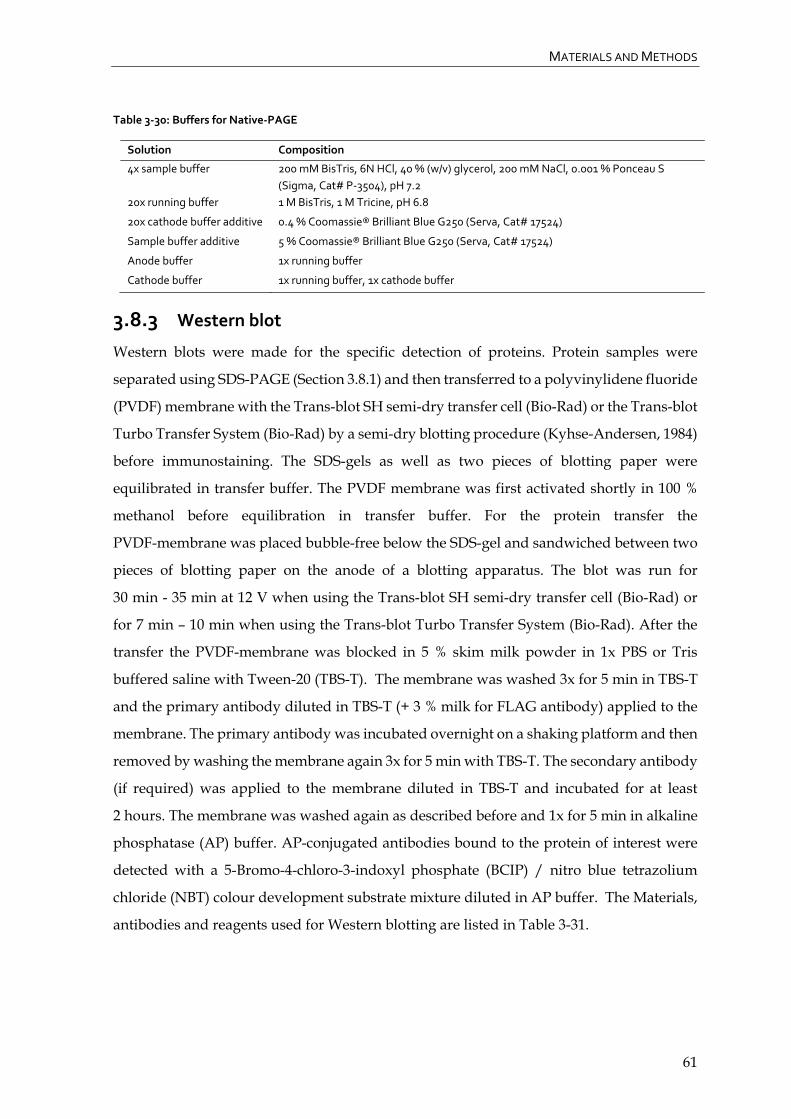
MATERIALS AND METHODS
61
Table 3‐30: Buffers for Native‐PAGE
Solution Composition
4x sample buffer 200 mM BisTris, 6N HCl, 40 % (w/v) glycerol, 200 mM NaCl, 0.001 % Ponceau S
(Sigma, Cat# P‐3504), pH 7.2
20x running buffer 1 M BisTris, 1 M Tricine, pH 6.8
20x cathode buffer additive 0.4 % Coomassie® Brilliant Blue G250 (Serva, Cat# 17524)
Sample buffer additive 5 % Coomassie® Brilliant Blue G250 (Serva, Cat# 17524)
Anode buffer 1x running buffer
Cathode buffer 1x running buffer, 1x cathode buffer
3.8.3 Western blot
Western blots were made for the specific detection of proteins. Protein samples were
separated using SDS-PAGE (Section 3.8.1) and then transferred to a polyvinylidene fluoride
(PVDF) membrane with the Trans-blot SH semi-dry transfer cell (Bio-Rad) or the Trans-blot
Turbo Transfer System (Bio-Rad) by a semi-dry blotting procedure (Kyhse-Andersen, 1984)
before immunostaining. The SDS-gels as well as two pieces of blotting paper were
equilibrated in transfer buffer. The PVDF membrane was first activated shortly in 100 %
methanol before equilibration in transfer buffer. For the protein transfer the
PVDF-membrane was placed bubble-free below the SDS-gel and sandwiched between two
pieces of blotting paper on the anode of a blotting apparatus. The blot was run for
30 min - 35 min at 12 V when using the Trans-blot SH semi-dry transfer cell (Bio-Rad) or
for 7 min – 10 min when using the Trans-blot Turbo Transfer System (Bio-Rad). After the
transfer the PVDF-membrane was blocked in 5 % skim milk powder in 1x PBS or Tris
buffered saline with Tween-20 (TBS-T). The membrane was washed 3x for 5 min in TBS-T
and the primary antibody diluted in TBS-T (+ 3 % milk for FLAG antibody) applied to the
membrane. The primary antibody was incubated overnight on a shaking platform and then
removed by washing the membrane again 3x for 5 min with TBS-T. The secondary antibody
(if required) was applied to the membrane diluted in TBS-T and incubated for at least
2 hours. The membrane was washed again as described before and 1x for 5 min in alkaline
phosphatase (AP) buffer. AP-conjugated antibodies bound to the protein of interest were
detected with a 5-Bromo-4-chloro-3-indoxyl phosphate (BCIP) / nitro blue tetrazolium
chloride (NBT) colour development substrate mixture diluted in AP buffer. The Materials,
antibodies and reagents used for Western blotting are listed in Table 3-31.

MATERIALS AND METHODS
62
Table 3‐31: Materials, antibodies and reagents for Western blotting
Materials Model Cat# Supplier
PVDF membrane ImmobilonTM‐P, PVDF, pore size 0.45 IPVH00010 Millipore
Blotting paper GB 004 Gel‐Blotting Paper 426994 Schleicher und
schuller
Antibodies Type and Dilution Cat# Supplier
His‐Tag®Monoclonal Antibody
(mouse)
Primary 1:2000 or 1:1000 70796‐3 Novagen
StrepMAB‐Classic (mouse),
1 mg/mL
Primary 1:1000 2‐1507‐001 IBA
Anti‐mouse TLR1 (N‐term)
antibody (rabbit)
Primary 1:500 SAB1300197‐
100UG
Sigma‐Aldrich
Monoclonal ANTI‐FLAG® M2
(mouse), 3.8 mg/mL or 4.2
mg/mL
Primary 1:4000 F3165‐.2MG Sigma
Goat‐anti mouse IgG (H+L) –AP,
1 mg/µL
Secondary 1:7000 S3721 Promega
Anti‐rabbit IgG (Fc) AP
Conjugate, 1 mg/mL
Secondary 1:7500 S3731 Promega
Reagents Concentration Cat# Supplier
BCIP 50 mg/mL in 100 % dimethylformamide S381C Promega
NBT 50 mg/mL in 70 % dimethylformamide S3801C Promega
Buffers Composition
Transfer buffer 25 mM Tris‐base, 192 mM glycine, 15 % methanol, pH 8.0
1x PBS 140 mM NaCl, 3 mM KCl, 12 mM Na2HPO4, 2 mM KH2PO4, pH 7.4
TBS‐T 2o mM Tris‐base, 150 mM NaCl, 0.05 % (v/v) Tween, pH 8.0
AP‐buffer 100 mM Tris‐base, 100 mM NaCl, 5 mM MgCl2, pH 9.5
3.8.4 Fluorescent measurements with the Tecan MD 1000 plate reader
Cell extracts or purified protein eluates obtained from cell lines expressing the fluorescent
protein tdTomato were analysed with the Tecan MD 1000 plate reader on Nuncleon Delta
Surface plates (Thermo Scientific/Nunc, Cat# 137101). Purified tdTomato was used to
generate a suitable standard curve diluted in either cell extract obtained from cell lines not
expressing tdTomato or buffer corresponding to the one present in purified eluates.
Samples and standards were analysed in two sets of triplicates on two separate plates using
100 µL volume. Settings used during the measurements are listed in Table 3-32.
Concentrations for tdTomato expression were calculated according to the calibration curve
obtained during the same measurement.
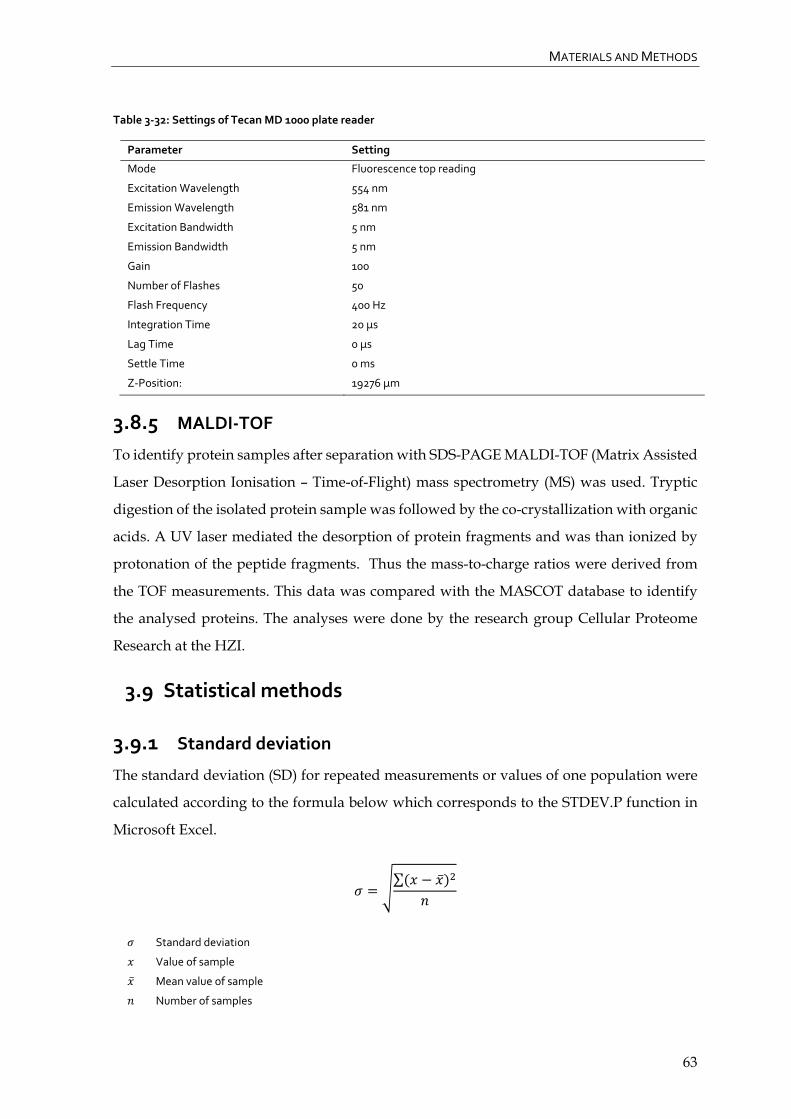
MATERIALS AND METHODS
63
Table 3‐32: Settings of Tecan MD 1000 plate reader
Parameter Setting
Mode Fluorescence top reading
Excitation Wavelength 554 nm
Emission Wavelength 581 nm
Excitation Bandwidth 5 nm
Emission Bandwidth 5 nm
Gain 100
Number of Flashes 50
Flash Frequency 400 Hz
Integration Time 20 µs
Lag Time 0 µs
Settle Time 0 ms
Z‐Position: 19276 µm
3.8.5 MALDI‐TOF
To identify protein samples after separation with SDS-PAGE MALDI-TOF (Matrix Assisted
Laser Desorption Ionisation – Time-of-Flight) mass spectrometry (MS) was used. Tryptic
digestion of the isolated protein sample was followed by the co-crystallization with organic
acids. A UV laser mediated the desorption of protein fragments and was than ionized by
protonation of the peptide fragments. Thus the mass-to-charge ratios were derived from
the TOF measurements. This data was compared with the MASCOT database to identify
the analysed proteins. The analyses were done by the research group Cellular Proteome
Research at the HZI.
3.9 Statistical methods
3.9.1 Standard deviation
The standard deviation (SD) for repeated measurements or values of one population were
calculated according to the formula below which corresponds to the STDEV.P function in
Microsoft Excel.
∑
Standard deviation
Value of sample
Mean value of sample
Number of samples

MATERIALS AND METHODS
64
3.9.2 Analysis of variance – ANOVA
To determine if there is a significant difference between mean protein yields obtained from
triplicate batch cultures or different harvesting timepoints, a two-factor ANOVA without
replication was used.
First null-hypothesis (H0A): No significant difference in expression between batch cultures
(µ = average yield, r = number of batch).
μ μ ⋯ μ
Second null-hypothesis (H0B): No significant difference in expression between different
harvesting time points. (µ = average yield, c = number of harvesting time point).
⋯
To confirm these null-hypothesises the F-ratio needed to be calculated for each by dividing
the mean sum of squares (MS) of an analysed group through the MS of the within group
variation. A and B refer to the analysed groups (batch and harvesting time point) and E to
the within group variation or random error.
If an observed F-ratios was lower than the critical F value (F<Fcrit) and the p-value
(probability) was larger than the set significance level α (p > α) the null-hypothesis could
be accepted. All calculations were done using the two-factor ANOVA without replication
function in Microsoft Excel. The significance level α was set to 0.05 to obtain a 95%
confidence level. The formulas below show the different components required for the
calculation of the F-ratio (SS = Sum of squares, df = degrees of freedom, x = measured
values, = total average of all measured values).
1
1
1 1

RESULTS
65
4 Results
4.1 Establishment of binary RMCE master cell lines
To enable the stable co-expression of difficult to express proteins with accessory molecules
at pre-defined genomic loci a binary RMCE system was established during this work. The
RMCE master cell lines SWI3_26 (Wilke et al., 2011) and SMT_dneo(2)_24 (Konrad Büssow,
HZI) previously created in our group already contain the first exchange locus
(PEF-FRT3-eGFP-FRTwt-Δneo) and were used for the stable integration of a second exchange
cassette. In this section the steps for the generation of binary CHO Lec3.2.8.1 RMCE master
cell lines for the targeted integration of transgenes at two distinct genomic loci are
described.
The groundwork required for the preparation of a second exchange cassette included the
screening for antibiotic sensitivity in SWI3_26 cells to determine a suitable resistance
marker for its selection trap (Section 4.1.1). Furthermore, the analysis of the fluorescent
marker tdTomato (Section 4.1.2) ensured the compatibility with the existing eGFP marker
in a binary system. To enable the site-specific integration into different loci heterospecific
FRT sites (FRT13 and FRT14) which do not cross-interact with the existing ones (FRT3 and
FRTwt) (Turan et al., 2010) were chosen for the second exchange locus. The chosen
components were cloned into a tagging vector (Section 4.1.3) and used for genomic tagging
of the SWI3_26 and SMT_dneo(2)_24 RMCE master cell lines followed by FACS and clonal
isolation to obtain a new set of binary RMCE master cell lines (Section 4.1.4). To confirm the
full integration of the exchange cassettes genomic PCR (Section 4.1.5) was used to
determine RMCE master cell line integrity. Finally, to enable the integration of target genes
into the second exchange locus a new donor vector was cloned (Section 4.1.6) comprising
the new set of heterospecific FRT sites (FRT13 and FRT14). The binary RMCE system was
used for the co-expression of TLRs with molecular chaperones as described in Section 4.4.
4.1.1 Resistance of the CHO Lec3.2.8.1 cell line SWI3_26 to antibiotics
To isolate cells that successfully integrated a GOI during RMCE, the second exchange locus
in the binary RMCE system requires a different selection marker in its selection trap than
exchange locus one. To select a resistance marker the resistance of the CHO Lec3.2.8.1
RMCE master cell line SWI3_26 (Wilke et al., 2011) against the antibiotics geneticin (G418),
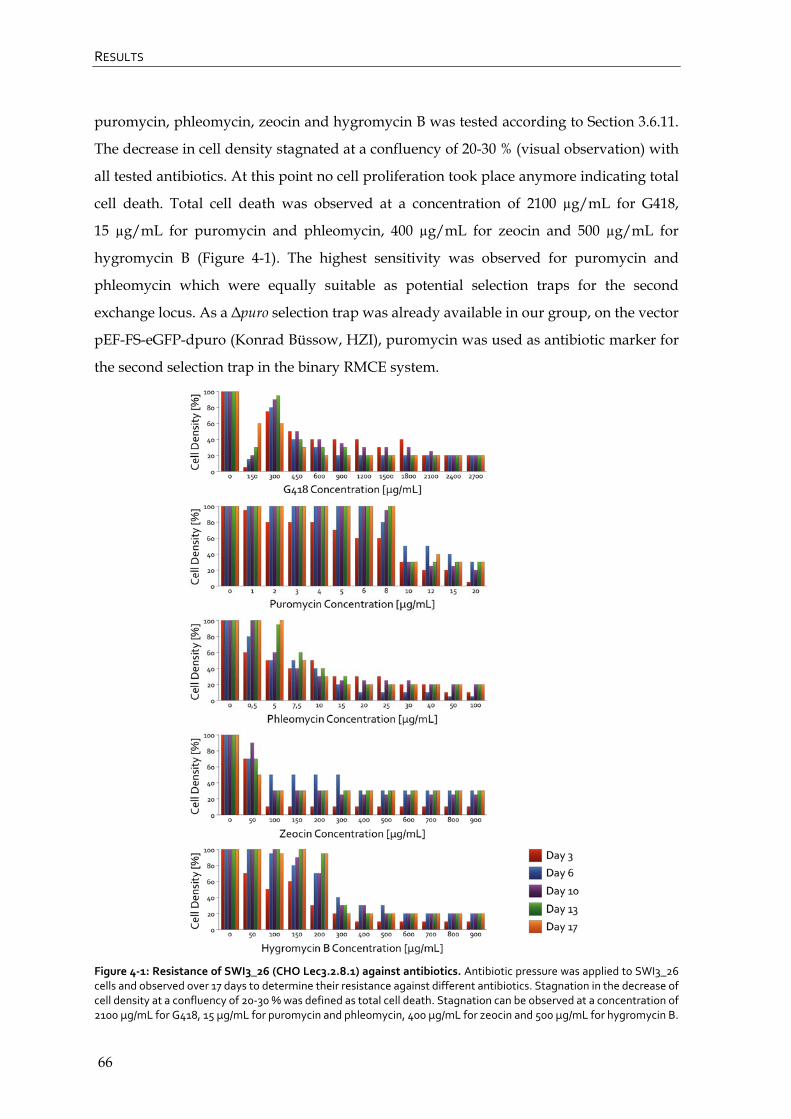
RESULTS
66
puromycin, phleomycin, zeocin and hygromycin B was tested according to Section 3.6.11.
The decrease in cell density stagnated at a confluency of 20-30 % (visual observation) with
all tested antibiotics. At this point no cell proliferation took place anymore indicating total
cell death. Total cell death was observed at a concentration of 2100 µg/mL for G418,
15 µg/mL for puromycin and phleomycin, 400 µg/mL for zeocin and 500 µg/mL for
hygromycin B (Figure 4-1). The highest sensitivity was observed for puromycin and
phleomycin which were equally suitable as potential selection traps for the second
exchange locus. As a Δpuro selection trap was already available in our group, on the vector
pEF-FS-eGFP-dpuro (Konrad Büssow, HZI), puromycin was used as antibiotic marker for
the second selection trap in the binary RMCE system.
Figure 4‐1: Resistance of SWI3_26 (CHO Lec3.2.8.1) against antibiotics. Antibiotic pressure was applied to SWI3_26 cells and observed over 17 days to determine their resistance against different antibiotics. Stagnation in the decrease of cell density at a confluency of 20‐30 % was defined as total cell death. Stagnation can be observed at a concentration of 2100 µg/mL for G418, 15 µg/mL for puromycin and phleomycin, 400 µg/mL for zeocin and 500 µg/mL for hygromycin B.
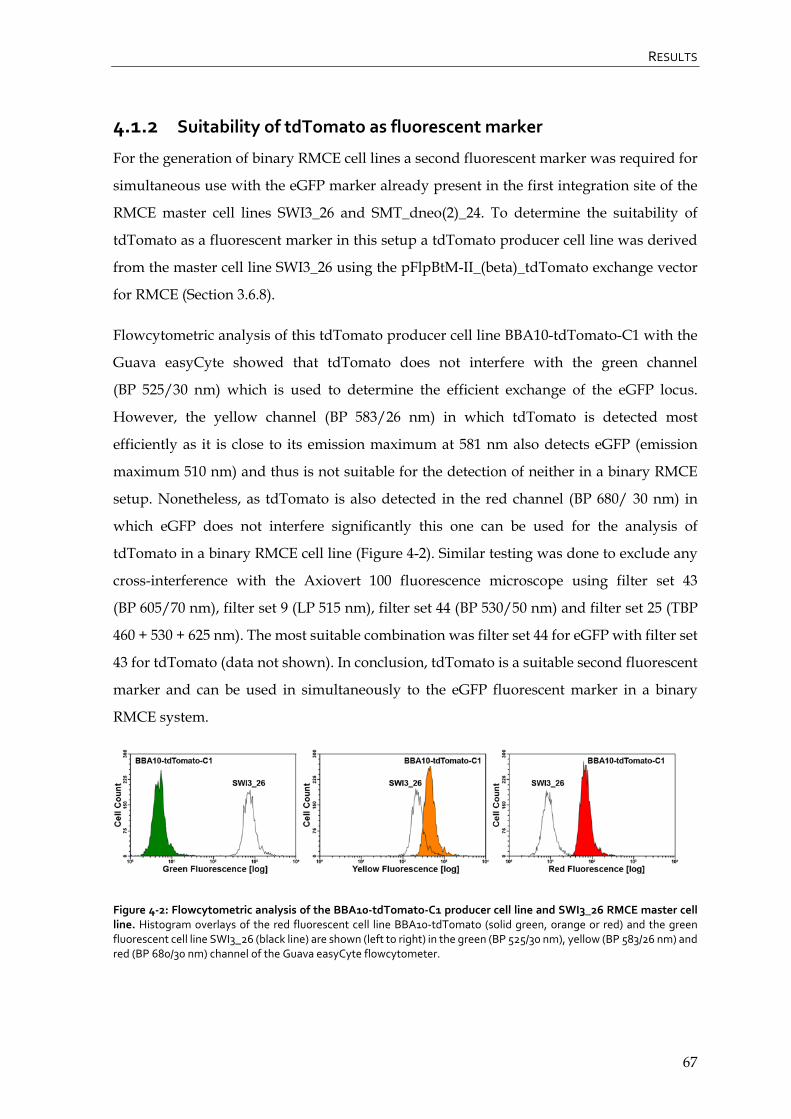
RESULTS
67
4.1.2 Suitability of tdTomato as fluorescent marker
For the generation of binary RMCE cell lines a second fluorescent marker was required for
simultaneous use with the eGFP marker already present in the first integration site of the
RMCE master cell lines SWI3_26 and SMT_dneo(2)_24. To determine the suitability of
tdTomato as a fluorescent marker in this setup a tdTomato producer cell line was derived
from the master cell line SWI3_26 using the pFlpBtM-II_(beta)_tdTomato exchange vector
for RMCE (Section 3.6.8).
Flowcytometric analysis of this tdTomato producer cell line BBA10-tdTomato-C1 with the
Guava easyCyte showed that tdTomato does not interfere with the green channel
(BP 525/30 nm) which is used to determine the efficient exchange of the eGFP locus.
However, the yellow channel (BP 583/26 nm) in which tdTomato is detected most
efficiently as it is close to its emission maximum at 581 nm also detects eGFP (emission
maximum 510 nm) and thus is not suitable for the detection of neither in a binary RMCE
setup. Nonetheless, as tdTomato is also detected in the red channel (BP 680/ 30 nm) in
which eGFP does not interfere significantly this one can be used for the analysis of
tdTomato in a binary RMCE cell line (Figure 4-2). Similar testing was done to exclude any
cross-interference with the Axiovert 100 fluorescence microscope using filter set 43
(BP 605/70 nm), filter set 9 (LP 515 nm), filter set 44 (BP 530/50 nm) and filter set 25 (TBP
460 + 530 + 625 nm). The most suitable combination was filter set 44 for eGFP with filter set
43 for tdTomato (data not shown). In conclusion, tdTomato is a suitable second fluorescent
marker and can be used in simultaneously to the eGFP fluorescent marker in a binary
RMCE system.
Figure 4‐2: Flowcytometric analysis of the BBA10‐tdTomato‐C1 producer cell line and SWI3_26 RMCE master cell line. Histogram overlays of the red fluorescent cell line BBA10‐tdTomato (solid green, orange or red) and the green fluorescent cell line SWI3_26 (black line) are shown (left to right) in the green (BP 525/30 nm), yellow (BP 583/26 nm) and red (BP 680/30 nm) channel of the Guava easyCyte flowcytometer.
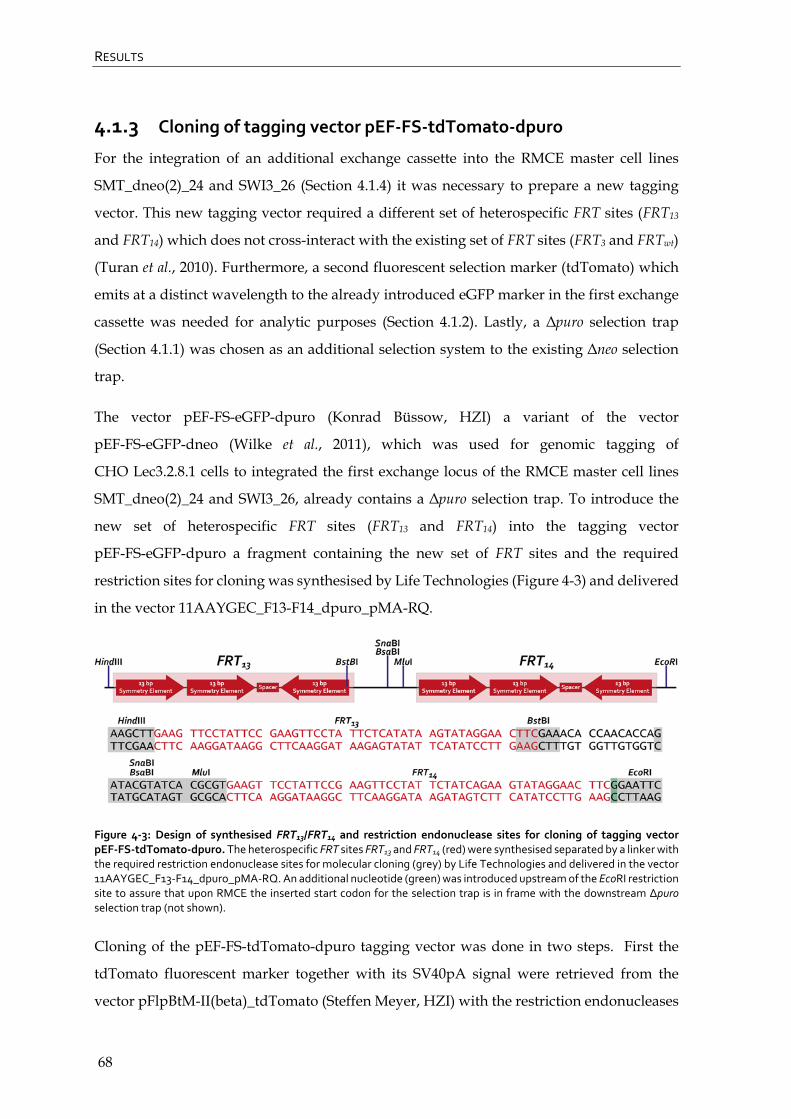
RESULTS
68
4.1.3 Cloning of tagging vector pEF‐FS‐tdTomato‐dpuro
For the integration of an additional exchange cassette into the RMCE master cell lines
SMT_dneo(2)_24 and SWI3_26 (Section 4.1.4) it was necessary to prepare a new tagging
vector. This new tagging vector required a different set of heterospecific FRT sites (FRT13
and FRT14) which does not cross-interact with the existing set of FRT sites (FRT3 and FRTwt)
(Turan et al., 2010). Furthermore, a second fluorescent selection marker (tdTomato) which
emits at a distinct wavelength to the already introduced eGFP marker in the first exchange
cassette was needed for analytic purposes (Section 4.1.2). Lastly, a Δpuro selection trap
(Section 4.1.1) was chosen as an additional selection system to the existing Δneo selection
trap.
The vector pEF-FS-eGFP-dpuro (Konrad Büssow, HZI) a variant of the vector
pEF-FS-eGFP-dneo (Wilke et al., 2011), which was used for genomic tagging of
CHO Lec3.2.8.1 cells to integrated the first exchange locus of the RMCE master cell lines
SMT_dneo(2)_24 and SWI3_26, already contains a Δpuro selection trap. To introduce the
new set of heterospecific FRT sites (FRT13 and FRT14) into the tagging vector
pEF-FS-eGFP-dpuro a fragment containing the new set of FRT sites and the required
restriction sites for cloning was synthesised by Life Technologies (Figure 4-3) and delivered
in the vector 11AAYGEC_F13-F14_dpuro_pMA-RQ.
Figure 4‐3: Design of synthesised FRT13/FRT14 and restriction endonuclease sites for cloning of tagging vector pEF‐FS‐tdTomato‐dpuro. The heterospecific FRT sites FRT13 and FRT14 (red) were synthesised separated by a linker with the required restriction endonuclease sites for molecular cloning (grey) by Life Technologies and delivered in the vector 11AAYGEC_F13‐F14_dpuro_pMA‐RQ. An additional nucleotide (green) was introduced upstream of the EcoRI restriction site to assure that upon RMCE the inserted start codon for the selection trap is in frame with the downstream Δpuro selection trap (not shown).
Cloning of the pEF-FS-tdTomato-dpuro tagging vector was done in two steps. First the
tdTomato fluorescent marker together with its SV40pA signal were retrieved from the
vector pFlpBtM-II(beta)_tdTomato (Steffen Meyer, HZI) with the restriction endonucleases

RESULTS
69
BstBI and BsaBI. The 1718 bp tdTomato_SV40pA fragment was ligated into the 2478 bp
11AAYGEC_F13-F14_dpuro_pMA-RQ vector backbone (cut with BstBI and SnaBI) in
between the FRT sites FRT13 and FRT14 thus destroying the SnaBI site. The resulting
intermediate vector 11AAYGEC_F13-tdTomato_SV40pA-F14_dpuro-pMA-RQ containing
the tdTomato selection marker with its SV40pA signal flanked by the heterospecific FRT
sites FRT13 and FRT14 was used in the second cloning step. From this intermediate vector
the FRT13-tdTomato_SV40pA-FRT14 fragment (1831 bp) was recovered through digestion
with the endonucleases HF-HindIII and HF-EcoRI. The vector pEF-FS-eGFP-dpuro was also
digested with the endonucleases HF-HindIII and HF-EcoRI to remove the eGFP marker
gene and the old FRT sites FRT3 and FRTwt to obtain a backbone (4253 bp) for the new
tagging vector which still contains the Δpuro selection trap. Thus the pEF-FS-dpuro
backbone was ligated with the FRT13-tdTomato_SV40pA-FRT14 fragment to obtain the final
tagging vector pEF-FS-tdTomato-dpuro (Figure 4-4). All plasmids used in this work are
described in Table 3-9.

RESULTS
70
Figure 4‐4: Cloning of tagging vector pEF‐FS‐tdTomato‐dpuro. (A) The “tdTomato_SV40pA” fragment (red line) was retrieved from vector pFlpBtM‐II(beta)_tdTomato with BstBI and BsaBI endonucleases. (B) The “tdTomato_SV40pA” fragment was then ligated into the 11AAYGEC_F13‐F14_dpuro_pMA‐RQ vector backbone (cut with BstBI and SnaBI) between the FRT13 and FRT14 sites (red arrow) thus destroying the SnaBI site. (C) From the resulting intermediate vector 11AAYGEC_F13‐tdTomato_SV40pA‐F14_dpuro‐pMA‐RQ the “FRT13‐tdTomato_SV40pA‐FRT14” fragment (red line) was recovered (with HF‐HindIII and HF‐EcoRI). (D) The “FRT13‐tdTomato_SV40pA‐FRT14” fragment was used to replace the “FRT3‐eGFP‐FRTwt” cassette (red line) in the vector pEF‐FS‐eGFP‐dpuro. (E) New tagging vector pEF‐FS‐tdTomato‐dpuro.

RESULTS
71
4.1.4 Generation of binary RMCE master cell lines
The tagging vector pEF-FS-tdTomato-dpuro (Section 4.1.3) was used for genomic
integration of a second exchange cassette (PEF-FRT13-tdTomato-FRT14-Δpuro) into the RMCE
master cell lines SWI3_26 and SMT_dneo(2)_24 already comprising the first exchange
cassette (PEF-FRT3-eGFP-FRTwt-Δneo). These two cell lines differ in their level of eGFP
fluorescence as shown in Figure 4-5. SMT_dneo(2)_2 shows a higher level of fluorescence
for eGFP indicating that the PEF-FRT3-eGFP-FRTwt-Δneo exchange cassette was integrated at
a locus with better expression capabilities. The tagged cell lines were subjected to 1 or 2
rounds of FACS followed by clonal isolation as required to isolate binary RMCE master cell
lines.
Figure 4‐5: Flowcytometric analysis of RMCE master cell lines SWI3_26 and SMT_dneo(2)_24 before genomic tagging with pEF‐FS‐tdTomato_dpuro. Histogram overlays obtained with the Guava easyCyte flowcytometer show the level of green fluorescence (left) and the level of red fluorescence (right) for the RMCE master cell lines SWI3_26 (solid green or red) and SMT_dneo(2)_24 (black line) containing an eGFP exchange cassette. (Left) As shown SMT_dneo(2)_24 demonstrates a higher level in eGFP fluorescence than SWI3_26. (Right) Furthermore it can be noted that the higher level of eGFP fluorescence also causes a shift within the red channel even though neither of both cell lines exhibits red fluorescence.
Terminology of the cell lines changed after sorting of the tagged cells and was further
distinguished after clonal isolation. The first part of the name refers to a transfection
experiment (TE) with a specific cell line designated with the number 1 for SWI3_26 derived
cell lines and number 3 for SMT_dneo(2) derived cell lines during which the cells were
genomically tagged. The second part of the name refers to the batch (B) of this transfection
experiment that was done and send for the first round of FACS. Thus the SWI3_26 derived
binary RMCE cell lines were named TE1-B1 (transfection experiment 1 batch 1) after the
first round of FACS followed by a suffix after clonal isolation TE1-B1-[Clone ID]. The
SMT_dneo(2)_24 derived binary RMCE cell lines were named TE3-B4 (transfection
experiment 3 batch 4) after the first round of FACS followed by a suffix referring to the
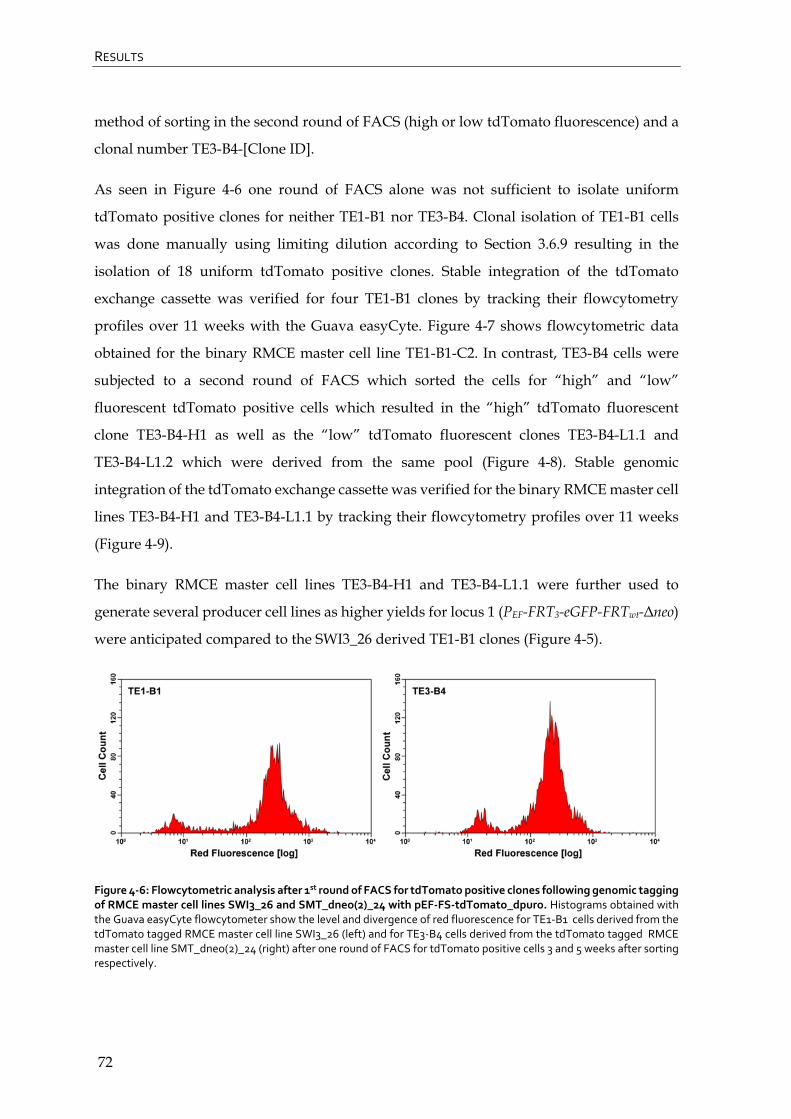
RESULTS
72
method of sorting in the second round of FACS (high or low tdTomato fluorescence) and a
clonal number TE3-B4-[Clone ID].
As seen in Figure 4-6 one round of FACS alone was not sufficient to isolate uniform
tdTomato positive clones for neither TE1-B1 nor TE3-B4. Clonal isolation of TE1-B1 cells
was done manually using limiting dilution according to Section 3.6.9 resulting in the
isolation of 18 uniform tdTomato positive clones. Stable integration of the tdTomato
exchange cassette was verified for four TE1-B1 clones by tracking their flowcytometry
profiles over 11 weeks with the Guava easyCyte. Figure 4-7 shows flowcytometric data
obtained for the binary RMCE master cell line TE1-B1-C2. In contrast, TE3-B4 cells were
subjected to a second round of FACS which sorted the cells for “high” and “low”
fluorescent tdTomato positive cells which resulted in the “high” tdTomato fluorescent
clone TE3-B4-H1 as well as the “low” tdTomato fluorescent clones TE3-B4-L1.1 and
TE3-B4-L1.2 which were derived from the same pool (Figure 4-8). Stable genomic
integration of the tdTomato exchange cassette was verified for the binary RMCE master cell
lines TE3-B4-H1 and TE3-B4-L1.1 by tracking their flowcytometry profiles over 11 weeks
(Figure 4-9).
The binary RMCE master cell lines TE3-B4-H1 and TE3-B4-L1.1 were further used to
generate several producer cell lines as higher yields for locus 1 (PEF-FRT3-eGFP-FRTwt-Δneo)
were anticipated compared to the SWI3_26 derived TE1-B1 clones (Figure 4-5).
Figure 4‐6: Flowcytometric analysis after 1st round of FACS for tdTomato positive clones following genomic tagging of RMCE master cell lines SWI3_26 and SMT_dneo(2)_24 with pEF‐FS‐tdTomato_dpuro. Histograms obtained with the Guava easyCyte flowcytometer show the level and divergence of red fluorescence for TE1‐B1 cells derived from the tdTomato tagged RMCE master cell line SWI3_26 (left) and for TE3‐B4 cells derived from the tdTomato tagged RMCE master cell line SMT_dneo(2)_24 (right) after one round of FACS for tdTomato positive cells 3 and 5 weeks after sorting respectively.
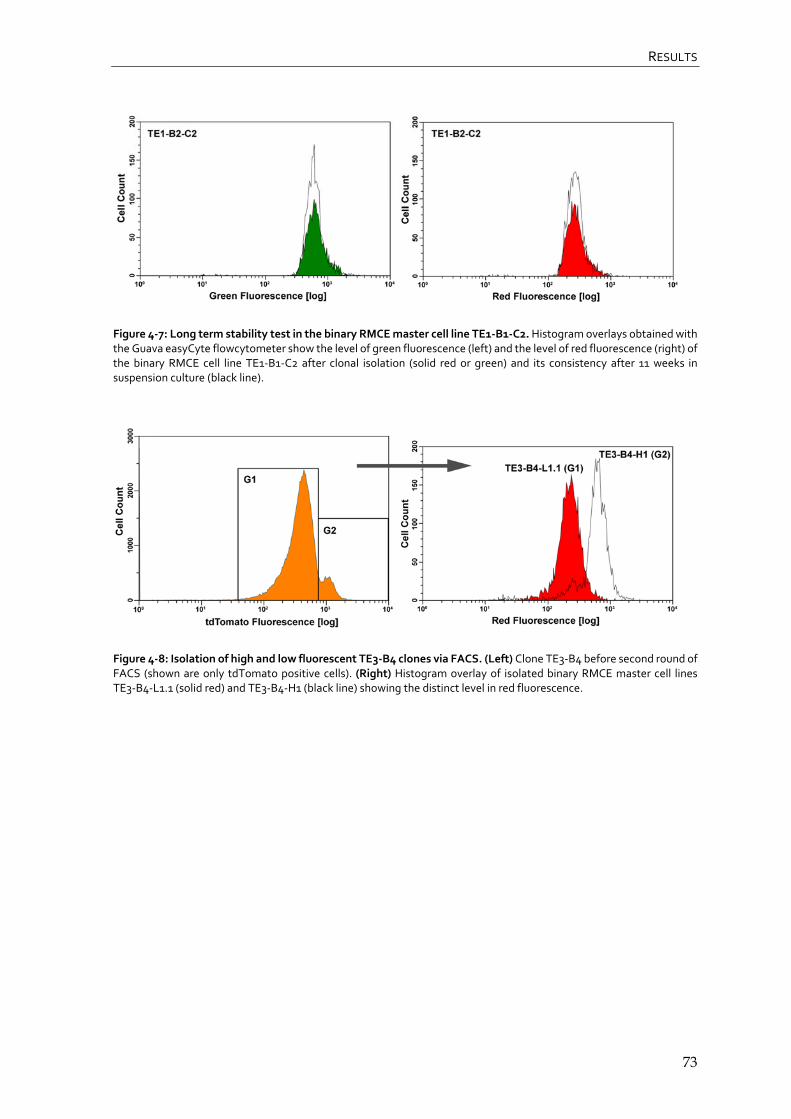
RESULTS
73
Figure 4‐7: Long term stability test in the binary RMCE master cell line TE1‐B1‐C2. Histogram overlays obtained with the Guava easyCyte flowcytometer show the level of green fluorescence (left) and the level of red fluorescence (right) of the binary RMCE cell line TE1‐B1‐C2 after clonal isolation (solid red or green) and its consistency after 11 weeks in suspension culture (black line).
Figure 4‐8: Isolation of high and low fluorescent TE3‐B4 clones via FACS. (Left) Clone TE3‐B4 before second round of FACS (shown are only tdTomato positive cells). (Right) Histogram overlay of isolated binary RMCE master cell lines TE3‐B4‐L1.1 (solid red) and TE3‐B4‐H1 (black line) showing the distinct level in red fluorescence.
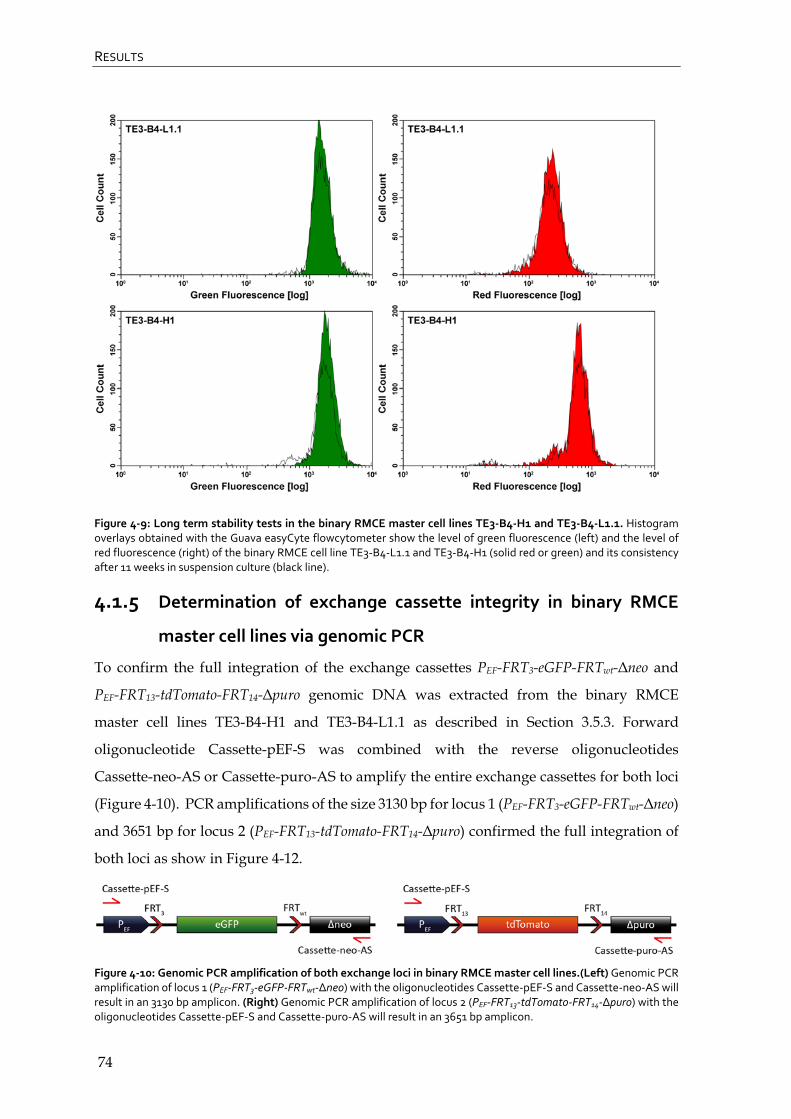
RESULTS
74
Figure 4‐9: Long term stability tests in the binary RMCE master cell lines TE3‐B4‐H1 and TE3‐B4‐L1.1. Histogram overlays obtained with the Guava easyCyte flowcytometer show the level of green fluorescence (left) and the level of red fluorescence (right) of the binary RMCE cell line TE3‐B4‐L1.1 and TE3‐B4‐H1 (solid red or green) and its consistency after 11 weeks in suspension culture (black line).
4.1.5 Determination of exchange cassette integrity in binary RMCE
master cell lines via genomic PCR
To confirm the full integration of the exchange cassettes PEF-FRT3-eGFP-FRTwt-Δneo and
PEF-FRT13-tdTomato-FRT14-Δpuro genomic DNA was extracted from the binary RMCE
master cell lines TE3-B4-H1 and TE3-B4-L1.1 as described in Section 3.5.3. Forward
oligonucleotide Cassette-pEF-S was combined with the reverse oligonucleotides
Cassette-neo-AS or Cassette-puro-AS to amplify the entire exchange cassettes for both loci
(Figure 4-10). PCR amplifications of the size 3130 bp for locus 1 (PEF-FRT3-eGFP-FRTwt-Δneo)
and 3651 bp for locus 2 (PEF-FRT13-tdTomato-FRT14-Δpuro) confirmed the full integration of
both loci as show in Figure 4-12.
Figure 4‐10: Genomic PCR amplification of both exchange loci in binary RMCE master cell lines.(Left) Genomic PCR amplification of locus 1 (PEF‐FRT3‐eGFP‐FRTwt‐Δneo) with the oligonucleotides Cassette‐pEF‐S and Cassette‐neo‐AS will result in an 3130 bp amplicon. (Right) Genomic PCR amplification of locus 2 (PEF‐FRT13‐tdTomato‐FRT14‐Δpuro) with the oligonucleotides Cassette‐pEF‐S and Cassette‐puro‐AS will result in an 3651 bp amplicon.
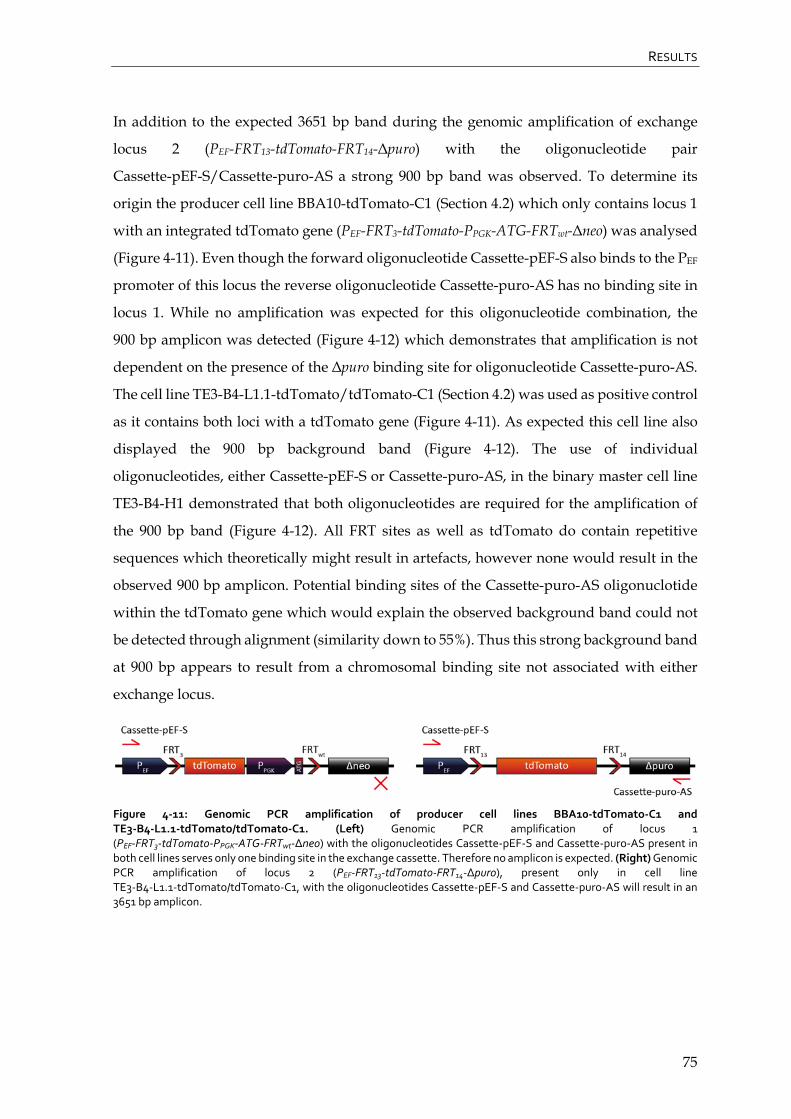
RESULTS
75
In addition to the expected 3651 bp band during the genomic amplification of exchange
locus 2 (PEF-FRT13-tdTomato-FRT14-Δpuro) with the oligonucleotide pair
Cassette-pEF-S/Cassette-puro-AS a strong 900 bp band was observed. To determine its
origin the producer cell line BBA10-tdTomato-C1 (Section 4.2) which only contains locus 1
with an integrated tdTomato gene (PEF-FRT3-tdTomato-PPGK-ATG-FRTwt-Δneo) was analysed
(Figure 4-11). Even though the forward oligonucleotide Cassette-pEF-S also binds to the PEF
promoter of this locus the reverse oligonucleotide Cassette-puro-AS has no binding site in
locus 1. While no amplification was expected for this oligonucleotide combination, the
900 bp amplicon was detected (Figure 4-12) which demonstrates that amplification is not
dependent on the presence of the Δpuro binding site for oligonucleotide Cassette-puro-AS.
The cell line TE3-B4-L1.1-tdTomato/tdTomato-C1 (Section 4.2) was used as positive control
as it contains both loci with a tdTomato gene (Figure 4-11). As expected this cell line also
displayed the 900 bp background band (Figure 4-12). The use of individual
oligonucleotides, either Cassette-pEF-S or Cassette-puro-AS, in the binary master cell line
TE3-B4-H1 demonstrated that both oligonucleotides are required for the amplification of
the 900 bp band (Figure 4-12). All FRT sites as well as tdTomato do contain repetitive
sequences which theoretically might result in artefacts, however none would result in the
observed 900 bp amplicon. Potential binding sites of the Cassette-puro-AS oligonuclotide
within the tdTomato gene which would explain the observed background band could not
be detected through alignment (similarity down to 55%). Thus this strong background band
at 900 bp appears to result from a chromosomal binding site not associated with either
exchange locus.
Figure 4‐11: Genomic PCR amplification of producer cell lines BBA10‐tdTomato‐C1 and TE3‐B4‐L1.1‐tdTomato/tdTomato‐C1. (Left) Genomic PCR amplification of locus 1 (PEF‐FRT3‐tdTomato‐PPGK‐ATG‐FRTwt‐Δneo) with the oligonucleotides Cassette‐pEF‐S and Cassette‐puro‐AS present in both cell lines serves only one binding site in the exchange cassette. Therefore no amplicon is expected. (Right) Genomic PCR amplification of locus 2 (PEF‐FRT13‐tdTomato‐FRT14‐Δpuro), present only in cell line TE3‐B4‐L1.1‐tdTomato/tdTomato‐C1, with the oligonucleotides Cassette‐pEF‐S and Cassette‐puro‐AS will result in an 3651 bp amplicon.
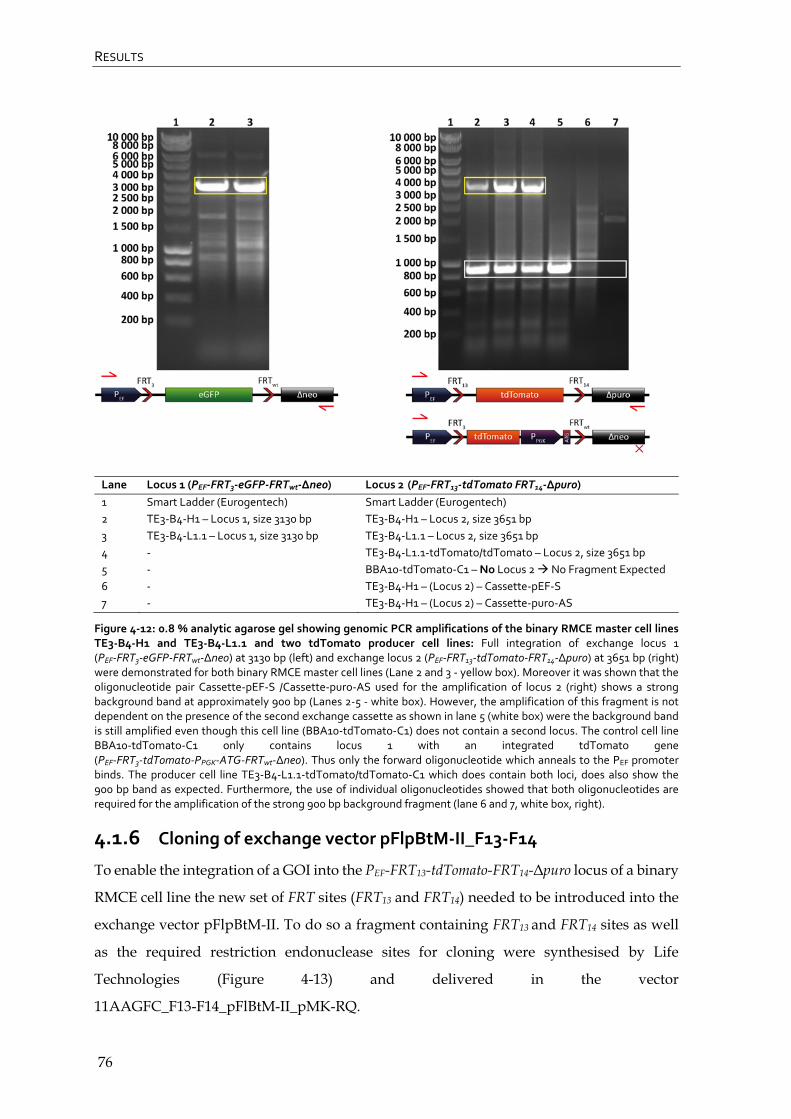
RESULTS
76
Lane Locus 1 (PEF‐FRT3‐eGFP‐FRTwt‐Δneo) Locus 2 (PEF‐FRT13‐tdTomato FRT14‐Δpuro)
1 Smart Ladder (Eurogentech) Smart Ladder (Eurogentech)
2 TE3‐B4‐H1 – Locus 1, size 3130 bp TE3‐B4‐H1 – Locus 2, size 3651 bp
3 TE3‐B4‐L1.1 – Locus 1, size 3130 bp TE3‐B4‐L1.1 – Locus 2, size 3651 bp
4 ‐ TE3‐B4‐L1.1‐tdTomato/tdTomato – Locus 2, size 3651 bp
5 ‐ BBA10‐tdTomato‐C1 – No Locus 2 No Fragment Expected
6 ‐ TE3‐B4‐H1 – (Locus 2) – Cassette‐pEF‐S
7 ‐ TE3‐B4‐H1 – (Locus 2) – Cassette‐puro‐AS
Figure 4‐12: 0.8 % analytic agarose gel showing genomic PCR amplifications of the binary RMCE master cell lines TE3‐B4‐H1 and TE3‐B4‐L1.1 and two tdTomato producer cell lines: Full integration of exchange locus 1 (PEF‐FRT3‐eGFP‐FRTwt‐Δneo) at 3130 bp (left) and exchange locus 2 (PEF‐FRT13‐tdTomato‐FRT14‐Δpuro) at 3651 bp (right) were demonstrated for both binary RMCE master cell lines (Lane 2 and 3 ‐ yellow box). Moreover it was shown that the oligonucleotide pair Cassette‐pEF‐S /Cassette‐puro‐AS used for the amplification of locus 2 (right) shows a strong background band at approximately 900 bp (Lanes 2‐5 ‐ white box). However, the amplification of this fragment is not dependent on the presence of the second exchange cassette as shown in lane 5 (white box) were the background band is still amplified even though this cell line (BBA10‐tdTomato‐C1) does not contain a second locus. The control cell line BBA10‐tdTomato‐C1 only contains locus 1 with an integrated tdTomato gene (PEF‐FRT3‐tdTomato‐PPGK‐ATG‐FRTwt‐Δneo). Thus only the forward oligonucleotide which anneals to the PEF promoter binds. The producer cell line TE3‐B4‐L1.1‐tdTomato/tdTomato‐C1 which does contain both loci, does also show the 900 bp band as expected. Furthermore, the use of individual oligonucleotides showed that both oligonucleotides are required for the amplification of the strong 900 bp background fragment (lane 6 and 7, white box, right).
4.1.6 Cloning of exchange vector pFlpBtM‐II_F13‐F14
To enable the integration of a GOI into the PEF-FRT13-tdTomato-FRT14-Δpuro locus of a binary
RMCE cell line the new set of FRT sites (FRT13 and FRT14) needed to be introduced into the
exchange vector pFlpBtM-II. To do so a fragment containing FRT13 and FRT14 sites as well
as the required restriction endonuclease sites for cloning were synthesised by Life
Technologies (Figure 4-13) and delivered in the vector
11AAGFC_F13-F14_pFlBtM-II_pMK-RQ.
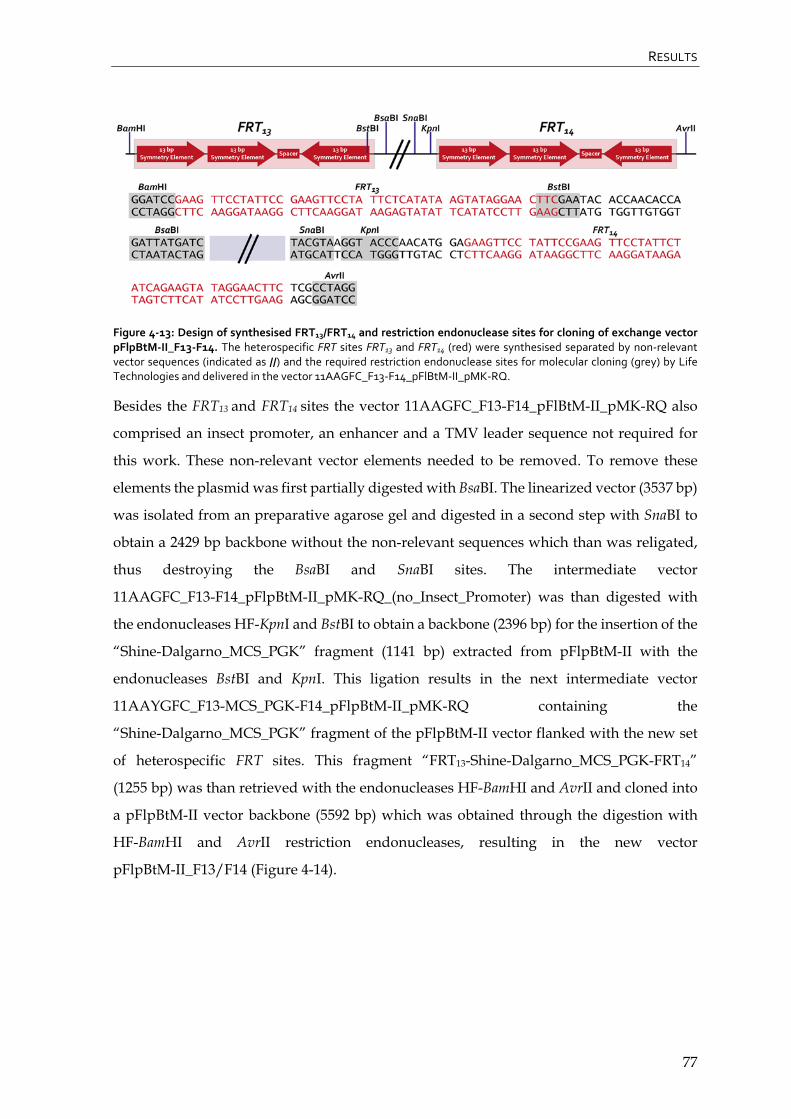
RESULTS
77
Figure 4‐13: Design of synthesised FRT13/FRT14 and restriction endonuclease sites for cloning of exchange vector pFlpBtM‐II_F13‐F14. The heterospecific FRT sites FRT13 and FRT14 (red) were synthesised separated by non‐relevant vector sequences (indicated as //) and the required restriction endonuclease sites for molecular cloning (grey) by Life Technologies and delivered in the vector 11AAGFC_F13‐F14_pFlBtM‐II_pMK‐RQ.
Besides the FRT13 and FRT14 sites the vector 11AAGFC_F13-F14_pFlBtM-II_pMK-RQ also
comprised an insect promoter, an enhancer and a TMV leader sequence not required for
this work. These non-relevant vector elements needed to be removed. To remove these
elements the plasmid was first partially digested with BsaBI. The linearized vector (3537 bp)
was isolated from an preparative agarose gel and digested in a second step with SnaBI to
obtain a 2429 bp backbone without the non-relevant sequences which than was religated,
thus destroying the BsaBI and SnaBI sites. The intermediate vector
11AAGFC_F13-F14_pFlpBtM-II_pMK-RQ_(no_Insect_Promoter) was than digested with
the endonucleases HF-KpnI and BstBI to obtain a backbone (2396 bp) for the insertion of the
“Shine-Dalgarno_MCS_PGK” fragment (1141 bp) extracted from pFlpBtM-II with the
endonucleases BstBI and KpnI. This ligation results in the next intermediate vector
11AAYGFC_F13-MCS_PGK-F14_pFlpBtM-II_pMK-RQ containing the
“Shine-Dalgarno_MCS_PGK” fragment of the pFlpBtM-II vector flanked with the new set
of heterospecific FRT sites. This fragment “FRT13-Shine-Dalgarno_MCS_PGK-FRT14”
(1255 bp) was than retrieved with the endonucleases HF-BamHI and AvrII and cloned into
a pFlpBtM-II vector backbone (5592 bp) which was obtained through the digestion with
HF-BamHI and AvrII restriction endonucleases, resulting in the new vector
pFlpBtM-II_F13/F14 (Figure 4-14).

RESULTS
78
Figure 4‐14: Cloning of exchange vector pFlpBtM‐II_F13/F14. (A) Non‐relevant vector sequences (red line) were removed stepwise from the synthesised vector 11AAGFC_F13‐F14_pFlBtM‐II_pMK‐RQ using BsaBI and SnaBI endonucleases. (B) The backbone was religated thus destroying the BsaBI and SnaBI sites before digestion with BstBI and HF‐KpnI to obtain a vector backbone. (C) The “Shine‐Dalgarno_MCS_PGK” fragment (red line) was retrieved from pFlpBtM‐II with BstBI and HF‐KpnI. (D) The fragment “Shine‐Dalgarno_MCS_PGK” was inserted into the 11AAGFC_F13‐F14_pFlpBtM‐II_pMK‐RQ_(no_Insect_Promoter) backbone to subsequently retrieve the fragment “FRT13‐Shine‐Dalgarno_MCS_PGK‐FRT14” (red line). (E) A pFlpBtM‐II vector backbone (red line) obtained with HF‐BamHI and AvrII (F) was ligated with the “FRT13‐Shine‐Dalgarno_MCS_PGK‐FRT14” fragment to obtain the new exchange vector pFlpBtM‐II_F13/F14.
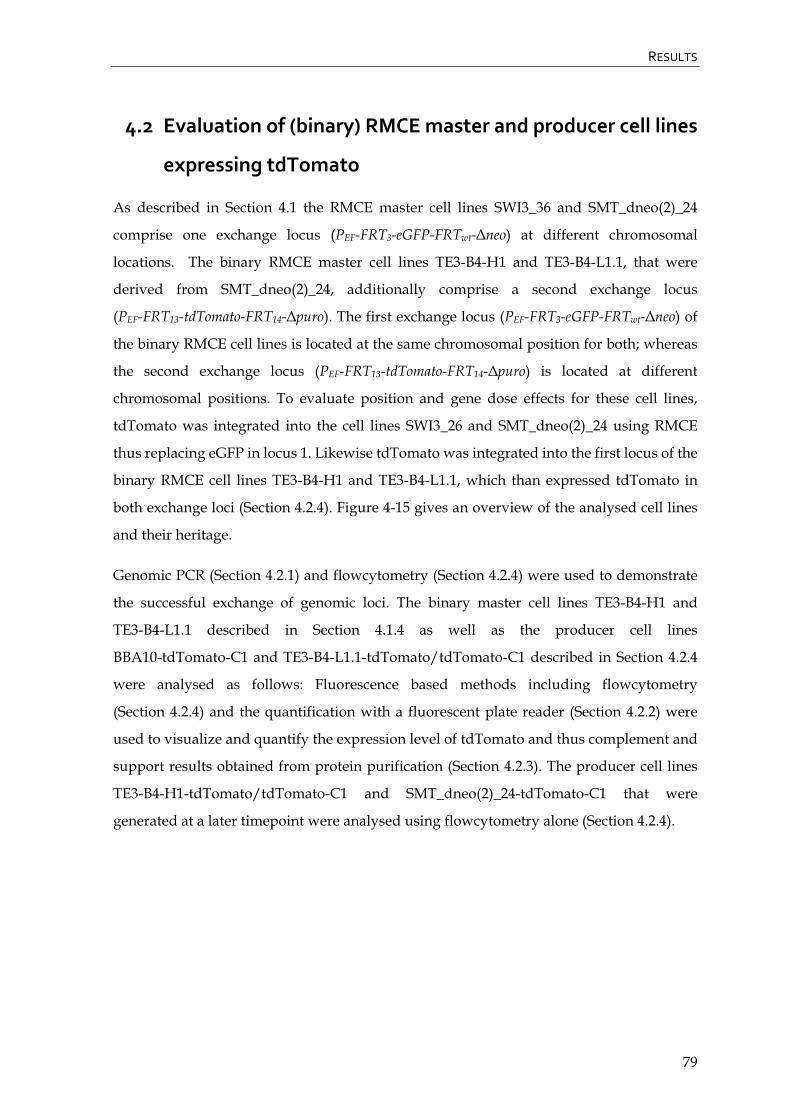
RESULTS
79
4.2 Evaluation of (binary) RMCE master and producer cell lines
expressing tdTomato
As described in Section 4.1 the RMCE master cell lines SWI3_36 and SMT_dneo(2)_24
comprise one exchange locus (PEF-FRT3-eGFP-FRTwt-Δneo) at different chromosomal
locations. The binary RMCE master cell lines TE3-B4-H1 and TE3-B4-L1.1, that were
derived from SMT_dneo(2)_24, additionally comprise a second exchange locus
(PEF-FRT13-tdTomato-FRT14-Δpuro). The first exchange locus (PEF-FRT3-eGFP-FRTwt-Δneo) of
the binary RMCE cell lines is located at the same chromosomal position for both; whereas
the second exchange locus (PEF-FRT13-tdTomato-FRT14-Δpuro) is located at different
chromosomal positions. To evaluate position and gene dose effects for these cell lines,
tdTomato was integrated into the cell lines SWI3_26 and SMT_dneo(2)_24 using RMCE
thus replacing eGFP in locus 1. Likewise tdTomato was integrated into the first locus of the
binary RMCE cell lines TE3-B4-H1 and TE3-B4-L1.1, which than expressed tdTomato in
both exchange loci (Section 4.2.4). Figure 4-15 gives an overview of the analysed cell lines
and their heritage.
Genomic PCR (Section 4.2.1) and flowcytometry (Section 4.2.4) were used to demonstrate
the successful exchange of genomic loci. The binary master cell lines TE3-B4-H1 and
TE3-B4-L1.1 described in Section 4.1.4 as well as the producer cell lines
BBA10-tdTomato-C1 and TE3-B4-L1.1-tdTomato/tdTomato-C1 described in Section 4.2.4
were analysed as follows: Fluorescence based methods including flowcytometry
(Section 4.2.4) and the quantification with a fluorescent plate reader (Section 4.2.2) were
used to visualize and quantify the expression level of tdTomato and thus complement and
support results obtained from protein purification (Section 4.2.3). The producer cell lines
TE3-B4-H1-tdTomato/tdTomato-C1 and SMT_dneo(2)_24-tdTomato-C1 that were
generated at a later timepoint were analysed using flowcytometry alone (Section 4.2.4).
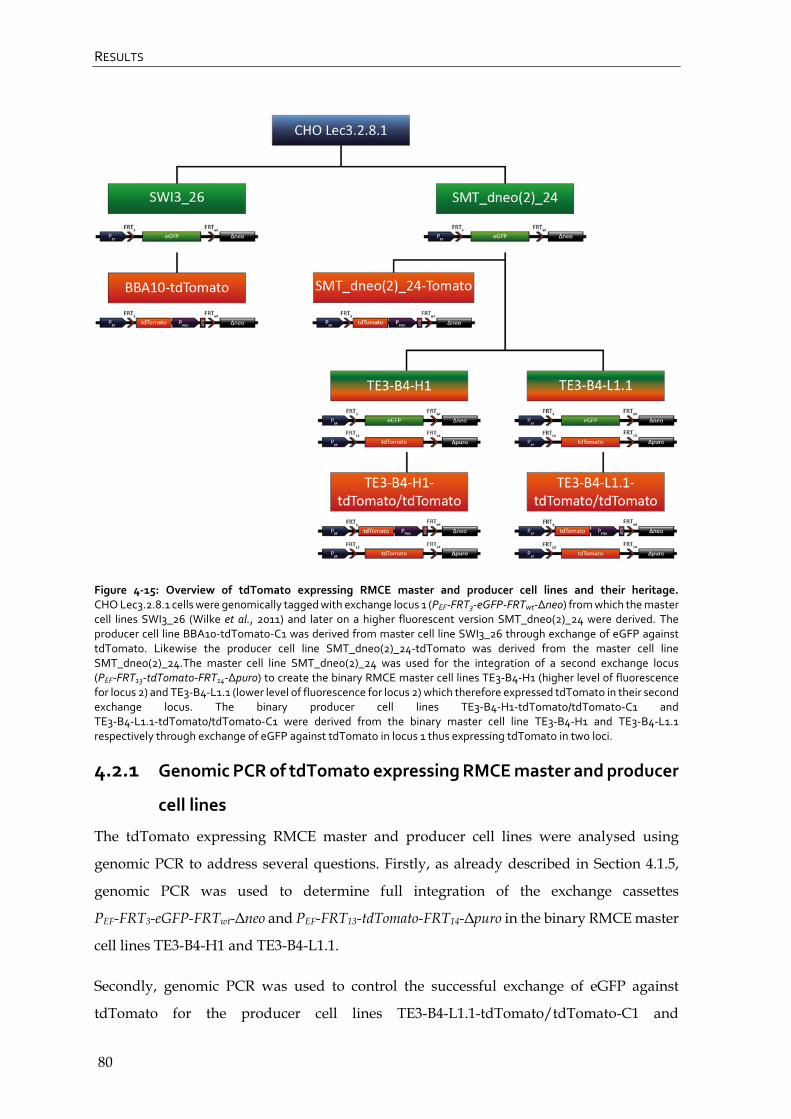
RESULTS
80
Figure 4‐15: Overview of tdTomato expressing RMCE master and producer cell lines and their heritage. CHO Lec3.2.8.1 cells were genomically tagged with exchange locus 1 (PEF‐FRT3‐eGFP‐FRTwt‐Δneo) from which the master cell lines SWI3_26 (Wilke et al., 2011) and later on a higher fluorescent version SMT_dneo(2)_24 were derived. The producer cell line BBA10‐tdTomato‐C1 was derived from master cell line SWI3_26 through exchange of eGFP against tdTomato. Likewise the producer cell line SMT_dneo(2)_24‐tdTomato was derived from the master cell line SMT_dneo(2)_24.The master cell line SMT_dneo(2)_24 was used for the integration of a second exchange locus (PEF‐FRT13‐tdTomato‐FRT14‐Δpuro) to create the binary RMCE master cell lines TE3‐B4‐H1 (higher level of fluorescence for locus 2) and TE3‐B4‐L1.1 (lower level of fluorescence for locus 2) which therefore expressed tdTomato in their second exchange locus. The binary producer cell lines TE3‐B4‐H1‐tdTomato/tdTomato‐C1 and TE3‐B4‐L1.1‐tdTomato/tdTomato‐C1 were derived from the binary master cell line TE3‐B4‐H1 and TE3‐B4‐L1.1 respectively through exchange of eGFP against tdTomato in locus 1 thus expressing tdTomato in two loci.
4.2.1 Genomic PCR of tdTomato expressing RMCE master and producer
cell lines
The tdTomato expressing RMCE master and producer cell lines were analysed using
genomic PCR to address several questions. Firstly, as already described in Section 4.1.5,
genomic PCR was used to determine full integration of the exchange cassettes
PEF-FRT3-eGFP-FRTwt-Δneo and PEF-FRT13-tdTomato-FRT14-Δpuro in the binary RMCE master
cell lines TE3-B4-H1 and TE3-B4-L1.1.
Secondly, genomic PCR was used to control the successful exchange of eGFP against
tdTomato for the producer cell lines TE3-B4-L1.1-tdTomato/tdTomato-C1 and
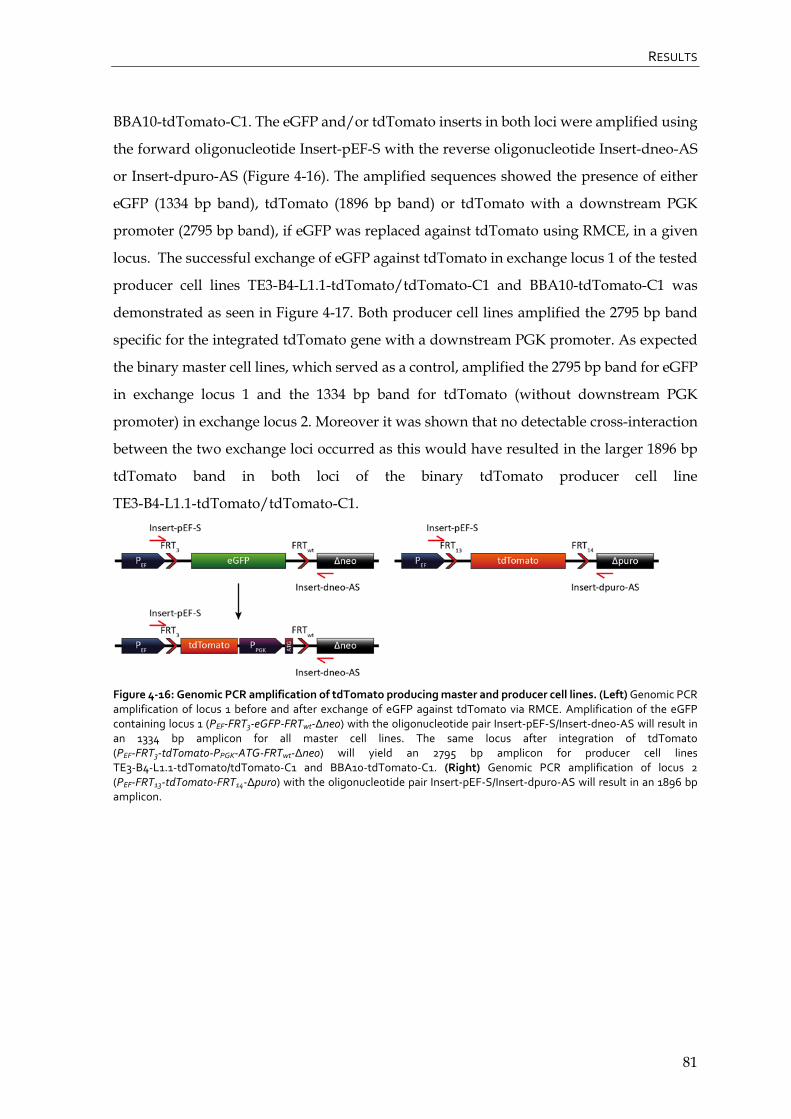
RESULTS
81
BBA10-tdTomato-C1. The eGFP and/or tdTomato inserts in both loci were amplified using
the forward oligonucleotide Insert-pEF-S with the reverse oligonucleotide Insert-dneo-AS
or Insert-dpuro-AS (Figure 4-16). The amplified sequences showed the presence of either
eGFP (1334 bp band), tdTomato (1896 bp band) or tdTomato with a downstream PGK
promoter (2795 bp band), if eGFP was replaced against tdTomato using RMCE, in a given
locus. The successful exchange of eGFP against tdTomato in exchange locus 1 of the tested
producer cell lines TE3-B4-L1.1-tdTomato/tdTomato-C1 and BBA10-tdTomato-C1 was
demonstrated as seen in Figure 4-17. Both producer cell lines amplified the 2795 bp band
specific for the integrated tdTomato gene with a downstream PGK promoter. As expected
the binary master cell lines, which served as a control, amplified the 2795 bp band for eGFP
in exchange locus 1 and the 1334 bp band for tdTomato (without downstream PGK
promoter) in exchange locus 2. Moreover it was shown that no detectable cross-interaction
between the two exchange loci occurred as this would have resulted in the larger 1896 bp
tdTomato band in both loci of the binary tdTomato producer cell line
TE3-B4-L1.1-tdTomato/tdTomato-C1.
Figure 4‐16: Genomic PCR amplification of tdTomato producing master and producer cell lines. (Left) Genomic PCR amplification of locus 1 before and after exchange of eGFP against tdTomato via RMCE. Amplification of the eGFP containing locus 1 (PEF‐FRT3‐eGFP‐FRTwt‐Δneo) with the oligonucleotide pair Insert‐pEF‐S/Insert‐dneo‐AS will result in an 1334 bp amplicon for all master cell lines. The same locus after integration of tdTomato (PEF‐FRT3‐tdTomato‐PPGK‐ATG‐FRTwt‐Δneo) will yield an 2795 bp amplicon for producer cell lines TE3‐B4‐L1.1‐tdTomato/tdTomato‐C1 and BBA10‐tdTomato‐C1. (Right) Genomic PCR amplification of locus 2 (PEF‐FRT13‐tdTomato‐FRT14‐Δpuro) with the oligonucleotide pair Insert‐pEF‐S/Insert‐dpuro‐AS will result in an 1896 bp amplicon.
RESULTS
82
Lane Left agarose gel Right agarose gel
1 Smart Ladder (Eurogentech) Smart Ladder (Eurogentech)
2 TE3‐B4‐H1 – Locus 1, size 1334 bp (eGFP) *BBA10‐tdTomato‐C1 – Locus 1, size 2795 bp
(tdTomato + PGK promoter)
3 TE3‐B4‐L1.1 – Locus 1, size 1334 bp (eGFP)
4 TE3‐B4‐L1.1‐tdTomato/tdTomato‐C1 – Locus 1,
size 2795 bp (tdTomato + PGK promoter)
5 *BBA10‐tdTomato‐C1 – Locus 1, size 2795 bp
(Did not Amplified see gel on the right)
6 Smart Ladder (Eurogentech)
7 TE3‐B4‐H1 – Locus 2, size 1896 bp (tdTomato)
8 TE3‐B4‐L1.1 – Locus 2, size 1896 bp (tdTomato)
9 TE3‐B4‐L1.1‐tdTomato/tdTomato‐C1 – Locus 2,
size 1896 bp (tdTomato)
10 BBA10‐tdTomato‐C1 – No Locus 2 No
Fragment Expected
Figure 4‐17: 0.8 % analytic agarose gel showing genomic PCR amplifications of the binary RMCE master cell lines TE3‐B4‐H1 and TE3‐B4‐L1.1 as well as producer cell lines TE3‐B4‐L1.1‐tdTomato/tdTomato‐C1 and BBA10‐tdTomato‐C1: The genomic amplification of either eGFP or tdTomato in locus 1 or locus 2 demonstrated the successful exchange of eGFP against tdTomato in the cell lines TE3‐B4‐L1.1‐tdTomato/tdTomato‐C1 and BBA10‐tdTomato‐C1. The amplification marked with a wildcard (*,left gel) did not work and was repeated (*,right gel).
4.2.2 Quantification of tdTomato expressing RMCE master and
producer cell lines by fluorescence with the Tecan MD 1000 plate
reader
To quantify the expression of tdTomato and determine eventual batch to batch variations
that might occur; the tdTomato expressing cell lines TE3-B4-H1, TE3-B4-L1.1,
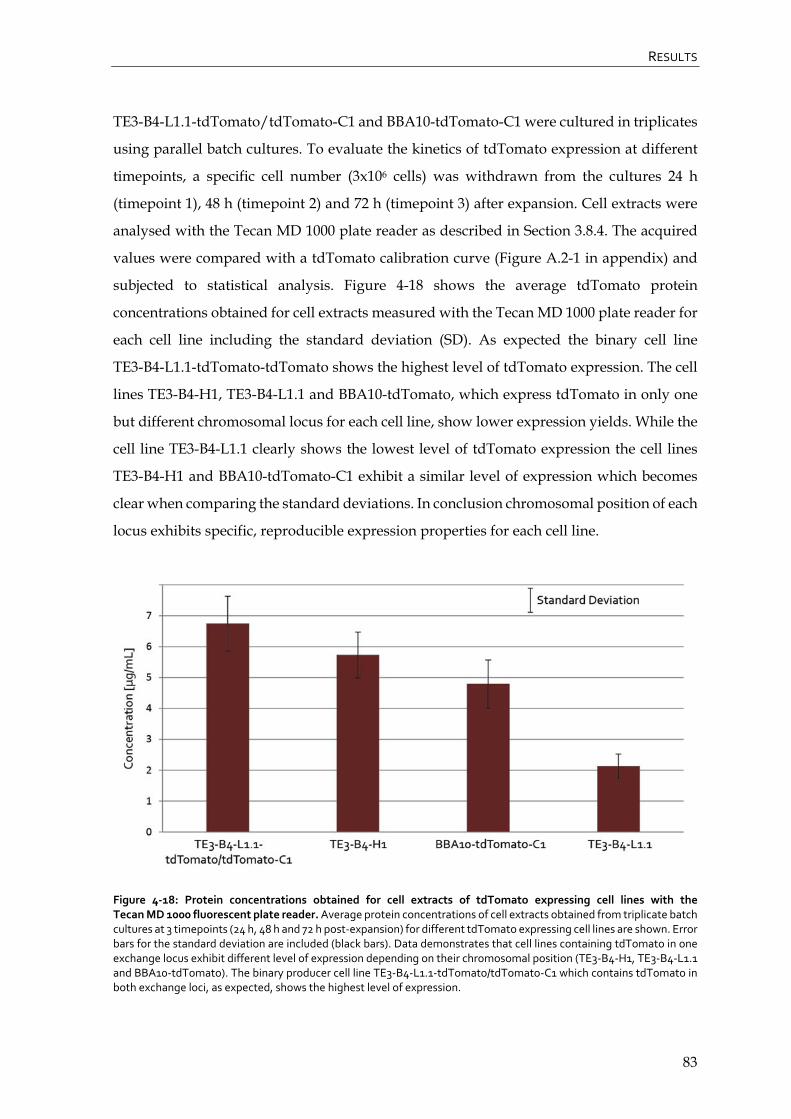
RESULTS
83
TE3-B4-L1.1-tdTomato/tdTomato-C1 and BBA10-tdTomato-C1 were cultured in triplicates
using parallel batch cultures. To evaluate the kinetics of tdTomato expression at different
timepoints, a specific cell number (3x10⁶ cells) was withdrawn from the cultures 24 h
(timepoint 1), 48 h (timepoint 2) and 72 h (timepoint 3) after expansion. Cell extracts were
analysed with the Tecan MD 1000 plate reader as described in Section 3.8.4. The acquired
values were compared with a tdTomato calibration curve (Figure A.2-1 in appendix) and
subjected to statistical analysis. Figure 4-18 shows the average tdTomato protein
concentrations obtained for cell extracts measured with the Tecan MD 1000 plate reader for
each cell line including the standard deviation (SD). As expected the binary cell line
TE3-B4-L1.1-tdTomato-tdTomato shows the highest level of tdTomato expression. The cell
lines TE3-B4-H1, TE3-B4-L1.1 and BBA10-tdTomato, which express tdTomato in only one
but different chromosomal locus for each cell line, show lower expression yields. While the
cell line TE3-B4-L1.1 clearly shows the lowest level of tdTomato expression the cell lines
TE3-B4-H1 and BBA10-tdTomato-C1 exhibit a similar level of expression which becomes
clear when comparing the standard deviations. In conclusion chromosomal position of each
locus exhibits specific, reproducible expression properties for each cell line.
Figure 4‐18: Protein concentrations obtained for cell extracts of tdTomato expressing cell lines with the Tecan MD 1000 fluorescent plate reader. Average protein concentrations of cell extracts obtained from triplicate batch cultures at 3 timepoints (24 h, 48 h and 72 h post‐expansion) for different tdTomato expressing cell lines are shown. Error bars for the standard deviation are included (black bars). Data demonstrates that cell lines containing tdTomato in one exchange locus exhibit different level of expression depending on their chromosomal position (TE3‐B4‐H1, TE3‐B4‐L1.1 and BBA10‐tdTomato). The binary producer cell line TE3‐B4‐L1.1‐tdTomato/tdTomato‐C1 which contains tdTomato in both exchange loci, as expected, shows the highest level of expression.
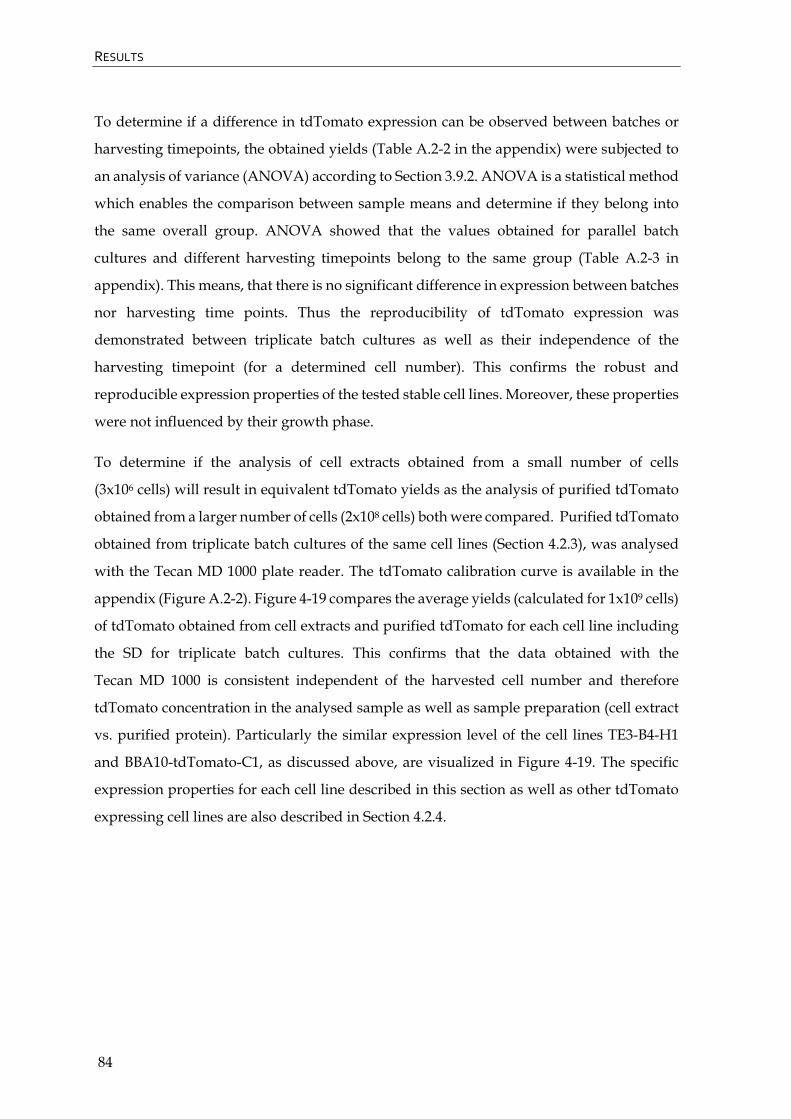
RESULTS
84
To determine if a difference in tdTomato expression can be observed between batches or
harvesting timepoints, the obtained yields (Table A.2-2 in the appendix) were subjected to
an analysis of variance (ANOVA) according to Section 3.9.2. ANOVA is a statistical method
which enables the comparison between sample means and determine if they belong into
the same overall group. ANOVA showed that the values obtained for parallel batch
cultures and different harvesting timepoints belong to the same group (Table A.2-3 in
appendix). This means, that there is no significant difference in expression between batches
nor harvesting time points. Thus the reproducibility of tdTomato expression was
demonstrated between triplicate batch cultures as well as their independence of the
harvesting timepoint (for a determined cell number). This confirms the robust and
reproducible expression properties of the tested stable cell lines. Moreover, these properties
were not influenced by their growth phase.
To determine if the analysis of cell extracts obtained from a small number of cells
(3x10⁶ cells) will result in equivalent tdTomato yields as the analysis of purified tdTomato
obtained from a larger number of cells (2x10⁸ cells) both were compared. Purified tdTomato
obtained from triplicate batch cultures of the same cell lines (Section 4.2.3), was analysed
with the Tecan MD 1000 plate reader. The tdTomato calibration curve is available in the
appendix (Figure A.2-2). Figure 4-19 compares the average yields (calculated for 1x10⁹ cells)
of tdTomato obtained from cell extracts and purified tdTomato for each cell line including
the SD for triplicate batch cultures. This confirms that the data obtained with the
Tecan MD 1000 is consistent independent of the harvested cell number and therefore
tdTomato concentration in the analysed sample as well as sample preparation (cell extract
vs. purified protein). Particularly the similar expression level of the cell lines TE3-B4-H1
and BBA10-tdTomato-C1, as discussed above, are visualized in Figure 4-19. The specific
expression properties for each cell line described in this section as well as other tdTomato
expressing cell lines are also described in Section 4.2.4.
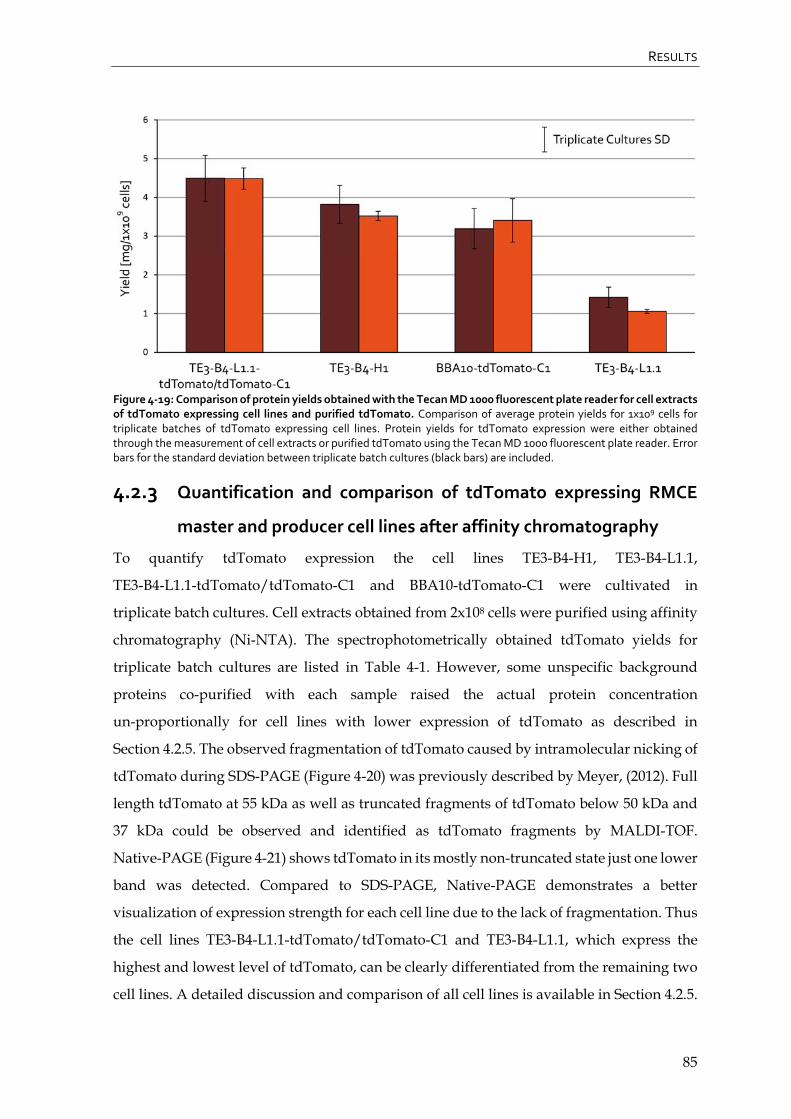
RESULTS
85
Figure 4‐19: Comparison of protein yields obtained with the Tecan MD 1000 fluorescent plate reader for cell extracts of tdTomato expressing cell lines and purified tdTomato. Comparison of average protein yields for 1x10⁹ cells for triplicate batches of tdTomato expressing cell lines. Protein yields for tdTomato expression were either obtained through the measurement of cell extracts or purified tdTomato using the Tecan MD 1000 fluorescent plate reader. Error bars for the standard deviation between triplicate batch cultures (black bars) are included.
4.2.3 Quantification and comparison of tdTomato expressing RMCE
master and producer cell lines after affinity chromatography
To quantify tdTomato expression the cell lines TE3-B4-H1, TE3-B4-L1.1,
TE3-B4-L1.1-tdTomato/tdTomato-C1 and BBA10-tdTomato-C1 were cultivated in
triplicate batch cultures. Cell extracts obtained from 2x10⁸ cells were purified using affinity
chromatography (Ni-NTA). The spectrophotometrically obtained tdTomato yields for
triplicate batch cultures are listed in Table 4-1. However, some unspecific background
proteins co-purified with each sample raised the actual protein concentration
un-proportionally for cell lines with lower expression of tdTomato as described in
Section 4.2.5. The observed fragmentation of tdTomato caused by intramolecular nicking of
tdTomato during SDS-PAGE (Figure 4-20) was previously described by Meyer, (2012). Full
length tdTomato at 55 kDa as well as truncated fragments of tdTomato below 50 kDa and
37 kDa could be observed and identified as tdTomato fragments by MALDI-TOF.
Native-PAGE (Figure 4-21) shows tdTomato in its mostly non-truncated state just one lower
band was detected. Compared to SDS-PAGE, Native-PAGE demonstrates a better
visualization of expression strength for each cell line due to the lack of fragmentation. Thus
the cell lines TE3-B4-L1.1-tdTomato/tdTomato-C1 and TE3-B4-L1.1, which express the
highest and lowest level of tdTomato, can be clearly differentiated from the remaining two
cell lines. A detailed discussion and comparison of all cell lines is available in Section 4.2.5.
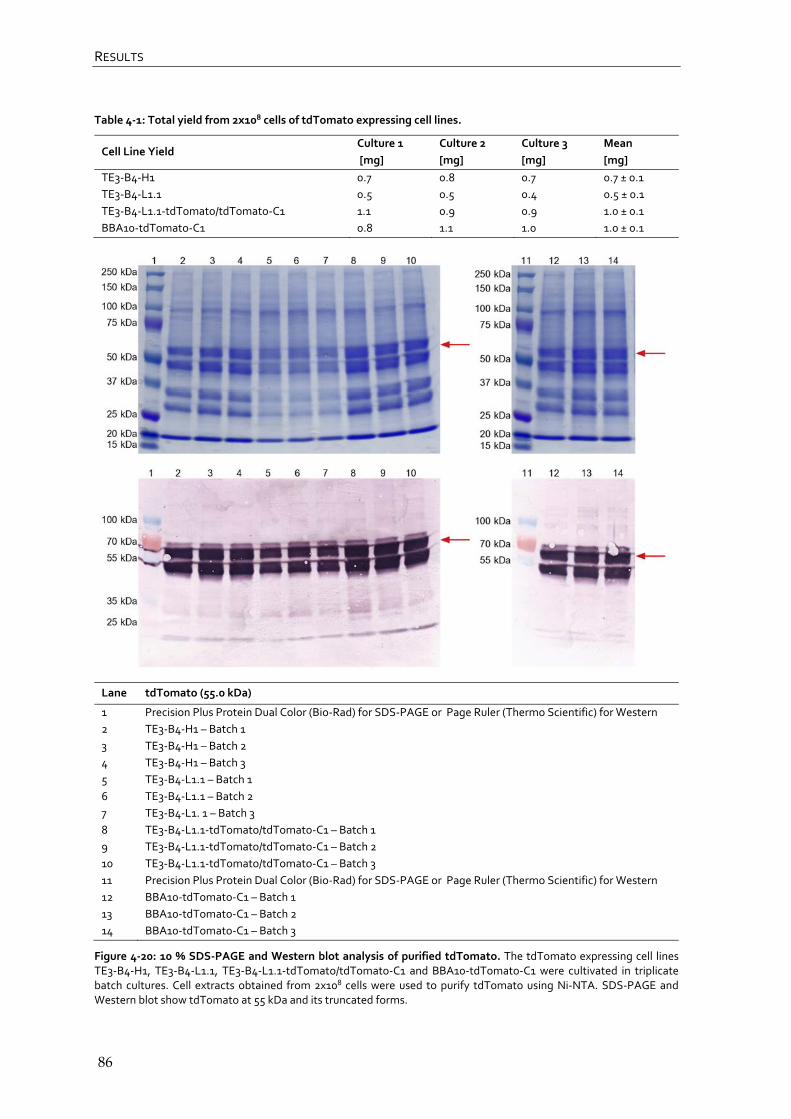
RESULTS
86
Table 4‐1: Total yield from 2x10⁸ cells of tdTomato expressing cell lines.
Cell Line Yield Culture 1
[mg]
Culture 2
[mg]
Culture 3
[mg]
Mean
[mg]
TE3‐B4‐H1 0.7 0.8 0.7 0.7 ± 0.1
TE3‐B4‐L1.1 0.5 0.5 0.4 0.5 ± 0.1
TE3‐B4‐L1.1‐tdTomato/tdTomato‐C1 1.1 0.9 0.9 1.0 ± 0.1
BBA10‐tdTomato‐C1 0.8 1.1 1.0 1.0 ± 0.1
Lane tdTomato (55.0 kDa)
1 Precision Plus Protein Dual Color (Bio‐Rad) for SDS‐PAGE or Page Ruler (Thermo Scientific) for Western
2 TE3‐B4‐H1 – Batch 1
3 TE3‐B4‐H1 – Batch 2
4 TE3‐B4‐H1 – Batch 3
5 TE3‐B4‐L1.1 – Batch 1
6 TE3‐B4‐L1.1 – Batch 2
7 TE3‐B4‐L1. 1 – Batch 3
8 TE3‐B4‐L1.1‐tdTomato/tdTomato‐C1 – Batch 1
9 TE3‐B4‐L1.1‐tdTomato/tdTomato‐C1 – Batch 2
10 TE3‐B4‐L1.1‐tdTomato/tdTomato‐C1 – Batch 3
11 Precision Plus Protein Dual Color (Bio‐Rad) for SDS‐PAGE or Page Ruler (Thermo Scientific) for Western
12 BBA10‐tdTomato‐C1 – Batch 1
13 BBA10‐tdTomato‐C1 – Batch 2
14 BBA10‐tdTomato‐C1 – Batch 3
Figure 4‐20: 10 % SDS‐PAGE and Western blot analysis of purified tdTomato. The tdTomato expressing cell lines TE3‐B4‐H1, TE3‐B4‐L1.1, TE3‐B4‐L1.1‐tdTomato/tdTomato‐C1 and BBA10‐tdTomato‐C1 were cultivated in triplicate batch cultures. Cell extracts obtained from 2x10⁸ cells were used to purify tdTomato using Ni‐NTA. SDS‐PAGE and Western blot show tdTomato at 55 kDa and its truncated forms.

RESULTS
87
Lane tdTomato (55.0 kDa)
1 TE3‐B4‐H1 – Batch 1
2 TE3‐B4‐H1 – Batch 2
3 TE3‐B4‐H1 – Batch 3
4 TE3‐B4‐L1.1 – Batch 1
5 TE3‐B4‐L1.1 – Batch 2
6 TE3‐B4‐L1. 1 – Batch 3
7 TE3‐B4‐L1.1‐tdTomato/tdTomato‐C1 – Batch 1
8 TE3‐B4‐L1.1‐tdTomato/tdTomato‐C1 – Batch 2
9 TE3‐B4‐L1.1‐tdTomato/tdTomato‐C1 – Batch 3
10 BBA10‐tdTomato‐C1 – Batch 1
11 BBA10‐tdTomato‐C1 – Batch 2
12 BBA10‐tdTomato‐C1 – Batch 3
Figure 4‐21: 4 % ‐ 16 % Native‐PAGE of purified tdTomato. Native page shows purified tdTomato from Figure 4‐20 in its mostly non‐truncated form just one lower band was detected.
4.2.4 Flowcytometric analysis of tdTomato expressing RMCE master
and producer cell lines
Flowcytometry was used to define the different level of tdTomato expression for the binary
master cell lines TE3-B4-H1 and TE3-B4-L1.1 (Section 4.1.4) as well as the producer cell lines
BBA10-tdTomato-C1, SMT_dneo2(24)-tdTomato-C1 and the binary producer cell lines
TE3-B4-H1-tdTomato/tdTomato-C1 and TE3-B4-L1.1-tdTomato/tdTomato-C1 described
below.
To generate binary producer cell lines expressing tdTomato in two chromosomal loci the
binary master cell lines TE3-B4-H1 and TE3-B4-L1.1 were used. These binary master cell
lines already express tdTomato in exchange locus 2 (PEF-FRT13-tdTomato-FRT14-Δpuro). They
were used to create the binary producer cell lines TE3-B4-H1-tdTomato/tdTomato-C1
(Johannes Spehr, HZI) and TE3-B4-L1.1-tdTomato/tdTomato-C1 respectively through the
exchange of eGFP in locus 1 (PEF-FRT3-eGFP-FRTwt-Δneo) against tdTomato using RMCE.
Successful integration of tdTomato into locus 1 was demonstrated via flowcytometry. The

RESULTS
88
introduction of a second copy of the tdTomato gene, and the consequent increase in
tdTomato expression, could be detected through the rise in fluorescence levels
(Figure 4-22). Likewise tdTomato was integrated into the master cell lines SWI3_26 and
SMT_dneo(2)_24 to generate the producer cell lines BBA10-tdTomato-C1 as previously
described in Section 4.1.2 and SMT_dneo(2)_24-tdTomato-C1 (Johannes Spehr, HZI)
respectively (Figure 4-23).
Figure 4‐22: Flowcytometric analysis of binary RMCE master and producer cell lines expressing tdTomato: Histogram overlays obtained with the Guava easyCyte flowcytometer show the level of green fluorescence (left) and the level of red fluorescence (right) for binary master and producer cell line. (Top) Master cell line TE3‐B4‐H1 (black lines) and producer cell line TE3‐B4‐H1 tdTomato/tdTomato‐C1 (solid green or red). (Bottom) Master cell line TE3‐B4‐L1.1 (black lines) and producer cell line TE3‐B4‐L1.1‐tdTomato/tdTomato‐C1 (solid green or red). Both producer cell lines were derived from their respective master cell lines through the exchange of eGFP against tdTomato in exchange locus 1 (PEF‐FRT3‐eGFP‐FRTwt‐Δneo) via RMCE. Data demonstrates the successful exchange of eGFP against tdTomato in locus 1.
The binary master cell lines TE3-B4-H1 and TE3-B4-L1.1 described in Section 4.1.4 contain
only one exchange locus expressing tdTomato. Nonetheless, the integration of tdTomato at
different chromosomal loci results in different expression level as shown previously
(Section 4.1.4).
Histogram overlays of all tdTomato expressing cell lines are shown in Figure 4-23. This
visualizes and demonstrates the different level of tdTomato expression for each cell line.
Figure 4-24 shows a direct comparison of mean fluorescence for the binary producer cell

RESULTS
89
lines TE3-B4-H1-tdTomato/tdTomato-C1 and TE3-B4-L1.1-tdTomato/tdTomato-C1 that
express tdTomato in both exchange loci in comparison to appropriate cell lines that express
tdTomato in one of either locus alone. Numeric values are available in Table A.2-1 in the
appendix. In summary this data demonstrates a cumulative effect in tdTomato expression
for the binary RMCE system proportional to the expression capabilities of each locus if both
exchange loci express tdTomato. Furthermore it was shown that the integration at a
chromosomal location with high expression capabilities can have the same effect as the
introduction of several copy numbers of a GOI. For example the binary producer cell line
TE3-B4-L1.1-tdTomato/tdTomato-C1 shows similar level of tdTomato expression as the
cell line TE3-B4-H1 that only expresses tdTomato in one exchange cassette. Likewise the
effects of chromosomal positioning are demonstrated by the cell lines that express
tdTomato in only one exchange cassette at different chromosomal loci
(BBA10-tdTomato-C1, SMT_dneo(2)_24, TE3-B4-H1 and TE3-B4-L1.1).
Figure 4‐23: Flowcytometric analysis of all tdTomato expressing RMCE master and producer cell lines: Histogram overlay obtained with the Guava easyCyte flowcytometer shows the level of red fluorescence for the RMCE master cell lines TE3‐B4‐H1 (light brown) and TE3‐B4‐L1.1 (light red) as well as producer cell lines TE3‐B4‐H1‐tdTomato/tdTomato‐C1 (black) TE3‐B4‐L1.1‐tdTomato/tdTomato‐C1 (dark brown), SMT_dneo(2)_24‐tdTomato‐C1 (dark grey) and BBA10‐tdTomato‐C1 (light grey).

RESULTS
90
Figure 4‐24: Mean red fluorescence of tdTomato expressing cell lines that express tdTomato at one or two chromosomal loci: (Top) Comparison of red fluorescence level in the binary producer cell line TE3‐B4‐H1‐tdTomato/tdTomato‐C1 which expresses tdTomato in both exchange cassettes, to the red fluorescence level of SMT_dneo(2)_24‐tdTomato and TE3‐B4‐H1 that express tdTomato in only one exchange cassette that refer to locus 1 or locus 2 of the binary producer cell line respectively. (Bottom) Comparison of red fluorescence level in the binary producer cell line TE3‐B4‐L1.1‐tdTomato/tdTomato‐C1 which expresses tdTomato in both exchange cassettes, to the red fluorescence level of SMT_dneo(2)_24‐tdTomato and TE3‐B4‐L1 that express tdTomato in only one exchange cassette that refer to locus 1 or locus 2 of the binary producer cell line respectively.
4.2.5 Summary and conclusion – evaluation of tdTomato expressing
RMCE master and producer cell lines
Expression level of tdTomato expressing RMCE master and producer cell lines were
evaluated in Sections 4.2.2 - 4.2.4 using several methods. Quantitative yield obtained from
fluorometric quantification with the Tecan MD-1000 plate reader (Section 4.2.2) and protein
purification (Section 4.2.3) are summarised in Table 4-2. As described previously in
Section 4.2.3 some unspecifically bound protein was co-purified during Ni-NTA which
raised the obtained protein yields unproportionally for cell lines with lower tdTomato
expression (TE3-B4-L1.1 and BBA10-tdTomato-C1) when measured using a
spectrophotometer (NanoDrop).
Table 4‐2: Summary table for tdTomato expression data.
Cell Line
Yield [mg/1x109 cells]
Cell extract
Tecan MD 1000
Yield [mg/1x109 cells]
Purified tdTomato
Tecan MD 1000
Yield [mg/1x109 cells]
Purified protein
NanoDrop
TE3‐B4‐H1 3.8 3.5 3.6
TE3‐B4‐L1.1 1.4 1.1 2.4
TE3‐B4‐L1.1‐tdTomato/tdTomato‐C1 4.5 4.5 4.8
BBA10‐tdTomato‐C1 3.2 3.4 4.9
In summary, tdTomato expressing cell lines that comprise tdTomato in only one but distinct
exchange locus (TE3-B4-L1.1, TE3-B4-H1, SMT_dneo(2)_24-tdTomato-C1 and
BBA10-tdTomato-C1) showed locus specific levels of tdTomato expression as described in

RESULTS
91
Sections 4.2.2 - 4.2.4. The binary producer cell lines TE3-B4-H1-tdTomato/tdTomato-C1
and TE3-B4-L1.1-tdTomato/tdTomato-C1 that express tdTomato in two genomic loci
showed cumulative level of expression which were proportional to the expression
capabilities of each locus. This demonstrates that targeted integration into pre-characterised
genomic loci in a binary RMCE system can be used to obtain stable producer cell lines with
predictable expression properties. The use of chromosomal loci with high expression
capabilities in both loci will be desirable for most targets. However, the use of binary RMCE
cell lines that show different expression capabilities for each locus may proof useful for the
co-expression of proteins that are required in a varying proportions. Monoclonal antibodies
for example consist of heavy and light chain subunits in an equimolar ratio. However, it
was show that an overproduction of the light chain improves overall productivity (Schlatter
et al., 2005). Even the co-expression of accessory molecules which are required in only small
quantities could be expressed in such a cell line to not overload the transcription and
translation machinery.

RESULTS
92
4.3 mGRP94 and mPRAT4A
4.3.1 Cloning of mPRAT4A and mGRP94 into pFlpBtM‐II_F13/F14
vector
Difficult to express protein targets such as TLRs can serve as a formidable challenge. The
stable co-expression of accessory molecules is anticipated to improve their expression. To
generate stable binary CHO Lec3.2.8.1 cell lines that co-express Toll–like receptors with
their ER chaperones mPRAT4A or mGRP94, these chaperones were cloned into the
exchange vector pFlpBtM-II_F13/F14 made in Section 4.1.6. The commercially available
plasmids pUNO1-mPRAT4A and pUNO1-mGRP94 (InvivoGen) were used to amplify full
length murine PRAT4A and GRP94 constructs with N- and C-terminal FLAG-tags to test
variances in expression using HEK293-6E before the stable integration into binary RMCE
master cell lines (Section 4.3.2). Restriction sites NcoI and MluI were introduced for cloning
of mPRAT4A constructs whereas ClaI and MluI sites were introduced for cloning of
mGRP94 constructs as mGRP94 already contains internal NcoI restriction sites. For the
ligation of mPRAT4A constructs, the pFlpBtM-II_F13/F14 vector was digested with NcoI
and MluI restriction endonucleases. This resulted in the removal of the IgG secretion signal
sequence, which was replaced by the native secretion signal sequence of mPRAT4A and
the removal of the internal His- and Twin-Strep-tags, replacing those with a FLAG-tag. For
the ligation of mGRP94 constructs, the pFlpBtM-II_F13/F14 vector was digested with BstBI
and MluI restriction endonucleases. As before this resulted in the removal of the IgG
secretion signal sequence, which was replaced by the native secretion signal sequence of
mGRP94 and the removal of the internal His- and Twin-Strep-tags, replacing those with a
FLAG-tag. The Shine-Dalgarno sequence which was also removed due to the use of the
BstBI site needed to be replaced with the mGRP94 PCR fragments. The ligation of mGRP94
PCR fragments with the vector backbone resulted in the destruction of the compatible
BstBI/ClaI restriction sites. Cloning steps are described in Figure 4-25 and Figure 4-26.
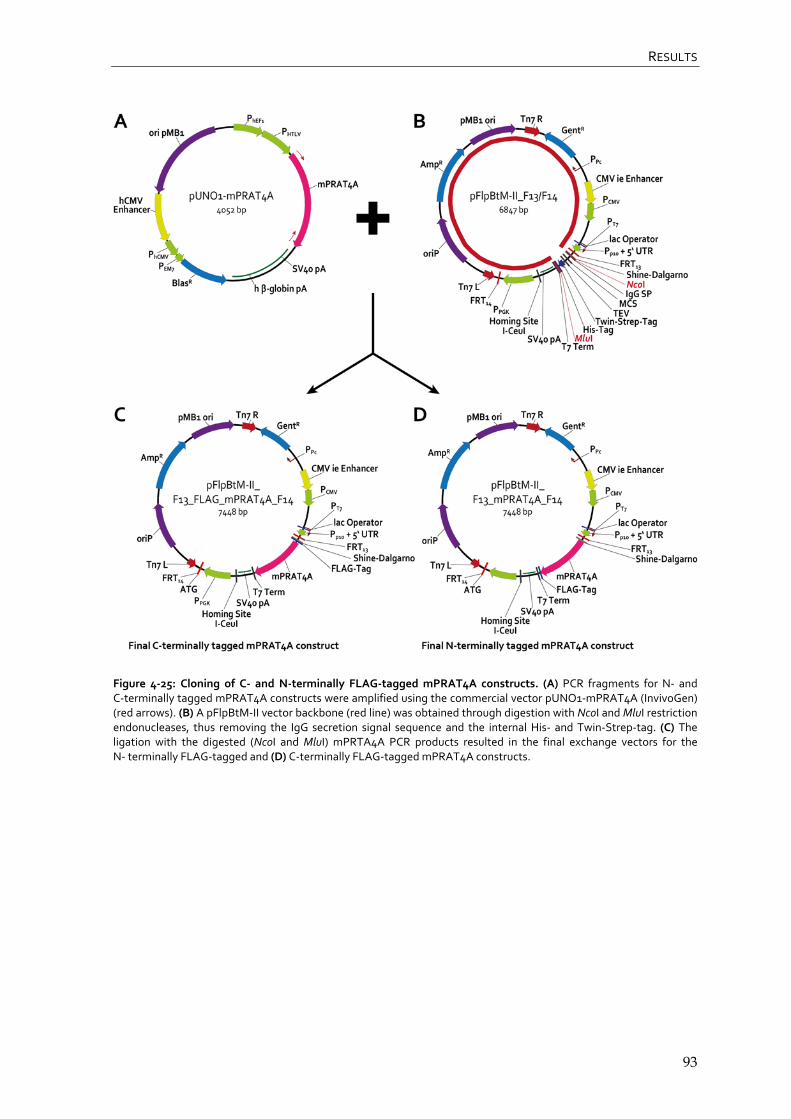
RESULTS
93
Figure 4‐25: Cloning of C‐ and N‐terminally FLAG‐tagged mPRAT4A constructs. (A) PCR fragments for N‐ and C‐terminally tagged mPRAT4A constructs were amplified using the commercial vector pUNO1‐mPRAT4A (InvivoGen) (red arrows). (B) A pFlpBtM‐II vector backbone (red line) was obtained through digestion with NcoI and MluI restriction endonucleases, thus removing the IgG secretion signal sequence and the internal His‐ and Twin‐Strep‐tag. (C) The ligation with the digested (NcoI and MluI) mPRTA4A PCR products resulted in the final exchange vectors for the N‐ terminally FLAG‐tagged and (D) C‐terminally FLAG‐tagged mPRAT4A constructs.
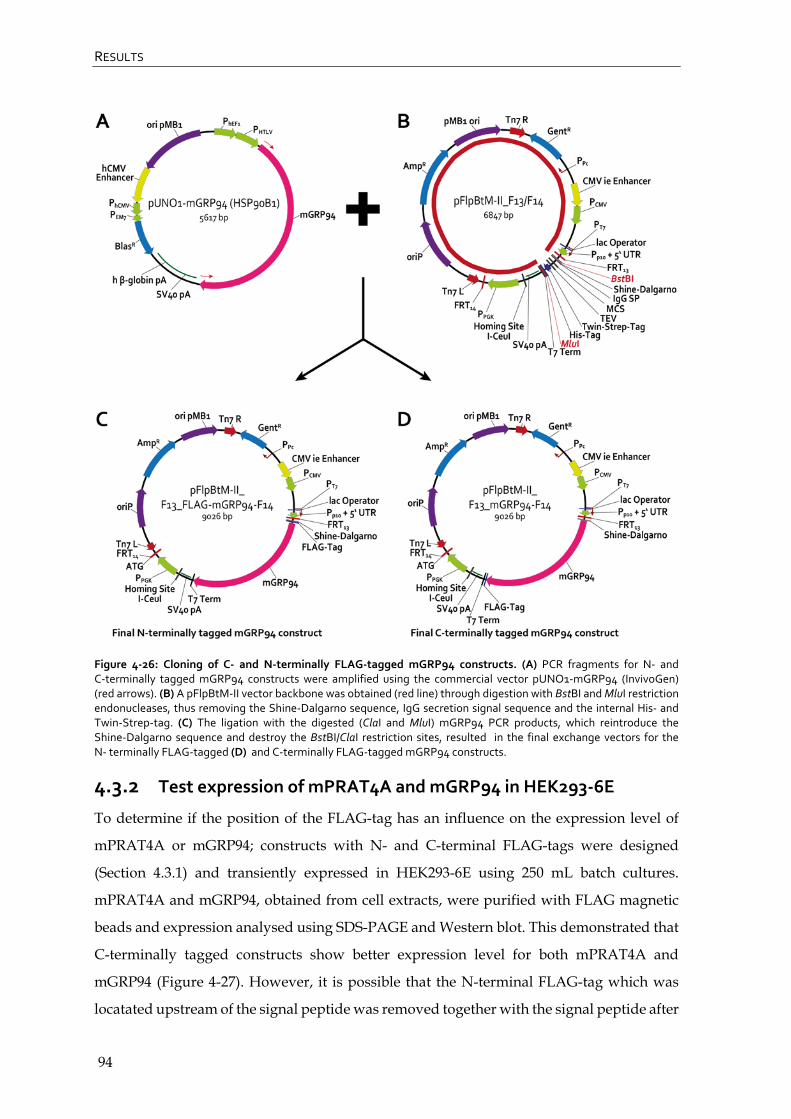
RESULTS
94
Figure 4‐26: Cloning of C‐ and N‐terminally FLAG‐tagged mGRP94 constructs. (A) PCR fragments for N‐ and C‐terminally tagged mGRP94 constructs were amplified using the commercial vector pUNO1‐mGRP94 (InvivoGen) (red arrows). (B) A pFlpBtM‐II vector backbone was obtained (red line) through digestion with BstBI and MluI restriction endonucleases, thus removing the Shine‐Dalgarno sequence, IgG secretion signal sequence and the internal His‐ and Twin‐Strep‐tag. (C) The ligation with the digested (ClaI and MluI) mGRP94 PCR products, which reintroduce the Shine‐Dalgarno sequence and destroy the BstBI/ClaI restriction sites, resulted in the final exchange vectors for the N‐ terminally FLAG‐tagged (D) and C‐terminally FLAG‐tagged mGRP94 constructs.
4.3.2 Test expression of mPRAT4A and mGRP94 in HEK293‐6E
To determine if the position of the FLAG-tag has an influence on the expression level of
mPRAT4A or mGRP94; constructs with N- and C-terminal FLAG-tags were designed
(Section 4.3.1) and transiently expressed in HEK293-6E using 250 mL batch cultures.
mPRAT4A and mGRP94, obtained from cell extracts, were purified with FLAG magnetic
beads and expression analysed using SDS-PAGE and Western blot. This demonstrated that
C-terminally tagged constructs show better expression level for both mPRAT4A and
mGRP94 (Figure 4-27). However, it is possible that the N-terminal FLAG-tag which was
locatated upstream of the signal peptide was removed together with the signal peptide after

RESULTS
95
cellular sorting in the secretion pathway (Alberts, 2008). In that case mPRAT4A and
mGRP94 might have been expressed, but could not be purified due to the loss of the
FLAG-tags. Consequently, mPRAT4A and mGRP94 constructs with C-terminal FLAG-tags
were used for small scale (6 mL) co-expression with mTLR1 and ssmTLR2 in HEK293-6E.
These results were not conclusive but seemed to indicated improvement in TLR2
expression level (data not shown). Thus C-terminally FLAG-tagged mPRAT4A and
mGRP94 constructs were used for the stable co-expression with TLR ECD constructs in
binary RMCE cell lines (Section 4.4).
Lane Top – mPRAT4A Bottom – mGRP94
1 Cell extract Cell Extract
2 Non‐binding fraction Non‐binding fraction
3 Wash 1 Wash 1
4 Wash 2 Wash 2
5 Wash 3 Wash 3
6 Eluate – mPRAT4A (31.5 kDa) Eluate – mGRP94 (93.5 kDa)
7 Regeneration Regeneration
8 PageRuler Plus prestained [Thermo Scientific] PageRuler Plus prestained [Thermo Scientific]
Figure 4‐27: 12 % SDS‐PAGE and Western blot analysis of C‐ and N‐terminally FLAG‐tagged mPRAT4A and mGRP94 constructs expressed transiently in HEK293‐6E and purified with FLAG‐magnetic beads. (Top) SDS‐PAGE showing fractions of magnetic bead purification for C‐terminally FLAG‐tagged mPRAT4A (left) and N‐terminally FLAG‐tagged mPRAT4A (middle) with corresponding western blot (right). (Bottom) SDS‐PAGE showing fractions of magnetic bead purification for C‐terminally FLAG‐tagged mGRP94 (left) and N‐terminally FLAG‐tagged mGRP94 (middle) with corresponding western blot (right). Please note that the two stronger signals on this blot are artefacts only.

RESULTS
96
4.3.3 Expression of mPRAT4A and mGRP94 in binary RMCE cell lines
(CHO Lec3.2.8.1)
The first step for the generation of binary TLR/chaperone producer cell lines required the
introduction of mPRAT4A and mGRP94 into the second exchange locus
(PEF-FRT13-tdTomato-FRT14-Δpuro) of the binary RMCE master cell line TE3-B4-H1 via
RMCE. Previous efforts to introduce TLR and chaperones into both exchange loci
simultaneously failed due to the low exchange rates realized by FLP recombinase.
Consequently, the isolation of clones that successfully exchanged both cassettes and
survived antibiotic selection against G418 and puromycin simultaneously could not be
accomplished (data not shown). Figure 4-28 and Figure 4-29 show flowcytometric data for
the binary producer cell lines TE3-B4-H1-eGFP/mPRAT4A-1.1 and
TE3-B4-H1-eGFP/mGRP94-C1 compared to the RMCE master cell line TE3-B4-H1 from
which they were derived. The slight shift within the green channel reflects a minor overlap
of the upper detection limit of the green channel (555 nm) and the lower range of the
tdTomato emission spectrum (Section 1.5.1). The successful exchange of tdTomato against
mPRATT4A and mGRP94 is detected within the red channel.
Figure 4‐28: Flowcytometric analysis of TE3‐B4‐H1 master cell line and TE3‐B4‐H1‐eGFP/mPRAT4A‐1.1 producer cell line: Histogram overlays obtained with the Guava easyCyte flowcytometer show the level of green fluorescence (left) and the level of red fluorescence (right) of the binary RMCE master cell line TE3‐B4‐H1 (black line) before exchange of the second locus (PEF‐FRT13‐tdTomato‐FRT14‐Δpuro) against mPRAT4A and the binary producer cell line TE3‐B4‐H1‐eGFP/mPRAT4A‐1.1 (green or red solid).
Figure 4‐29: Flowcytometric analysis of TE3‐B4‐H1 master cell line and TE3‐B4‐H1‐eGFP/mGRP94‐C1 producer cell line: Histogram overlays obtained with the Guava easyCyte flowcytometer show the level of green fluorescence (left) and the level of red fluorescence (right) of the binary RMCE master cell line TE3‐B4‐H1 (black line) before exchange of the second locus (PEF‐FRT13‐tdTomato‐FRT14‐Δpuro) against mGRP94 and the binary producer cell line TE3‐B4‐H1‐eGFP/mGRp94‐C1 (green or red solid).

RESULTS
97
To confirm the expression of mGRP94 and mPRAT4A, cell extracts were obtained from 1 L
batch cultures of the producer cell lines TE3-B4-H1-ssmTLR2/mPRAT4A-C1 and
TE3-B4-H1-ssmTLR2/mGRP94-C1 described in Section 4.4.2. Figure 4-30 shows SDS-PAGE
and western blot analysis of concentrated mPRAT4A and mGRP94 eluates after one round
of purification with Anti-FLAG® M2 affinity resin. While a strong background of
unspecifically bound protein is still present, the expression of mPRAT4A and mGRP94 was
confirmed by MALDI-TOF for the marked bands (red arrows). mPRAT4A, like tdTomato
discussed in Section 4.2.3, seems to show some fragmentation under reducing conditions.
mPRAT4A exhibits a strong band below the original 31.5 kDa band which can also be
detected on Western blot analysis. In conclusion the expression of mGRP94 as well as
mPRAT4A was confirmed. This result is valid for all generated binary producer cell lines
co-expressing TLRs with chaperones in this work as these were all derived from the cell
lines TE3-B4-H1-eGFP/mPRAT4A-1.1 or TE3-B4-H1-eGFP/mGRP94-C1.
Lane SDS‐PAGE Western blot
1 Precision Plus Protein Dual Color [BioRad] PageRuler Plus prestained [Thermo Scientific]
2 Concentrated eluate – mPRAT4A (31.5 kDa) Concentrated eluate – mPRAT4A (31.5 kDa)
3 ‐ ‐
4 Concentrated eluate – mGRP94 (93.5 kDa) Concentrated eluate – mGRP94 (93.5 kDa)
Figure 4‐30: 10 % SDS‐PAGE and Western blot analysis of C‐terminally FLAG‐tagged mPRAT4A and mGRP94 purified with FLAG‐affinity resin. Concentrated eluates of mPRAT4A and mGRP94 expressed stably in the producer cell lines TE3‐B4‐H1‐mPRAT4A‐1.1 and TE3‐B4‐H1‐ssmTLR2/mGRP94‐C1 respectively are shown with SDS‐PAGE (left) and Western blot (right).

RESULTS
98
4.4 Toll‐like receptors
4.4.1 Cloning of TLR constructs
TLR ECD and chimeric TLR-VLR ECD constructs are used in this work. They all encompass
their own secretion signal sequence and comprise His-tags if cloned into the exchange
vector pFlpBtM-I or Twin-Strep and His-tags separated by a protease cleavage site if cloned
into pFlpBtM-II(beta). An overview of TLR ECD constructs used in this work is given in
Figure 4-31.
Figure 4‐31: TLR ECD constructs. TLR ECD (blue) or hybrid TLR ECD constructs with N‐terminal VLR sequences (violet) were used in this work. Depending on the exchange vector they were introduced into, pFlpBtM‐I or pFlpBtM‐II(beta), they comprise a C‐terminal His‐tag (red) or His‐ and Twin‐Strep‐tag (green) separated by a TEV protease cleavage site (grey).
The vector pFlpBtM-ssmTLR2H8 (Figure 4-32) comprises a C-terminally His-tagged
murine TLR2 ECD construct (amino acids 1-587) (Meyer et al., 2013). It was used for
transient expression tests in HEK293-6E and stable genomic integration into (binary) RMCE
master cell lines SWI3_26, SMT_dneo(2)_24 and TE3-B4-H1 (Section 4.4.2).
Figure 4‐32: Vector pFlpBtM‐ssmTLR2H8. Vector comprises an mTLR2 ECD construct (amino acids 1‐587) (Meyer et al., 2013).
Murine TLR1 constructs ranging from amino acids 1-408, 1-455 and 1-500 were previously
reported to express solubly as chimera when fused C-terminally with a VLR fragment
(amino acids 133-200) (Jin et al., 2007). Therefore, mTLR1 ECD with these specific lengths

RESULTS
99
were amplifying from the vector pDUO_mTLR1_mTLR2 (InvivoGen) with the forward
oligonucleotide TLR1_FWD_NcoI in combination with the reverse oligonucleotides
TLR1_408_NheI_r, TLR1_455_NheI_r or TLR1_500_NheI_r. Restriction sites NcoI and NheI
were introduced to enable the integration into a pFlpBtM-II(beta)-VLR-TEV-Strep-H8
backbone containing the VLR fragment which was obtained from vector
pFlpBtM-IIbeta-sshTLR5-1-198-VLR-TEV-Strep-H8 through the removal of the hTLR5
insert with the same restriction endonucleases (Figure 4-33). After test expressions in
HEK293-6E cells (Agarwal, 2012) construct mTLR1_1-455 was chosen for stable integration
into the (binary) RMCE master cell lines SMT_dneo(2)_24 and TE3-B4-H1 as it showed the
highest level of expression (Section 4.4.3).
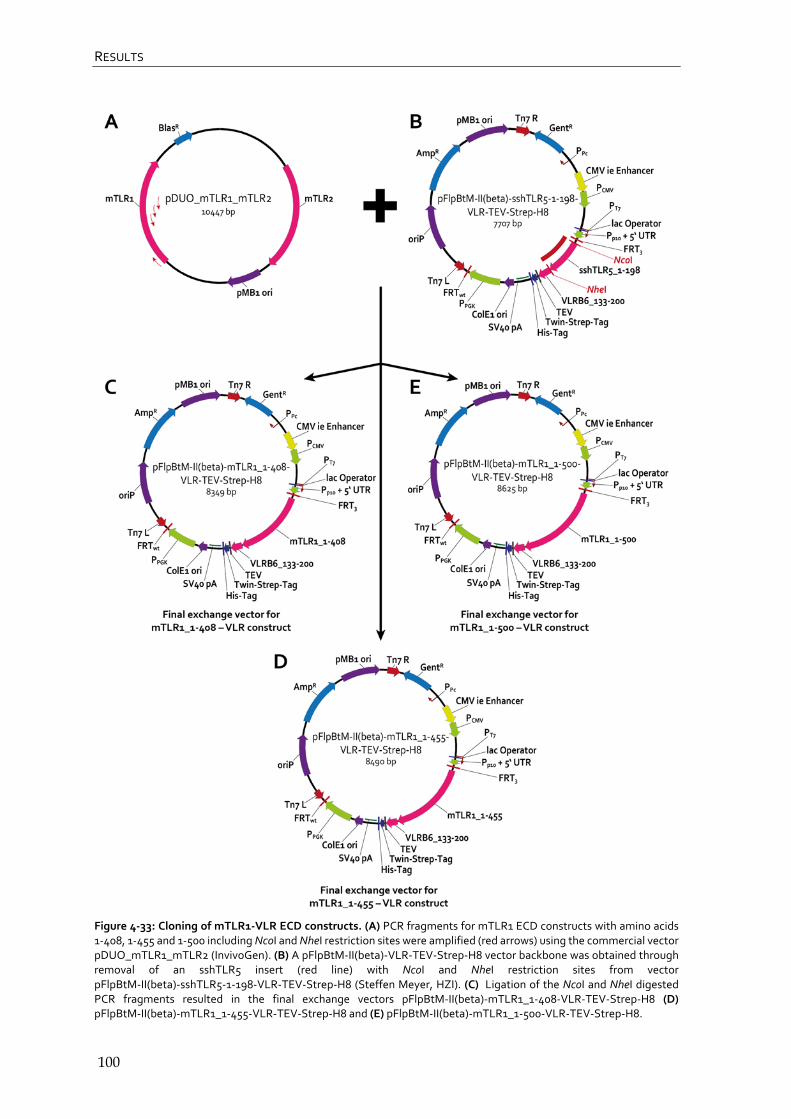
RESULTS
100
Figure 4‐33: Cloning of mTLR1‐VLR ECD constructs. (A) PCR fragments for mTLR1 ECD constructs with amino acids 1‐408, 1‐455 and 1‐500 including NcoI and NheI restriction sites were amplified (red arrows) using the commercial vector pDUO_mTLR1_mTLR2 (InvivoGen). (B) A pFlpBtM‐II(beta)‐VLR‐TEV‐Strep‐H8 vector backbone was obtained through removal of an sshTLR5 insert (red line) with NcoI and NheI restriction sites from vector pFlpBtM‐II(beta)‐sshTLR5‐1‐198‐VLR‐TEV‐Strep‐H8 (Steffen Meyer, HZI). (C) Ligation of the NcoI and NheI digested PCR fragments resulted in the final exchange vectors pFlpBtM‐II(beta)‐mTLR1_1‐408‐VLR‐TEV‐Strep‐H8 (D) pFlpBtM‐II(beta)‐mTLR1_1‐455‐VLR‐TEV‐Strep‐H8 and (E) pFlpBtM‐II(beta)‐mTLR1_1‐500‐VLR‐TEV‐Strep‐H8.

RESULTS
101
A human TLR5 construct was prepared as follows; oligonucleotides TLR5_1-391NheRev
and BamHI-Nco-For were used for the amplification of an hTLR5 ECD ranging from amino
acids 1-391 introducing restriction sites for NcoI and NheI. The PCR fragment was inserted
into a pFlpBtM-II(beta)-VLR-TEV-Strep-H8 backbone containing a VLR fragment which
was obtained from vector pFlpBtM-II(beta)-sshTLR5-1-198-VLR-TEV-Strep-H8 through the
removal of the hTLR5 insert with HF-NcoI and HF-NheI restriction endonucleases
(Figure 4-34).
Figure 4‐34: Cloning of the hTLR5‐VLR ECD construct. (A) A PCR fragment for a hTLR5 ECD construct ranging from amino acids 1‐391 including NcoI and NheI restriction sites was amplified (red arrows) using the vector pFlpBtM‐sshTLR5‐wt‐c‐QC_R387Q_(Klon3) (Steffen Meyer, HZI). (B) A pFlpBtM‐II(beta)‐VLR‐TEV‐Strep‐H8 vector backbone was obtained through removal of an hTLR5 insert (red line) with NcoI and NheI restriction sites from vector pFlpBtM‐II(beta)‐sshTLR5‐1‐198‐VLR‐TEV‐Strep‐H8 (Steffen Meyer, HZI). (C) Ligation of the NcoI and NheI digested PCR fragment resulted in the final exchange vectors pFlpBtM‐II(beta)‐sshTLR5_1‐391‐VLR‐TEV‐STrEP‐H8.
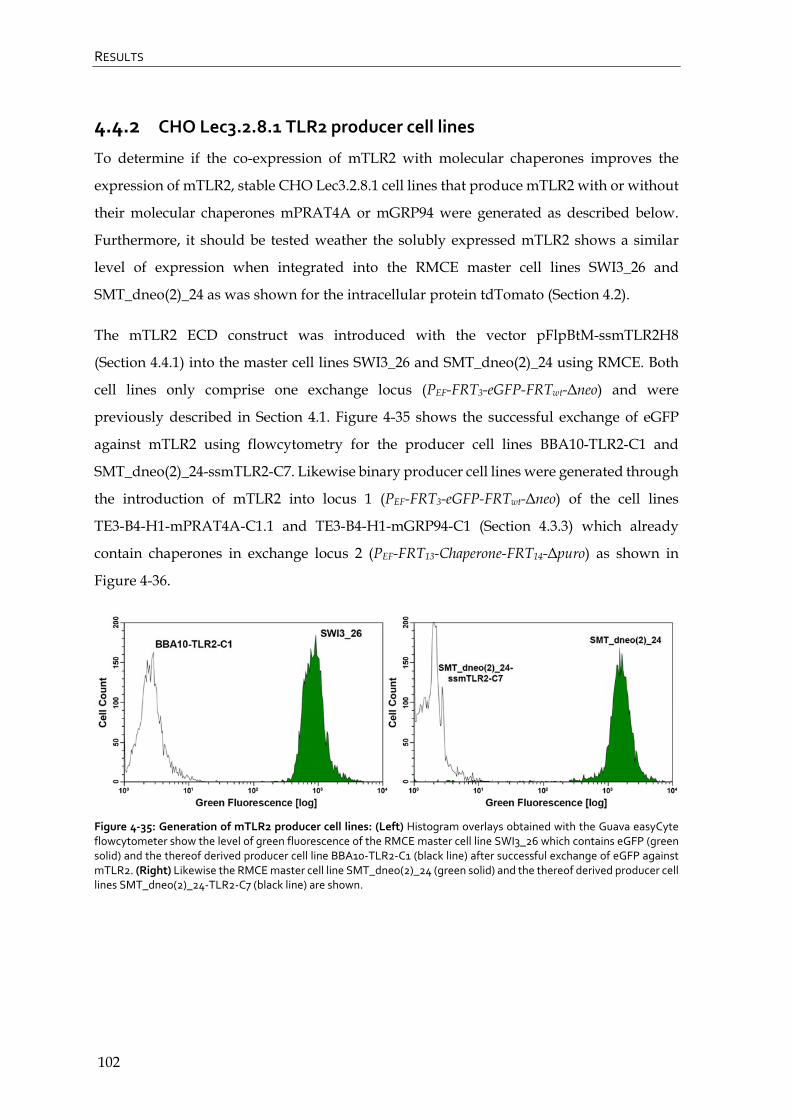
RESULTS
102
4.4.2 CHO Lec3.2.8.1 TLR2 producer cell lines
To determine if the co-expression of mTLR2 with molecular chaperones improves the
expression of mTLR2, stable CHO Lec3.2.8.1 cell lines that produce mTLR2 with or without
their molecular chaperones mPRAT4A or mGRP94 were generated as described below.
Furthermore, it should be tested weather the solubly expressed mTLR2 shows a similar
level of expression when integrated into the RMCE master cell lines SWI3_26 and
SMT_dneo(2)_24 as was shown for the intracellular protein tdTomato (Section 4.2).
The mTLR2 ECD construct was introduced with the vector pFlpBtM-ssmTLR2H8
(Section 4.4.1) into the master cell lines SWI3_26 and SMT_dneo(2)_24 using RMCE. Both
cell lines only comprise one exchange locus (PEF-FRT3-eGFP-FRTwt-Δneo) and were
previously described in Section 4.1. Figure 4-35 shows the successful exchange of eGFP
against mTLR2 using flowcytometry for the producer cell lines BBA10-TLR2-C1 and
SMT_dneo(2)_24-ssmTLR2-C7. Likewise binary producer cell lines were generated through
the introduction of mTLR2 into locus 1 (PEF-FRT3-eGFP-FRTwt-Δneo) of the cell lines
TE3-B4-H1-mPRAT4A-C1.1 and TE3-B4-H1-mGRP94-C1 (Section 4.3.3) which already
contain chaperones in exchange locus 2 (PEF-FRT13-Chaperone-FRT14-Δpuro) as shown in
Figure 4-36.
Figure 4‐35: Generation of mTLR2 producer cell lines: (Left) Histogram overlays obtained with the Guava easyCyte flowcytometer show the level of green fluorescence of the RMCE master cell line SWI3_26 which contains eGFP (green solid) and the thereof derived producer cell line BBA10‐TLR2‐C1 (black line) after successful exchange of eGFP against mTLR2. (Right) Likewise the RMCE master cell line SMT_dneo(2)_24 (green solid) and the thereof derived producer cell lines SMT_dneo(2)_24‐TLR2‐C7 (black line) are shown.

RESULTS
103
Figure 4‐36: Generation of binary mTLR2 producer cell lines: Histogram overlays obtained with the Guava easyCyte flowcytometer show the level of green fluorescence of the binary cell lines TE3‐B4‐H1‐eGFP/mPRAT4A‐1.1 (left) and TE3‐B4‐H1‐eGFP/mGRP94‐C1 (right) which contain eGFP in locus 1 (solid green). The thereof derived producer cell lines TE3‐B4‐H1‐ssmTLR2/mPRAT4A and TE3‐B4‐H1‐ssmTLR2/mGRP94 are shown in the same gate as black line for clone 1 and red line for clone 2 after successful exchange of eGFP against mTLR2.
The expression of mTLR2 for one or two clones of each producer cell line was tested in
1 L - 1.5 L batch cultures in shake flasks. The cell line SMT_dneo(2)_24-ssmTLR2 was not
tested in small scale batch culture due to time restrictions. Clones were either selected
according to their flowcytometric profile alone (successful integration) or after screening of
several clones using TCA precipitation of 1 mL culture supernatants as for BBA10-TLR2
and SMT_dneo(2)_24-ssmTLR2 clones in combination with Western blot analysis
(Figure 4-37). It should be noted that one false positive clone was found for
SMT_dneo(2)_24-ssmTLR2 (clone-1) which seems to have lost eGFP without successfully
integrating mTLR2.
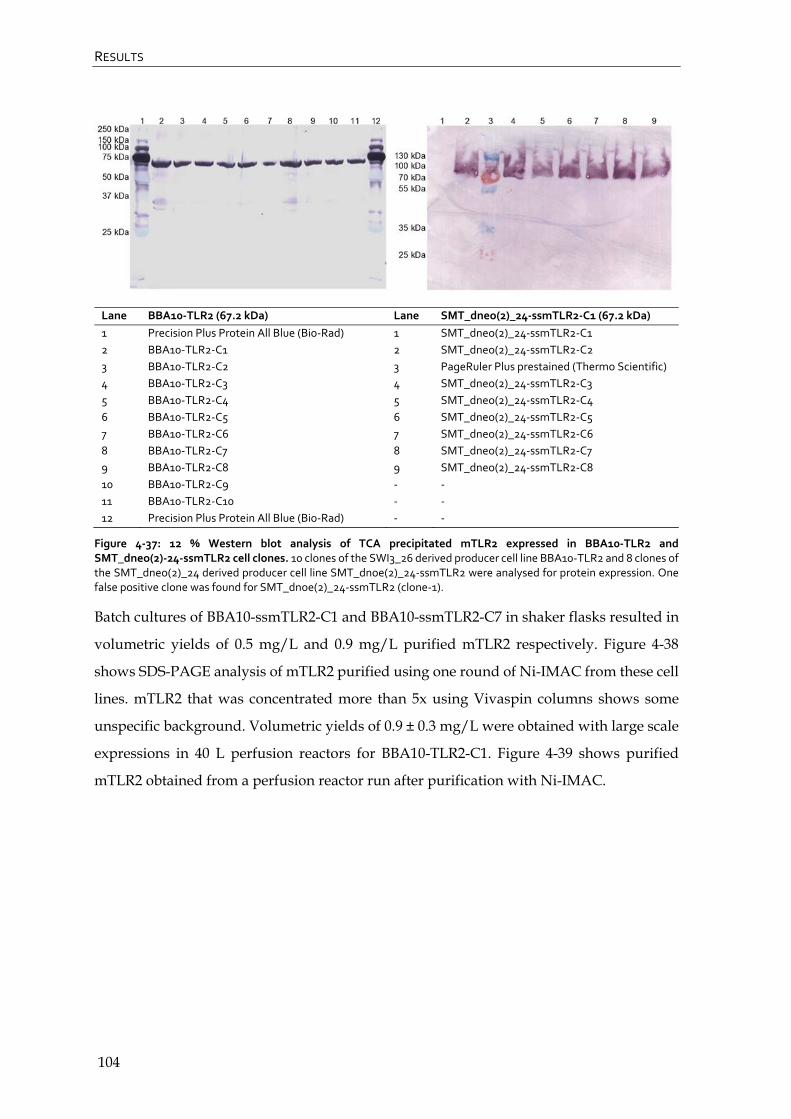
RESULTS
104
Lane BBA10‐TLR2 (67.2 kDa) Lane SMT_dneo(2)_24‐ssmTLR2‐C1 (67.2 kDa)
1 Precision Plus Protein All Blue (Bio‐Rad) 1 SMT_dneo(2)_24‐ssmTLR2‐C1
2 BBA10‐TLR2‐C1 2 SMT_dneo(2)_24‐ssmTLR2‐C2
3 BBA10‐TLR2‐C2 3 PageRuler Plus prestained (Thermo Scientific)
4 BBA10‐TLR2‐C3 4 SMT_dneo(2)_24‐ssmTLR2‐C3
5 BBA10‐TLR2‐C4 5 SMT_dneo(2)_24‐ssmTLR2‐C4
6 BBA10‐TLR2‐C5 6 SMT_dneo(2)_24‐ssmTLR2‐C5
7 BBA10‐TLR2‐C6 7 SMT_dneo(2)_24‐ssmTLR2‐C6
8 BBA10‐TLR2‐C7 8 SMT_dneo(2)_24‐ssmTLR2‐C7
9 BBA10‐TLR2‐C8 9 SMT_dneo(2)_24‐ssmTLR2‐C8
10 BBA10‐TLR2‐C9 ‐ ‐
11 BBA10‐TLR2‐C10 ‐ ‐
12 Precision Plus Protein All Blue (Bio‐Rad) ‐ ‐
Figure 4‐37: 12 % Western blot analysis of TCA precipitated mTLR2 expressed in BBA10‐TLR2 and SMT_dneo(2)‐24‐ssmTLR2 cell clones. 10 clones of the SWI3_26 derived producer cell line BBA10‐TLR2 and 8 clones of the SMT_dneo(2)_24 derived producer cell line SMT_dnoe(2)_24‐ssmTLR2 were analysed for protein expression. One false positive clone was found for SMT_dnoe(2)_24‐ssmTLR2 (clone‐1).
Batch cultures of BBA10-ssmTLR2-C1 and BBA10-ssmTLR2-C7 in shaker flasks resulted in
volumetric yields of 0.5 mg/L and 0.9 mg/L purified mTLR2 respectively. Figure 4-38
shows SDS-PAGE analysis of mTLR2 purified using one round of Ni-IMAC from these cell
lines. mTLR2 that was concentrated more than 5x using Vivaspin columns shows some
unspecific background. Volumetric yields of 0.9 ± 0.3 mg/L were obtained with large scale
expressions in 40 L perfusion reactors for BBA10-TLR2-C1. Figure 4-39 shows purified
mTLR2 obtained from a perfusion reactor run after purification with Ni-IMAC.

RESULTS
105
Lane BBA10‐TLR2‐C1 (67.2 kDa) Lane BBA10‐TLR2‐C7 (67.2 kDa)
1 Precision Plus Protein unstained (Bio‐Rad) 1 Precision Plus Protein unstained (Bio‐Rad)
2 Purified mTLR2 (Ni‐IMAC) 2 ‐
3 ‐ 3 Purified mTLR2 (Ni‐IMAC) – Run 1
4 10x concentrated mTLR2 4 Purified mTLR2 (Ni‐IMAC) – Run 2
5 5x concentrated mTLR2 5 Purified mTLR2 (Ni‐IMAC) – Run 1+2
‐ ‐ 6 7.65 x concentrated mTLR2
Figure 4‐38: 12 % SDS‐PAGE analysis of purified and concentrated mTLR2 expressed in batch cultures using cell lines BBA10‐TLR2‐C1 and BBA10‐TLR2‐C7. mTLR2 was produced in 1.25 L or 1.5 L batch cultures using the cell lines BBA10‐TLR2‐C1 and BBA10‐TLR2‐C7 respectively. SDS‐PAGE shows ssmTLR2 purified via Ni‐IMAC and concentrated mTLR2 for both cell lines. Note that BBA10‐TLR2‐C7 was purified in two separate runs and pooled afterwards. Volumetric yields of 0.5 mg/L and 0.9 mg/L were obtained for BBA10‐TLR2‐C1 and BBA10‐TLR2‐C7 respectively.
Lane BBA10‐TLR2‐C1 (67.2 kDa)
1 Diafiltrated and concentrate culture supernatant
2 Non‐binding fraction
3 Wash 1
4 Wash 2
5 Purified mTLR2 (Ni‐IMAC)
6 ‐
7 Precision Plus Protein unstained (Bio‐Rad)
Figure 4‐39: 12 % SDS‐PAGE analysis of purified mTLR2 expressed in a perfusion reactor using cell line BBA10‐TLR2‐C1. Example of mTLR2 that was produced in a perfusion reactor and purified using Ni‐IMAC. Yields up to 0.9 ± 0.3 mg/L were reached in a 40 L scale.
However, it should be noted that the cell lines BBA10-ssmTLR2-C1 and
BBA10-ssmTLR2-C7 were derived from the master cell line SWI3_26 (please see Figure 4-15
in Section 4.2 for an overview of master cell lines used in this work). The binary master cell
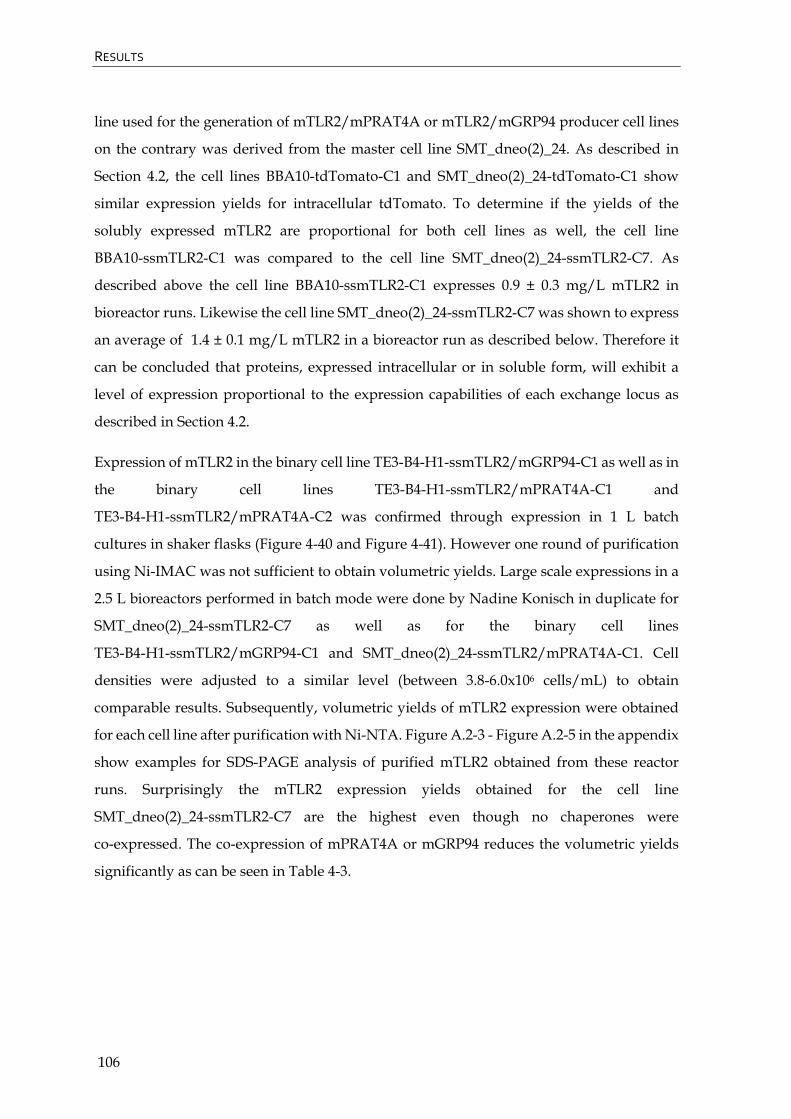
RESULTS
106
line used for the generation of mTLR2/mPRAT4A or mTLR2/mGRP94 producer cell lines
on the contrary was derived from the master cell line SMT_dneo(2)_24. As described in
Section 4.2, the cell lines BBA10-tdTomato-C1 and SMT_dneo(2)_24-tdTomato-C1 show
similar expression yields for intracellular tdTomato. To determine if the yields of the
solubly expressed mTLR2 are proportional for both cell lines as well, the cell line
BBA10-ssmTLR2-C1 was compared to the cell line SMT_dneo(2)_24-ssmTLR2-C7. As
described above the cell line BBA10-ssmTLR2-C1 expresses 0.9 ± 0.3 mg/L mTLR2 in
bioreactor runs. Likewise the cell line SMT_dneo(2)_24-ssmTLR2-C7 was shown to express
an average of 1.4 ± 0.1 mg/L mTLR2 in a bioreactor run as described below. Therefore it
can be concluded that proteins, expressed intracellular or in soluble form, will exhibit a
level of expression proportional to the expression capabilities of each exchange locus as
described in Section 4.2.
Expression of mTLR2 in the binary cell line TE3-B4-H1-ssmTLR2/mGRP94-C1 as well as in
the binary cell lines TE3-B4-H1-ssmTLR2/mPRAT4A-C1 and
TE3-B4-H1-ssmTLR2/mPRAT4A-C2 was confirmed through expression in 1 L batch
cultures in shaker flasks (Figure 4-40 and Figure 4-41). However one round of purification
using Ni-IMAC was not sufficient to obtain volumetric yields. Large scale expressions in a
2.5 L bioreactors performed in batch mode were done by Nadine Konisch in duplicate for
SMT_dneo(2)_24-ssmTLR2-C7 as well as for the binary cell lines
TE3-B4-H1-ssmTLR2/mGRP94-C1 and SMT_dneo(2)_24-ssmTLR2/mPRAT4A-C1. Cell
densities were adjusted to a similar level (between 3.8-6.0x10⁶ cells/mL) to obtain
comparable results. Subsequently, volumetric yields of mTLR2 expression were obtained
for each cell line after purification with Ni-NTA. Figure A.2-3 - Figure A.2-5 in the appendix
show examples for SDS-PAGE analysis of purified mTLR2 obtained from these reactor
runs. Surprisingly the mTLR2 expression yields obtained for the cell line
SMT_dneo(2)_24-ssmTLR2-C7 are the highest even though no chaperones were
co-expressed. The co-expression of mPRAT4A or mGRP94 reduces the volumetric yields
significantly as can be seen in Table 4-3.
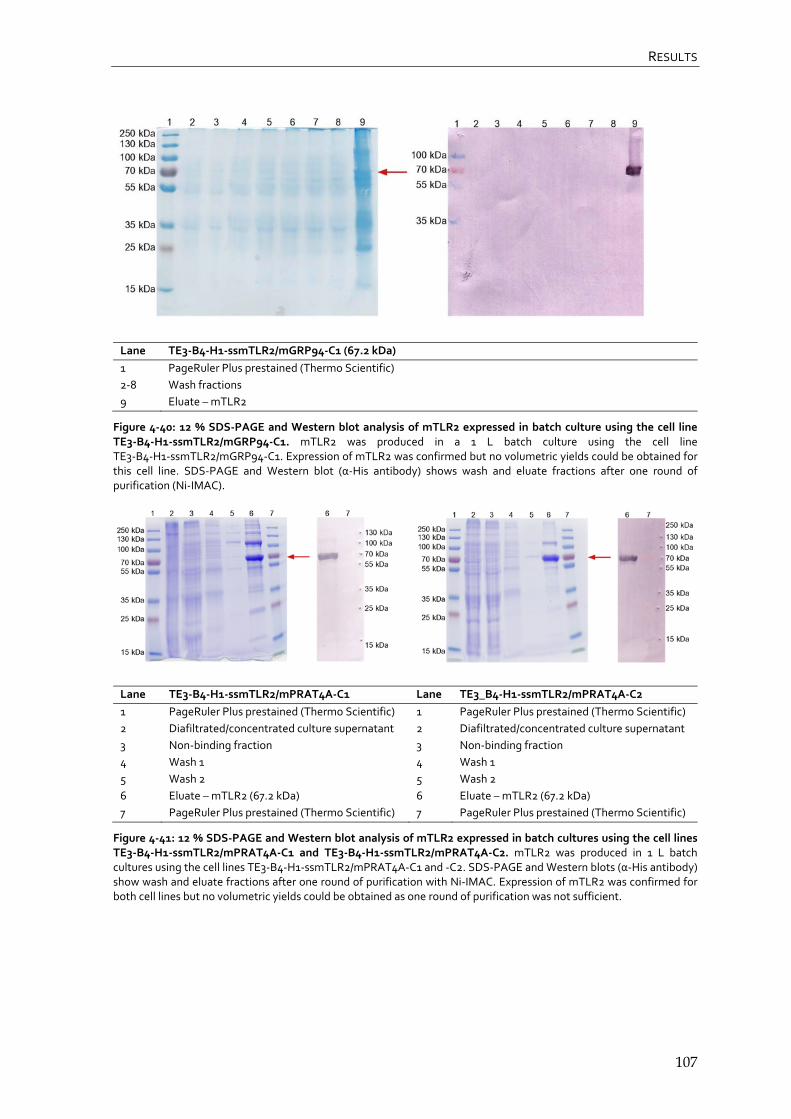
RESULTS
107
Lane TE3‐B4‐H1‐ssmTLR2/mGRP94‐C1 (67.2 kDa)
1 PageRuler Plus prestained (Thermo Scientific)
2‐8 Wash fractions
9 Eluate – mTLR2
Figure 4‐40: 12 % SDS‐PAGE and Western blot analysis of mTLR2 expressed in batch culture using the cell line TE3‐B4‐H1‐ssmTLR2/mGRP94‐C1. mTLR2 was produced in a 1 L batch culture using the cell line TE3‐B4‐H1‐ssmTLR2/mGRP94‐C1. Expression of mTLR2 was confirmed but no volumetric yields could be obtained for this cell line. SDS‐PAGE and Western blot (α‐His antibody) shows wash and eluate fractions after one round of purification (Ni‐IMAC).
Lane TE3‐B4‐H1‐ssmTLR2/mPRAT4A‐C1 Lane TE3_B4‐H1‐ssmTLR2/mPRAT4A‐C2
1 PageRuler Plus prestained (Thermo Scientific) 1 PageRuler Plus prestained (Thermo Scientific)
2 Diafiltrated/concentrated culture supernatant 2 Diafiltrated/concentrated culture supernatant
3 Non‐binding fraction 3 Non‐binding fraction
4 Wash 1 4 Wash 1
5 Wash 2 5 Wash 2
6 Eluate – mTLR2 (67.2 kDa) 6 Eluate – mTLR2 (67.2 kDa)
7 PageRuler Plus prestained (Thermo Scientific) 7 PageRuler Plus prestained (Thermo Scientific)
Figure 4‐41: 12 % SDS‐PAGE and Western blot analysis of mTLR2 expressed in batch cultures using the cell lines TE3‐B4‐H1‐ssmTLR2/mPRAT4A‐C1 and TE3‐B4‐H1‐ssmTLR2/mPRAT4A‐C2. mTLR2 was produced in 1 L batch cultures using the cell lines TE3‐B4‐H1‐ssmTLR2/mPRAT4A‐C1 and ‐C2. SDS‐PAGE and Western blots (α‐His antibody) show wash and eluate fractions after one round of purification with Ni‐IMAC. Expression of mTLR2 was confirmed for both cell lines but no volumetric yields could be obtained as one round of purification was not sufficient.
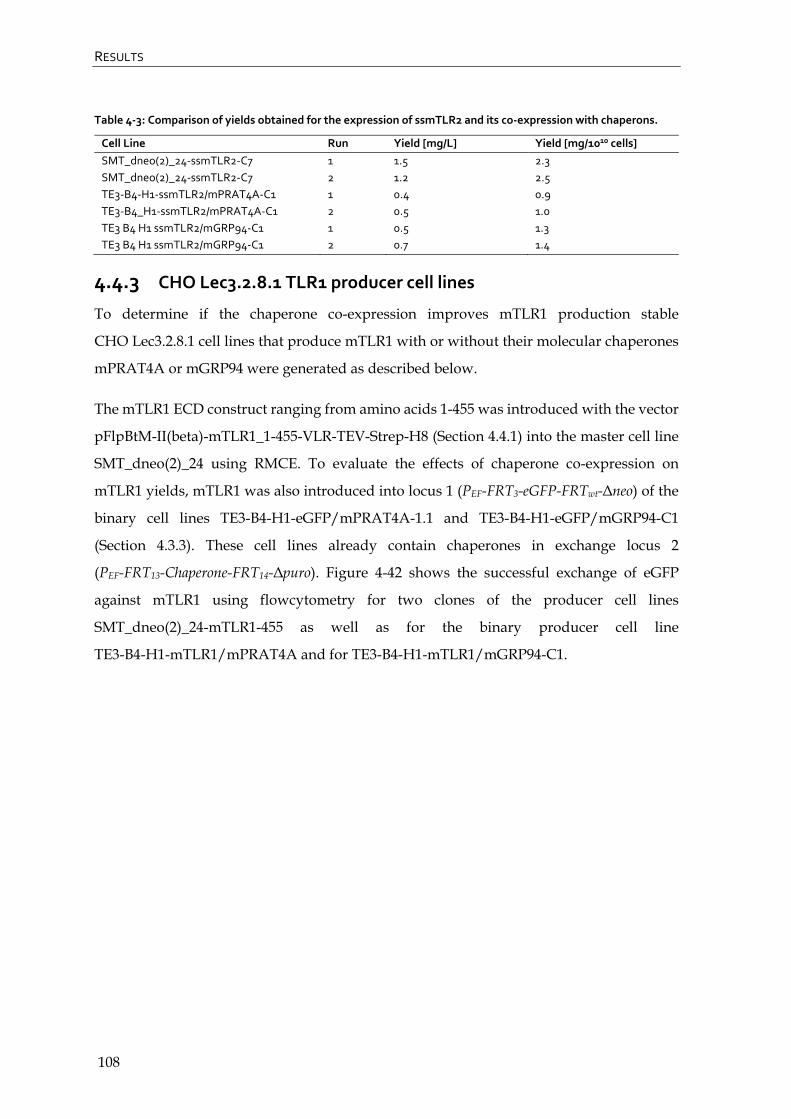
RESULTS
108
Table 4‐3: Comparison of yields obtained for the expression of ssmTLR2 and its co‐expression with chaperons.
Cell Line Run Yield [mg/L] Yield [mg/1010 cells]
SMT_dneo(2)_24‐ssmTLR2‐C7 1 1.5 2.3
SMT_dneo(2)_24‐ssmTLR2‐C7 2 1.2 2.5
TE3‐B4‐H1‐ssmTLR2/mPRAT4A‐C1 1 0.4 0.9
TE3‐B4_H1‐ssmTLR2/mPRAT4A‐C1 2 0.5 1.0
TE3 B4 H1 ssmTLR2/mGRP94‐C1 1 0.5 1.3
TE3 B4 H1 ssmTLR2/mGRP94‐C1 2 0.7 1.4
4.4.3 CHO Lec3.2.8.1 TLR1 producer cell lines
To determine if the chaperone co-expression improves mTLR1 production stable
CHO Lec3.2.8.1 cell lines that produce mTLR1 with or without their molecular chaperones
mPRAT4A or mGRP94 were generated as described below.
The mTLR1 ECD construct ranging from amino acids 1-455 was introduced with the vector
pFlpBtM-II(beta)-mTLR1_1-455-VLR-TEV-Strep-H8 (Section 4.4.1) into the master cell line
SMT_dneo(2)_24 using RMCE. To evaluate the effects of chaperone co-expression on
mTLR1 yields, mTLR1 was also introduced into locus 1 (PEF-FRT3-eGFP-FRTwt-Δneo) of the
binary cell lines TE3-B4-H1-eGFP/mPRAT4A-1.1 and TE3-B4-H1-eGFP/mGRP94-C1
(Section 4.3.3). These cell lines already contain chaperones in exchange locus 2
(PEF-FRT13-Chaperone-FRT14-Δpuro). Figure 4-42 shows the successful exchange of eGFP
against mTLR1 using flowcytometry for two clones of the producer cell lines
SMT_dneo(2)_24-mTLR1-455 as well as for the binary producer cell line
TE3-B4-H1-mTLR1/mPRAT4A and for TE3-B4-H1-mTLR1/mGRP94-C1.
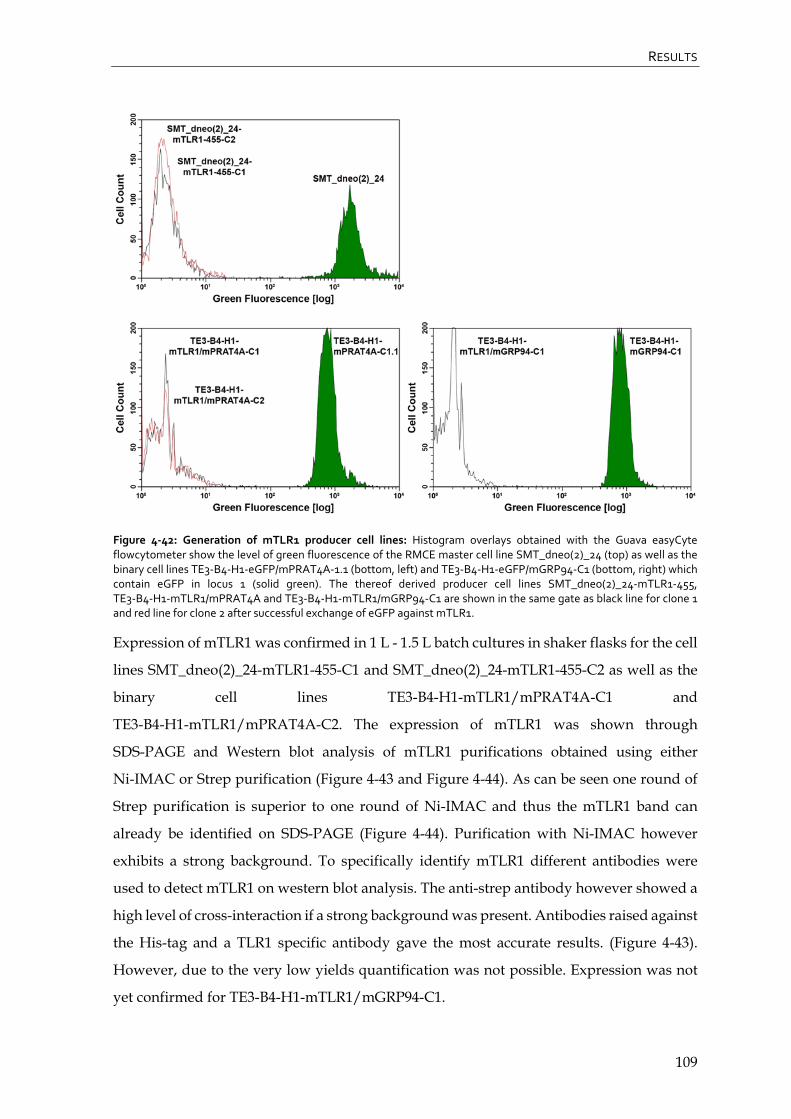
RESULTS
109
Figure 4‐42: Generation of mTLR1 producer cell lines: Histogram overlays obtained with the Guava easyCyte flowcytometer show the level of green fluorescence of the RMCE master cell line SMT_dneo(2)_24 (top) as well as the binary cell lines TE3‐B4‐H1‐eGFP/mPRAT4A‐1.1 (bottom, left) and TE3‐B4‐H1‐eGFP/mGRP94‐C1 (bottom, right) which contain eGFP in locus 1 (solid green). The thereof derived producer cell lines SMT_dneo(2)_24‐mTLR1‐455, TE3‐B4‐H1‐mTLR1/mPRAT4A and TE3‐B4‐H1‐mTLR1/mGRP94‐C1 are shown in the same gate as black line for clone 1 and red line for clone 2 after successful exchange of eGFP against mTLR1.
Expression of mTLR1 was confirmed in 1 L - 1.5 L batch cultures in shaker flasks for the cell
lines SMT_dneo(2)_24-mTLR1-455-C1 and SMT_dneo(2)_24-mTLR1-455-C2 as well as the
binary cell lines TE3-B4-H1-mTLR1/mPRAT4A-C1 and
TE3-B4-H1-mTLR1/mPRAT4A-C2. The expression of mTLR1 was shown through
SDS-PAGE and Western blot analysis of mTLR1 purifications obtained using either
Ni-IMAC or Strep purification (Figure 4-43 and Figure 4-44). As can be seen one round of
Strep purification is superior to one round of Ni-IMAC and thus the mTLR1 band can
already be identified on SDS-PAGE (Figure 4-44). Purification with Ni-IMAC however
exhibits a strong background. To specifically identify mTLR1 different antibodies were
used to detect mTLR1 on western blot analysis. The anti-strep antibody however showed a
high level of cross-interaction if a strong background was present. Antibodies raised against
the His-tag and a TLR1 specific antibody gave the most accurate results. (Figure 4-43).
However, due to the very low yields quantification was not possible. Expression was not
yet confirmed for TE3-B4-H1-mTLR1/mGRP94-C1.

RESULTS
110
Lane SMT_dneo(2)_24‐mTLR1‐C1 and ‐C2 (64.9 kDa)
1 PageRuler Plus prestained (Thermo Scientific)
2 Eluate (Ni‐IMAC) – SMT_dneo(2)_24‐mTLR1‐455‐C1
3 14.3x concentrated – SMT_dneo(2)_24‐mTLR1‐455‐C1
4 Eluate (Ni‐IMAC) – SMT_dneo(2)_24‐mTLR1‐455‐C2
5 14.3x concentrated – SMT_dneo(2)_24‐mTLR1‐455‐C2
Figure 4‐43: 12 % SDS‐PAGE and Western blot analysis of mTLR1 expressed in cell lines SMT_dneo(2)_24‐mTLR1‐C1 and SMT_dneo(2)_24‐mTLR1‐C2. mTLR1 was produced in 1.5 L and 1 L batch cultures using the cell lines SMT_dneo(2)_24‐mTLR1‐C1 and ‐C2 respectively. SDS‐PAGE and Western blot shows mTLR1 after one round of purification (Ni‐IMAC) and concentrated mTLR1 for both cell lines. Western blots were exposed to anti‐Strep, anti‐His or anti‐TLR1 antibodies.
Lane TE3‐B4‐H1‐mTLR1/mPRAT4A‐C1 (64.9 kDa) TE3‐B4‐H1‐mTLR1/mPRAT4A‐C2 (64.9 kDa)
1 PageRuler Plus prestained (Thermo Scientific) PageRuler Plus prestained (Thermo Scientific)
2 Non‐binding fraction Non‐binding fraction
3 Wash 1 Wash
4 Wash 2 Eluate – mTLR1
5 Eluate – mTLR1 PageRuler Plus prestained
6 PageRuler Plus prestained ‐
Figure 4‐44: 12 % SDS‐PAGE and Western blot analysis of purified TE3‐B4‐H1‐mTLR1/mPRAT4A‐C1 and TE3‐B4‐H1‐mTLR1/mPRAT4A‐C2. mTLR1 was produced in 1 L batch cultures using the cell lines TE3‐B4‐H1‐mTLR1/mPRAT4A‐C1 and ‐C2. SDS‐PAGE and Western blots show fractions of mTLR1 purifications done using Ni‐IMAC or Strep beads for cell lines TE3‐B4‐H1‐mTLR1/mPRAT4A‐C1 and ‐C2 respectively. Western blots were exposed to anti‐Strep, anti‐His or anti‐TLR1 antibodies. Even though purified mTLR1 could be obtained with Strep purification the achieved yields were below the detection limit of the used photometric methods.
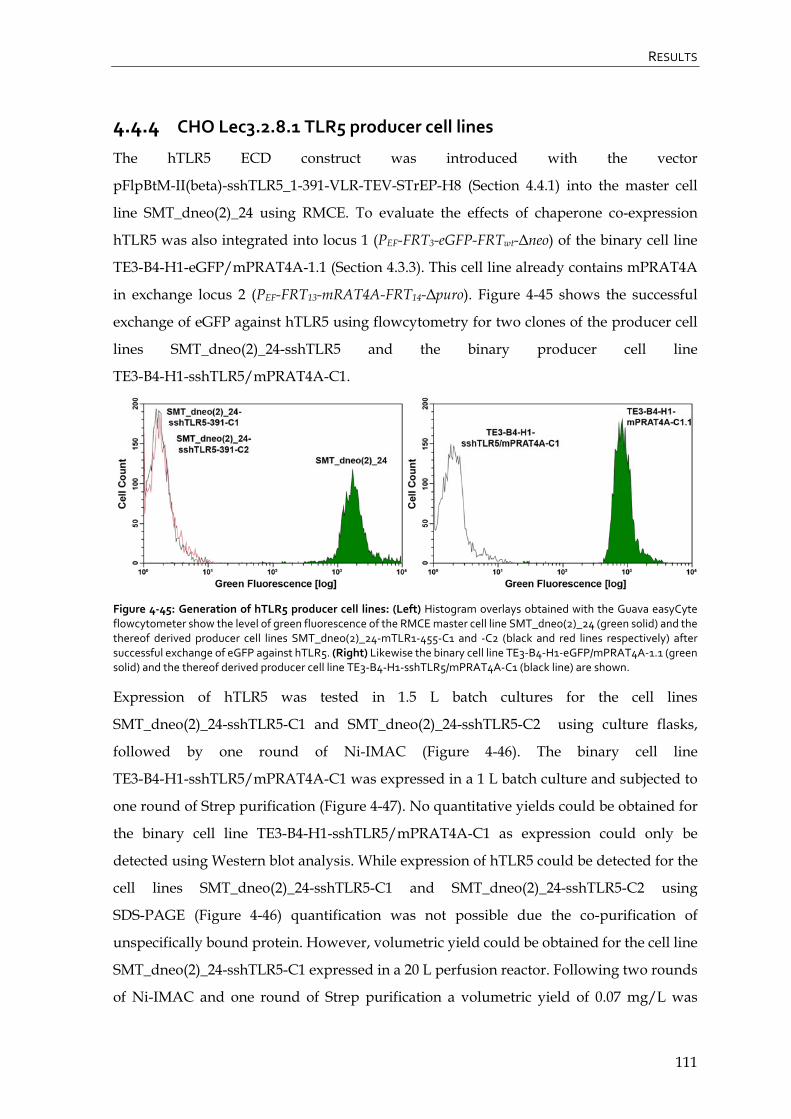
RESULTS
111
4.4.4 CHO Lec3.2.8.1 TLR5 producer cell lines
The hTLR5 ECD construct was introduced with the vector
pFlpBtM-II(beta)-sshTLR5_1-391-VLR-TEV-STrEP-H8 (Section 4.4.1) into the master cell
line SMT_dneo(2)_24 using RMCE. To evaluate the effects of chaperone co-expression
hTLR5 was also integrated into locus 1 (PEF-FRT3-eGFP-FRTwt-Δneo) of the binary cell line
TE3-B4-H1-eGFP/mPRAT4A-1.1 (Section 4.3.3). This cell line already contains mPRAT4A
in exchange locus 2 (PEF-FRT13-mRAT4A-FRT14-Δpuro). Figure 4-45 shows the successful
exchange of eGFP against hTLR5 using flowcytometry for two clones of the producer cell
lines SMT_dneo(2)_24-sshTLR5 and the binary producer cell line
TE3-B4-H1-sshTLR5/mPRAT4A-C1.
Figure 4‐45: Generation of hTLR5 producer cell lines: (Left) Histogram overlays obtained with the Guava easyCyte flowcytometer show the level of green fluorescence of the RMCE master cell line SMT_dneo(2)_24 (green solid) and the thereof derived producer cell lines SMT_dneo(2)_24‐mTLR1‐455‐C1 and ‐C2 (black and red lines respectively) after successful exchange of eGFP against hTLR5. (Right) Likewise the binary cell line TE3‐B4‐H1‐eGFP/mPRAT4A‐1.1 (green solid) and the thereof derived producer cell line TE3‐B4‐H1‐sshTLR5/mPRAT4A‐C1 (black line) are shown.
Expression of hTLR5 was tested in 1.5 L batch cultures for the cell lines
SMT_dneo(2)_24-sshTLR5-C1 and SMT_dneo(2)_24-sshTLR5-C2 using culture flasks,
followed by one round of Ni-IMAC (Figure 4-46). The binary cell line
TE3-B4-H1-sshTLR5/mPRAT4A-C1 was expressed in a 1 L batch culture and subjected to
one round of Strep purification (Figure 4-47). No quantitative yields could be obtained for
the binary cell line TE3-B4-H1-sshTLR5/mPRAT4A-C1 as expression could only be
detected using Western blot analysis. While expression of hTLR5 could be detected for the
cell lines SMT_dneo(2)_24-sshTLR5-C1 and SMT_dneo(2)_24-sshTLR5-C2 using
SDS-PAGE (Figure 4-46) quantification was not possible due the co-purification of
unspecifically bound protein. However, volumetric yield could be obtained for the cell line
SMT_dneo(2)_24-sshTLR5-C1 expressed in a 20 L perfusion reactor. Following two rounds
of Ni-IMAC and one round of Strep purification a volumetric yield of 0.07 mg/L was
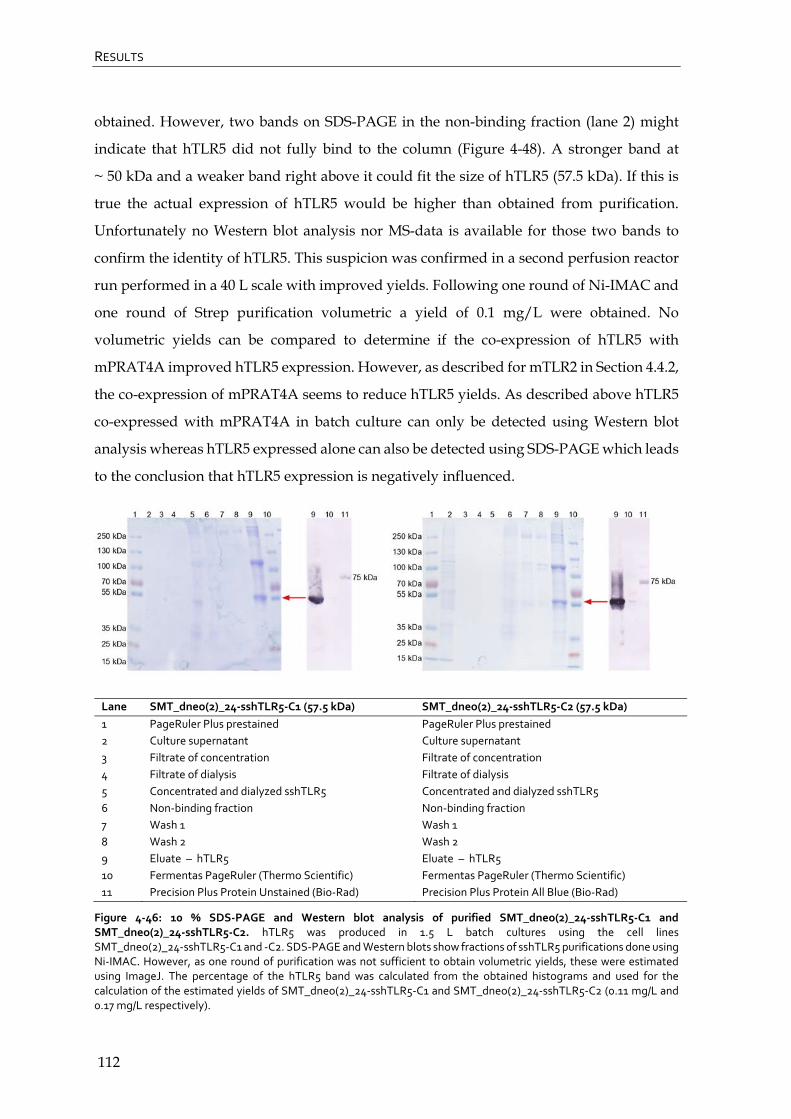
RESULTS
112
obtained. However, two bands on SDS-PAGE in the non-binding fraction (lane 2) might
indicate that hTLR5 did not fully bind to the column (Figure 4-48). A stronger band at
~ 50 kDa and a weaker band right above it could fit the size of hTLR5 (57.5 kDa). If this is
true the actual expression of hTLR5 would be higher than obtained from purification.
Unfortunately no Western blot analysis nor MS-data is available for those two bands to
confirm the identity of hTLR5. This suspicion was confirmed in a second perfusion reactor
run performed in a 40 L scale with improved yields. Following one round of Ni-IMAC and
one round of Strep purification volumetric a yield of 0.1 mg/L were obtained. No
volumetric yields can be compared to determine if the co-expression of hTLR5 with
mPRAT4A improved hTLR5 expression. However, as described for mTLR2 in Section 4.4.2,
the co-expression of mPRAT4A seems to reduce hTLR5 yields. As described above hTLR5
co-expressed with mPRAT4A in batch culture can only be detected using Western blot
analysis whereas hTLR5 expressed alone can also be detected using SDS-PAGE which leads
to the conclusion that hTLR5 expression is negatively influenced.
Lane SMT_dneo(2)_24‐sshTLR5‐C1 (57.5 kDa) SMT_dneo(2)_24‐sshTLR5‐C2 (57.5 kDa)
1 PageRuler Plus prestained PageRuler Plus prestained
2 Culture supernatant Culture supernatant
3 Filtrate of concentration Filtrate of concentration
4 Filtrate of dialysis Filtrate of dialysis
5 Concentrated and dialyzed sshTLR5 Concentrated and dialyzed sshTLR5
6 Non‐binding fraction Non‐binding fraction
7 Wash 1 Wash 1
8 Wash 2 Wash 2
9 Eluate – hTLR5 Eluate – hTLR5
10 Fermentas PageRuler (Thermo Scientific) Fermentas PageRuler (Thermo Scientific)
11 Precision Plus Protein Unstained (Bio‐Rad) Precision Plus Protein All Blue (Bio‐Rad)
Figure 4‐46: 10 % SDS‐PAGE and Western blot analysis of purified SMT_dneo(2)_24‐sshTLR5‐C1 and SMT_dneo(2)_24‐sshTLR5‐C2. hTLR5 was produced in 1.5 L batch cultures using the cell lines SMT_dneo(2)_24‐sshTLR5‐C1 and ‐C2. SDS‐PAGE and Western blots show fractions of sshTLR5 purifications done using Ni‐IMAC. However, as one round of purification was not sufficient to obtain volumetric yields, these were estimated using ImageJ. The percentage of the hTLR5 band was calculated from the obtained histograms and used for the calculation of the estimated yields of SMT_dneo(2)_24‐sshTLR5‐C1 and SMT_dneo(2)_24‐sshTLR5‐C2 (0.11 mg/L and 0.17 mg/L respectively).

RESULTS
113
Lane TE3‐B4‐H1‐sshTLR5/mPRAT4A‐C1 (57.5 kDa)
1 Fermentas PageRuler (Thermo Scientific)
2 Pooled eluate fractions of sshTLR5
3 2x concentrated Pooled eluate fractions of hTLR5
Figure 4‐47: 10 % Western blot analysis of purified TE3‐B4‐H1‐sshTLR5/mPRAT4A‐C1. hTLR5 was produced in 1 L batch culture using the binary cell line TE3‐B4‐H1‐sshTLR5/mPRAT4A‐C1. Western blot analysis show the pooled eluate fractions of hTLR5 after Strep purification as well as 2x concentrated fraction of the same. However, volumetric yields were not high enough to be quantified or detected on SDS‐PAGE.
Lane SMT_dneo(2)_24‐sshTLR5‐C1 (57.5 kDa)
1 Precision Plus Protein Unstained (Bio‐Rad)
2 Non‐binding fraction
3‐9 Wash fractions
10‐15 hTLR5 eluate fractions
Figure 4‐48: 12 % SDS‐PAGE of purified hTLR5 from expression in perfusion reactor using SMT_dneo(2)_24‐sshTLR5‐C1. hTLR5 that was produced in a 30 L perfusion reactor using the cell line SMT_dneo(2)_24‐sshTLR5‐C1 and purified using two rounds of Ni‐IMAC and one round of Strep purification. Yield: 0.05 mg/L.
4.4.5 Summary – expression and co‐expression of TLR ECDs and
chaperones
Table 4-4 summarises the results obtained for the expression of the TLR ECD constructs
mTLR1, mTLR2 and hTLR5 as well as their co-expression with the molecular chaperones
mPRAT4A or mGRP94 as described in Section 4.4.2 – Section 4.4.4. The co-expression of
114
chaperones was not shown to improve the expression of TLRs. In the contrary, it was
demonstrated that mTLR2 yields were reduced up to ~ 67 %. Most likely the yields of
mTLR1 and hTLR5 were similarly impacted. A detailed discussion about the reasons that
might have led to this result are available in Section 5.4.
Table 4‐4: Summary table TLR (co)‐expression
Cell Line Locus 1 Locus 2 Yield mg/L Batch culture
Yield mg/L Bioreactor
BBA10‐TLR2‐C1 mTLR2 N/A 0.5 0.9 ± 0.3
BBA10‐TLR2‐C7 mTLR2 N/A 0.9 ‐
SMT_dneo(2)_24‐ssmTLR2‐C7 mTLR2 N/A WB 1.4 ± 0.1
TE3‐B4‐H1‐ssmTLR2/mPRAT4A‐C1 mTLR2 mPRAT4A SDS‐PAGE/WB 0.5 ± 0.1
TE3‐B4‐H1‐ssmTLR2/mPRAT4A‐C2 mTLR2 mPRAT4A SDS‐PAGE/WB ‐
TE3‐B4‐H1‐ssmTLR2/mGRP94‐C1 mTLR2 mGRP94 SDS‐PAGE/WB 0.6 ± 0.1
SMT_dneo(2)_24‐mTLR1‐455‐C1 mTLR1 N/A SDS‐PAGE/WB ‐
SMT_dneo(2)_24‐mTLR1‐455‐C2 mTLR1 N/A SDS‐PAGE/WB ‐
TE3‐B4‐H1‐mTLR1/mPRAT4A‐C1 mTLR1 mPRAT4A SDS‐PAGE/WB ‐
TE3‐B4‐H1‐mTLR1/mPRAT4A‐C2 mTLR1 mPRAT4A SDS‐PAGE/WB ‐
TE3‐B4‐H1‐mTLR1/mGRP94‐C1 mTLR1 mGRP94 TBD ‐
SMT_dneo(2)_24‐sshTLR5‐C1 hTLR5 N/A SDS‐PAGE 0.1
SMT_dneo(2)_24‐sshTLR5‐C1 hTLR5 N/A SDS‐PAGE ‐
TE3‐B4‐H1‐sshTLR5/mPRAT4A‐C1 hTLR5 mPRAT4A WB ‐

DISCUSSION
115
5 Discussion
5.1 Stable cell line development
CHO cell lines are the most commonly used host for recombinant protein production in
industrial applications (Datta et al., 2013). Their well-established safety profile eases the
approval of biopharmaceuticals with regulatory agencies and extensively optimized
processes are already in place (Estes et al., 2014). As a mammalian host PTMs are processed
and can be modified to improve intrinsic properties such as plasma-half life, shield
immunogenic epitopes or increase the uptake into target cells (Walsh et al., 2006). The time
invested into the generation and isolation of stable isogenic producer cell lines is
compensated with the prospect to scale up protein production in a reproducible and robust
manner using bioreactors.
Standard methods for stable cell line generation require the random integration of each
target gene into the host genome. The identification of recombinant cells is based on the
co-introduction of a selectable marker gene of choice. This marker can either result in the
rescue or improvement of essential cellular processes as in the DHFR-system (Urlaub et al.,
1980) or the GS-system (Cockett et al., 1990) or introduce entirely new properties into
recombinant cells. For example, the introduction of a bacterial antibiotic marker will
introduce resistance to a specific antibiotic (Southern et al., 1982, Vara et al., 1986) whereas
the introduction of fluorescent marker genes will enable the identification of recombinant
cells via flowcytometric methods which are preferably used for HTP approaches (Shi 2011).
As random integration of a transgene into the host genome will result in unpredictable
expression properties due to the site of integration (position-effect) and the number of
transgene integrations, extensive screening is required to isolate isogenic high producer cell
lines for each protein target (Wurm, 2004).
To simplify the generation of high producer cell lines the use of site specific recombinases
for tag-and-target and tag-and-exchange strategies was introduced. Particularly Flp/FRT
based methods are gaining popularity including: The Flp-in system (O'Gorman et al., 1991,
Invitrogen, 2010), the FLIRT system with its variations (Huang et al., 1997, Kaufman et al.,
2008, Wilke et al., 2010) and finally the RMCE system (Schlake et al., 1994). While the
generation of isogenic high producer master cell lines follows the same pattern as for
DISCUSSION
116
conventional cell line development, this initial effort to isolate a suitable master cell line
with a tagged genomic locus enables the comparatively quick generation of high producer
cell lines containing a GOI. Multiplexing approaches which employ the use of different sets
of heterospecific FRT sites were proposed (Turan et al., 2010).
Numerous examples wherein the co-expression of proteins favour the expression or
function of a target gene are described in the literature. The use of one expression cassette
(monocistronic or polycistronic) or several expression cassettes within one or more
expression vectors can be used for the co-expression of protein subunits, ligands or
accessory molecules. For example: (i) Improved cell-surface expression level were obtained
for a G-protein-coupled receptor (GPCR), called olfactory receptor, when co-expressed with
Hsc70t in HEK293 cells which was otherwise retained within the ER (Neuhaus et al., 2006).
(ii) The co-expression of farnesyltransferase heterodimer subunits in Sf9 improved
functional activity of this enzyme (Chen et al., 1993). (iii) Functional cytokine expression
and in vivo half-life were improved in CHO cells for an IL-15 variant when combined with
its receptor (Han et al., 2011). Additional examples are reviewed elsewhere (Romier et al.,
2006, Kerrigan et al., 2011). Expression systems which enable the co-expression of several
protein targets through site specific recombination using the Cre/loxP system were
established in E.coli (Acembl) (Bieniossek et al., 2009) insect cells (MultiBac system) (Berger
et al., 2004, Fitzgerald et al., 2007) and mammalian cells (MultiLabel) (Kriz et al., 2010) and
put to use for the co-expression of several multi-protein complexes (Bieniossek et al., 2008).
In this work a binary Flp/FRT based RMCE system was set up in the glycosylation deficient
CHO Lec3.2.8.1 cell line (Section 4.1). This binary system enables the co-expression of target
genes at different pre-defined genomic loci. The generation and evaluation of this system
is discussed in Section 5.2 and Section 5.3 respectively. The co-expression of TLR ECD
constructs together with their chaperones mPRAT4A and mGRP94 are discussed in
Section 5.4).
5.2 Generation of binary CHO Lec3.2.8.1 RMCE master and
producer cell lines
Expression hosts capable of PTMs are favourable for protein expression and function of
complex proteins. However heterogeneous glycosylation pattern do interfere in structural
biology applications and thus the use of glycosylation inhibitors during protein expression
DISCUSSION
117
or the use of glycosylation deficient cell lines becomes necessary (Aricescu et al., 2006,
Nettleship et al., 2010). CHO Lec3.2.8.1, a glycosylation deficient cell line which expresses a
uniform GlcNAc2Man5 profile on the protein surface (Stanley, 1989), was used for the
generation of the Flp/FRT based binary RMCE system described in this work.
It was desired to establish a cell line which enables the independent integration of two
transgenes at different genomic loci. The co-expression of proteins with accessory
molecules or the co-expression of multi-protein complexes might be beneficial for difficult
to express targets. For this purpose binary RMCE cell lines containing the exchange
cassettes PEF-FRT3-eGFP-FRTwt-Δneo and PEF-FRT13-tdTomato-FRT14-Δpuro were generated
(Section 4.1.4). Site specific recombination based on the Flp/FRT system was used to
integrate transgenes at pre-defined chromosomal loci. The use of distinct sets of
heterospecific FRT sites (FRT3/FRTwt and FRT13/FRT14) enabled the independent
integration at either locus as described in Section 4.3 and Section 4.4.
The fluorescent marker gene tdTomato present in exchange locus 2
(PEF-FRT13-tdTomato-FRT14-Δpuro) was used for the isolation of binary RMCE master cell
lines after the genomic tagging of two different RMCE master cell lines that already
contained locus 1 (PEF-FRT3-eGFP-FRTwt-Δneo) in their genome. As the cell sorter used for
this work were not operated under sterile conditions drawbacks from frequent
contaminations resulted in the delayed generation of the binary master cell lines. The
attempt to control contaminations through the addition of antibiotics penicillin,
streptomycin and gentamicin were of limited success as they seemed to have an adverse
effect on the sorted cells most likely due to the cellular stress that resulted in low cell
vitalities. Cells sorted without antibiotics however could be isolated as pools ( 22.000
positive cells derived from 1x10⁷ sorted cells) if not contaminated. Attempts to isolate single
cells or a small pools of up to 100 cell in multi-well formats failed. When sorting small cell
numbers of 1 cell/well or 10 cells/well these did not proliferate either due to the statistical
probability of having a living cell in one well or due to the small cell number of surviving
cells in each well. When sorting 100 cells/well however the prolonged time required for
sorting into 96-well plates in an open system resulted in the contamination of virtually all
wells. While the isolation of single cells via FACS would have been favourable to isolate
truly isogenic master cell lines, the use of limiting dilution or the use of a second round of
FACS yielded virtually isogenic cell lines as described in Section 4.1.4. It should be noted
DISCUSSION
118
that binary master cell line selection was based entirely on the level of fluorescence as
selection criteria. No antibiotic selection pressure was used as this was shown to result in
heterogeneous expression and epigenetic silencing of the isolated cells after removal of
selective pressure (Liu et al., 2006). Due to the problems confronted during FACS in this
work the isolation of producer cell lines after RMCE was done using limiting dilution in
combination with selective pressure. Even though the isolation of producer cell lines using
limiting dilution can be time-consuming due to the varying amount of rounds required for
the successful isolation of producer cell lines, the process was not slowed down due to
contaminations and thus more predictable.
The integrity of both exchange loci was confirmed through genomic PCR (Section 4.1.5).
The number of integration sites for locus 1 (PEF-FRT3-eGFP-FRTwt-Δneo) was previously
determined by Wilke et al., (2011) for the cell line SWI3_26 and by Sarah Maria Tokarski
(HZI) for the cell line SMT_dneo(2)_24. Both cell lines comprise one exchange locus. To
determine the number of integrated loci for the newly introduced locus 2
(PEF-FRT13-tdTomato-FRT14-Δpuro) in the binary RMCE master cell lines Southern blots using
digoxigenin (DIG)-labelling were done but yielded no results. Likewise no results using
radioactive southern blots could yet be obtained. While this may leave doubts about the
number of integration sites, the behaviour of the cell lines does not lead to the conclusion
that more than one second locus was integrated. The exchange efficiency does not seem to
be negatively influenced for locus 2. If more than one locus would be present within the
binary RMCE cell lines it would be more difficult to obtain tdTomato negative clones as it
would require the successful exchange in all integrated loci. Successful integration however
is a rare event. As described in the next paragraph the simultaneous exchange of both
exchange loci failed due to this very reason. If more than one second exchange locus would
be present within the binary RMCE cell lines it would be very difficult to obtain tdTomato
negative clones. Nonetheless, the number of integration sites still needs to be confirmed.
An alternative or addition to Southern blot analysis would be whole genome sequencing of
our binary RMCE master cell lines. This would not only confirm the number of integration
loci but also the chromosomal integration site.
The generation of binary producer cell lines was performed through sequential integration
into each exchange locus at one time. Attempts to exchange both loci simultaneously were
not successful. Even though the RMCE reaction is driven through the molecular excess of
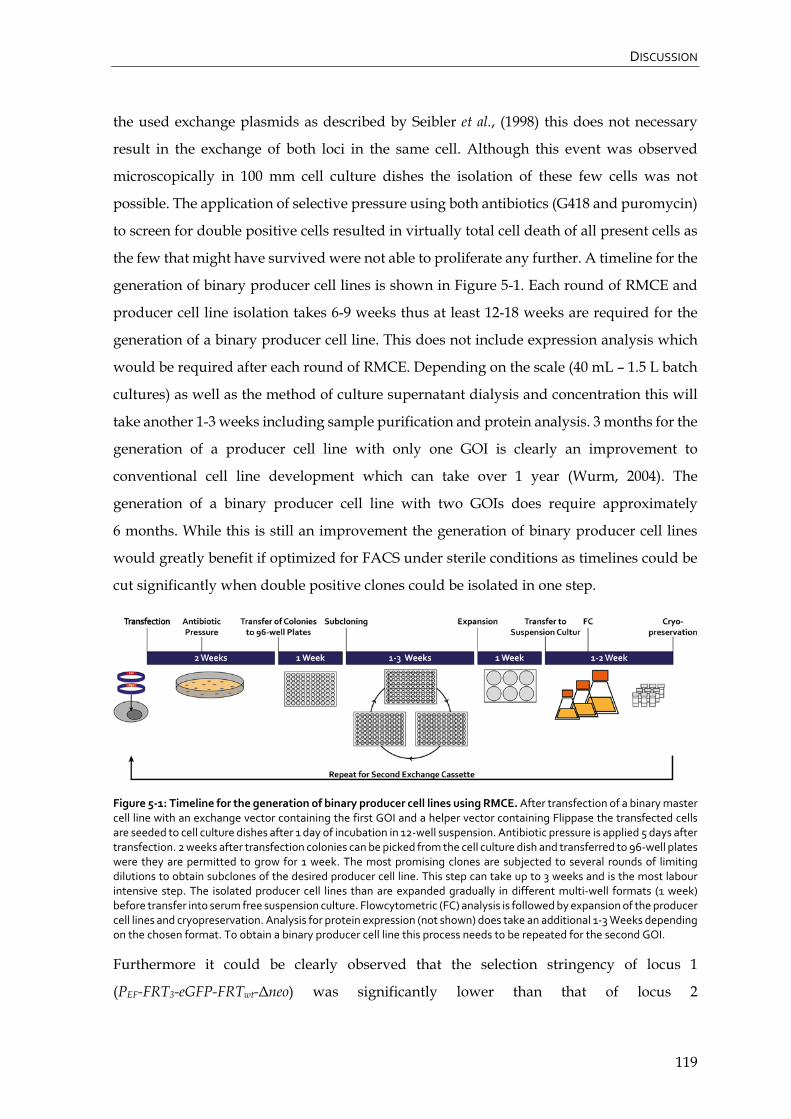
DISCUSSION
119
the used exchange plasmids as described by Seibler et al., (1998) this does not necessary
result in the exchange of both loci in the same cell. Although this event was observed
microscopically in 100 mm cell culture dishes the isolation of these few cells was not
possible. The application of selective pressure using both antibiotics (G418 and puromycin)
to screen for double positive cells resulted in virtually total cell death of all present cells as
the few that might have survived were not able to proliferate any further. A timeline for the
generation of binary producer cell lines is shown in Figure 5-1. Each round of RMCE and
producer cell line isolation takes 6-9 weeks thus at least 12-18 weeks are required for the
generation of a binary producer cell line. This does not include expression analysis which
would be required after each round of RMCE. Depending on the scale (40 mL – 1.5 L batch
cultures) as well as the method of culture supernatant dialysis and concentration this will
take another 1-3 weeks including sample purification and protein analysis. 3 months for the
generation of a producer cell line with only one GOI is clearly an improvement to
conventional cell line development which can take over 1 year (Wurm, 2004). The
generation of a binary producer cell line with two GOIs does require approximately
6 months. While this is still an improvement the generation of binary producer cell lines
would greatly benefit if optimized for FACS under sterile conditions as timelines could be
cut significantly when double positive clones could be isolated in one step.
Figure 5‐1: Timeline for the generation of binary producer cell lines using RMCE. After transfection of a binary master cell line with an exchange vector containing the first GOI and a helper vector containing Flippase the transfected cells are seeded to cell culture dishes after 1 day of incubation in 12‐well suspension. Antibiotic pressure is applied 5 days after transfection. 2 weeks after transfection colonies can be picked from the cell culture dish and transferred to 96‐well plates were they are permitted to grow for 1 week. The most promising clones are subjected to several rounds of limiting dilutions to obtain subclones of the desired producer cell line. This step can take up to 3 weeks and is the most labour intensive step. The isolated producer cell lines than are expanded gradually in different multi‐well formats (1 week) before transfer into serum free suspension culture. Flowcytometric (FC) analysis is followed by expansion of the producer cell lines and cryopreservation. Analysis for protein expression (not shown) does take an additional 1‐3 Weeks depending on the chosen format. To obtain a binary producer cell line this process needs to be repeated for the second GOI.
Furthermore it could be clearly observed that the selection stringency of locus 1
(PEF-FRT3-eGFP-FRTwt-Δneo) was significantly lower than that of locus 2
DISCUSSION
120
(PEF-FRT13-tdTomato-FRT14-Δpuro) and thus required additional rounds of limiting dilution
to obtain the desired producer cell lines. This can be attributed to the apparent resistance of
CHO Lec3.2.8.1 cells towards G418 which require higher concentrations of antibiotic
(2 mg/mL) compared to puromycin which only requires low concentrations (15 µg/mL).
The more gradual decrease observed in cell viability when using G418 compared to the
more sharp decrease in cell viability when using puromycin while estimating appropriate
titres supports this observation in the obtained kill-curves (Figure 4-1). Thus future
CHO Lec3.2.8.1 master cell lines should relinquish Δneo as a selection trap and rather choose
an alternative gene such as hyg which confers resistance towards hygromycin B and shows
a similarly sharp decrease in cell viability as does puromycin in the obtained kill curve
(Figure 4-1). However when producer cell line isolation could be optimized for FACS the
leaky resistance against G418 would not present a challenge anymore as only GFP negative
cells would be sorted.
RMCE compared to other Flp/FRT based integration methods bears the advantage that no
additional prokaryotic elements are co-introduced with the GOI which might induce
epigenetic silencing (Schlake et al., 1994). The only prokaryotic elements introduced in the
system are those present in the tagging vector. However, master cell lines are isolated
according to their expression profile presented by the fluorescent marker in the integrated
loci and observed over several weeks for uniform expression (Section 4.1.4). Thus it can be
presumed that the site of exchange cassette integration was within the transcriptionally
active euchromatin structure and that potential effects of epigenetic silencing can be
disregarded for those loci. The system could be improved through the introduction of
cis-regulatory elements such as S/MARs to oppose heterochromatin effects as it is
occasionally done in conventional cell line development (Wurm, 2004). However instead of
flanking the GOI which would unnecessarily increase the size of the insert and thus
potentially reduce the integration efficiency of the RMCE reaction cis-regulatory elements
could be designed to flank the entire exchange cassette before genomic tagging.
5.3 Evaluation of binary RMCE cell lines expressing tdTomato
To evaluate position and gene dose effects within the integrated exchange loci for several
RMCE cell lines, the expression level of tdTomato which was transcribed in one or two loci
within a given cell line was determined as described in Section 4.2. The obtained yields
confirmed that the site of integration is directly correlated to the expression level of

DISCUSSION
121
tdTomato. Furthermore, the robustness of expression was shown when performed in
triplicate which resulted in reproducible expression level for each cell line. The expression
of tdTomato is dependent on the expression capabilities of each locus and shown to be
cumulative. This allows the prediction of protein level if each locus express the same
protein. In general, binary master cell lines with exchange loci integrated at genomic hot
spots will be most desirable for difficult to express protein targets.
However, the use of master cell lines containing stable loci with varying expression
capabilities may be of advantage for the co-expression of subunits that are required in
different ratios for optimal expression such as light and heavy chains of antibodies
(Schlatter et al., 2005) or accessory molecules which are not required in abundance and
therefore should not unnecessarily occupy the cellular transcription and translation
machinery.
5.4 Expression of TLR ECD constructs
The information available about the expression of TLR ECD constructs is limited. Until
today the production of TLRs still poses a formidable challenge. An overview regarding the
current state for each TLR evaluated in this work (TLR2, TLR5 and TLR1) in position to the
obtained outcomes is given in the following Sections.
5.4.1 Expression of TLR2 ECD
The expression of human and murine TLR2 ECD constructs fused to VLR fragments in High
Five insect cells was reported by Jin et al., (2007) and Kang et al., (2009). While no specific
yield for the human TLR2 ECD constructs were given a murine TLR2 ECD construct was
reported to have an approximate volumetric yield of 100 µg/L by Kang et al., (2009). Several
TLR2 ECD hybrids fused with VLR fragments at their C- or N-terminus were screened for
soluble expression (Jin et al., 2007). The longest murine TLR2 ECD hybrid that was
C-terminally fused at its last LRR sequence (LRR19) with the VLR fragment was
successfully used for co-crystallisation with mTLR6 upon binding to the di-acylated
lipopeptide Pam2CSK4 (Kang et al., 2009). Likewise the longest human TLR2 ECD hybrid
was co-crystallized with hTLR1 after binding to the tri-acylated lipopeptide ligand
Pam3CSK4 (Jin et al., 2007).

DISCUSSION
122
In this work a murine TLR2 construct that comprises the complete ECD including its own
signal peptide, all LRR sequences and it natural LRRCT capping motive was utilized.
RMCE based integration into several CHO Lec3.2.8.1 producer cell lines yielded soluble
protein with volumetric yields of up to 0.9 mg/L in batch cultures and up to 1.5 mg/L when
cultivated in a bioreactor (Section 4.4.2). Compared to the transient expression in insect cells
used in the published literature (Jin et al., 2007, Kang et al., 2009) the production of mTLR2
was improved when expressed stably in CHO Lec3.2.8.1. This was further supported by
previous experiments performed within our own group in which the full mTLR2 ECD
construct was expressed in insect cells. While similar quantities of the mTLR2 ECD (up to
1 mg/L) were expressed these were only present in an insoluble form (Meyer, 2012) or
showed strong batch to batch variations (personal communication Joop van den Heuvel,
HZI). Likewise transient expression of mTLR2 in HEK293-6E cells yielded only insoluble
protein (Meyer, 2012). In general higher protein yields can be obtained with transient
expression systems due to the high copy-number of transgenes introduced into the
transfected cells. However the extensive overexpression of a target protein may also cause
problems if the protein-folding machinery is overloaded. This can cause protein
aggregation that results in the retention of the improperly folded protein within
intracellular compartments thus limiting the amount of soluble protein (Ishiyama et al.,
2010, Halff et al., 2014). Clearly the stable expression of a single-copy mTLR2 ECD in
CHO Lec3.2.8.1 is favourable to transient expression in BEVS or HEK293-6E when soluble
protein is required. Knowing this, it would be worthwhile to evaluate the stable expression
of a chimeric mTLR2-VLR construct in CHO Lec3.2.8.1 as this might positively influence
volumetric yields. However the screening of constructs in transient HEK396-6E would still
face the problem of protein aggregation if performed under standard conditions. The
reduction of total protein expression as suggested by Halff et al., (2014) through the
transfection with smaller amounts of the express vector could improve the soluble
expression of mTLR2 constructs in HEK293-6E. A different approach to improve the
expression of the mTLR2 ECD was pursuit in this work. The co-expression of the mTLR2
ECD with the molecular chaperones mPRAT4A and mGRP94. To do so binary producer
cell lines in CHO Lec3.2.8.1 that stably co-express the mTLR2 ECD and either mPRAT4A or
mGRP94 were generated (Section 4.4.2). Expression of mPRAT4A and mGRP94 was
confirmed after integration into locus 2 (PEF-FRT13-tdTomato-FRT14-Δpuro) of the binary
RMCE cell line TE3-B4-H1 (Section 4.3.3). Afterwards the mTLR2 ECD was integrated into
DISCUSSION
123
locus 1 (PEF-FRT3-eGFP-FRTwt-Δneo). The expression of mTLR2 in 2.5 L bioreactors yielded
volumetric yield of 0.5 ± 0.1 mg/L and 0.6 ± 0.1 mg/L for the cell lines
TE3-B4-H1-ssmTLR2/mPRAT4A-C1 and TE3-B4-H1-ssmTLR2/mGRP94-C1 respectively.
Thus the expression of mTLR2 was clearly reduced when co-expressed with molecular
chaperones. Reasons why the co-expression of TLR2 with mPRAT4A did not improve
protein expression are discussed in Section 5.4.4.
5.4.2 Expression of TLR5 ECD
Yoon et al., (2012) attempted to produce TLR5 ectodomains form several organisms
including human, mouse, frog, trout and zebrafish in High Five insect cells. The full ECD
construct of zebrafish TLR5 was the only one to express. However the obtained volumetric
yields of secreted soluble protein remained clearly below 50 µg/L. To obtain sufficient
quantities for structural analysis the creation of dsTLR5-VLR hybrids was pursued. Crystal
structures could be solved for dsTLR5 ECDs with C-terminally fused VLR fragments at
LRR12 and LRR14 but no specific yield were described. The same group further improved
the expression of the non-hybrid dsTLR5 ECD through the addition of the flagellin FliC
during production thus increasing the volumetric yield to 0.4 mg/L for the complex. This
approach however could not be transferred to human TLR5. The expression of human TLR5
was aided through the generation of hTLR5-VLR hybrids. But only very short fragments
could be expressed. The fusion of VLR fragments to the C-terminus at LRR4 or LRR6
yielded ~0.3 mg/L. The fusion of VLR fragments to both termini even yielded 0.8 mg/L
when fused to LRR11 and LRR14. Likewise the expression of dsTLR5-VLR hybrids could
be improved for truncated dsTLR5 domains if VLR fragments were fused at one or both
termini reaching yields up to 3.8 mg/L (Hong et al., 2012). However none of the short
expressible hTLR5-VLR-hybrids was able to form a complex with FliC.
In this work a human TLR5-VLR hybrid was used. The hTLR5 ECD was fused at its
C-terminus with a VLR fragment at LRR16 to ease expression. Upon stable integration into
CHO Lec3.2.8.1 cells volumetric yields of 0.1 mg/L were achieved when cultivated in a
perfusion reactor (Section 4.4.4). Comparable constructs, with C-terminal VLR-fusions at
LLR14 and LRR17, tested by Hong et al., (2012) in High Five insect cells did not yield any
protein. As for the mTLR2 ECD discussed in Section 5.4.1 the over-expression of hTLR5 in
insect cells appears to result in the intracellular accumulation of the protein as shown by
Meyer, (2012) for several hTLR5 ECD constructs. The single-copy expression in stable
DISCUSSION
124
CHO Lec3.2.8.1 improves the soluble expression of hTLR5 compared to similar ECD
constructs tested by Hong et al., (2012) in BEVS. While a volumetric yield of 0.1 mg/L
soluble hTLR5 in CHO Lec3.2.8.1 leaves space for improvement it is the largest solubly
expressible hTLR5 ECD construct reported so far. To improve the expression of hTLR5 in
CHO Lec3.2.8.1 a binary producer cell that co-expresses hTLR5 and mPRAT4A was
generated (Section 4.4.4). Expression of hTLR5 was confirmed via Western blot but no
volumetric yields could be obtained. The effects of chaperone co-expression are discussed
in Section 5.4.4.
5.4.3 Expression of TLR1 ECD
A human TLR1 ECD C-terminally fused at LRR17 with a VLR fragment was previously
expressed in High Five insect cells to obtain sufficient quantities for crystallization but no
specific yields were given. Additional human and murine TLR1-VLR hybrids that can be
solubly expressed in High Five were reported (Jin et al., 2007). Three of these described
soluble murine TLR1 constructs that were C-terminally fused at LRR14, LRR16 and LRR19
were screened in HEK293-6E by Agarwal, (2012) for this work. The mTLR1 construct fused
C-terminally at LRR16 with a VLR fragment was the only one to show expression in
HEK293-6E and was chosen for stable integration into CHO Lec3.2.8.1 via RMCE
(Section 4.4.3). While mTLR1 was expressed solubly in CHO Lec3.2.8.1 no volumetric yields
could be obtained due to its low expression level. To improve the expression of mTLR1
binary producer cell lines expressing mTLR1 with one chaperone, either mPRAT4A or
mGRP94, were generated (Section 4.4.3). While the expression of mTLR1 in the binary
producer cell line TE3-B4-H1-mTLR1/mGRP94-C1 could not yet be confirmed, the binary
producer cell lines TE3-B4-H1-mTLR1/mPRAT4A-C1 and
TE3-B4-H1-mTLR1/mPRAT4A-C2 do express mTLR1 but the volumetric yields are still too
low for quantification. A more detailed discussion on the effects of chaperone co-expression
can be found in Section 5.4.4. Like hTLR5 discussed in Section 5.4.2 mTLR1 shows a very
low level of expression. Large scale cultivation in a perfusion reactor is likely to give
quantifiable yields but will not reach those of hTLR5. The generation of mTLR1 ECD
constructs N- and C-terminally fused to VLR fragments might improve expression as
previously reported for dsTLR5 and hTLR5 by Hong et al., (2012).

DISCUSSION
125
5.4.4 Co‐expression of TLR ECDs with molecular chaperones
The importance of the ER resident chaperone GRP94 for conformational maturation and
cell surface trafficking of TLR1, TLR2 and TLR5 was demonstrated by Randow et al., (2001)
and Yang et al., (2006). Likewise the role of the ER resident chaperone PRAT4A for cell
surface expression of TLR1, TLR2 and TLR5 was shown by Takahashi et al., (2007) and
Shibata et al., (2012).
The binary RMCE system established during this work (Section 4.1) was used to generate
several binary producer cell lines co-expressing one TLR ECD construct (mTLR1, mTLR2
or hTLR5) together with one molecular chaperone (mGRP94 or mPRAT4A) (Section 4.3 and
Section 4.4). It was anticipated that the over-expression of the molecular chaperones will
support the soluble expression of the TLR ECDs. However this could not be confirmed for
any of the generated binary producer cell lines as described in Section 5.4.1–Section 5.4.3.
In the contrary the expression level of mTLR2 were even reduced when co-expressed with
molecular chaperones. On reason why the co-expression of mPRAT4A or mGRP94 did not
improve TLR ECD expression could be that the overexpression of only one chaperone is
not sufficient to significantly aid the expression of the tested TLR constructs. A publication
by Liu et al., (2010) demonstrated that at least TLR9, present in endosomal compartments,
does require both PRAT4A and GRP94 for maturation. PRAT4A was shown to serves as
co-chaperone of GRP94 in a tri-molecular complex with TLR9. It cannot be excluded that
TLR1, TLR2 or TLR5 also require both chaperones in a 1:1 ratio for successful maturation.
If only one chaperone is overexpressed this balance would not be given. A different reason,
why the co-expression of mPRAT4A or mGRP94 negatively influenced TLR expression
could be the design of the construct itself. Both chaperones were designed with a C-terminal
FLAG-tag downstream of the ER retention signals KDEL or PDEL. These retention signals
are required for the regulation of ER-retrieval of ER resident proteins from the Golgi
apparatus. The ER-retention signals are recognized by KDEL-receptors and trafficked back
to the ER (Alberts, 2008). If the C-terminal FLAG tag should impair recognition of the
chaperones by the KDEL receptor these would not be shuttled back to the ER and gradually
lost over time. If the molecular chaperones are lost from the ER they can no longer aid the
TLR folding process. Furthermore, if improperly folded TLRs are still associated with the
chaperones when they are lost from the ER they might be targeted for proteasomal
degradation which would explain the reduced TLR yields. Thus the FLAG tag should be
DISCUSSION
126
located upstream before the KDEL or PDEL sequence or left out altogether. As the isolation
and purification of mGRP94 and mPRAT4A are not necessarily required the FLAG tag
could be omitted and target specific antibodies could be used to detect the overexpression
of both using Western blot analysis. Moreover, the overexpression of mPRAT4A and
mGRP94 might have occupied significant portions of the cellular transcription and
transcription machinery or even imitated an unfolded protein responses (UPR) that might
have resulted in the downregulation of cellular protein synthesis (Reid et al., 2014). The
integration of mPRAT4A and mGRP94 into a binary RMCE master cell line with an
exchange locus that exhibits low expression capabilities might be favourable.
OUTLOOK
127
6 Outlook
A binary RMCE system in CHO Lec3.2.8.1 cells was established. Thus the stable integration
of transgenes into predefined chromosomal loci via RMCE, based on the Flp/FRT system,
enables the co-expression of different target proteins for structural biology applications.
The binary RMCE system was shown to yield predictable expression pattern for each locus
and therefore allows the reproducible production of recombinant proteins after the
generation of stable producer cell lines. This system expands the Multi-Host system (Meyer
et al., 2013) developed in our group. The use of the binary RMCE system could be adapted
for other mammalian cell lines including CHO-K1 or HEK293 when native glycosylation
profiles are required. Likewise compatible RMCE as well as binary RMCE approaches
could be established in insect and yeast platforms.
The use of targeted integration already reduces the time necessary for the isolation of stable
high producer cell lines. However, isolation of master and producer cell lines would benefit
immensely when adapted for FACS under sterile conditions. Limiting dilution, which was
used for the clonal isolation of producer cell lines in this work, is cumbersome labour- and
time-intensive. Therefore the reduction of limiting dilution steps would be favourable.
Moreover, the number of cell lines that could be processed in parallel could be expanded
as each cell line would require less attention from the operator. FACS based methods for
the isolation of RMCE master and producer cell lines derived from CHO-K1 are used by
the Rentschler Biotechnologie GmbH for the generation TurboCellTM lines. These cut their
timelines by 50 % compared to random integration based cell line development (Rehberger
et al., 2013).
The expression properties of the TLR ECDs discussed in Section 5.4 showed intracellular
accumulation in Insect and HEK293-6E cells (Meyer, 2012) whereas the soluble expression
in CHO Lec3.2.8.1 cells was clearly improved. Recently Croset et al., (2012) raised awareness
that while there are only minor differences in glycosylation and glycoprotein isoform patter
between different HEK cell lines (HEK293-EBNA and HEK293-6E were compared) major
differences could be observed between HEK and CHO-S cells which might result in
non-comparable results when switching from HEK to CHO systems. This may be a concern
that should be addressed for the system used in this work. Currently HEK293-6E are used
for transient screening to identify constructs that express solubly. Those constructs with the
highest potential than are used for the generation of stable producer cell lines in
OUTLOOK
128
glycosylation mutant CHO Lec3.2.8.1. If differences in the glycoprotein isoform patter
between HEK and CHO-S can be considered problematic (Croset et al., 2012) this problem
will reflect even more on glycosylation mutant CHO Lec3.2.8.1. Therefore the establishment
of a transient CHO Lec3.2.8.1 platform might be of advantage when screening for solubly
expressible constructs designated for stable integration in CHO Lec3.2.8.1. Examples for
transient EBNA-1 based systems in CHO cell were described in the literature (Kunaparaju
et al., 2005, Goepfert et al., 2010, Durocher et al., 2011, Daramola et al., 2014).
BIBLIOGRAPHY
129
7 Bibliography
Agarwal, S. (2012). Transient Expression and Generation of Stable CHO-RMCE Production Cell Lines for Soluble Ectodomains of TLR Proteins, Fachhochschule Flensburg.
Agrawal, S., A. Agrawal, B. Doughty, A. Gerwitz, J. Blenis, T. Van Dyke and B. Pulendran (2003). Cutting edge: different Toll-like receptor agonists instruct dendritic cells to induce distinct Th responses via differential modulation of extracellular signal-regulated kinase-mitogen-activated protein kinase and c-Fos. J Immunol 171(10): 4984-4989.
Akira, S. and K. Takeda (2004). Toll-like receptor signalling. Nat Rev Immunol 4(7): 499-511.
Alberts, B. (2008). Molecular biology of the cell. New York, Garland Science.
Andersen-Nissen, E., K. D. Smith, R. Bonneau, R. K. Strong and A. Aderem (2007). A conserved surface on Toll-like receptor 5 recognizes bacterial flagellin. The Journal of Experimental Medicine 204(2): 393-403.
Andersen-Nissen, E., K. D. Smith, K. L. Strobe, S. L. R. Barrett, B. T. Cookson, S. M. Logan and A. Aderem (2005). Evasion of Toll-like receptor 5 by flagellated bacteria. Proceedings of the National Academy of Sciences of the United States of America 102(26): 9247-9252.
Andrews, B. J., G. A. Proteau, L. G. Beatty and P. D. Sadowski (1985). The FLP recombinase of the 2[mu] circle DNA of yeast: Interaction with its target sequences. Cell 40(4): 795-803.
Angov, E., C. J. Hillier, R. L. Kincaid and J. A. Lyon (2008). Heterologous protein expression is enhanced by harmonizing the codon usage frequencies of the target gene with those of the expression host. PLoS ONE 3(5): e2189.
Aricescu, A. R., W. Lu and E. Y. Jones (2006). A time- and cost-efficient system for high-level protein production in mammalian cells. Acta Crystallogr D Biol Crystallogr 62(Pt 10): 1243-1250.
Aricescu, A. R. and R. J. Owens (2013). Expression of recombinant glycoproteins in mammalian cells: towards an integrative approach to structural biology. Current Opinion in Structural Biology 23(3): 345-356.
Backliwal, G., M. Hildinger, S. Chenuet, S. Wulhfard, M. De Jesus and F. M. Wurm (2008). Rational vector design and multi-pathway modulation of HEK 293E cells yield recombinant antibody titers exceeding 1 g/l by transient transfection under serum-free conditions. Nucleic Acids Research 36(15): e96.
Backliwal, G., M. Hildinger, V. Hasija and F. M. Wurm (2008). High-density transfection with HEK-293 cells allows doubling of transient titers and removes need for a priori DNA complex formation with PEI. Biotechnology and Bioengineering 99(3): 721-727.
Backliwal, G., M. Hildinger, I. Kuettel, F. Delegrange, D. L. Hacker and F. M. Wurm (2008). Valproic acid: a viable alternative to sodium butyrate for enhancing protein expression in mammalian cell cultures. Biotechnol Bioeng 101(1): 182-189.
BIBLIOGRAPHY
130
Baldi, L., N. Muller, S. Picasso, R. Jacquet, P. Girard, H. P. Thanh, E. Derow and F. M. Wurm (2005). Transient gene expression in suspension HEK-293 cells: application to large-scale protein production. Biotechnol Prog 21(1): 148-153.
Barton, G. M. and J. C. Kagan (2009). A cell biological view of Toll-like receptor function: regulation through compartmentalization. Nat Rev Immunol 9(8): 535-542.
Baycin-Hizal, D., D. L. Tabb, R. Chaerkady, L. Chen, N. E. Lewis, H. Nagarajan, V. Sarkaria, A. Kumar, D. Wolozny, J. Colao, E. Jacobson, Y. Tian, R. N. O'Meally, S. S. Krag, R. N. Cole, B. O. Palsson, H. Zhang and M. Betenbaugh (2012). Proteomic analysis of Chinese hamster ovary cells. J Proteome Res 11(11): 5265-5276.
Becker, J., C. Timmermann, T. Jakobi, O. Rupp, R. Szczepanowski, M. Hackl, A. Goesmann, A. Tauch, N. Borth, J. Grillari, A. Puhler, T. Noll and K. Brinkrolf (2011). Next-generation sequencing of the CHO cell transcriptome. BMC Proceedings 5(Suppl 8): P6.
Bell, J. K., I. Botos, P. R. Hall, J. Askins, J. Shiloach, D. M. Segal and D. R. Davies (2005). The molecular structure of the Toll-like receptor 3 ligand-binding domain. Proc Natl Acad Sci U S A 102(31): 10976-10980.
Berger, I., D. J. Fitzgerald and T. J. Richmond (2004). Baculovirus expression system for heterologous multiprotein complexes. Nat Biotech 22(12): 1583-1587.
Bertani, G. (1951). Studies on lysogenesis. I. The mode of phage liberation by lysogenic Escherichia coli. journal of Bacteriology 62: 293-300.
Bevis, B. J. and B. S. Glick (2002). Rapidly maturing variants of the Discosoma red fluorescent protein (DsRed). Nat Biotech 20(1): 83-87.
Bieniossek, C., Y. Nie, D. Frey, N. Olieric, C. Schaffitzel, I. Collinson, C. Romier, P. Berger, T. J. Richmond, M. O. Steinmetz and I. Berger (2009). Automated unrestricted multigene recombineering for multiprotein complex production. Nat Meth 6(6): 447-450.
Bieniossek, C., T. J. Richmond and I. Berger (2008). MultiBac: Multigene Baculovirus-Based Eukaryotic Protein Complex Production. Current Protocols in Protein Science.
Blasey, H. D. and V. Jäger (1991). Strategies to Increase the Efficiency of Membrane Aerated and Perfused Animal Cell Bioreactors by an Improved Medium Perfusion. Animal Cell Culture and Production of Biologicals. R. Sasaki and K. Ikura, Springer Netherlands: 61-73.
Buchholz, F., P.-O. Angrand and A. F. Stewart (1998). Improved properties of FLP recombinase evolved by cycling mutagenesis. Nat Biotech 16(7): 657-662.
Butters, T. D., L. M. Sparks, K. Harlos, S. Ikemizu, D. I. Stuart, E. Y. Jones and S. J. Davis (1999). Effects of N-butyldeoxynojirimycin and the Lec3.2.8.1 mutant phenotype on N-glycan processing in Chinese hamster ovary cells: application to glycoprotein crystallization. Protein Sci 8(8): 1696-1701.
Cai, Z., A. Sanchez, Z. Shi, T. Zhang, M. Liu and D. Zhang (2011). Activation of Toll-like Receptor 5 on Breast Cancer Cells by Flagellin Suppresses Cell Proliferation and Tumor Growth. Cancer Research 71(7): 2466-2475.

BIBLIOGRAPHY
131
Campbell, R. E., O. Tour, A. E. Palmer, P. A. Steinbach, G. S. Baird, D. A. Zacharias and R. Y. Tsien (2002). A monomeric red fluorescent protein. Proc Natl Acad Sci U S A 99(12): 7877-7882.
Chalfie, M., Y. Tu, G. Euskirchen, W. W. Ward and D. C. Prasher (1994). Green fluorescent protein as a marker for gene expression. Science 263(5148): 802-805.
Chang, V. T., M. Crispin, A. R. Aricescu, D. J. Harvey, J. E. Nettleship, J. A. Fennelly, C. Yu, K. S. Boles, E. J. Evans, D. I. Stuart, R. A. Dwek, E. Y. Jones, R. J. Owens and S. J. Davis (2007). Glycoprotein Structural Genomics: Solving the Glycosylation Problem. Structure 15(3): 267-273.
Chaudhary, P. M., C. Ferguson, V. Nguyen, O. Nguyen, H. F. Massa, M. Eby, A. Jasmin, B. J. Trask, L. Hood and P. S. Nelson (1998). Cloning and Characterization of Two Toll/Interleukin-1 Receptor–Like Genes TIL3 and TIL4: Evidence for a Multi-Gene Receptor Family in Humans.
Chaudhary, S., J. E. Pak, F. Gruswitz, V. Sharma and R. M. Stroud (2012). Overexpressing human membrane proteins in stably transfected and clonal human embryonic kidney 293S cells. Nat. Protocols 7(3): 453-466.
Chen, W. J., J. F. Moomaw, L. Overton, T. A. Kost and P. J. Casey (1993). High level expression of mammalian protein farnesyltransferase in a baculovirus system. The purified protein contains zinc. J Biol Chem 268(13): 9675-9680.
Chen, Y. and P. A. Rice (2003). New insight into site-specific recombination from Flp recombinase-DNA structures. Annu Rev Biophys Biomol Struct 32: 135-159.
Cheng, N., R. He, J. Tian, P. P. Ye and R. D. Ye (2008). Cutting edge: TLR2 is a functional receptor for acute-phase serum amyloid A. J Immunol 181(1): 22-26.
Chiti, F. and C. M. Dobson (2006). Protein misfolding, functional amyloid, and human disease. Annu Rev Biochem 75: 333-366.
Choe, J., M. S. Kelker and I. A. Wilson (2005). Crystal structure of human toll-like receptor 3 (TLR3) ectodomain. Science 309(5734): 581-585.
Chudakov, D. M., M. V. Matz, S. Lukyanov and K. A. Lukyanov (2010). Fluorescent proteins and their applications in imaging living cells and tissues. Physiol Rev 90(3): 1103-1163.
Cockett, M. I., C. R. Bebbington and G. T. Yarranton (1990). High level expression of tissue inhibitor of metalloproteinases in Chinese hamster ovary cells using glutamine synthetase gene amplification. Biotechnology (N Y) 8(7): 662-667.
Cohen, S. N., A. C. Chang, H. W. Boyer and R. B. Helling (1973). Construction of biologically functional bacterial plasmids in vitro. Proc Natl Acad Sci U S A 70(11): 3240-3244.
Cormack, B. P., R. H. Valdivia and S. Falkow (1996). FACS-optimized mutants of the green fluorescent protein (GFP). Gene 173(1 Spec No): 33-38.
BIBLIOGRAPHY
132
Croset, A., L. Delafosse, J. P. Gaudry, C. Arod, L. Glez, C. Losberger, D. Begue, A. Krstanovic, F. Robert, F. Vilbois, L. Chevalet and B. Antonsson (2012). Differences in the glycosylation of recombinant proteins expressed in HEK and CHO cells. J Biotechnol 161(3): 336-348.
Daramola, O., J. Stevenson, G. Dean, D. Hatton, G. Pettman, W. Holmes and R. Field (2014). A high-yielding CHO transient system: Coexpression of genes encoding EBNA-1 and GS enhances transient protein expression. Biotechnol Prog 30(1): 132-141.
Datta, P., R. J. Linhardt and S. T. Sharfstein (2013). An 'omics approach towards CHO cell engineering. Biotechnology and Bioengineering 110(5): 1255-1271.
Davie, J. R. (2003). Inhibition of histone deacetylase activity by butyrate. J Nutr 133(7 Suppl): 2485S-2493S.
Davies, A., A. Greene, E. Lullau and W. M. Abbott (2005). Optimisation and evaluation of a high-throughput mammalian protein expression system. Protein Expr Purif 42(1): 111-121.
Dietmair, S., M. P. Hodson, L.-E. Quek, N. E. Timmins, P. Chrysanthopoulos, S. S. Jacob, P. Gray and L. K. Nielsen (2012). Metabolite profiling of CHO cells with different growth characteristics. Biotechnology and Bioengineering 109(6): 1404-1414.
Dollins, D. E., J. J. Warren, R. M. Immormino and D. T. Gewirth (2007). Structures of GRP94-Nucleotide Complexes Reveal Mechanistic Differences between the hsp90 Chaperones. Molecular Cell 28(1): 41-56.
Durocher, Y. and M. Loignon (2011). Process, Vectors and Engineered Cell Lines for Enhanced Large-Scale Transfection. US 2011/0039339 A1.
Durocher, Y., S. Perret and A. Kamen (2002). High-level and high-throughput recombinant protein production by transient transfection of suspension-growing human 293-EBNA1 cells. Nucleic Acids Research 30(2): e9.
Elbein, A. D., R. Solf, P. R. Dorling and K. Vosbeck (1981). Swainsonine: An inhibitor of glycoprotein processing. Proceedings of the National Academy of Sciences 78(12): 7393-7397.
Elbein, A. D., J. E. Tropea, M. Mitchell and G. P. Kaushal (1990). Kifunensine, a potent inhibitor of the glycoprotein processing mannosidase I. Journal of Biological Chemistry 265(26): 15599-15605.
Estes, S. and M. Melville (2014). Mammalian cell line developments in speed and efficiency. Adv Biochem Eng Biotechnol 139: 11-33.
Fernandes, F., J. Vidigal, M. M. Dias, K. L. Prather, A. S. Coroadinha, A. P. Teixeira and P. M. Alves (2012). Flipase-mediated cassette exchange in Sf9 insect cells for stable gene expression. Biotechnol Bioeng 109(11): 2836-2844.
Fitzgerald, D. J., C. Schaffitzel, P. Berger, R. Wellinger, C. Bieniossek, Timothy J. Richmond and I. Berger (2007). Multiprotein Expression Strategy for Structural Biology of Eukaryotic Complexes. Structure 15(3): 275-279.

BIBLIOGRAPHY
133
Frank, S. A. (2004). Genetic predisposition to cancer [mdash] insights from population genetics. Nat Rev Genet 5(10): 764-772.
Freeze, H. H. (2006). Genetic defects in the human glycome. Nat Rev Genet 7(7): 537-551.
Fukushige, S. and B. Sauer (1992). Genomic targeting with a positive-selection lox integration vector allows highly reproducible gene expression in mammalian cells. Proceedings of the National Academy of Sciences 89(17): 7905-7909.
Furrie, E., S. Macfarlane, G. Thomson, G. T. Macfarlane, Microbiology, T. T. Gut Biology Group and B. Tumour (2005). Toll-like receptors-2, -3 and -4 expression patterns on human colon and their regulation by mucosal-associated bacteria. Immunology 115(4): 565-574.
Gaj, T., C. A. Gersbach and C. F. Barbas, 3rd (2013). ZFN, TALEN, and CRISPR/Cas-based methods for genome engineering. Trends Biotechnol 31(7): 397-405.
Geisse, S. and M. Henke (2005). Large-scale transient transfection of mammalian cells: a newly emerging attractive option for recombinant protein production. J Struct Funct Genomics 6(2-3): 165-170.
Ghosh, K. and G. D. Van Duyne (2002). Cre-loxP biochemistry. Methods 28(3): 374-383.
Goeddel, D. V., D. G. Kleid, F. Bolivar, H. L. Heyneker, D. G. Yansura, R. Crea, T. Hirose, A. Kraszewski, K. Itakura and A. D. Riggs (1979). Expression in Escherichia coli of chemically synthesized genes for human insulin. Proceedings of the National Academy of Sciences 76(1): 106-110.
Goepfert, U. and E. Kopetzki (2010). Protein Expression in Rodent Cells. US 2010/0021965 A1.
Gomord, V. and L. Faye (2004). Posttranslational modification of therapeutic proteins in plants. Curr Opin Plant Biol 7(2): 171-181.
Graham, F. L., J. Smiley, W. C. Russell and R. Nairn (1977). Characteristics of a Human Cell Line Transformed by DNA from Human Adenovirus Type 5. Journal of General Virology 36(1): 59-72.
Halff, E. F., M. Versteeg, T. H. Brondijk and E. G. Huizinga (2014). When less becomes more: optimization of protein expression in HEK293-EBNA1 cells using plasmid titration - a case study for NLRs. Protein Expr Purif 99: 27-34.
Han, K. P., X. Zhu, B. Liu, E. Jeng, L. Kong, J. L. Yovandich, V. V. Vyas, W. D. Marcus, P. A. Chavaillaz, C. A. Romero, P. R. Rhode and H. C. Wong (2011). IL-15:IL-15 receptor alpha superagonist complex: high-level co-expression in recombinant mammalian cells, purification and characterization. Cytokine 56(3): 804-810.
Hart, B. E. and R. I. Tapping (2012). Cell surface trafficking of TLR1 is differentially regulated by the ER chaperones PRAT4A and PRAT4B. Journal of Biological Chemistry.
BIBLIOGRAPHY
134
Hayashi, F., K. D. Smith, A. Ozinsky, T. R. Hawn, E. C. Yi, D. R. Goodlett, J. K. Eng, S. Akira, D. M. Underhill and A. Aderem (2001). The innate immune response to bacterial flagellin is mediated by Toll-like receptor 5. Nature 410(6832): 1099-1103.
He, R. L., J. Zhou, C. Z. Hanson, J. Chen, N. Cheng and R. D. Ye (2009). Serum amyloid A induces G-CSF expression and neutrophilia via Toll-like receptor 2. Blood 113(2): 429-437.
Heim, R., D. C. Prasher and R. Y. Tsien (1994). Wavelength mutations and posttranslational autoxidation of green fluorescent protein. Proc Natl Acad Sci U S A 91(26): 12501-12504.
Heim, R. and R. Y. Tsien (1996). Engineering green fluorescent protein for improved brightness, longer wavelengths and fluorescence resonance energy transfer. Curr Biol 6(2): 178-182.
Hidmark, A., A. von Saint Paul and A. H. Dalpke (2012). Cutting edge: TLR13 is a receptor for bacterial RNA. J Immunol 189(6): 2717-2721.
Hirano, N., T. Muroi, H. Takahashi and M. Haruki (2011). Site-specific recombinases as tools for heterologous gene integration. Applied Microbiology and Biotechnology 92(2): 227-239.
Hong, M., S.-i. Yoon and I. A. Wilson (2012). Recombinant expression of TLR5 proteins by ligand supplementation and a leucine-rich repeat hybrid technique. Biochemical and Biophysical Research Communications 427(1): 119-124.
Huang, L. C., E. A. Wood and M. M. Cox (1997). Convenient and reversible site-specific targeting of exogenous DNA into a bacterial chromosome by use of the FLP recombinase: the FLIRT system. J Bacteriol 179(19): 6076-6083.
Hudson, P. J. and C. Souriau (2003). Engineered antibodies. Nat Med 9(1): 129-134.
Invitrogen (2010). Flp-InTM System For Generating Stable Mammalian Expression Cell Lines by Flp Recombinase -Mediated Integration. (Version E).
InvivoGen (2014). "Low-CpG Pac." Retrieved 08.09.2014, from http://www.invivogen.com/pmod2-puro.
Ishii, K. J., C. Coban and S. Akira (2005). Manifold mechanisms of Toll-like receptor-ligand recognition. J Clin Immunol 25(6): 511-521.
Ishiyama, S. and M. Ikeda (2010). High-level expression and improved folding of proteins by using the vp39 late promoter enhanced with homologous DNA regions. Biotechnol Lett 32(11): 1637-1647.
Ivics, Z. and Z. Izsvák (2010). The expanding universe of transposon technologies for gene and cell engineering. Mobile DNA 1(1): 1-15.
Jacchieri, S. G., R. Torquato and R. R. Brentani (2003). Structural study of binding of flagellin by Toll-like receptor 5. J Bacteriol 185(14): 4243-4247.
Jana, M., C. A. Palencia and K. Pahan (2008). Fibrillar amyloid-beta peptides activate microglia via TLR2: implications for Alzheimer's disease. J Immunol 181(10): 7254-7262.

BIBLIOGRAPHY
135
Jin, M. S., S. E. Kim, J. Y. Heo, M. E. Lee, H. M. Kim, S.-G. Paik, H. Lee and J.-O. Lee (2007). Crystal Structure of the TLR1-TLR2 Heterodimer Induced by Binding of a Tri-Acylated Lipopeptide. Cell 130(6): 1071-1082.
Jin, M. S. and J. O. Lee (2008). Application of hybrid LRR technique to protein crystallization. BMB Rep 41(5): 353-357.
Jin, M. S. and J. O. Lee (2008). Structures of the toll-like receptor family and its ligand complexes. Immunity 29(2): 182-191.
Johnson, J. L., M. B. Jones, S. O. Ryan and B. A. Cobb (2013). The regulatory power of glycans and their binding partners in immunity. Trends in Immunology 34(6): 290-298.
Kang, J. Y., X. Nan, M. S. Jin, S.-J. Youn, Y. H. Ryu, S. Mah, S. H. Han, H. Lee, S.-G. Paik and J.-O. Lee (2009). Recognition of Lipopeptide Patterns by Toll-like Receptor 2-Toll-like Receptor 6 Heterodimer. Immunity 31(6): 873-884.
Kao, F. T. and T. T. Puck (1968). Genetics of somatic mammalian cells, VII. Induction and isolation of nutritional mutants in Chinese hamster cells. Proc Natl Acad Sci U S A 60(4): 1275-1281.
Kasamatsu, J., Y. Sutoh, K. Fugo, N. Otsuka, K. Iwabuchi and M. Kasahara (2010). Identification of a third variable lymphocyte receptor in the lamprey. Proceedings of the National Academy of Sciences 107(32): 14304-14308.
Kaufman, R. J., L. C. Wasley, A. J. Spiliotes, S. D. Gossels, S. A. Latt, G. R. Larsen and R. M. Kay (1985). Coamplification and coexpression of human tissue-type plasminogen activator and murine dihydrofolate reductase sequences in Chinese hamster ovary cells. Mol Cell Biol 5(7): 1750-1759.
Kaufman, W. L., I. Kocman, V. Agrawal, H.-P. Rahn, D. Besser and M. Gossen (2008). Homogeneity and persistence of transgene expression by omitting antibiotic selection in cell line isolation. Nucleic Acids Research 36(17): e111.
Kazantsev, A. G. and L. M. Thompson (2008). Therapeutic application of histone deacetylase inhibitors for central nervous system disorders. Nat Rev Drug Discov 7(10): 854-868.
Keestra, A. M., M. R. de Zoete, R. A. M. H. van Aubel and J. P. M. van Putten (2008). Functional characterization of chicken TLR5 reveals species-specific recognition of flagellin. Molecular Immunology 45(5): 1298-1307.
Kendrew, J. C., G. Bodo, H. M. Dintzis, R. G. Parrish, H. Wyckoff and D. C. Phillips (1958). A three-dimensional model of the myoglobin molecule obtained by x-ray analysis. Nature 181(4610): 662-666.
Kerrigan, J. J., Q. Xie, R. S. Ames and Q. Lu (2011). Production of protein complexes via co-expression. Protein Expression and Purification 75(1): 1-14.
BIBLIOGRAPHY
136
Kim, H. M., S. C. Oh, K. J. Lim, J. Kasamatsu, J. Y. Heo, B. S. Park, H. Lee, O. J. Yoo, M. Kasahara and J. O. Lee (2007). Structural diversity of the hagfish variable lymphocyte receptors. J Biol Chem 282(9): 6726-6732.
Kim, H. M., B. S. Park, J.-I. Kim, S. E. Kim, J. Lee, S. C. Oh, P. Enkhbayar, N. Matsushima, H. Lee, O. J. Yoo and J.-O. Lee (2007). Crystal Structure of the TLR4-MD-2 Complex with Bound Endotoxin Antagonist Eritoran. Cell 130(5): 906-917.
Kim, N. S., S. J. Kim and G. M. Lee (1998). Clonal variability within dihydrofolate reductase-mediated gene amplified Chinese hamster ovary cells: stability in the absence of selective pressure. Biotechnol Bioeng 60(6): 679-688.
Kiyokawa, T., S. Akashi-Takamura, T. Shibata, F. Matsumoto, C. Nishitani, Y. Kuroki, Y. Seto and K. Miyake (2008). A single base mutation in the PRAT4A gene reveals differential interaction of PRAT4A with Toll-like receptors. International Immunology 20(11): 1407-1415.
Kokatla, H. P., D. Sil, H. Tanji, U. Ohto, S. S. Malladi, L. M. Fox, T. Shimizu and S. A. David (2014). Structure-based design of novel human Toll-like receptor 8 agonists. ChemMedChem 9(4): 719-723.
Konno, K., Y. Wakabayashi, S. Akashi-Takamura, T. Ishii, M. Kobayashi, K. Takahashi, Y. Kusumoto, S.-i. Saitoh, Y. Yoshizawa and K. Miyake (2006). A molecule that is associated with Toll-like receptor 4 and regulates its cell surface expression. Biochemical and Biophysical Research Communications 339(4): 1076-1082.
Kranz, A., J. Fu, K. Duerschke, S. Weidlich, R. Naumann, A. F. Stewart and K. Anastassiadis (2010). An improved Flp deleter mouse in C57Bl/6 based on Flpo recombinase. genesis 48(8): 512-520.
Kriz, A., K. Schmid, N. Baumgartner, U. Ziegler, I. Berger, K. Ballmer-Hofer and P. Berger (2010). A plasmid-based multigene expression system for mammalian cells. Nat Commun 1(8): 120.
Kunaparaju, R., M. Liao and N.-A. Sunstrom (2005). Epi-CHO, an episomal expression system for recombinant protein production in CHO cells. Biotechnology and Bioengineering 91(6): 670-677.
Kyhse-Andersen, J. (1984). Electroblotting of multiple gels: a simple apparatus without buffer tank for rapid transfer of proteins from polyacrylamide to nitrocellulose. J Biochem Biophys Methods 10(3-4): 203-209.
Laemmli, U. K., F. Beguin and G. Gujer-Kellenberger (1970). A factor preventing the major head protein of bacteriophage T4 from random aggregation. J Mol Biol 47(1): 69-85.
Lauth, M., F. Spreafico, K. Dethleffsen and M. Meyer (2002). Stable and efficient cassette exchange under non-selectable conditions by combined use of two site-specific recombinases. Nucleic Acids Res 30(21): e115.
Lebkowski, J. S., S. Clancy and M. P. Calos (1985). Simian virus 40 replication in adenovirus-transformed human cells antagonizes gene expression. Nature 317(6033): 169-171.

BIBLIOGRAPHY
137
Lee, J. E., M. L. Fusco and E. O. Saphire (2009). An efficient platform for screening expression and crystallization of glycoproteins produced in human cells. Nat Protoc 4(4): 592-604.
Lehmann, J., G. W. Piehl and R. Schulz (1987). Bubble free cell culture aeration with porous moving membranes. Dev Biol Stand 66: 227-240.
Letran, S. E., S.-J. Lee, S. M. Atif, S. Uematsu, S. Akira and S. J. McSorley (2011). TLR5 functions as an endocytic receptor to enhance flagellin-specific adaptive immunity. European Journal of Immunology 41(1): 29-38.
Lewis, N. E., X. Liu, Y. Li, H. Nagarajan, G. Yerganian, E. O'Brien, A. Bordbar, A. M. Roth, J. Rosenbloom, C. Bian, M. Xie, W. Chen, N. Li, D. Baycin-Hizal, H. Latif, J. Forster, M. J. Betenbaugh, I. Famili, X. Xu, J. Wang and B. O. Palsson (2013). Genomic landscapes of Chinese hamster ovary cell lines as revealed by the Cricetulus griseus draft genome. Nat Biotech 31(8): 759-765.
Li, Z., I. P. Michael, D. Zhou, A. Nagy and J. M. Rini (2013). Simple piggyBac transposon-based mammalian cell expression system for inducible protein production. Proc Natl Acad Sci U S A 110(13): 5004-5009.
Liew, F. Y., D. Xu, E. K. Brint and L. A. J. O'Neill (2005). Negative regulation of Toll-like receptor-mediated immune responses. Nat Rev Immunol 5(6): 446-458.
Liu, B., Y. Yang, Z. Qiu, M. Staron, F. Hong, Y. Li, S. Wu, Y. Li, B. Hao, R. Bona, D. Han and Z. Li (2010). Folding of Toll-like receptors by the HSP90 paralogue gp96 requires a substrate-specific cochaperone. Nat Commun 1: 79.
Liu, L., I. Botos, Y. Wang, J. N. Leonard, J. Shiloach, D. M. Segal and D. R. Davies (2008). Structural basis of toll-like receptor 3 signaling with double-stranded RNA. Science 320(5874): 379-381.
Liu, S., Y. Liu, W. Hao, L. Wolf, A. J. Kiliaan, B. Penke, C. E. Rube, J. Walter, M. T. Heneka, T. Hartmann, M. D. Menger and K. Fassbender (2012). TLR2 is a primary receptor for Alzheimer's amyloid beta peptide to trigger neuroinflammatory activation. J Immunol 188(3): 1098-1107.
Liu, W., Y. Xiong and M. Gossen (2006). Stability and homogeneity of transgene expression in isogenic cells. Journal of Molecular Medicine 84(1): 57-64.
Luo, J., G. Obmolova, T. J. Malia, S.-J. Wu, K. E. Duffy, J. D. Marion, J. K. Bell, P. Ge, Z. H. Zhou, A. Teplyakov, Y. Zhao, R. J. Lamb, J. L. Jordan, L. R. San Mateo, R. W. Sweet and G. L. Gilliland (2012). Lateral Clustering of TLR3:dsRNA Signaling Units Revealed by TLR3ecd:3Fabs Quaternary Structure. Journal of Molecular Biology 421(1): 112-124.
Malhotra, A. (2009). Chapter 16 Tagging for Protein Expression. Methods Enzymol. R. B. Richard and P. D. Murray, Academic Press. Volume 463: 239-258.
Mancia, F., S. D. Patel, M. W. Rajala, P. E. Scherer, A. Nemes, I. Schieren, W. A. Hendrickson and L. Shapiro (2004). Optimization of Protein Production in Mammalian Cells with a Coexpressed Fluorescent Marker. Structure 12(8): 1355-1360.

BIBLIOGRAPHY
138
Matz, M. V., A. F. Fradkov, Y. A. Labas, A. P. Savitsky, A. G. Zaraisky, M. L. Markelov and S. A. Lukyanov (1999). Fluorescent proteins from nonbioluminescent Anthozoa species. Nat Biotechnol 17(10): 969-973.
Mayrhofer, P., B. Kratzer, W. Sommeregger, W. Steinfellner, D. Reinhart, A. Mader, S. Turan, J. Qiao, J. Bode and R. Kunert (2014). Accurate comparison of antibody expression levels by reproducible transgene targeting in engineered recombination-competent CHO cells. Appl Microbiol Biotechnol.
McLeod, M., S. Craft and J. R. Broach (1986). Identification of the crossover site during FLP-mediated recombination in the Saccharomyces cerevisiae plasmid 2 microns circle. Molecular and Cellular Biology 6(10): 3357-3367.
Meissner, P., H. Pick, A. Kulangara, P. Chatellard, K. Friedrich and F. M. Wurm (2001). Transient gene expression: Recombinant protein production with suspension-adapted HEK293-EBNA cells. Biotechnology and Bioengineering 75(2): 197-203.
Metcalfe, H. J., R. M. La Ragione, D. G. E. Smith and D. Werling (2014). Functional characterisation of bovine TLR5 indicates species-specific recognition of flagellin. Veterinary Immunology and Immunopathology 157(3–4): 197-205.
Meyer, S. (2012). Development of an integrated expression platform for protein production in eukaryotic hosts, Technischen Universität Carolo-Wilhelmina zu Braunschweig.
Meyer, S., C. Lorenz, B. Baser, M. Wördehoff, V. Jäger and J. van den Heuvel (2013). Multi-Host Expression System for Recombinant Production of Challenging Proteins. PLoS ONE 8(7): e68674.
Miller, L. S., O. E. Sørensen, P. T. Liu, H. R. Jalian, D. Eshtiaghpour, B. E. Behmanesh, W. Chung, T. D. Starner, J. Kim, P. A. Sieling, T. Ganz and R. L. Modlin (2005). TGF-α Regulates TLR Expression and Function on Epidermal Keratinocytes. The Journal of Immunology 174(10): 6137-6143.
Mizel, S. B., A. P. West and R. R. Hantgan (2003). Identification of a sequence in human toll-like receptor 5 required for the binding of Gram-negative flagellin. J Biol Chem 278(26): 23624-23629.
Muirhead, H. and M. F. Perutz (1963). STRUCTURE OF HAEMOGLOBIN. A THREE-DIMENSIONAL FOURIER SYNTHESIS OF REDUCED HUMAN HAEMOGLOBIN AT 5-5 A RESOLUTION. Nature 199: 633-638.
Muzio, M., D. Bosisio, N. Polentarutti, G. D’amico, A. Stoppacciaro, R. Mancinelli, C. van’t Veer, G. Penton-Rol, L. P. Ruco, P. Allavena and A. Mantovani (2000). Differential Expression and Regulation of Toll-Like Receptors (TLR) in Human Leukocytes: Selective Expression of TLR3 in Dendritic Cells. The Journal of Immunology 164(11): 5998-6004.
Nehlsen, K., R. Schucht, L. da Gama-Norton, W. Kromer, A. Baer, A. Cayli, H. Hauser and D. Wirth (2009). Recombinant protein expression by targeting pre-selected chromosomal loci. BMC Biotechnol 9(1): 100.
BIBLIOGRAPHY
139
Nettleship, J. E., R. Assenberg, J. M. Diprose, N. Rahman-Huq and R. J. Owens (2010). Recent advances in the production of proteins in insect and mammalian cells for structural biology. Journal of Structural Biology 172(1): 55-65.
Neuhaus, E. M., A. Mashukova, W. Zhang, J. Barbour and H. Hatt (2006). A specific heat shock protein enhances the expression of mammalian olfactory receptor proteins. Chem Senses 31(5): 445-452.
Nomura, N., N. Miyajima, T. Sazuka, A. Tanaka, Y. Kawarabayasi, S. Sato, T. Nagase, N. Seki, K.-i. Ishikawa and S. Tabata (1994). Prediction of the Coding Sequences of Unidentified Human Genes. I. The Coding Sequences of 40 New Genes (KIAA0001-KIAA0040) Deduced by Analysis of Randomly Sampled cDNA Clones from Human Immature Myeloid Cell Line KG-1. DNA Research 1(1): 27-35.
North, S. J., H. H. Huang, S. Sundaram, J. Jang-Lee, A. T. Etienne, A. Trollope, S. Chalabi, A. Dell, P. Stanley and S. M. Haslam (2010). Glycomics profiling of Chinese hamster ovary cell glycosylation mutants reveals N-glycans of a novel size and complexity. J Biol Chem 285(8): 5759-5775.
O'Gorman, S., D. Fox and G. Wahl (1991). Recombinase-mediated gene activation and site-specific integration in mammalian cells. Science 251(4999): 1351-1355.
O'Neill, L. A. J. and A. G. Bowie (2007). The family of five: TIR-domain-containing adaptors in Toll-like receptor signalling. Nat Rev Immunol 7(5): 353-364.
Ohto, U., K. Fukase, K. Miyake and T. Shimizu (2012). Structural basis of species-specific endotoxin sensing by innate immune receptor TLR4/MD-2. Proc Natl Acad Sci U S A 109(19): 7421-7426.
Ohto, U., N. Yamakawa, S. Akashi-Takamura, K. Miyake and T. Shimizu (2012). Structural Analyses of Human Toll-like Receptor 4 Polymorphisms D299G and T399I. Journal of Biological Chemistry 287(48): 40611-40617.
Oppong, G. O., G. J. Rapsinski, T. N. Newman, J. H. Nishimori, S. G. Biesecker and C. Tukel (2013). Epithelial cells augment barrier function via activation of the Toll-like receptor 2/phosphatidylinositol 3-kinase pathway upon recognition of Salmonella enterica serovar Typhimurium curli fibrils in the gut. Infect Immun 81(2): 478-486.
Oumard, A., J. Qiao, T. Jostock, J. Li and J. Bode (2006). Recommended Method for Chromosome Exploitation: RMCE-based Cassette-exchange Systems in Animal Cell Biotechnology. Cytotechnology 50(1): 93-108.
Pancer, Z., C. T. Amemiya, G. R. Ehrhardt, J. Ceitlin, G. L. Gartland and M. D. Cooper (2004). Somatic diversification of variable lymphocyte receptors in the agnathan sea lamprey. Nature 430(6996): 174-180.
Pancer, Z., N. R. Saha, J. Kasamatsu, T. Suzuki, C. T. Amemiya, M. Kasahara and M. D. Cooper (2005). Variable lymphocyte receptors in hagfish. Proceedings of the National Academy of Sciences of the United States of America 102(26): 9224-9229.
BIBLIOGRAPHY
140
Park, B. S., D. H. Song, H. M. Kim, B. S. Choi, H. Lee and J. O. Lee (2009). The structural basis of lipopolysaccharide recognition by the TLR4-MD-2 complex. Nature 458(7242): 1191-1195.
Pegu, A., S. Qin, B. A. Fallert Junecko, R. E. Nisato, M. S. Pepper and T. A. Reinhart (2008). Human Lymphatic Endothelial Cells Express Multiple Functional TLRs. The Journal of Immunology 180(5): 3399-3405.
Pilbrough, W., T. P. Munro and P. Gray (2009). Intraclonal protein expression heterogeneity in recombinant CHO cells. PLoS ONE 4(12): e8432.
Prasher, D. C., V. K. Eckenrode, W. W. Ward, F. G. Prendergast and M. J. Cormier (1992). Primary structure of the Aequorea victoria green-fluorescent protein. Gene 111(2): 229-233.
Puck, T. T., S. J. Cieciura and A. Robinson (1958). Genetics of somatic mammalian cells. III. Long-term cultivation of euploid cells from human and animal subjects. J Exp Med 108(6): 945-956.
Qiao, J., A. Oumard, W. Wegloehner and J. Bode (2009). Novel Tag-and-Exchange (RMCE) Strategies Generate Master Cell Clones with Predictable and Stable Transgene Expression Properties. Journal of Molecular Biology 390(4): 579-594.
Raetz, M., A. Kibardin, C. R. Sturge, R. Pifer, H. Li, E. Burstein, K. Ozato, S. Larin and F. Yarovinsky (2013). Cooperation of TLR12 and TLR11 in the IRF8-dependent IL-12 response to Toxoplasma gondii profilin. J Immunol 191(9): 4818-4827.
Randow, F. and B. Seed (2001). Endoplasmic reticulum chaperone gp96 is required for innate immunity but not cell viability. Nat Cell Biol 3(10): 891-896.
Rapsinski, G. J., T. N. Newman, G. O. Oppong, J. P. van Putten and C. Tukel (2013). CD14 protein acts as an adaptor molecule for the immune recognition of Salmonella curli fibers. J Biol Chem 288(20): 14178-14188.
Raymond, C. S. and P. Soriano (2007). High-Efficiency FLP and ΦC31 Site-Specific Recombination in Mammalian Cells. PLoS ONE 2(1): e162.
Reed-Geaghan, E. G., J. C. Savage, A. G. Hise and G. E. Landreth (2009). CD14 and toll-like receptors 2 and 4 are required for fibrillar A{beta}-stimulated microglial activation. J Neurosci 29(38): 11982-11992.
Reeves, P. J., N. Callewaert, R. Contreras and H. G. Khorana (2002). Structure and function in rhodopsin: High-level expression of rhodopsin with restricted and homogeneous N-glycosylation by a tetracycline-inducible N-acetylglucosaminyltransferase I-negative HEK293S stable mammalian cell line. Proceedings of the National Academy of Sciences of the United States of America 99(21): 13419-13424.
Rehberger, B., C. Wodarczyk, B. Reichenbacher, J. Kohler, R. Weber and D. Muller (2013). Accelerating stable recombinant cell line development by targeted integration. BMC Proceedings 7(Suppl 6): P111.

BIBLIOGRAPHY
141
Reid, David W., Q. Chen, Angeline S. L. Tay, S. Shenolikar and Christopher V. Nicchitta (2014). The Unfolded Protein Response Triggers Selective mRNA Release from the Endoplasmic Reticulum. Cell 158(6): 1362-1374.
Rock, F. L., G. Hardiman, J. C. Timans, R. A. Kastelein and J. F. Bazan (1998). A family of human receptors structurally related to Drosophila Toll. Proc Natl Acad Sci U S A 95(2): 588-593.
Romier, C., M. Ben Jelloul, S. Albeck, G. Buchwald, D. Busso, P. H. Celie, E. Christodoulou, V. De Marco, S. van Gerwen, P. Knipscheer, J. H. Lebbink, V. Notenboom, A. Poterszman, N. Rochel, S. X. Cohen, T. Unger, J. L. Sussman, D. Moras, T. K. Sixma and A. Perrakis (2006). Co-expression of protein complexes in prokaryotic and eukaryotic hosts: experimental procedures, database tracking and case studies. Acta Crystallogr D Biol Crystallogr 62(Pt 10): 1232-1242.
Sambrook, J. and D. W. Russell (2001). Molecular Cloning: A Laboratory Manual, Cold Spring Harbor Laboratory Press.
Sander, J. D. and J. K. Joung (2014). CRISPR-Cas systems for editing, regulating and targeting genomes. Nat Biotech 32(4): 347-355.
Sanger, F. (1949). The terminal peptides of insulin. Biochem J 45(5): 563-574.
Schlaeger, E.-J. and K. Christensen (1999). Transient gene expression in mammalian cells grown in serum-free suspension culture. Cytotechnology 30(1-3): 71-83.
Schlake, T. and J. Bode (1994). Use of Mutant FLP TRecognition Target (FRT) Sites for the Exchange of Expression Cassettes at Defined Chromosomal Loci. Biochemistry 33(43): 12746-12751.
Schlatter, S., S. H. Stansfield, D. M. Dinnis, A. J. Racher, J. R. Birch and D. C. James (2005). On the optimal ratio of heavy to light chain genes for efficient recombinant antibody production by CHO cells. Biotechnol Prog 21(1): 122-133.
Schnütgen, F., S. De-Zolt, P. Van Sloun, M. Hollatz, T. Floss, J. Hansen, J. Altschmied, C. Seisenberger, N. B. Ghyselinck, P. Ruiz, P. Chambon, W. Wurst and H. von Melchner (2005). Genomewide production of multipurpose alleles for the functional analysis of the mouse genome. Proceedings of the National Academy of Sciences of the United States of America 102(20): 7221-7226.
Schnütgen, F., N. Doerflinger, C. Calleja, O. Wendling, P. Chambon and N. B. Ghyselinck (2003). A directional strategy for monitoring Cre-mediated recombination at the cellular level in the mouse. Nat Biotechnol 21(5): 562-565.
Seibler, J., D. Schubeler, S. Fiering, M. Groudine and J. Bode (1998). DNA cassette exchange in ES cells mediated by Flp recombinase: an efficient strategy for repeated modification of tagged loci by marker-free constructs. Biochemistry 37(18): 6229-6234.
Shaner, N. C., R. E. Campbell, P. A. Steinbach, B. N. Giepmans, A. E. Palmer and R. Y. Tsien (2004). Improved monomeric red, orange and yellow fluorescent proteins derived from Discosoma sp. red fluorescent protein. Nat Biotechnol 22(12): 1567-1572.
BIBLIOGRAPHY
142
Shi, S., R. G. Condon, L. Deng, J. Saunders, F. Hung, Y. S. Tsao and Z. Liu (2011). A high-throughput automated platform for the development of manufacturing cell lines for protein therapeutics. J Vis Exp(55).
Shibata, T., N. Takemura, Y. Motoi, Y. Goto, T. Karuppuchamy, K. Izawa, X. Li, S. Akashi-Takamura, N. Tanimura, J. Kunisawa, H. Kiyono, S. Akira, T. Kitamura, J. Kitaura, S. Uematsu and K. Miyake (2012). PRAT4A-dependent expression of cell surface TLR5 on neutrophils, classical monocytes and dendritic cells. International Immunology 24(10): 613-623.
Shimomura, O., F. H. Johnson and Y. Saiga (1962). Extraction, purification and properties of aequorin, a bioluminescent protein from the luminous hydromedusan, Aequorea. J Cell Comp Physiol 59: 223-239.
Smith, K. D., E. Andersen-Nissen, F. Hayashi, K. Strobe, M. A. Bergman, S. L. Barrett, B. T. Cookson and A. Aderem (2003). Toll-like receptor 5 recognizes a conserved site on flagellin required for protofilament formation and bacterial motility. Nat Immunol 4(12): 1247-1253.
Southern, P. J. and P. Berg (1982). Transformation of mammalian cells to antibiotic resistance with a bacterial gene under control of the SV40 early region promoter. J Mol Appl Genet 1(4): 327-341.
Stanley, P. (1989). Chinese hamster ovary cell mutants with multiple glycosylation defects for production of glycoproteins with minimal carbohydrate heterogeneity. Molecular and Cellular Biology 9(2): 377-383.
Taguchi, T., J. L. Mitcham, S. K. Dower, J. E. Sims and J. R. Testa (1996). Chromosomal Localization ofTIL,a Gene Encoding a Protein Related to theDrosophilaTransmembrane Receptor Toll, to Human Chromosome 4p14. Genomics 32(3): 486-488.
Takahashi, K., T. Shibata, S. Akashi-Takamura, T. Kiyokawa, Y. Wakabayashi, N. Tanimura, T. Kobayashi, F. Matsumoto, R. Fukui, T. Kouro, Y. Nagai, K. Takatsu, S.-i. Saitoh and K. Miyake (2007). A protein associated with Toll-like receptor (TLR) 4 (PRAT4A) is required for TLR-dependent immune responses. The Journal of Experimental Medicine 204(12): 2963-2976.
Tang, D., R. Kang, C. B. Coyne, H. J. Zeh and M. T. Lotze (2012). PAMPs and DAMPs: signal 0s that spur autophagy and immunity. Immunological Reviews 249(1): 158-175.
Tanji, H., U. Ohto, T. Shibata, K. Miyake and T. Shimizu (2013). Structural reorganization of the Toll-like receptor 8 dimer induced by agonistic ligands. Science 339(6126): 1426-1429.
Tep, S., M. Hincapie and W. S. Hancock (2012). The characterization and quantitation of glycomic changes in CHO cells during a bioreactor campaign. Biotechnology and Bioengineering 109(12): 3007-3017.
Trinchieri, G. and A. Sher (2007). Cooperation of Toll-like receptor signals in innate immune defence. Nat Rev Immunol 7(3): 179-190.
Tükel, Ç., J. H. Nishimori, R. P. Wilson, M. G. Winter, A. M. Keestra, J. P. M. Van Putten and A. J. Bäumler (2010). Toll-like receptors 1 and 2 cooperatively mediate immune
BIBLIOGRAPHY
143
responses to curli, a common amyloid from enterobacterial biofilms. Cellular Microbiology 12(10): 1495-1505.
Tükel, C., M. Raffatellu, A. D. Humphries, R. P. Wilson, H. L. Andrews-Polymenis, T. Gull, J. F. Figueiredo, M. H. Wong, K. S. Michelsen, M. Akcelik, L. G. Adams and A. J. Baumler (2005). CsgA is a pathogen-associated molecular pattern of Salmonella enterica serotype Typhimurium that is recognized by Toll-like receptor 2. Mol Microbiol 58(1): 289-304.
Tükel, Ç., R. P. Wilson, J. H. Nishimori, M. Pezeshki, B. A. Chromy and A. J. Bäumler (2009). Responses to Amyloids of Microbial and Host Origin Are Mediated through Toll-like Receptor 2. Cell Host & Microbe 6(1): 45-53.
Turan, S. and J. Bode (2011). Site-specific recombinases: from tag-and-target- to tag-and-exchange-based genomic modifications. The FASEB Journal 25(12): 4088-4107.
Turan, S., M. Galla, E. Ernst, J. Qiao, C. Voelkel, B. Schiedlmeier, C. Zehe and J. Bode (2011). Recombinase-Mediated Cassette Exchange (RMCE): Traditional Concepts and Current Challenges. Journal of Molecular Biology 407(2): 193-221.
Turan, S., J. Kuehle, A. Schambach, C. Baum and J. Bode (2010). Multiplexing RMCE: Versatile Extensions of the Flp-Recombinase-Mediated Cassette-Exchange Technology. Journal of Molecular Biology 402(1): 52-69.
Udan, M. L., D. Ajit, N. R. Crouse and M. R. Nichols (2008). Toll-like receptors 2 and 4 mediate Abeta(1-42) activation of the innate immune response in a human monocytic cell line. J Neurochem 104(2): 524-533.
Urlaub, G. and L. A. Chasin (1980). Isolation of Chinese hamster cell mutants deficient in dihydrofolate reductase activity. Proc Natl Acad Sci U S A 77(7): 4216-4220.
Vara, J. A., A. Portela, J. Ortìn and A. Jimènez (1986). Expression in mammalian cells of a gene from Streptomyces alboniger conferring puromycin resistance. Nucleic Acids Research 14(11): 4617-4624.
Villaverde, A. and M. M. Carrio (2003). Protein aggregation in recombinant bacteria: biological role of inclusion bodies. Biotechnol Lett 25(17): 1385-1395.
Wakabayashi, Y., M. Kobayashi, S. Akashi-Takamura, N. Tanimura, K. Konno, K. Takahashi, T. Ishii, T. Mizutani, H. Iba, T. Kouro, S. Takaki, K. Takatsu, Y. Oda, Y. Ishihama, S.-i. Saitoh and K. Miyake (2006). A Protein Associated with Toll-Like Receptor 4 (PRAT4A) Regulates Cell Surface Expression of TLR4. The Journal of Immunology 177(3): 1772-1779.
Waldner, C., O. Rempel, F. Schutte, M. Yanik, N. Solomentsew and G. U. Ryffel (2011). Double conditional human embryonic kidney cell line based on FLP and PhiC31 mediated transgene integration. BMC Res Notes 4: 420.
Walsh, G. and R. Jefferis (2006). Post-translational modifications in the context of therapeutic proteins. Nat Biotech 24(10): 1241-1252.
Weatherall, D. J. (2004). Thalassaemia: the long road from bedside to genome. Nat Rev Genet 5(8): 625-631.

BIBLIOGRAPHY
144
Wilke, S., L. Groebe, V. Maffenbeier, V. Jäger, M. Gossen and e. al. (2011). Streamlining Homogeneous Glycoprotein Production for Biophysical and Structural Applications by Targeted Cell Line Development. PLoS ONE 6(12): e27829. doi:27810.21371/journal.pone.0027829.
Wilke, S., J. Krausze, M. Gossen, L. Groebe, V. Jäger, E. Gherardi, J. van den Heuvel and K. Büssow (2010). Glycoprotein production for structure analysis with stable, glycosylation mutant CHO cell lines established by fluorescence-activated cell sorting. Protein Science 19(6): 1264-1271.
Wu, S., F. Hong, D. Gewirth, B. Guo, B. Liu and Z. Li (2012). The Molecular Chaperone gp96/GRP94 Interacts with Toll-like Receptors and Integrins via Its C-terminal Hydrophobic Domain. Journal of Biological Chemistry 287(9): 6735-6742.
Wurm, F. M. (2004). Production of recombinant protein therapeutics in cultivated mammalian cells. Nat Biotech 22(11): 1393-1398.
Wurm, F. M. and D. Hacker (2011). First CHO genome. Nat Biotechnol 29(8): 718-720.
Xu, X., H. Nagarajan, N. E. Lewis, S. Pan, Z. Cai, X. Liu, W. Chen, M. Xie, W. Wang, S. Hammond, M. R. Andersen, N. Neff, B. Passarelli, W. Koh, H. C. Fan, J. Wang, Y. Gui, K. H. Lee, M. J. Betenbaugh, S. R. Quake, I. Famili, B. O. Palsson and J. Wang (2011). The genomic sequence of the Chinese hamster ovary (CHO)-K1 cell line. Nat Biotech 29(8): 735-741.
Yang, Y., B. Liu, J. Dai, P. K. Srivastava, D. J. Zammit, L. Lefrançois and Z. Li (2006). Heat Shock Protein gp96 Is a Master Chaperone for Toll-like Receptors and Is Important in the Innate Function of Macrophages. Immunity 26(2): 215-226.
Yates, J. L., S. M. Camiolo and J. M. Bashaw (2000). The minimal replicator of Epstein-Barr virus oriP. J Virol 74(10): 4512-4522.
Yoon, S.-i., O. Kurnasov, V. Natarajan, M. Hong, A. V. Gudkov, A. L. Osterman and I. A. Wilson (2012). Structural Basis of TLR5-Flagellin Recognition and Signaling. Science 335(6070): 859-864.
Young, J. M., C. Cheadle, J. S. Foulke Jr, W. N. Drohan and N. Sarver (1988). Utilization of an Epstein-Barr virus replicon as a eukaryotic expression vector. Gene 62(2): 171-185.
Zhao, Y., B. Bishop, J. E. Clay, W. Lu, M. Jones, S. Daenke, C. Siebold, D. I. Stuart, E. Y. Jones and A. R. Aricescu (2011). Automation of large scale transient protein expression in mammalian cells. J Struct Biol 175(2): 209-215.
Zhu, X.-D. and P. D. Sadowski (1995). Cleavage-dependent Ligation by the FLP Recombinase. Journal of Biological Chemistry 270(39): 23044-23054.
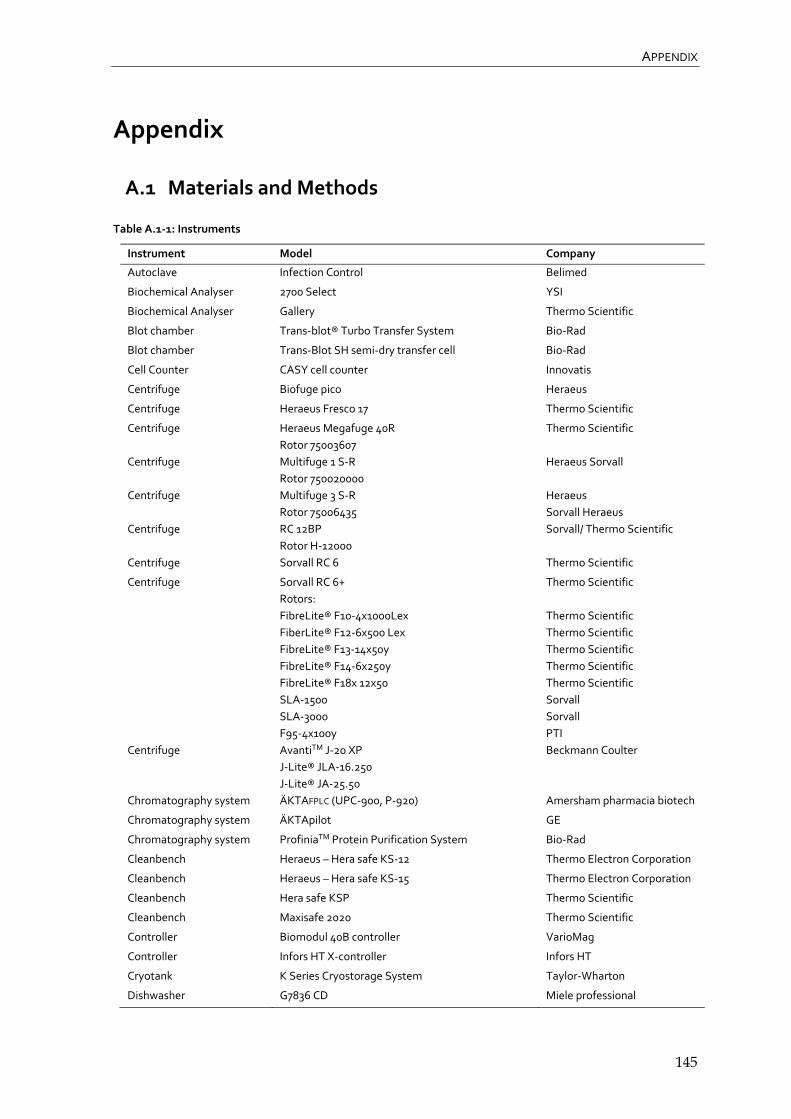
APPENDIX
145
Appendix
A.1 Materials and Methods
Table A.1‐1: Instruments
Instrument Model Company
Autoclave Infection Control Belimed
Biochemical Analyser 2700 Select YSI
Biochemical Analyser Gallery Thermo Scientific
Blot chamber Trans‐blot® Turbo Transfer System Bio‐Rad
Blot chamber Trans‐Blot SH semi‐dry transfer cell Bio‐Rad
Cell Counter CASY cell counter Innovatis
Centrifuge Biofuge pico Heraeus
Centrifuge Heraeus Fresco 17 Thermo Scientific
Centrifuge Heraeus Megafuge 40R
Rotor 75003607
Thermo Scientific
Centrifuge Multifuge 1 S‐R
Rotor 750020000
Heraeus Sorvall
Centrifuge Multifuge 3 S‐R
Rotor 75006435
Heraeus
Sorvall Heraeus
Centrifuge RC 12BP
Rotor H‐12000
Sorvall/ Thermo Scientific
Centrifuge Sorvall RC 6 Thermo Scientific
Centrifuge Sorvall RC 6+
Rotors:
FibreLite® F10‐4x1000Lex
FiberLite® F12‐6x500 Lex
FibreLite® F13‐14x50y
FibreLite® F14‐6x250y
FibreLite® F18x 12x50
SLA‐1500
SLA‐3000
F95‐4x100y
Thermo Scientific
Thermo Scientific
Thermo Scientific
Thermo Scientific
Thermo Scientific
Thermo Scientific
Sorvall
Sorvall
PTI
Centrifuge AvantiTM J‐20 XP
J‐Lite® JLA‐16.250
J‐Lite® JA‐25.50
Beckmann Coulter
Chromatography system ÄKTAFPLC (UPC‐900, P‐920) Amersham pharmacia biotech
Chromatography system ÄKTApilot GE
Chromatography system ProfiniaTM Protein Purification System Bio‐Rad
Cleanbench Heraeus – Hera safe KS‐12 Thermo Electron Corporation
Cleanbench Heraeus – Hera safe KS‐15 Thermo Electron Corporation
Cleanbench Hera safe KSP Thermo Scientific
Cleanbench Maxisafe 2020 Thermo Scientific
Controller Biomodul 40B controller VarioMag
Controller Infors HT X‐controller Infors HT
Cryotank K Series Cryostorage System Taylor‐Wharton
Dishwasher G7836 CD Miele professional
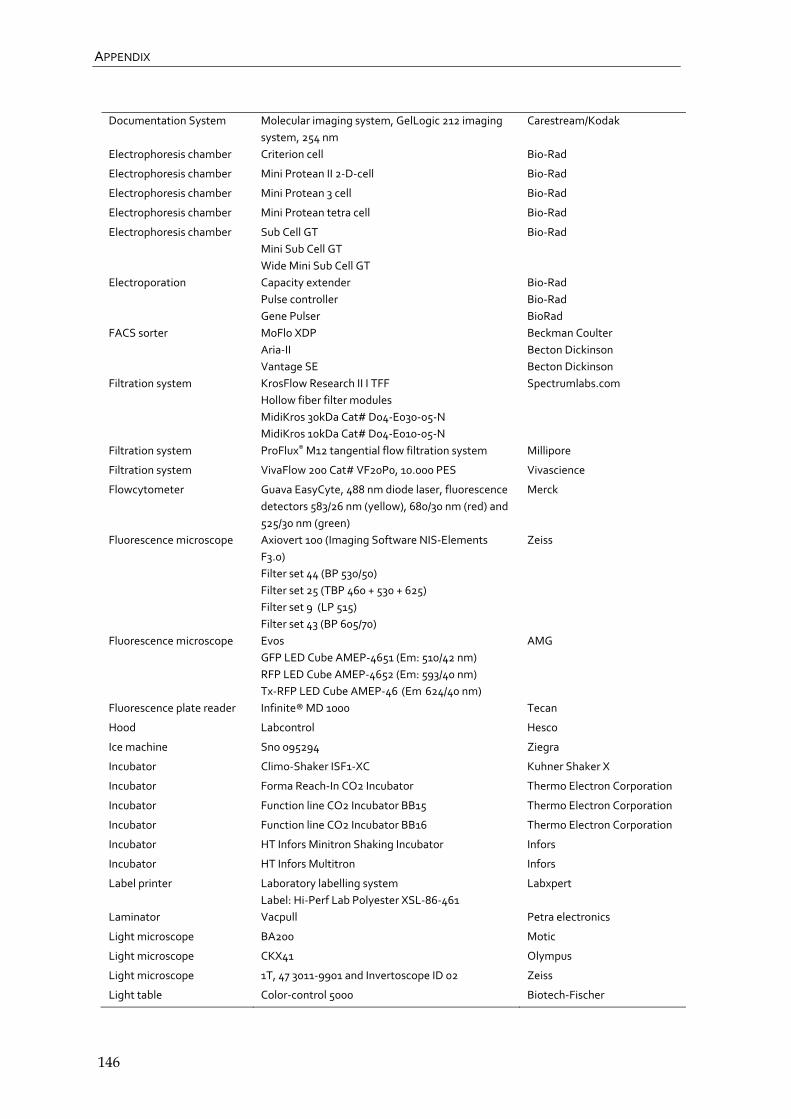
APPENDIX
146
Documentation System Molecular imaging system, GelLogic 212 imaging
system, 254 nm
Carestream/Kodak
Electrophoresis chamber Criterion cell Bio‐Rad
Electrophoresis chamber Mini Protean II 2‐D‐cell Bio‐Rad
Electrophoresis chamber Mini Protean 3 cell Bio‐Rad
Electrophoresis chamber Mini Protean tetra cell Bio‐Rad
Electrophoresis chamber Sub Cell GT
Mini Sub Cell GT
Wide Mini Sub Cell GT
Bio‐Rad
Electroporation Capacity extender
Pulse controller
Gene Pulser
Bio‐Rad
Bio‐Rad
BioRad
FACS sorter MoFlo XDP
Aria‐II
Vantage SE
Beckman Coulter
Becton Dickinson
Becton Dickinson
Filtration system KrosFlow Research II I TFF
Hollow fiber filter modules
MidiKros 30kDa Cat# D04‐E030‐05‐N
MidiKros 10kDa Cat# D04‐E010‐05‐N
Spectrumlabs.com
Filtration system ProFlux® M12 tangential flow filtration system Millipore
Filtration system VivaFlow 200 Cat# VF20P0, 10.000 PES Vivascience
Flowcytometer Guava EasyCyte, 488 nm diode laser, fluorescence
detectors 583/26 nm (yellow), 680/30 nm (red) and
525/30 nm (green)
Merck
Fluorescence microscope Axiovert 100 (Imaging Software NIS‐Elements
F3.0)
Filter set 44 (BP 530/50)
Filter set 25 (TBP 460 + 530 + 625)
Filter set 9 (LP 515)
Filter set 43 (BP 605/70)
Zeiss
Fluorescence microscope Evos
GFP LED Cube AMEP‐4651 (Em: 510/42 nm)
RFP LED Cube AMEP‐4652 (Em: 593/40 nm)
Tx‐RFP LED Cube AMEP‐46 (Em 624/40 nm)
AMG
Fluorescence plate reader Infinite® MD 1000 Tecan
Hood Labcontrol Hesco
Ice machine Sno 095294 Ziegra
Incubator Climo‐Shaker ISF1‐XC Kuhner Shaker X
Incubator Forma Reach‐In CO2 Incubator Thermo Electron Corporation
Incubator Function line CO2 Incubator BB15 Thermo Electron Corporation
Incubator Function line CO2 Incubator BB16 Thermo Electron Corporation
Incubator HT Infors Minitron Shaking Incubator Infors
Incubator HT Infors Multitron Infors
Label printer Laboratory labelling system
Label: Hi‐Perf Lab Polyester XSL‐86‐461
Labxpert
Laminator Vacpull Petra electronics
Light microscope BA200 Motic
Light microscope CKX41 Olympus
Light microscope 1T, 47 3011‐9901 and Invertoscope ID 02 Zeiss
Light table Color‐control 5000 Biotech‐Fischer

APPENDIX
147
Luminometer LAS 3000 FujiFilm
Magnetic stirrer Electronicrührer Biosystem, Biosystem B, Mobil 60
and Monotherm
VarioMag
Magnetic stirrer VarioMag Mono Thermo Scientific
Magnetic stirrer KMO2 basic, RCT basic and Colour squid IKA
Magnetic stirrer RMH Gerhard
Magnetic stirrer MR 2000 Heidolph
Microbioreactor system BioLector® Basic m2p labs
Microwave M1712N Samsung
Microwave R‐7280 and R‐963 Sharp
Nucleofector Amaxa Lonza
pH meter Five easy and Seven multi Mettler Toledo
pH meter WIW series pH 720 inoLab
Power supply PowerPac basic, HC, universal, 300 Bio‐Rad
Roller Mixer SRT 6D Stuart
Rotator Disk rotator Sauer
Scale A200S Sartorius analytic
Scale Combics 3, L22 and BP 3100S Sartorius
Scale G4200‐2 NM and EG 4200‐2NM Kern
Scale XB 6200D Precisa
Scale WT12 Biometra
Scanner Canon Scan LiDE 700F Canon
Shaker Duomax 2030 Heidolph
Shaker K15‐500 Incutec
Shaker Lab‐Shaker ES4x Kühner
Shaker Nutatig Mixer VWR International
Spectrophotometer Biowave CO8000 cell density meter WPA
Spectrophotometer GeneRay Biometra
Spectrophotometer NanoDrop ND‐1000 and 2000 Thermo Scientific
Thermocycler T3000 Biometra
Thermocycler T personal 48 Biometra
Thermocycler T professional gradient thermocycler Biometra
Thermomixer Thermomixer comfort and compact Eppendorf
Tube pump 501 U, 503, 505 Du and 520 Du Watson Marlow
Tube pump Masterflex L/S economy drive Cole Parmer
Tube pump Masterflex L/S digital standard drive Cole Parmer
Tube pump P‐1 GE
UV‐table Science imaging, 312 nm INTAS
Vacuum pump 2522c‐02 Welch
Vacuum pump BVC professional Vacubrand
Vacuum pump Laborport KNF Lab
Vortex Vortex Genie 2 Bender & Hobein AG
Vortex Vortex Genie 2 Scientific Industries
Vortex Reax top Heidolph
Vortex MS1 Minishaker and MS2 Minishaker IKA
Waterbath Ecoline Staredition 003 Lauda
Waterbath Ecoline 006 Lauda
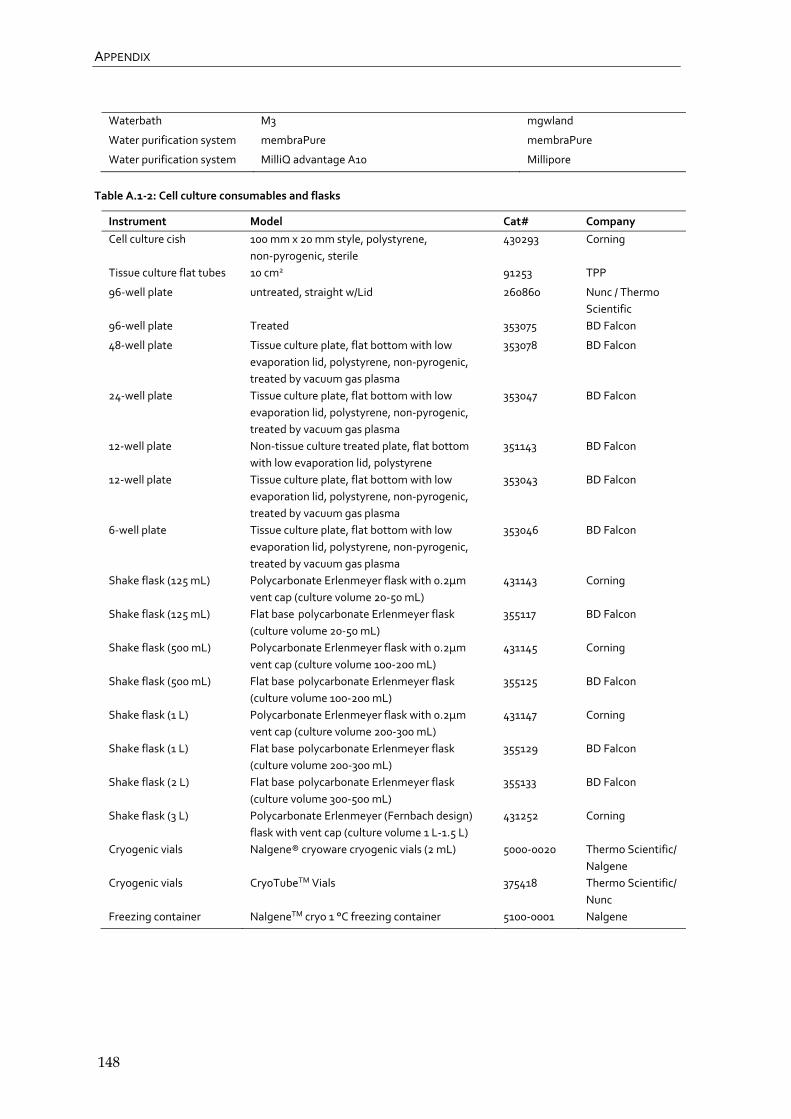
APPENDIX
148
Waterbath M3 mgwland
Water purification system membraPure membraPure
Water purification system MilliQ advantage A10 Millipore
Table A.1‐2: Cell culture consumables and flasks
Instrument Model Cat# Company
Cell culture cish 100 mm x 20 mm style, polystyrene,
non‐pyrogenic, sterile
430293 Corning
Tissue culture flat tubes 10 cm2 91253 TPP
96‐well plate untreated, straight w/Lid 260860 Nunc / Thermo
Scientific
96‐well plate Treated 353075 BD Falcon
48‐well plate Tissue culture plate, flat bottom with low
evaporation lid, polystyrene, non‐pyrogenic,
treated by vacuum gas plasma
353078 BD Falcon
24‐well plate Tissue culture plate, flat bottom with low
evaporation lid, polystyrene, non‐pyrogenic,
treated by vacuum gas plasma
353047 BD Falcon
12‐well plate Non‐tissue culture treated plate, flat bottom
with low evaporation lid, polystyrene
351143 BD Falcon
12‐well plate Tissue culture plate, flat bottom with low
evaporation lid, polystyrene, non‐pyrogenic,
treated by vacuum gas plasma
353043 BD Falcon
6‐well plate Tissue culture plate, flat bottom with low
evaporation lid, polystyrene, non‐pyrogenic,
treated by vacuum gas plasma
353046 BD Falcon
Shake flask (125 mL)
Polycarbonate Erlenmeyer flask with 0.2µm
vent cap (culture volume 20‐50 mL)
431143 Corning
Shake flask (125 mL)
Flat base polycarbonate Erlenmeyer flask
(culture volume 20‐50 mL)
355117 BD Falcon
Shake flask (500 mL)
Polycarbonate Erlenmeyer flask with 0.2µm
vent cap (culture volume 100‐200 mL)
431145 Corning
Shake flask (500 mL)
Flat base polycarbonate Erlenmeyer flask
(culture volume 100‐200 mL)
355125 BD Falcon
Shake flask (1 L)
Polycarbonate Erlenmeyer flask with 0.2µm
vent cap (culture volume 200‐300 mL)
431147 Corning
Shake flask (1 L)
Flat base polycarbonate Erlenmeyer flask
(culture volume 200‐300 mL)
355129 BD Falcon
Shake flask (2 L)
Flat base polycarbonate Erlenmeyer flask
(culture volume 300‐500 mL)
355133 BD Falcon
Shake flask (3 L)
Polycarbonate Erlenmeyer (Fernbach design)
flask with vent cap (culture volume 1 L‐1.5 L)
431252 Corning
Cryogenic vials Nalgene® cryoware cryogenic vials (2 mL) 5000‐0020 Thermo Scientific/
Nalgene
Cryogenic vials CryoTubeTM Vials 375418 Thermo Scientific/
Nunc
Freezing container NalgeneTM cryo 1 °C freezing container 5100‐0001 Nalgene
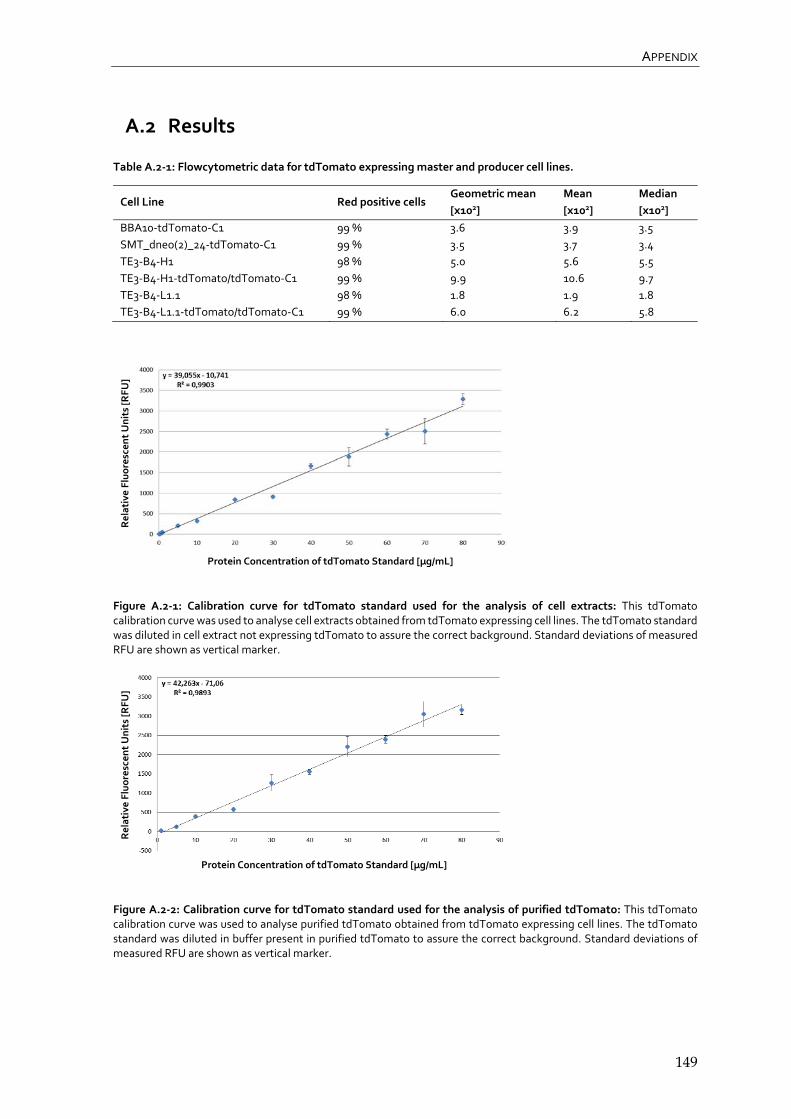
APPENDIX
149
A.2 Results
Table A.2‐1: Flowcytometric data for tdTomato expressing master and producer cell lines.
Figure A.2‐1: Calibration curve for tdTomato standard used for the analysis of cell extracts: This tdTomato calibration curve was used to analyse cell extracts obtained from tdTomato expressing cell lines. The tdTomato standard was diluted in cell extract not expressing tdTomato to assure the correct background. Standard deviations of measured RFU are shown as vertical marker.
Figure A.2‐2: Calibration curve for tdTomato standard used for the analysis of purified tdTomato: This tdTomato calibration curve was used to analyse purified tdTomato obtained from tdTomato expressing cell lines. The tdTomato standard was diluted in buffer present in purified tdTomato to assure the correct background. Standard deviations of measured RFU are shown as vertical marker.
Cell Line Red positive cells Geometric mean
[x102]
Mean
[x102]
Median
[x102]
BBA10‐tdTomato‐C1 99 % 3.6 3.9 3.5
SMT_dneo(2)_24‐tdTomato‐C1 99 % 3.5 3.7 3.4
TE3‐B4‐H1 98 % 5.0 5.6 5.5
TE3‐B4‐H1‐tdTomato/tdTomato‐C1 99 % 9.9 10.6 9.7
TE3‐B4‐L1.1 98 % 1.8 1.9 1.8
TE3‐B4‐L1.1‐tdTomato/tdTomato‐C1 99 % 6.0 6.2 5.8
Relative Fluorescent Units [R
FU]
Protein Concentration of tdTomato Standard [µg/mL]
Relative Fluorescent Units [R
FU]
Protein Concentration of tdTomato Standard [µg/mL]
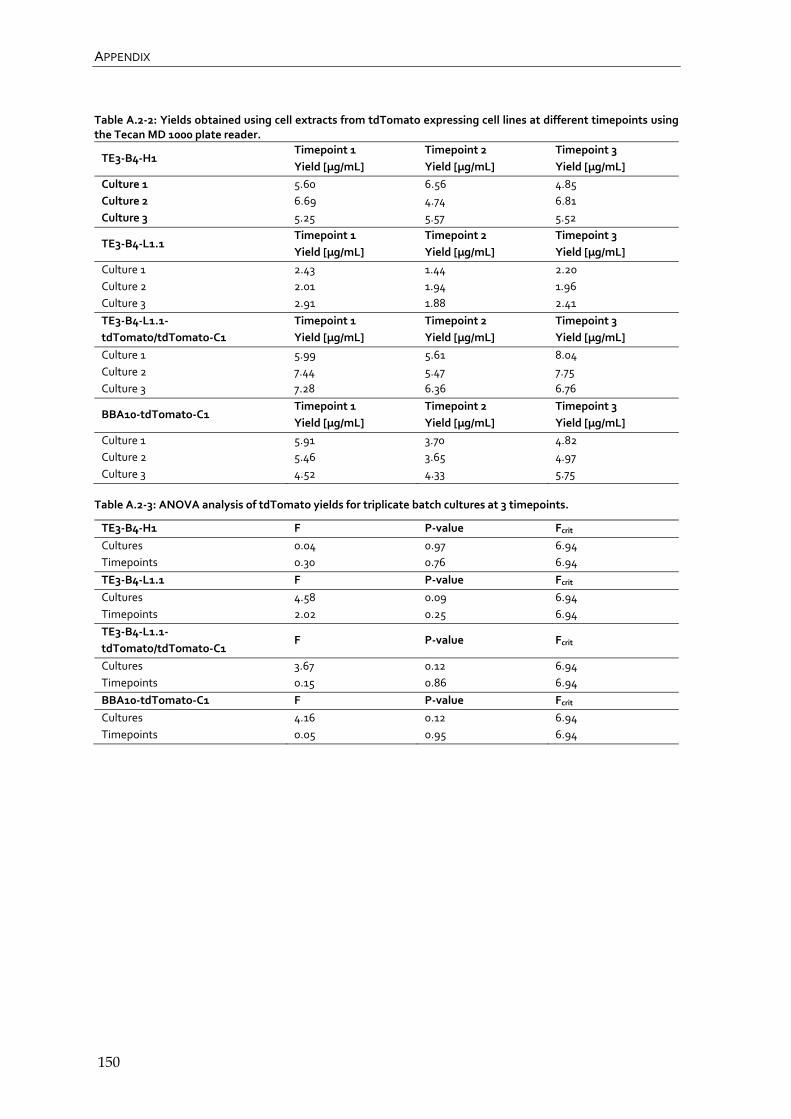
APPENDIX
150
Table A.2‐2: Yields obtained using cell extracts from tdTomato expressing cell lines at different timepoints using the Tecan MD 1000 plate reader.
TE3‐B4‐H1 Timepoint 1
Yield [µg/mL]
Timepoint 2
Yield [µg/mL]
Timepoint 3
Yield [µg/mL]
Culture 1 5.60 6.56 4.85
Culture 2 6.69 4.74 6.81
Culture 3 5.25 5.57 5.52
TE3‐B4‐L1.1 Timepoint 1
Yield [µg/mL]
Timepoint 2
Yield [µg/mL]
Timepoint 3
Yield [µg/mL]
Culture 1 2.43 1.44 2.20
Culture 2 2.01 1.94 1.96
Culture 3 2.91 1.88 2.41
TE3‐B4‐L1.1‐
tdTomato/tdTomato‐C1
Timepoint 1
Yield [µg/mL]
Timepoint 2
Yield [µg/mL]
Timepoint 3
Yield [µg/mL]
Culture 1 5.99 5.61 8.04
Culture 2 7.44 5.47 7.75
Culture 3 7.28 6.36 6.76
BBA10‐tdTomato‐C1 Timepoint 1
Yield [µg/mL]
Timepoint 2
Yield [µg/mL]
Timepoint 3
Yield [µg/mL]
Culture 1 5.91 3.70 4.82
Culture 2 5.46 3.65 4.97
Culture 3 4.52 4.33 5.75
Table A.2‐3: ANOVA analysis of tdTomato yields for triplicate batch cultures at 3 timepoints.
TE3‐B4‐H1 F P‐value Fcrit
Cultures 0.04 0.97 6.94
Timepoints 0.30 0.76 6.94
TE3‐B4‐L1.1 F P‐value Fcrit
Cultures 4.58 0.09 6.94
Timepoints 2.02 0.25 6.94
TE3‐B4‐L1.1‐
tdTomato/tdTomato‐C1 F P‐value Fcrit
Cultures 3.67 0.12 6.94
Timepoints 0.15 0.86 6.94
BBA10‐tdTomato‐C1 F P‐value Fcrit
Cultures 4.16 0.12 6.94
Timepoints 0.05 0.95 6.94
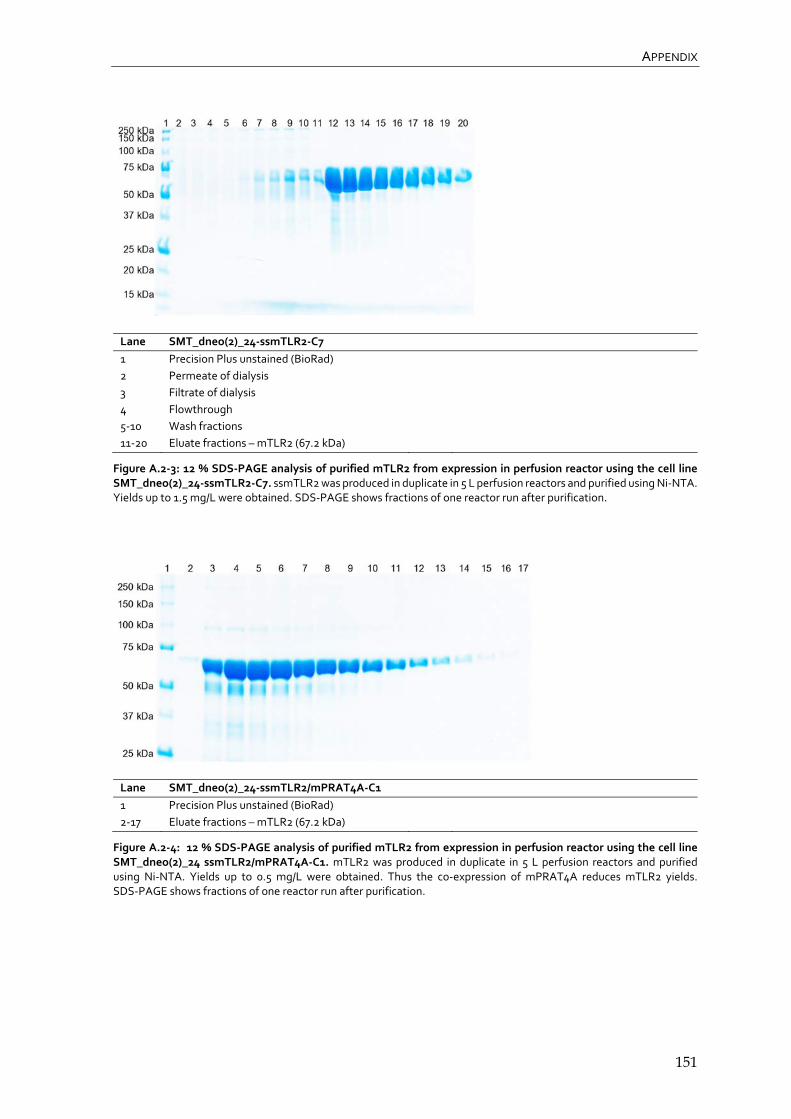
APPENDIX
151
Lane SMT_dneo(2)_24‐ssmTLR2‐C7
1 Precision Plus unstained (BioRad)
2 Permeate of dialysis
3 Filtrate of dialysis
4 Flowthrough
5‐10 Wash fractions
11‐20 Eluate fractions – mTLR2 (67.2 kDa)
Figure A.2‐3: 12 % SDS‐PAGE analysis of purified mTLR2 from expression in perfusion reactor using the cell line SMT_dneo(2)_24‐ssmTLR2‐C7. ssmTLR2 was produced in duplicate in 5 L perfusion reactors and purified using Ni‐NTA. Yields up to 1.5 mg/L were obtained. SDS‐PAGE shows fractions of one reactor run after purification.
Lane SMT_dneo(2)_24‐ssmTLR2/mPRAT4A‐C1
1 Precision Plus unstained (BioRad)
2‐17 Eluate fractions – mTLR2 (67.2 kDa)
Figure A.2‐4: 12 % SDS‐PAGE analysis of purified mTLR2 from expression in perfusion reactor using the cell line SMT_dneo(2)_24 ssmTLR2/mPRAT4A‐C1. mTLR2 was produced in duplicate in 5 L perfusion reactors and purified using Ni‐NTA. Yields up to 0.5 mg/L were obtained. Thus the co‐expression of mPRAT4A reduces mTLR2 yields. SDS‐PAGE shows fractions of one reactor run after purification.
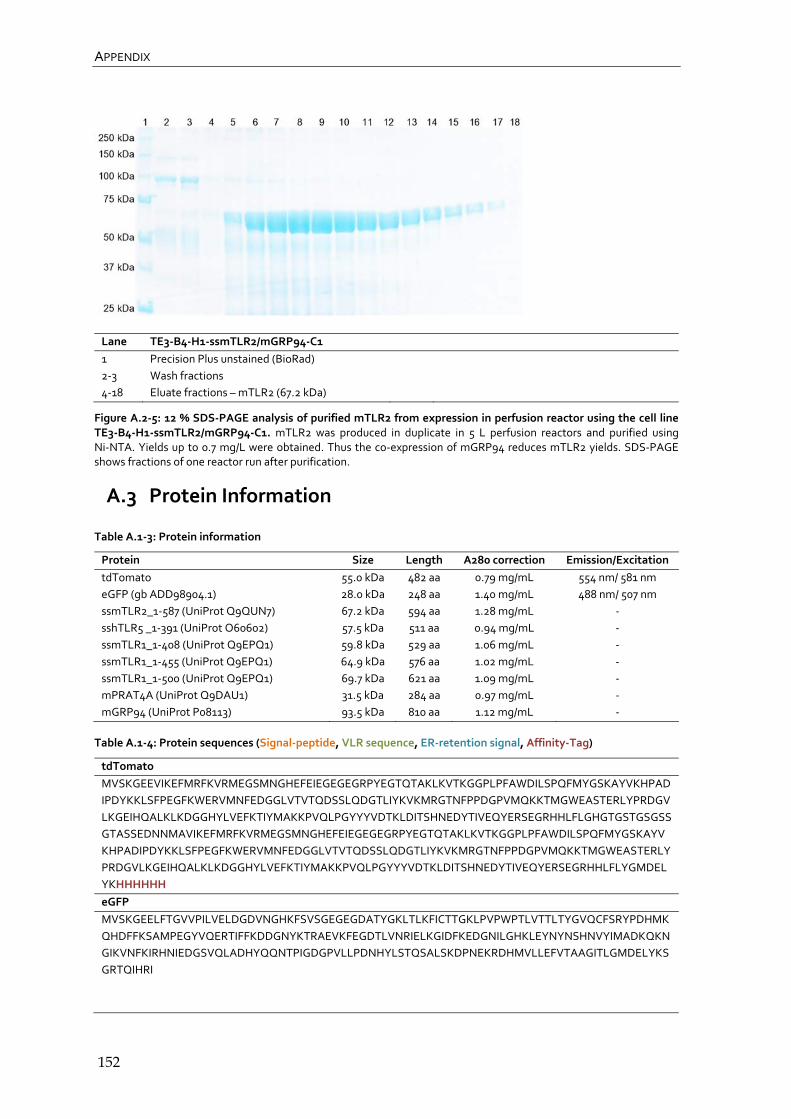
APPENDIX
152
Lane TE3‐B4‐H1‐ssmTLR2/mGRP94‐C1
1 Precision Plus unstained (BioRad)
2‐3 Wash fractions
4‐18 Eluate fractions – mTLR2 (67.2 kDa)
Figure A.2‐5: 12 % SDS‐PAGE analysis of purified mTLR2 from expression in perfusion reactor using the cell line TE3‐B4‐H1‐ssmTLR2/mGRP94‐C1. mTLR2 was produced in duplicate in 5 L perfusion reactors and purified using Ni‐NTA. Yields up to 0.7 mg/L were obtained. Thus the co‐expression of mGRP94 reduces mTLR2 yields. SDS‐PAGE shows fractions of one reactor run after purification.
A.3 Protein Information
Table A.1‐3: Protein information
Protein Size Length A280 correction Emission/Excitation
tdTomato 55.0 kDa 482 aa 0.79 mg/mL 554 nm/ 581 nm
eGFP (gb ADD98904.1) 28.0 kDa 248 aa 1.40 mg/mL 488 nm/ 507 nm
ssmTLR2_1‐587 (UniProt Q9QUN7) 67.2 kDa 594 aa 1.28 mg/mL ‐
sshTLR5 _1‐391 (UniProt O60602) 57.5 kDa 511 aa 0.94 mg/mL ‐
ssmTLR1_1‐408 (UniProt Q9EPQ1) 59.8 kDa 529 aa 1.06 mg/mL ‐
ssmTLR1_1‐455 (UniProt Q9EPQ1) 64.9 kDa 576 aa 1.02 mg/mL ‐
ssmTLR1_1‐500 (UniProt Q9EPQ1) 69.7 kDa 621 aa 1.09 mg/mL ‐
mPRAT4A (UniProt Q9DAU1) 31.5 kDa 284 aa 0.97 mg/mL ‐
mGRP94 (UniProt P08113) 93.5 kDa 810 aa 1.12 mg/mL ‐
Table A.1‐4: Protein sequences (Signal‐peptide, VLR sequence, ER‐retention signal, Affinity‐Tag)
tdTomato
MVSKGEEVIKEFMRFKVRMEGSMNGHEFEIEGEGEGRPYEGTQTAKLKVTKGGPLPFAWDILSPQFMYGSKAYVKHPAD
IPDYKKLSFPEGFKWERVMNFEDGGLVTVTQDSSLQDGTLIYKVKMRGTNFPPDGPVMQKKTMGWEASTERLYPRDGV
LKGEIHQALKLKDGGHYLVEFKTIYMAKKPVQLPGYYYVDTKLDITSHNEDYTIVEQYERSEGRHHLFLGHGTGSTGSGSS
GTASSEDNNMAVIKEFMRFKVRMEGSMNGHEFEIEGEGEGRPYEGTQTAKLKVTKGGPLPFAWDILSPQFMYGSKAYV
KHPADIPDYKKLSFPEGFKWERVMNFEDGGLVTVTQDSSLQDGTLIYKVKMRGTNFPPDGPVMQKKTMGWEASTERLY
PRDGVLKGEIHQALKLKDGGHYLVEFKTIYMAKKPVQLPGYYYVDTKLDITSHNEDYTIVEQYERSEGRHHLFLYGMDEL
YKHHHHHH
eGFP
MVSKGEELFTGVVPILVELDGDVNGHKFSVSGEGEGDATYGKLTLKFICTTGKLPVPWPTLVTTLTYGVQCFSRYPDHMK
QHDFFKSAMPEGYVQERTIFFKDDGNYKTRAEVKFEGDTLVNRIELKGIDFKEDGNILGHKLEYNYNSHNVYIMADKQKN
GIKVNFKIRHNIEDGSVQLADHYQQNTPIGDGPVLLPDNHYLSTQSALSKDPNEKRDHMVLLEFVTAAGITLGMDELYKS
GRTQIHRI

APPENDIX
153
mTLR2_1‐587
MLRALWLFWILVAITVLFSKRCSAQESLSCDASGVCDGRSRSFTSIPSGLTAAMKSLDLSFNKITYIGHGDLRACANLQV
LILKSSRINTIEGDAFYSLGSLEHLDLSDNHLSSLSSSWFGPLSSLKYLNLMGNPYQTLGVTSLFPNLTNLQTLRIGNVETF
SEIRRIDFAGLTSLNELEIKALSLRNYQSQSLKSIRDIHHLTLHLSESAFLLEIFADILSSVRYLELRDTNLARFQFSPLPVDEV
SSPMKKLAFRGSVLTDESFNELLKLLRYILELSEVEFDDCTLNGLGDFNPSESDVVSELGKVETVTIRRLHIPQFYLFYDLST
VYSLLEKVKRITVENSKVFLVPCSFSQHLKSLEFLDLSENLMVEEYLKNSACKGAWPSLQTLVLSQNHLRSMQKTGEILLT
LKNLTSLDISRNTFHPMPDSCQWPEKMRFLNLSSTGIRVVKTCIPQTLEVLDVSNNNLDSFSLFLPRLQELYISRNKLKTLP
DASLFPVLLVMKIRENAVSTFSKDQLGSFPKLETLEAGDNHFVCSCELLSFTMETPALAQILVDWPDSYLCDSPPRLHGH
RLQDARPSVLECHQHHHHHHH
hTLR5 _1‐391
MGDHLDLLLGVVLMAGPVFGIPSCSFDGRIAFYRFCNLTQVPQVLNTTERLLLSFNYIRTVTASSFPFLEQLQLLELGSQY
TPLTIDKEAFRNLPNLRILDLGSSKIYFLHPDAFQGLFHLFELRLYFCGLSDAVLKDGYFRNLKALTRLDLSKNQIRSLYLHP
SFGKLNSLKSIDFSSNQIFLVCEHELEPLQGKTLSFFSLAANSLYSRVSVDWGKCMNPFRNMVLEILDVSGNGWTVDITG
NFSNAISKSQAFSLILAHHIMGAGFGFHNIKDPDQNTFAGLARSSVRHLDLSHGFVFSLNSRVFETLKDLKVLNLAYNKIN
KIADEAFYGLDNLQVLNLSYNLLGELYSSNFYGLPKVAYIDLQKNHIAIIQDQTFKFLEKLQTLDLASNQLKSVPDGIFDR
LTSLQKIWLHTNPWDCSCPRIDYLSRWLNKNSQKEQGSAKCSGSGKPVRSIICPTSRENLYFQGGSAWSHPQFEKGG
GSGGGSGGSAWSHPQFEKGSHHHHHHHH
mTLR1_1‐408
MGTKPNSLIFYCIIVLGLTLMKIQLSEKCELIIKRPNANLTRVPKDLPLQTTTLDLSQNNISELQTSDILSLSKLRVLIMSYNR
LQYLNISVFKFNTELEYLDLSHNELKVILCHPTVSLKHLDLSFNAFDALPICKEFGNMSQLQFLGLSGSRVQSSSVQLIAHL
NISKVLLVLGDAYGEKEDPESLRHVSTETLHIVFPSKREFRFLLDVSVSTTIGLELSNIKCVLEDQGCSYFLRALSKLGKNLK
LSNLTLNNVETTWNSFINILQIVWHTPVKYFSISNVKLQGQLAFRMFNYSDTSLKALSIHQVVTDVFSFPQSYIYSIFANMN
IQNFTMSGTHMVHMLCPSQVSPFLHVDFTDNLLTDMVFKDCRNLVRLKTLSLQKNQLKNLENIILTSAKMTSLQKLDIAS
NQLKSVPDGIFDRLTSLQKIWLHTNPWDCSCPRIDYLSRWLNKNSQKEQGSAKCSGSGKPVRSIICPTSRENLYFQG
GSAWSHPQFEKGGGSGGGSGGSAWSHPQFEKGSHHHHHHHH
mTLR1_1‐455
MGTKPNSLIFYCIIVLGLTLMKIQLSEKCELIIKRPNANLTRVPKDLPLQTTTLDLSQNNISELQTSDILSLSKLRVLIMSYNR
LQYLNISVFKFNTELEYLDLSHNELKVILCHPTVSLKHLDLSFNAFDALPICKEFGNMSQLQFLGLSGSRVQSSSVQLIAHL
NISKVLLVLGDAYGEKEDPESLRHVSTETLHIVFPSKREFRFLLDVSVSTTIGLELSNIKCVLEDQGCSYFLRALSKLGKNLK
LSNLTLNNVETTWNSFINILQIVWHTPVKYFSISNVKLQGQLAFRMFNYSDTSLKALSIHQVVTDVFSFPQSYIYSIFANMN
IQNFTMSGTHMVHMLCPSQVSPFLHVDFTDNLLTDMVFKDCRNLVRLKTLSLQKNQLKNLENIILTSAKMTSLQKLDISQ
NSLRYSDGGIPCAWTQSLLVLNLSSNMLTGSVFRCLPPKVKVLDLASNQLKSVPDGIFDRLTSLQKIWLHTNPWDCSC
PRIDYLSRWLNKNSQKEQGSAKCSGSGKPVRSIICPTSRENLYFQGGSAWSHPQFEKGGGSGGGSGGSAWSHPQFE
KGSHHHHHHHH
ssmTLR1_1‐500
MGTKPNSLIFYCIIVLGLTLMKIQLSEKCELIIKRPNANLTRVPKDLPLQTTTLDLSQNNISELQTSDILSLSKLRVLIMSYNR
LQYLNISVFKFNTELEYLDLSHNELKVILCHPTVSLKHLDLSFNAFDALPICKEFGNMSQLQFLGLSGSRVQSSSVQLIAHL
NISKVLLVLGDAYGEKEDPESLRHVSTETLHIVFPSKREFRFLLDVSVSTTIGLELSNIKCVLEDQGCSYFLRALSKLGKNLK
LSNLTLNNVETTWNSFINILQIVWHTPVKYFSISNVKLQGQLAFRMFNYSDTSLKALSIHQVVTDVFSFPQSYIYSIFANMN
IQNFTMSGTHMVHMLCPSQVSPFLHVDFTDNLLTDMVFKDCRNLVRLKTLSLQKNQLKNLENIILTSAKMTSLQKLDISQ
NSLRYSDGGIPCAWTQSLLVLNLSSNMLTGSVFRCLPPKVKVLDLHNNRIMSIPKDVTHLQALQELNVASNSLTDLPGCG
AFSSLSVLVIASNQLKSVPDGIFDRLTSLQKIWLHTNPWDCSCPRIDYLSRWLNKNSQKEQGSAKCSGSGKPVRSIICP
TSRENLYFQGGSAWSHPQFEKGGGSGGGSGGSAWSHPQFEKGSHHHHHHHH
mPRAT4A (UniProt accession Q9DAU1)
C‐terminal FLAG‐tag
MESMSELAPRCLLFPLLLLLPLLLLPAPKLGPSPAGAEETDWVRLPSKCEVCKYVAVELKSAFEETGKTKEVIDTGYGILD
GKGSGVKYTKSDLRLIEVTETICKRLLDYSLHKERTGSNRFAKGMSETFETLHNLVHKGVKVVMDIPYELWNETSAEVAD
LKKQCDVLVEEFEEVIEDWYRNHQEEDLTEFLCANHVLKGKDTSCLAERWSGKKGDIASLGGKKSKKKRSGVKGSSSGS
SKQRKELGGLGEDANAEEEEGVQKASPLPHSPPDELDYKDDDDK
N‐terminal FLAG‐tag
MDYKDDDDKESMSELAPRCLLFPLLLLLPLLLLPAPKLGPSPAGAEETDWVRLPSKCEVCKYVAVELKSAFEETGKTKE
VIDTGYGILDGKGSGVKYTKSDLRLIEVTETICKRLLDYSLHKERTGSNRFAKGMSETFETLHNLVHKGVKVVMDIPYELW
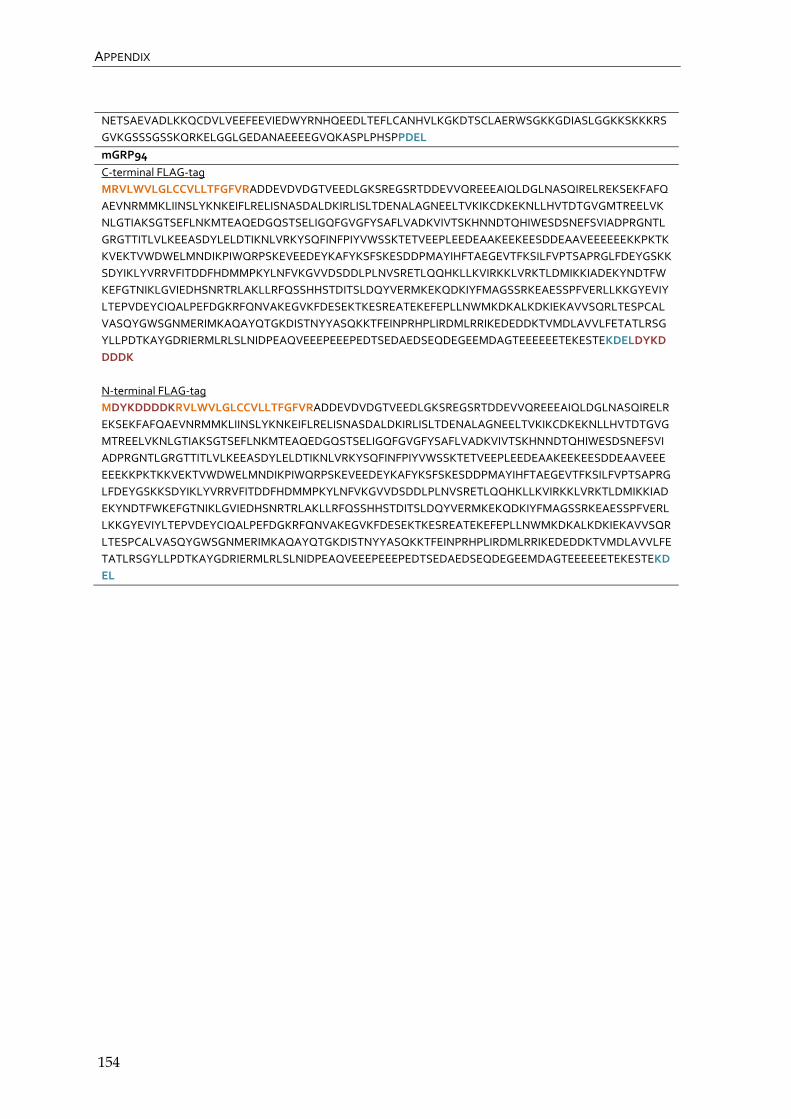
APPENDIX
154
NETSAEVADLKKQCDVLVEEFEEVIEDWYRNHQEEDLTEFLCANHVLKGKDTSCLAERWSGKKGDIASLGGKKSKKKRS
GVKGSSSGSSKQRKELGGLGEDANAEEEEGVQKASPLPHSPPDEL
mGRP94
C‐terminal FLAG‐tag
MRVLWVLGLCCVLLTFGFVRADDEVDVDGTVEEDLGKSREGSRTDDEVVQREEEAIQLDGLNASQIRELREKSEKFAFQ
AEVNRMMKLIINSLYKNKEIFLRELISNASDALDKIRLISLTDENALAGNEELTVKIKCDKEKNLLHVTDTGVGMTREELVK
NLGTIAKSGTSEFLNKMTEAQEDGQSTSELIGQFGVGFYSAFLVADKVIVTSKHNNDTQHIWESDSNEFSVIADPRGNTL
GRGTTITLVLKEEASDYLELDTIKNLVRKYSQFINFPIYVWSSKTETVEEPLEEDEAAKEEKEESDDEAAVEEEEEEKKPKTK
KVEKTVWDWELMNDIKPIWQRPSKEVEEDEYKAFYKSFSKESDDPMAYIHFTAEGEVTFKSILFVPTSAPRGLFDEYGSKK
SDYIKLYVRRVFITDDFHDMMPKYLNFVKGVVDSDDLPLNVSRETLQQHKLLKVIRKKLVRKTLDMIKKIADEKYNDTFW
KEFGTNIKLGVIEDHSNRTRLAKLLRFQSSHHSTDITSLDQYVERMKEKQDKIYFMAGSSRKEAESSPFVERLLKKGYEVIY
LTEPVDEYCIQALPEFDGKRFQNVAKEGVKFDESEKTKESREATEKEFEPLLNWMKDKALKDKIEKAVVSQRLTESPCAL
VASQYGWSGNMERIMKAQAYQTGKDISTNYYASQKKTFEINPRHPLIRDMLRRIKEDEDDKTVMDLAVVLFETATLRSG
YLLPDTKAYGDRIERMLRLSLNIDPEAQVEEEPEEEPEDTSEDAEDSEQDEGEEMDAGTEEEEEETEKESTEKDELDYKD
DDDK
N‐terminal FLAG‐tag
MDYKDDDDKRVLWVLGLCCVLLTFGFVRADDEVDVDGTVEEDLGKSREGSRTDDEVVQREEEAIQLDGLNASQIRELR
EKSEKFAFQAEVNRMMKLIINSLYKNKEIFLRELISNASDALDKIRLISLTDENALAGNEELTVKIKCDKEKNLLHVTDTGVG
MTREELVKNLGTIAKSGTSEFLNKMTEAQEDGQSTSELIGQFGVGFYSAFLVADKVIVTSKHNNDTQHIWESDSNEFSVI
ADPRGNTLGRGTTITLVLKEEASDYLELDTIKNLVRKYSQFINFPIYVWSSKTETVEEPLEEDEAAKEEKEESDDEAAVEEE
EEEKKPKTKKVEKTVWDWELMNDIKPIWQRPSKEVEEDEYKAFYKSFSKESDDPMAYIHFTAEGEVTFKSILFVPTSAPRG
LFDEYGSKKSDYIKLYVRRVFITDDFHDMMPKYLNFVKGVVDSDDLPLNVSRETLQQHKLLKVIRKKLVRKTLDMIKKIAD
EKYNDTFWKEFGTNIKLGVIEDHSNRTRLAKLLRFQSSHHSTDITSLDQYVERMKEKQDKIYFMAGSSRKEAESSPFVERL
LKKGYEVIYLTEPVDEYCIQALPEFDGKRFQNVAKEGVKFDESEKTKESREATEKEFEPLLNWMKDKALKDKIEKAVVSQR
LTESPCALVASQYGWSGNMERIMKAQAYQTGKDISTNYYASQKKTFEINPRHPLIRDMLRRIKEDEDDKTVMDLAVVLFE
TATLRSGYLLPDTKAYGDRIERMLRLSLNIDPEAQVEEEPEEEPEDTSEDAEDSEQDEGEEMDAGTEEEEEETEKESTEKD
EL
ACKNOWLEDGMENTS
155
Acknowledgments
I would like to thank Dr. Joop van den Heuvel for giving me the opportunity to work on
this PhD project as well as his constant support and feedback. Furthermore, I would like to
thank the board of examiners Prof. Wulf Blankenfeldt, Prof. Stefan Dübel and Prof. Michael
Hust for taking the time and afford to support my doctorate. Moreover, I would like to
thank Prof. Christane Ritter and Prof. Melanie Brinkmann for their support and feedback
during my thesis committees.
For the technical support in the laboratory I would like to thank our technicians.
Daniela Gebauer for her support in protein purification and advice in all areas of laboratory
live. Nadine Konisch for fermentation and the introduction into the cell culture laboratory.
Sarah Maria Tokarski for the introduction into RMCE and Anke Samuels for her support in
cell culture. She is probably relived that she does not need to count a single cell for me ever
again.
I would like to thank Dr. Johannes Spehr, Dr. Sonja Wilke and Maren Bleckmann for
reading my dissertation and giving me valuable feedback. For the introduction into Adobe
illustrator I would like to thank Dr. Johannes Spehr. Likewise I would like to thank Dr. Jörn
Krause for the crash course in pyMol. Furthermore, I would like to thank my master and
bachelor students Shiwani Agarwal and Tabea Ellebracht for their good work and
enthusiasm. Moreover, I would like to thank Dr. Lothar Gröbe and Maria Höxter for cell
sorting.
All members of the research groups RPEX, SBAU and SFPR; I would like to thank for their
advice, support and the supply with laboratory reagents. They made my time at the HZI
enjoyable inside as well as outside of the laboratory.
Particularly I would like to thank Christian Schinkowski for rescuing my data and me from
heart failure.
This work was supported by the Helmholtz Protein Sample Production Facility and by
Instruct, part of the European Strategy Forum on Research Infrastructures (ESFRI). The
research leading to these results also received funding from the European Community's
Seventh Framework Programme (FP7/2007-2013) for the ComplexInc Project under grant
agreement N° 270089

APPENDIX
156
Curriculum Vitae
Publications Meyer, S., C. Lorenz, B. Baser, M. Wördehoff, V. Jäger and J. van den Heuvel (2013). Multi‐Host Expression System for Recombinant Production of Challenging Proteins. PLoS ONE 8(7): e68674.
Education 2010‐Present
PhD Student
Helmholtz Centre for Infection Research, Brunswick (Germany)
RG Recombinant Protein Expression (RPEX)
Group Leader: Dr. Joop van den Heuvel
“New Strategies to Improve the Expression of Recombinant Mammalian Proteins in
Engineered Animal Cell Lines”
2008‐2009 Biotechnology, MSc, Distinction
Oxford Brookes University, Oxford (UK)
Master Thesis
University of Oxford, Division of Structural Biology (STRUBI), Oxford (UK)
Group Leader: Dr. Radu Aricescu
“Expression of GABAB Receptor Subunits for Structural Analysis”
2006‐2007 Industrial Placement
LONZA Biologics Plc., Dept. Assay Development, Slough (UK)
Group Leader: Dr. Kym Baker, Supervisor: Dr. Jeffery Gerard
“Technical Development ‐ Evaluation iCE 280 Analyser ”
2004‐2008 Biotechnology, BSc Hons., Upper Second Class
Oxford Brookes University, Oxford (UK)
2004 English for University Studies (EUS)
Oxford Brookes University, Oxford (UK)
2002‐2004 Chemistry
Technische Universität München, Munich (Germany)
1994‐2002 A‐Levels, Zeugnis der Allgemeinen Hochschulreife
Clemens‐Brentano‐Europaschule, Lollar (Germany)
Awards 6–8 Mar 2013
1st poster prize at RPP7 – Laupheim , 7th Conference on Recombinant Protein
Production, Laupheim, Germany (Poster)
Conference Contributions 6–8 Mar 2013
RPP7 – Laupheim , 7th Conference on Recombinant Protein Production,
Laupheim, Germany (Poster)
4–8 Nov 2013 PEGS Europe 2013: Protein & Antibody Engineering Summit, Lisbon, Portugal
(Poster)
Related Documents