STATE OF NEW JERSEY DIVISION OF PENSIONS AND BENEFITS Financial Statements and Supplementary Schedules June 30, 2017 (With Independent Auditors’ Report Thereon)

Welcome message from author
This document is posted to help you gain knowledge. Please leave a comment to let me know what you think about it! Share it to your friends and learn new things together.
Transcript
STATE OF NEW JERSEY DIVISION OF PENSIONS AND BENEFITS
Financial Statements and Supplementary Schedules
June 30, 2017
(With Independent Auditors’ Report Thereon)
STATE OF NEW JERSEY
DIVISION OF PENSIONS AND BENEFITS
Financial Statements and Supplementary Schedules
June 30, 2017
Table of Contents
Page
Independent Auditors’ Report 1
Management’s Discussion and Analysis (Unaudited) 3
Basic Financial Statements:
Statement of Fiduciary Net Position – Fiduciary Funds 11
Combining Statement of Fiduciary Net Position – Fiduciary Funds – Pension Trust Funds
and Other Postemployment Benefit Plan 12
Statement of Changes in Fiduciary Net Position – Fiduciary Funds 13
Combining Statement of Changes in Fiduciary Net Position – Fiduciary Funds – Pension
Trust Funds and Other Postemployment Benefit Plan 14
Notes to Financial Statements 15
Supplementary Schedules:
Required Supplementary Information (Unaudited)
Defined Benefit Pension Plans:
1 Schedule of Changes in Net Pension Liability and Related Ratios 56
2 Schedule of Employer Contributions 63
3 Schedule of Investment Returns – Annual Money-Weighted Rate of Return, Net of
Investment Expense 67
Defined Benefit Other Postemployment Benefit Plan:
4 Schedule of Changes in Net OPEB Liability and Related Ratios 68
5 Schedule of Investment Returns – Annual Money-Weighted Rate of Return, Net of
Investment Expense 69
Supplementary Information
6 Schedule of Administrative Expenses 70
7 Schedule of Investment Expenses 71
8 Schedule of Expenses for Consultants 72
9 Combining Schedule of Fiduciary Net Position Information – Fiduciary Funds – Select
Pension Trust Funds 73
10 Combining Schedule of Changes in Fiduciary Net Position Information – Fiduciary
Funds – Select Pension Trust Funds 74

STATE OF NEW JERSEY
DIVISION OF PENSIONS AND BENEFITS
Financial Statements and Supplementary Schedules
June 30, 2017
Table of Contents
Page
Supplementary Information, continued
11 Combining Schedule of Balance Sheet Information – Fiduciary Funds – Agency Funds 75
12 Combining Schedule of Changes in Fiduciary Net Position Information – Fiduciary
Funds – Agency Funds 76
13 Combining Schedule of Balance Sheet Information – Agency Fund – Dental Expense
Program Fund 77
14 Combining Schedule of Changes in Fiduciary Net Position Information – Agency Fund
– Dental Expense Program Fund 78
15 Schedule of Changes in Assets and Liabilities Information – Agency Fund – Alternate
Benefit Program Fund 79
16 Schedule of Changes in Assets and Liabilities Information – Agency Fund – Pension
Adjustment Fund 80
17 Schedule of Changes in Assets and Liabilities Information – Agency Fund – Dental
Expense Program Fund – Total 81
18 Schedule of Changes in Assets and Liabilities Information – Agency Fund – Dental
Expense Program Fund – State 82
19 Schedule of Changes in Assets and Liabilities Information – Agency Fund – Dental
Expense Program Fund – Local 83
Independent Auditors’ Report
The Treasurer
State of New Jersey:
We have audited the accompanying financial statements of the fiduciary activities of the State of New Jersey,
Division of Pensions and Benefits (the Division), as of and for the year ended June 30, 2017, and the related
notes to the financial statements, which collectively comprise the Division’s basic financial statements as listed
in the table of contents.
Management’s Responsibility for the Financial Statements
Management is responsible for the preparation and fair presentation of these financial statements in
accordance with U.S. generally accepted accounting principles; this includes the design, implementation, and
maintenance of internal control relevant to the preparation and fair presentation of financial statements that are
free from material misstatement, whether due to fraud or error.
Auditors’ Responsibility
Our responsibility is to express an opinion on these financial statements based on our audit. We conducted our
audit in accordance with auditing standards generally accepted in the United States of America. Those
standards require that we plan and perform the audit to obtain reasonable assurance about whether the
financial statements are free from material misstatement.
An audit involves performing procedures to obtain audit evidence about the amounts and disclosures in the
financial statements. The procedures selected depend on the auditors’ judgment, including the assessment of
the risks of material misstatement of the financial statements, whether due to fraud or error. In making those
risk assessments, the auditor considers internal control relevant to the entity’s preparation and fair presentation
of the financial statements in order to design audit procedures that are appropriate in the circumstances, but
not for the purpose of expressing an opinion on the effectiveness of the entity’s internal control. Accordingly, we
express no such opinion. An audit also includes evaluating the appropriateness of accounting policies used and
the reasonableness of significant accounting estimates made by management, as well as evaluating the overall
presentation of the financial statements.
We believe that the audit evidence we have obtained is sufficient and appropriate to provide a basis for our
audit opinion.
Opinion
In our opinion, the financial statements referred to above present fairly, in all material respects, the financial
position of the fiduciary activities of the State of New Jersey, Division of Pensions and Benefits, as of June 30,
2017, and the respective changes in financial position for the year then ended in accordance with U.S.
generally accepted accounting principles.
KPMG LLP is a Delaware limited liability partnership and the U.S. member firm of the KPMG network of independent member firms affiliated with KPMG International Cooperative (“KPMG International”), a Swiss entity.
KPMG LLPNew Jersey Headquarters51 John F. Kennedy ParkwayShort Hills, NJ 07078-2702
2
Emphasis of Matter
Adoption of New Accounting Pronouncement
As discussed in note 2(k) to the financial statements, in 2017, the Division adopted Governmental Accounting
Standards Board (GASB) Statement No. 74, Financial Reporting for Postemployment Benefits Plans Other
Than Pension Plans. Our opinion is not modified with respect to this matter.
Reporting Entity
As discussed in note 2(a) to the financial statements, the financial statements referred to above are intended to
present the financial position and the changes in financial position of the fiduciary funds administered by the
Division. As a result, these financial statements do not purport to, and do not, present fairly the financial
position of the State of New Jersey as of June 30, 2017 and the changes in its financial position, or, where
applicable, its cash flows thereof for the year then ended in conformity with U.S. generally accepted accounting
principles. Our opinion is not modified with respect to this matter.
Other Matters
Required Supplementary Information
U.S. generally accepted accounting principles require that the management’s discussion and analysis and the
schedules included under Required Supplementary Information in the accompanying table of contents be
presented to supplement the basic financial statements. Such information, although not a part of the basic
financial statements, is required by the GASB who considers it to be an essential part of financial reporting for
placing the basic financial statements in an appropriate operational, economic, or historical context. We have
applied certain limited procedures to the required supplementary information in accordance with auditing
standards generally accepted in the United States of America, which consisted of inquiries of management
about the methods of preparing the information and comparing the information for consistency with
management’s responses to our inquiries, the basic financial statements, and other knowledge we obtained
during our audit of the basic financial statements. We do not express an opinion or provide any assurance on
the information because the limited procedures do not provide us with sufficient evidence to express an opinion
or provide any assurance.
Supplementary Information
Our audit was conducted for the purpose of forming an opinion on the financial statements that collectively
comprise the Division’s basic financial statements. The schedules included under Supplementary Information in
the accompanying table of contents (the Schedules) are presented for purposes of additional analysis and are
not a required part of the basic financial statements.
The Schedules are the responsibility of management and were derived from and relate directly to the
underlying accounting and other records used to prepare the basic financial statements. Such information has
been subjected to the auditing procedures applied in the audit of the basic financial statements and certain
additional procedures, including comparing and reconciling such information directly to the underlying
accounting and other records used to prepare the basic financial statements or to the basic financial statements
themselves, and other additional procedures in accordance with auditing standards generally accepted in the
United States of America. In our opinion, the Schedules are fairly stated, in all material respects, in relation to
the basic financial statements as a whole.
Short Hills, New Jersey
March 29, 2018
STATE OF NEW JERSEY
DIVISION OF PENSIONS AND BENEFITS
Management’s Discussion and Analysis
(Unaudited)
June 30, 2017
3 (Continued)
Our discussion and analysis of the financial performance of the fiduciary funds (the Funds) administered by the
Division of Pensions and Benefits (the Division) provides an overview of the Funds’ financial activities for the
State fiscal year ended June 30, 2017. Please read it in conjunction with the basic financial statements and
financial statement footnotes, which follow this discussion.
Financial Highlights
Fiduciary Funds – Pension Trust Funds and Other Postemployment Benefit (OPEB) Plan
Fiduciary net position increased by $4.5 billion as a result of this year’s operations from $79.2 billion to
$83.7 billion.
Additions for the year are $15.9 billion, which are comprised of member, employer, nonemployer, and
employer specific and other pension contributions of $6.5 billion and net investment income of $9.4 billion.
Deductions for the year are $11.5 billion, which are comprised of benefit and refund payments of $11.4 billion
and administrative expenses of $45.5 million.
Overview of the Financial Statements
This discussion and analysis is intended to serve as an introduction to the basic financial statements. The basic
financial statements are comprised of two components: 1) fiduciary fund financial statements and 2) notes to the
financial statements. This report also contains required and other supplementary information in addition to the
basic financial statements.
Fund Financial Statements
A fund is a grouping of related accounts that is used to maintain control over resources that have been
segregated for specific activities or objectives. The Division uses fund accounting to ensure and demonstrate
compliance with finance-related legal requirements.
Fiduciary Funds
Fiduciary funds are used to account for the assets that the Division holds on behalf of others as their agent.
Agency funds are custodial in nature and do not involve measurement of results of operations.
The Division administers fourteen fiduciary funds: ten pension trust funds, one OPEB plan, and three agency
funds. Based on Governmental Accounting Standards Board (GASB) Statement No 74, Financial Reporting for
Postemployment Benefit Plans Other Than Pension Plans (GASB 74), the Division reevaluated the OPEB plans
included in previously issued financial statements and determined that certain plans are not administered through
a trust and do not meet the equivalent arrangement criteria as defined in GASB 74 and, therefore, should not be
reported as fiduciary activities. The beginning of the year net position was restated, accordingly.
The statement of fiduciary net position for the pension trust funds and other postemployment benefit plan and the
agency funds presents the Division’s assets and liabilities by major categories and may serve over time as a
useful indicator of the Division’s financial position. The difference between assets and liabilities represents the
net position restricted for pension and other postemployment benefits.
STATE OF NEW JERSEY
DIVISION OF PENSIONS AND BENEFITS
Management’s Discussion and Analysis
(Unaudited)
June 30, 2017
4 (Continued)
The statement of changes in fiduciary net position for the pension trust funds and other postemployment benefit
plan provides information on the change in the Division’s net position during the current year. Additions are
comprised of investment income and member, employer, nonemployer, and employer specific and other
contributions. Deductions include retirement and health benefit payments, refunds of contributions, and
administrative expenses.
Notes to the Financial Statements
The notes to the financial statements provide additional information that is essential to a full understanding of the
data provided in the basic financial statements and includes a description of the fiduciary funds.
Other Information
In addition to the basic financial statements and accompanying notes, this report also presents certain required
supplementary information, which includes the schedules of changes in net pension liability and related ratios,
the schedules of employer contributions and schedule of investment returns for the pension trust funds as well as
the schedule of changes in net OPEB liability and related ratios and the schedule of investment returns for the
OPEB plan.
Financial Analysis
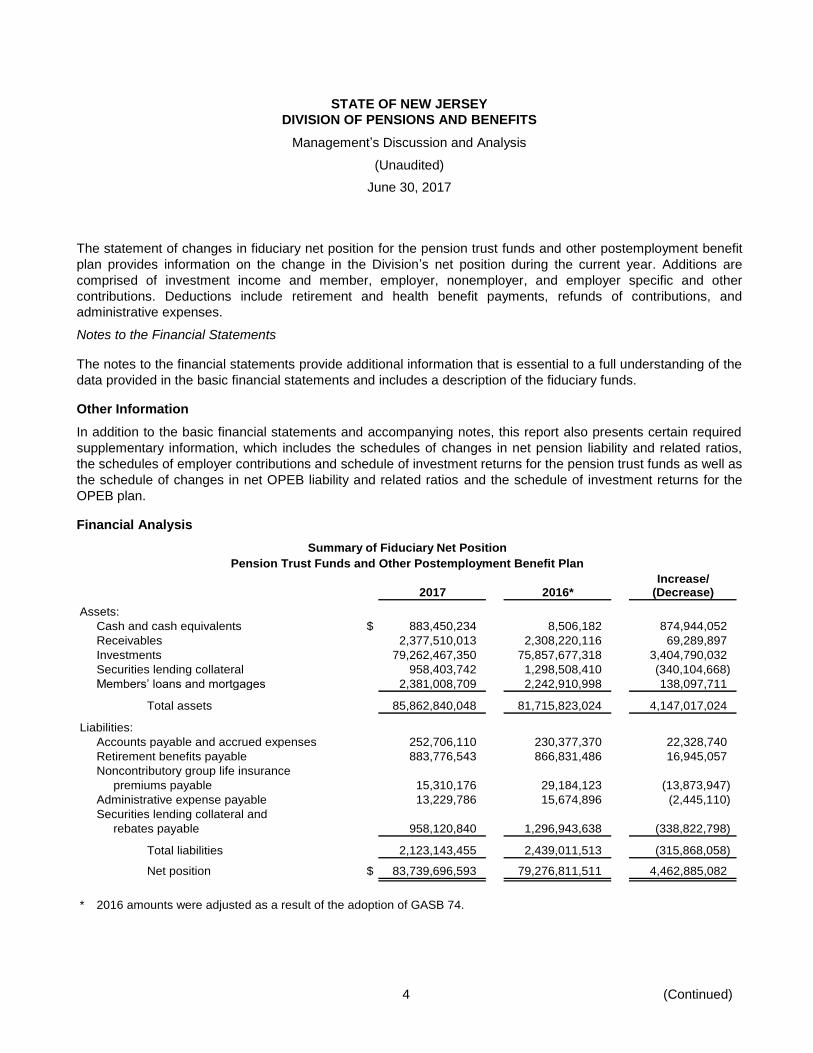
Summary of Fiduciary Net Position
Pension Trust Funds and Other Postemployment Benefit Plan
Increase/2017 2016* (Decrease)
Assets:
Cash and cash equivalents $ 883,450,234 8,506,182 874,944,052
Receivables 2,377,510,013 2,308,220,116 69,289,897
Investments 79,262,467,350 75,857,677,318 3,404,790,032
Securities lending collateral 958,403,742 1,298,508,410 (340,104,668)
Members’ loans and mortgages 2,381,008,709 2,242,910,998 138,097,711
Total assets 85,862,840,048 81,715,823,024 4,147,017,024
Liabilities:
Accounts payable and accrued expenses 252,706,110 230,377,370 22,328,740
Retirement benefits payable 883,776,543 866,831,486 16,945,057
Noncontributory group life insurance
premiums payable 15,310,176 29,184,123 (13,873,947)
Administrative expense payable 13,229,786 15,674,896 (2,445,110)
Securities lending collateral and
rebates payable 958,120,840 1,296,943,638 (338,822,798)
Total liabilities 2,123,143,455 2,439,011,513 (315,868,058)
Net position $ 83,739,696,593 79,276,811,511 4,462,885,082
* 2016 amounts were adjusted as a result of the adoption of GASB 74.

STATE OF NEW JERSEY
DIVISION OF PENSIONS AND BENEFITS
Management’s Discussion and Analysis
(Unaudited)
June 30, 2017
5 (Continued)
Assets of the pension trust funds and OPEB plan consist of cash and cash equivalents, investments,
contributions due from members and participating employers, accrued interest and dividends on investments,
other receivables, securities lending collateral, and members’ loans and mortgages. Between State fiscal years
2016 and 2017, total assets increased by $4.1 billion or 5.1%. This is primarily attributable to an increase of
$3.4 billion in investments due to strong returns from public equities, real estate, and private equity as explained
more thoroughly below and a $0.9 billion increase in cash and cash equivalents attributable to accrued payroll.
Liabilities of the pension trust funds and OPEB plan consist of retirement benefits payable to retirees and
beneficiaries, noncontributory group life insurance (NCGI) premiums payable to the Funds’ insurance provider,
securities lending collateral and rebates payable, administrative expense payable, and, classified under accounts
payable and accrued expenses, outstanding medical claims payable to the medical providers under the OPEB
plan. Also included within accounts payable and accrued expenses are liabilities of the pension trust funds for
unclaimed member accounts and checks issued to members that have not been negotiated by the members, but
remain due and payable. Total liabilities decreased by $315.9 million or 13.0%. This decrease is mainly due to a
decrease in securities lending collateral and rebates payable of $338.8 million.
Net position restricted for pension and other postemployment benefits increased by $4.5 billion or 5.6%.
Agency Funds
2017 2016 Increase
Assets $ 92,091,661 80,470,543 11,621,118
Liabilities 92,091,661 80,470,543 11,621,118
Net position $ — — —
Assets of the agency funds consist of cash and cash equivalents, investments, contributions due from the State
and local employers and other receivables. Between State fiscal years 2016 and 2017, total assets increased by
$11.6 million or 14.4%. This is attributable to the increased amount invested in the Cash Management Fund
(CMF) of $7.8 million and an increase of receivables of $4.4 million, offset by a decrease of $0.6 million in cash
and cash equivalents.
Liabilities in the agency funds vary according to each plan. In the Alternate Benefit Program (ABP), they include
reimbursements to state and county colleges, reimbursement to the State of New Jersey general fund of any
unused appropriations, and NCGI benefits payable. In the Dental Expense Program (DEP), they include claims
payable, and in the Pension Adjustment Fund (PAF), they include liabilities for payroll and amounts due to the
State of New Jersey general fund and other pension trust funds. Between State fiscal years 2016 and 2017, total
liabilities increased by $11.6 million or 14.4%. This was comprised of a $0.3 million decrease in payroll liabilities
in PAF, an $8.0 million increase in claim liabilities in DEP, and a $3.9 million increase in employer
reimbursements in ABP.

STATE OF NEW JERSEY
DIVISION OF PENSIONS AND BENEFITS
Management’s Discussion and Analysis
(Unaudited)
June 30, 2017
6 (Continued)
Summary of Changes in Fiduciary Net Position
Pension Trust Funds and Other Postemployment Benefit Plan
Increase/2017 2016* (Decrease)
Additions:
Member contributions $ 2,322,645,150 2,239,969,343 82,675,807
Employer contributions 2,925,363,922 2,575,429,410 349,934,512
Nonemployer contributions 1,265,145,499 909,705,663 355,439,836
Employer specific and other contributions 33,826,150 15,215,219 18,610,931
Net investment income (loss) 9,393,632,217 (651,172,295) 10,044,804,512
Total additions 15,940,612,938 5,089,147,340 10,851,465,598
Deductions:
Benefits 11,212,724,712 10,801,549,900 411,174,812
Refunds of contributions 219,513,451 202,432,865 17,080,586
Administrative expenses 45,489,693 52,568,646 (7,078,953)
Total deductions 11,477,727,856 11,056,551,411 421,176,445
Change in net position $ 4,462,885,082 (5,967,404,071) 10,430,289,153
* 2016 amounts were adjusted as a result of the adoption of GASB 74.
Additions of the pension trust funds and OPEB plan consist of member, employer, nonemployer, employer
specific and other contributions, and earnings from investment activities. There was an increase of $10.9 billion
or 213.2% in total additions attributable to an increase in net investment income of $10.1 billion and a net
increase of $0.8 billion in member, employer, nonemployer, and employer specific and other contributions in
State fiscal year 2017 as compared to State fiscal year 2016.
Member contributions increased by $82.7 million mainly due to the annual rate increases for the Teachers’
Pension and Annuity Fund (TPAF), Public Employees’ Retirement System (PERS) and the Judicial Retirement
System (JRS) as required in Chapter 78, P.L. 2011.
The State contributed $1,861.6 million to the pension trust funds in State fiscal year 2017. It was composed of
$276.1 million of normal cost and $1,585.5 million of accrued liability. The contributions were as follows:
$1,087.9 million to TPAF, $507.2 million to PERS, $195.2 million to the Police & Firemen’s Retirement System
(PFRS), $19.7 million to JRS, $51.0 million to the State Police Retirement System (SPRS), and $575 thousand to
the Consolidated Police and Firemen’s Pension Fund (CPFPF).
State NCGI contributions for the State fiscal year totaling $82.3 million were as follows: $39.1 million for TPAF,
$32.4 million for PERS, $8.2 million for PFRS, $0.7 million for JRS, and $1.9 million for SPRS. Between State
fiscal years 2016 and 2017, the State’s contribution toward noncontributory group life insurance increased by
$7.0 million due to higher claims activity. State noncontributory life insurance benefits are funded on a
pay-as-you-go basis. The local contributions for PERS and PFRS are included in the annual billings to local
employers.
The annual local employer pension appropriation billings increased per the actuarial valuation as of July 1, 2015.
For PERS, the amount accrued in State fiscal year 2016 for normal contribution, accrued liability, and NCGI was

STATE OF NEW JERSEY
DIVISION OF PENSIONS AND BENEFITS
Management’s Discussion and Analysis
(Unaudited)
June 30, 2017
7 (Continued)
$888.3 million and was due on April 1, 2017. For State fiscal year 2017, the total amount accrued was
$926.4 million and is due April 1, 2018. For PFRS, the total amount accrued in State fiscal year 2016 for normal
contributions, accrued liability, and NCGI was $815.2 million and was due April 1, 2017. For State fiscal year
2017, the total amount accrued was $885.1 million and is due April 1, 2018.
For the OPEB plan, employer contributions increased by $37.4 million primarily attributable to rate increases
effective January 1, 2017.
The pension trust funds and the OPEB plan earned net investment income of $9.4 billion in fiscal year 2017 as
compared to a net investment loss of $651.2 million for fiscal year 2016.
During fiscal year 2017, a strengthening global economic environment and a pronounced rebound in corporate
earnings led equity markets to strong returns and higher valuations. The U.S. equity market was also buoyed, in
part, by expectations for lower corporate tax rates, deregulation, and increased infrastructure
spending. Emerging market equities outperformed, benefitting from renewed optimism and resilience to weak
commodity prices and heightened geopolitical events.
In contrast, the high quality fixed income market lagged, with U.S. Treasuries realizing negative returns as
interest rates moved higher in conjunction with tighter monetary policy. Investment grade credit fared modestly
better than Treasuries as spreads narrowed. Lower quality fixed income significantly outperformed, rebounding
from a challenging prior year, as high yield bonds realized robust equity-like returns resulting from pronounced
spread compression.
Notwithstanding low cap rates and pressure from rising global bond yields, real estate earned attractive returns,
proving resilient versus higher interest rates. Continued favorable demand for high quality real estate and
relatively low levels of construction kept supply in check as demand for income producing assets persisted in a
moderate growth economy and a low interest rate environment. Private equity exhibited strong performance,
buoyed by robust public equity returns.
In reference to Schedule of Investment Returns – Annual Money-Weighted Rate of Return, Net of Investment
Expense (see Required Supplementary Information Schedule 3), the fiscal year 2017 rate was 13.01% compared
to -1.15% in the prior year. It was based on GASB Statement No. 67, Financial Reporting for Pension Plans – an
Amendment of GASB Statement No. 25 (GASB 67).
Deductions of the pension trust funds and OPEB plan are mainly comprised of pension benefit payments to
retirees and beneficiaries, refunds of contributions to former members, and administrative costs incurred by the
Funds to operate the pension trust funds and the OPEB plan. Also included are claim charges for the self-insured
health and prescription drug benefit programs. Between State fiscal years 2016 and 2017, benefit payments
increased by $411.2 million or 3.8% due to an increase in the number of retirees receiving retirement and other
benefits.
The change in net position was mainly attributable to the increase in net investment income when comparing
State fiscal year 2017 to State fiscal year 2016.

STATE OF NEW JERSEY
DIVISION OF PENSIONS AND BENEFITS
Management’s Discussion and Analysis
(Unaudited)
June 30, 2017
8 (Continued)
Investment Performance
The rates of return (i.e. investment performance, which includes income and changes in the fair value of
investments) for JRS, Prison Officers’ Pension Fund, SPRS, CPFPF, TPAF, PFRS, and PERS, collectively, the
Pension Funds, and various market indices are as follows:
2017 2016
Risk Mitigation 2.33 (1.20)
T-Bill + 300 BP 3.54 3.24
Total Short Term and Cash1
1.08 1.05
91 Day Treasury Bill (Daily) 0.49 0.19
Governments (2.69) 4.42
Custom Government Benchmark (1.97) 5.42
Total Liquidity (0.95) 2.69
Liquidity Benchmark (0.37) 2.14
Investment Grade Credit 0.67 6.57
Custom Investment Grade Credit Benchmark 1.01 7.55
Public High Yield 12.24 2.08
BBG BARC Corp HY (Daily) 12.70 1.62
Global Diversified Credit 25.86 3.32
BBG BARC Corp HY (Daily) 12.70 1.62
Credit-Oriented Hedge Funds 10.13 (1.04)
50 HFRI DR 50 HFRI CA (1 month lag) 13.22 (5.83)
Debt Related Private Equity 9.95 2.00
BarCap Corp HY (1 Qtr lag) + 300 bps 19.92 (0.76)
Debt Related Real Estate 4.15 1.04
Barclays CMBS 2.0 Baa + 100 (Quarter lag) 6.14 (2.01)
Total Income 7.28 3.67
Income Benchmark 7.80 2.27
Real Return Private Real Assets and Commodities 6.86 (4.19)
CA Energy Upst & Royalties & PE Lagged D 22.73 (19.71)
Equity Related Real Estate 8.80 11.97
Real Estate Index 7.36 12.62
Total Real Return 8.23 6.30
Real Return Benchmark 11.12 1.89
US Equity 19.80 (1.58)
S&P 1500 Super Composite (Daily) 18.09 3.64
Non-US Equity Developed Markets Equity 19.02 (9.59)
Custom International Developed Markets Benchmark2
19.59 (9.96)
Emerging Markets Equity 22.69 (10.81)
Custom International Emerging Markets Benchmark2
24.07 (11.77)
Year ended June 30
STATE OF NEW JERSEY
DIVISION OF PENSIONS AND BENEFITS
Management’s Discussion and Analysis
(Unaudited)
June 30, 2017
9 (Continued)
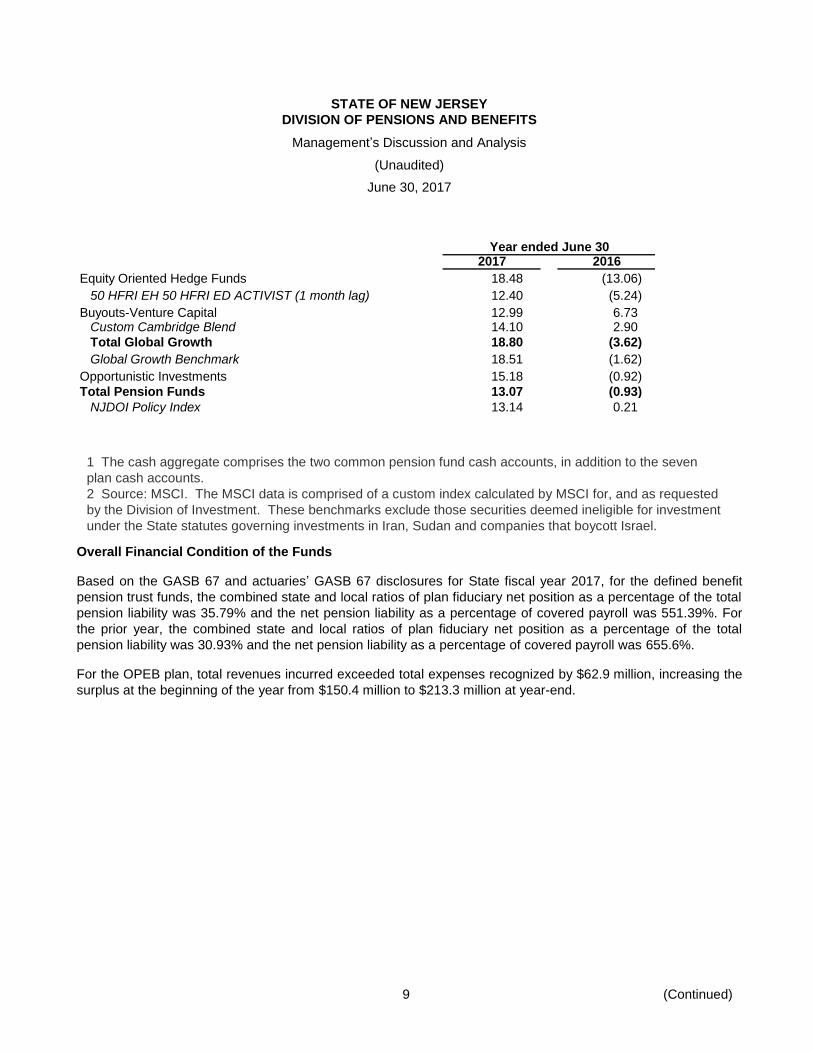
2017 2016
Equity Oriented Hedge Funds 18.48 (13.06)
50 HFRI EH 50 HFRI ED ACTIVIST (1 month lag) 12.40 (5.24)
Buyouts-Venture Capital 12.99 6.73 Custom Cambridge Blend 14.10 2.90
Total Global Growth 18.80 (3.62)
Global Growth Benchmark 18.51 (1.62)
Opportunistic Investments 15.18 (0.92)
Total Pension Funds 13.07 (0.93)
NJDOI Policy Index 13.14 0.21
Year ended June 30
Overall Financial Condition of the Funds
Based on the GASB 67 and actuaries’ GASB 67 disclosures for State fiscal year 2017, for the defined benefit
pension trust funds, the combined state and local ratios of plan fiduciary net position as a percentage of the total
pension liability was 35.79% and the net pension liability as a percentage of covered payroll was 551.39%. For
the prior year, the combined state and local ratios of plan fiduciary net position as a percentage of the total
pension liability was 30.93% and the net pension liability as a percentage of covered payroll was 655.6%.
For the OPEB plan, total revenues incurred exceeded total expenses recognized by $62.9 million, increasing the
surplus at the beginning of the year from $150.4 million to $213.3 million at year-end.
1 The cash aggregate comprises the two common pension fund cash accounts, in addition to the seven
plan cash accounts.
2 Source: MSCI. The MSCI data is comprised of a custom index calculated by MSCI for, and as requested
by the Division of Investment. These benchmarks exclude those securities deemed ineligible for investment
under the State statutes governing investments in Iran, Sudan and companies that boycott Israel.
STATE OF NEW JERSEY
DIVISION OF PENSIONS AND BENEFITS
Management’s Discussion and Analysis
(Unaudited)
June 30, 2017
10
The OPEB plan is subject to the new reporting and disclosure requirements under GASB 74, beginning with the
fiscal year ending June 30, 2017. GASB 74 replaces the GASB Statement No. 43, Accounting and Financial
Reporting by Employers for Postemployment Benefits Other Than Pensions and requires that the plan disclose a
net OPEB liability that will be recognized on the balance sheet of the employers participating in the plan. The
new standard requires the entry age normal actuarial cost method be utilized to determine the total OPEB
liability. It also requires that future OPEB benefit payments be discounted using a discount rate that reflects a
20-year tax-exempt municipal bond yield or index rate if assets are not available to cover such benefit payments.
Based on the June 30, 2017 GASB 74 actuarial report, the net OPEB liability has been measured to be $14.3
billion.
For the New Jersey State Employees Deferred Compensation Plan and the Supplemental Annuity Collective
Trust, members are 100% vested in the present value of their contributions and the funds have sufficient assets
to meet future benefit obligations.
Contacting System Financial Management
This financial report is designed to provide our members, beneficiaries, investors, and other interested parties
with a general overview of the Funds’ finances and to show the Funds’ accountability for the money it receives.
This report is available on the Division of Pensions and Benefits website at www.state.nj.us/treasury/pensions. If
you have any questions about this report or need additional financial information, contact the Division of
Pensions and Benefits, P.O. Box 295, Trenton, NJ 08625-0295.
STATE OF NEW JERSEYDIVISION OF PENSIONS AND BENEFITS
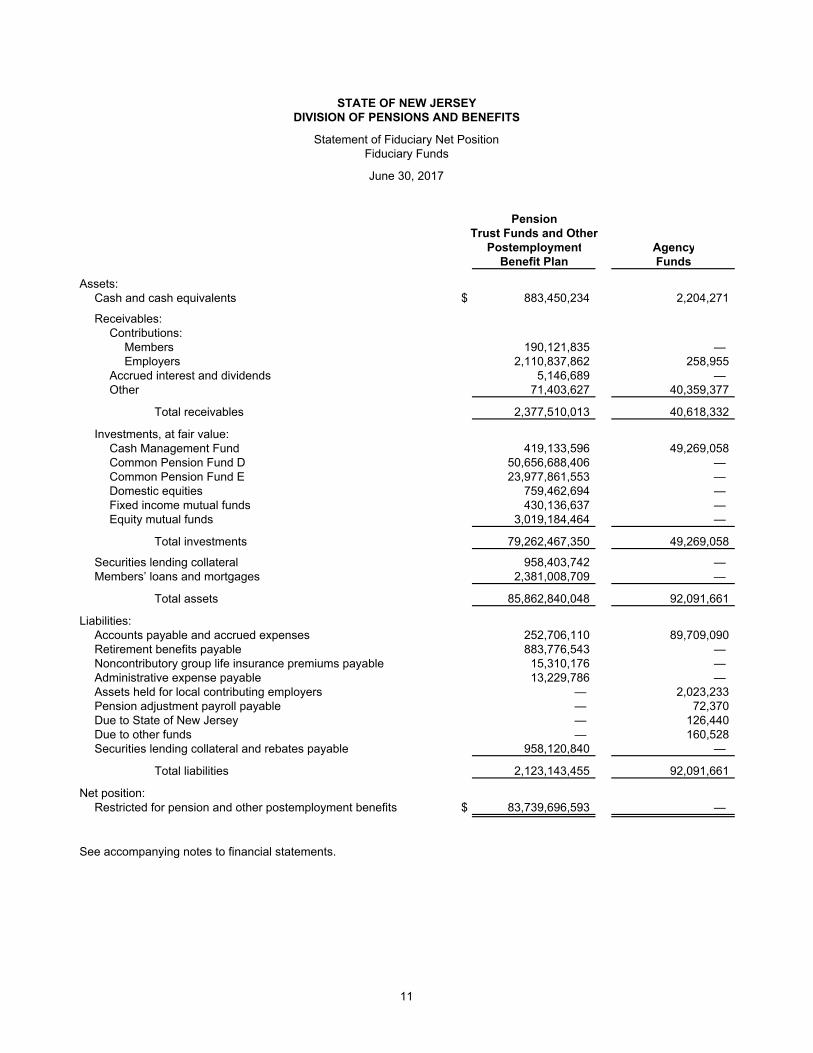
Statement of Fiduciary Net PositionFiduciary Funds
June 30, 2017
PensionTrust Funds and Other
Postemployment AgencyBenefit Plan Funds
Assets:Cash and cash equivalents $ 883,450,234 2,204,271
Receivables:Contributions:
Members 190,121,835 — Employers 2,110,837,862 258,955
Accrued interest and dividends 5,146,689 — Other 71,403,627 40,359,377
Total receivables 2,377,510,013 40,618,332
Investments, at fair value:Cash Management Fund 419,133,596 49,269,058 Common Pension Fund D 50,656,688,406 — Common Pension Fund E 23,977,861,553 — Domestic equities 759,462,694 — Fixed income mutual funds 430,136,637 — Equity mutual funds 3,019,184,464 —
Total investments 79,262,467,350 49,269,058
Securities lending collateral 958,403,742 — Members’ loans and mortgages 2,381,008,709 —
Total assets 85,862,840,048 92,091,661
Liabilities:Accounts payable and accrued expenses 252,706,110 89,709,090 Retirement benefits payable 883,776,543 — Noncontributory group life insurance premiums payable 15,310,176 — Administrative expense payable 13,229,786 — Assets held for local contributing employers — 2,023,233 Pension adjustment payroll payable — 72,370 Due to State of New Jersey — 126,440 Due to other funds — 160,528 Securities lending collateral and rebates payable 958,120,840 —
Total liabilities 2,123,143,455 92,091,661
Net position:Restricted for pension and other postemployment benefits $ 83,739,696,593 —
See accompanying notes to financial statements.
11

Other Postemployment
Benefit PlanConsolidated New Jersey State Health
Prison State Police and Teachers’ Police and Public State Employees Supplemental BenefitJudicial Officers’ Police Firemen’s Pension and Firemen’s Employees’ Central Deferred Annuity Program
Retirement Pension Retirement Pension Annuity Retirement Retirement Pension Compensation Collective FundSystem Fund System Fund Fund System System Fund Plan Trust Local - Retired Total
Assets:Cash and cash equivalents $ 5,000,117 284,097 18,969,604 177,544 353,178,098 196,682,671 307,314,387 36,858 14,231 1,566,373 226,254 883,450,234
Receivables:Contributions:
Members 676,066 — 1,094,446 — 76,505,113 51,842,902 59,619,441 — — 383,867 — 190,121,835 Employers — — 80,304 — 26,569,423 1,032,873,483 1,042,303,973 — — — 9,010,679 2,110,837,862
Accrued interest and dividends 486 17 2,024 26 41,228 4,201,002 35,826 5 641,034 225,041 — 5,146,689 Other 1,307,451 2,507 1,259,094 237,752 12,647,936 7,178,418 22,164,889 — 5,823,311 — 20,782,269 71,403,627
Total receivables 1,984,003 2,524 2,435,868 237,778 115,763,700 1,096,095,805 1,124,124,129 5 6,464,345 608,908 29,792,948 2,377,510,013
Investments, at fair value:Cash Management Fund 3,912,496 5,417,728 13,376,644 1,638,567 61,465,645 46,031,975 38,789,354 2,298 13,116,786 1,314,281 234,067,822 419,133,596 Common Pension Fund D 121,379,434 — 1,175,226,557 — 15,621,176,710 15,613,185,805 18,125,719,900 — — — — 50,656,688,406 Common Pension Fund E 47,103,013 — 553,910,211 — 7,066,359,178 7,640,826,759 8,669,662,392 — — — — 23,977,861,553 Domestic equities — — — — — — — — 536,388,570 223,074,124 — 759,462,694 Fixed income mutual funds — — — — — — — — 430,136,637 — — 430,136,637 Equity mutual funds — — — — — — — — 3,019,184,464 — — 3,019,184,464
Total investments 172,394,943 5,417,728 1,742,513,412 1,638,567 22,749,001,533 23,300,044,539 26,834,171,646 2,298 3,998,826,457 224,388,405 234,067,822 79,262,467,350
Securities lending collateral 2,296,449 — 22,234,804 — 295,546,248 295,395,064 342,931,177 — — — — 958,403,742 Members’ loans and mortgages 511,721 — 15,479,955 — 283,207,356 1,462,285,744 619,523,933 — — — — 2,381,008,709
Total assets 182,187,233 5,704,349 1,801,633,643 2,053,889 23,796,696,935 26,350,503,823 29,228,065,272 39,161 4,005,305,033 226,563,686 264,087,024 85,862,840,048
Liabilities:Accounts payable and accrued
expenses — 1,011 — — 81,688,581 5,988,986 96,699,759 13,107 17,424,654 195,584 50,694,428 252,706,110 Retirement benefits payable 4,515,169 81,006 17,722,568 147,911 355,065,159 196,739,631 309,203,462 26,054 — 275,583 — 883,776,543 Noncontributory group life
insurance premiums payable — — 80,304 — 4,029,942 3,288,170 7,911,760 — — — — 15,310,176 Administrative expense payable 50,960 1,464 105,195 1,482 4,292,415 1,460,768 7,180,823 — — — 136,679 13,229,786 Securities lending collatera
and rebates payable 2,295,771 — 22,228,241 — 295,459,009 295,307,869 342,829,950 — — — — 958,120,840
Total liabilities 6,861,900 83,481 40,136,308 149,393 740,535,106 502,785,424 763,825,754 39,161 17,424,654 471,167 50,831,107 2,123,143,455
Net position:Restricted for pension and otherpostemployment benefits $ 175,325,333 5,620,868 1,761,497,335 1,904,496 23,056,161,829 25,847,718,399 28,464,239,518 — 3,987,880,379 226,092,519 213,255,917 83,739,696,593
See accompanying notes to financial statements.
STATE OF NEW JERSEYDIVISION OF PENSIONS AND BENEFITS
Combining Statement of Fiduciary Net Position
Defined Benefit Pension Plans Defined Contribution Pension Plans
Fiduciary Funds – Pension Trust Funds and Other Postemployment Benefit Plan
June 30, 2017
12

STATE OF NEW JERSEYDIVISION OF PENSIONS AND BENEFITS
Statement of Changes in Fiduciary Net PositionFiduciary Funds
Year ended June 30, 2017
PensionTrust Funds and Other
PostemploymentBenefit Plan
Additions:Contributions:
Members $ 2,322,645,150 Employers 2,925,363,922 Nonemployer 1,265,145,499 Employer specific and other 33,826,150
Total contributions 6,546,980,721
Investment income:Net increase in fair value of investments 7,879,005,318 Interest 1,517,504,211 Dividends 15,758,948
9,412,268,477
Less investment expense 18,636,260
Net investment income 9,393,632,217
Total additions 15,940,612,938
Deductions:Benefits 11,212,724,712 Refunds of contributions 219,513,451 Administrative and miscellaneous expenses 45,489,693
Total deductions 11,477,727,856
Change in net position 4,462,885,082
Net position restricted for pension and other postemployment benefits:Beginning of year, as restated (note 2(k)) 79,276,811,511
End of year $ 83,739,696,593
See accompanying notes to financial statements.
13

Other Postemployment
Benefit PlanConsolidated New Jersey State Health
Prison State Police and Teachers’ Police and Public State Employees Supplemental BenefitJudicial Officers’ Police Firemen’s Pension and Firemen’s Employees’ Central Deferred Annuity Program
Retirement Pension Retirement Pension Annuity Retirement Retirement Pension Compensation Collective FundSystem Fund System Fund Fund System System Fund Plan Trust Local - Retired Total
Additions:Contributions:
Members $ 10,348,191 — 23,721,785 — 790,788,033 395,878,384 847,952,137 — 194,488,684 5,882,431 53,585,505 2,322,645,150 Employers 20,341,379 — 53,006,614 575,000 1,404,292 1,002,043,734 1,465,931,579 248,000 — — 381,813,324 2,925,363,922 Nonemployer — — — — 1,125,614,188 86,467,000 — — — — 53,064,311 1,265,145,499 Employer specific and other 1,121,097 552,131 3,925 964,280 1,696,090 13,107,651 16,358,762 22,214 — — — 33,826,150
Total contributions 31,810,667 552,131 76,732,324 1,539,280 1,919,502,603 1,497,496,769 2,330,242,478 270,214 194,488,684 5,882,431 488,463,140 6,546,980,721
Investment income:Net increase/(decrease) in fair value
of investments 16,847,510 (1,719) 175,221,726 (486) 2,300,089,571 2,304,714,942 2,662,886,052 — 389,170,474 30,076,908 340 7,879,005,318 Interest 3,208,312 34,648 32,328,268 12,685 442,954,741 488,450,683 549,638,114 612 77,593 7,846 790,709 1,517,504,211 Dividends — — — — — — — — 10,417,725 5,341,223 — 15,758,948
20,055,822 32,929 207,549,994 12,199 2,743,044,312 2,793,165,625 3,212,524,166 612 399,665,792 35,425,977 791,049 9,412,268,477
Less investment expense 24,670 2,082 148,404 2,100 6,055,521 2,060,765 10,130,329 — 212,389 — — 18,636,260
Net investment income 20,031,152 30,847 207,401,590 10,099 2,736,988,791 2,791,104,860 3,202,393,837 612 399,453,403 35,425,977 791,049 9,393,632,217
Total additions 51,841,819 582,978 284,133,914 1,549,379 4,656,491,394 4,288,601,629 5,532,636,315 270,826 593,942,087 41,308,408 489,254,189 15,940,612,938
Deductions:Benefits 56,306,453 1,069,209 217,212,067 1,535,623 4,238,076,768 2,413,928,737 3,667,217,598 258,290 183,110,996 16,520,123 417,488,848 11,212,724,712 Refunds of contributions 59,265 — 91,879 — 68,191,977 7,556,700 143,601,094 12,536 — — — 219,513,451 Administrative and miscellaneous
expenses 150,588 4,134 294,745 4,188 11,923,787 4,124,457 19,648,715 — 444,503 — 8,894,576 45,489,693
Total deductions 56,516,306 1,073,343 217,598,691 1,539,811 4,318,192,532 2,425,609,894 3,830,467,407 270,826 183,555,499 16,520,123 426,383,424 11,477,727,856
Change in net position (4,674,487) (490,365) 66,535,223 9,568 338,298,862 1,862,991,735 1,702,168,908 — 410,386,588 24,788,285 62,870,765 4,462,885,082
Net position restricted forpension and other postemploymentbenefits:
Beginning of year, as restated (note 2(k)) 179,999,820 6,111,233 1,694,962,112 1,894,928 22,717,862,967 23,984,726,664 26,762,070,610 — 3,577,493,791 201,304,234 150,385,152 79,276,811,511
End of year $ 175,325,333 5,620,868 1,761,497,335 1,904,496 23,056,161,829 25,847,718,399 28,464,239,518 — 3,987,880,379 226,092,519 213,255,917 83,739,696,593
See accompanying notes to financial statements.
Defined Benefit Pension Plans Defined Contribution Pension Plan
STATE OF NEW JERSEYDIVISION OF PENSIONS AND BENEFITS
Combining Statement of Changes In Fiduciary Net PositionFiduciary Funds – Pension Trust Funds and Other Postemployment Benefit Plan
Year ended June 30, 2017
14

STATE OF NEW JERSEY
DIVISION OF PENSIONS AND BENEFITS
Notes to Financial Statements
June 30, 2017
15 (Continued)
(1) Description of the Plans
(a) Organization
The State of New Jersey, Division of Pensions and Benefits (the Division) was created and exists pursuant to
N.J.S.A. 52:18A to oversee and administer the pension trust funds and other postemployment benefits
(OPEB) plan sponsored by the State of New Jersey (the State). The following is a list of the benefit plans,
which have been included in the basic financial statements of the Division, collectively referred to as the
Plans:
Defined benefit pension plans:
Judicial Retirement System (JRS) Single-employer
Prison Officers’ Pension Fund (POPF) Single-employer
State Police Retirement System (SPRS) Single-employer
Consolidated Police and Firemen’s Pension Fund (CPFPF) Cost-sharing multiple-employer
with special funding situation
Teachers’ Pension and Annuity Fund (TPAF) Cost-sharing multiple-employer
with special funding situation
Police and Firemen’s Retirement System (PFRS) Cost-sharing multiple-employer
with special funding situation
Public Employees’ Retirement System (PERS) Cost-sharing multiple-employer
Central Pension Fund (CPF) Single-employer
Defined contribution pension plans:
New Jersey State Employees Deferred Compensation Plan (NJSEDCP) Single-employer
Supplemental Annuity Collective Trust (SACT) Multiple-employer
Defined benefit other postemployment benefit plan:
State Health Benefit Program Fund - Local Cost-sharing multiple-employer
with special funding situation
Type of PlanPlan Name
The Division oversees the following agency funds:
Pension Adjustment Fund (PAF)
Alternate Benefit Program (ABP)
Dental Expense Program Fund (DEP)
Agency Fund
(b) Defined Benefit Pension Plans
Each defined benefit pension plan’s designated purpose is to provide retirement, death, and disability
benefits to its members. Below is a summary description of each defined benefit pension plan administered
by the Division:
STATE OF NEW JERSEY
DIVISION OF PENSIONS AND BENEFITS
Notes to Financial Statements
June 30, 2017
16 (Continued)
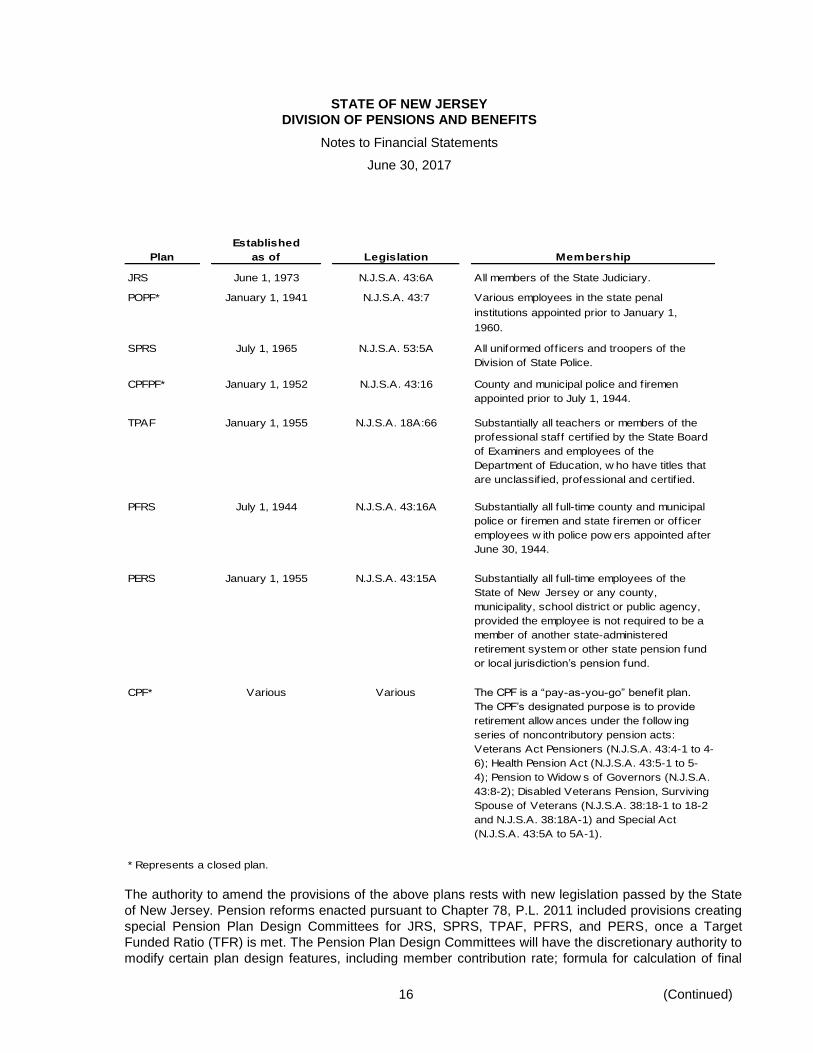
Established
Plan as of Legislation Membership
JRS June 1, 1973 N.J.S.A. 43:6A All members of the State Judiciary.
POPF* January 1, 1941 N.J.S.A. 43:7 Various employees in the state penal
institutions appointed prior to January 1,
1960.
SPRS July 1, 1965 N.J.S.A. 53:5A All uniformed off icers and troopers of the
Division of State Police.
CPFPF* January 1, 1952 N.J.S.A. 43:16 County and municipal police and f iremen
appointed prior to July 1, 1944.
TPAF January 1, 1955 N.J.S.A. 18A:66 Substantially all teachers or members of the
professional staff certif ied by the State Board
of Examiners and employees of the
Department of Education, w ho have titles that
are unclassif ied, professional and certif ied.
PFRS July 1, 1944 N.J.S.A. 43:16A Substantially all full-time county and municipal
police or f iremen and state f iremen or off icer
employees w ith police pow ers appointed after
June 30, 1944.
PERS January 1, 1955 N.J.S.A. 43:15A
CPF* Various Various The CPF is a “pay-as-you-go” benefit plan.
The CPF’s designated purpose is to provide
retirement allow ances under the follow ing
series of noncontributory pension acts:
Veterans Act Pensioners (N.J.S.A. 43:4-1 to 4-
6); Health Pension Act (N.J.S.A. 43:5-1 to 5-
4); Pension to Widow s of Governors (N.J.S.A.
43:8-2); Disabled Veterans Pension, Surviving
Spouse of Veterans (N.J.S.A. 38:18-1 to 18-2
and N.J.S.A. 38:18A-1) and Special Act
(N.J.S.A. 43:5A to 5A-1).
* Represents a closed plan.
Substantially all full-time employees of the
State of New Jersey or any county,
municipality, school district or public agency,
provided the employee is not required to be a
member of another state-administered
retirement system or other state pension fund
or local jurisdiction’s pension fund.
The authority to amend the provisions of the above plans rests with new legislation passed by the State
of New Jersey. Pension reforms enacted pursuant to Chapter 78, P.L. 2011 included provisions creating
special Pension Plan Design Committees for JRS, SPRS, TPAF, PFRS, and PERS, once a Target
Funded Ratio (TFR) is met. The Pension Plan Design Committees will have the discretionary authority to
modify certain plan design features, including member contribution rate; formula for calculation of final
STATE OF NEW JERSEY
DIVISION OF PENSIONS AND BENEFITS
Notes to Financial Statements
June 30, 2017
17 (Continued)
compensation or final salary; fraction used to calculate a retirement allowance; age at which a member
may be eligible and the benefits for service or early retirement; and benefits provided for disability
retirement. The committees will also have the authority to reactivate the cost of living adjustment (COLA)
on pensions. However, modifications can only be made to the extent that the resulting impact does not
cause the funded ratio to drop below the TFR in any one year of a 30-year projection period.
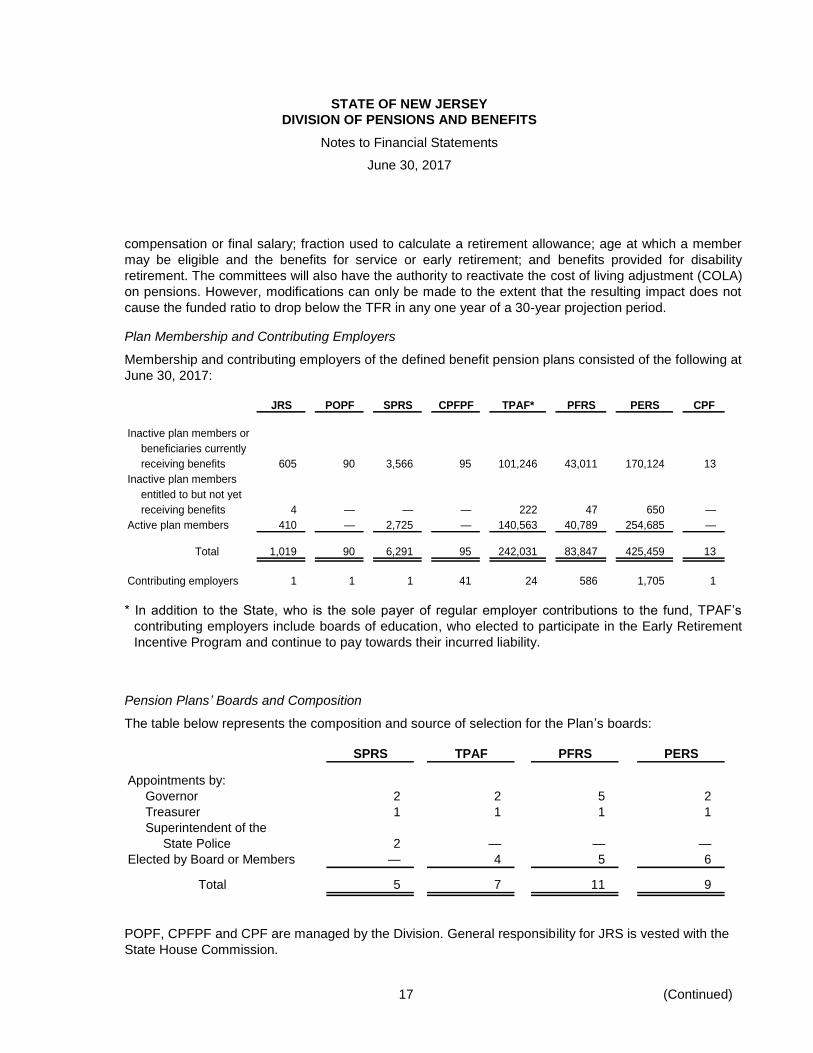
Plan Membership and Contributing Employers
Membership and contributing employers of the defined benefit pension plans consisted of the following at
June 30, 2017:
JRS POPF SPRS CPFPF TPAF* PFRS PERS CPF
Inactive plan members or
beneficiaries currently
receiving benefits 605 90 3,566 95 101,246 43,011 170,124 13
Inactive plan members
entitled to but not yet
receiving benefits 4 — — — 222 47 650 —
Active plan members 410 — 2,725 — 140,563 40,789 254,685 —
Total 1,019 90 6,291 95 242,031 83,847 425,459 13
Contributing employers 1 1 1 41 24 586 1,705 1
* In addition to the State, who is the sole payer of regular employer contributions to the fund, TPAF’s
contributing employers include boards of education, who elected to participate in the Early Retirement
Incentive Program and continue to pay towards their incurred liability.
Pension Plans’ Boards and Composition
The table below represents the composition and source of selection for the Plan’s boards:
SPRS TPAF PFRS PERS
Appointments by:
Governor 2 2 5 2
Treasurer 1 1 1 1
Superintendent of the
State Police 2 — — —
Elected by Board or Members — 4 5 6
Total 5 7 11 9
POPF, CPFPF and CPF are managed by the Division. General responsibility for JRS is vested with the
State House Commission.

STATE OF NEW JERSEY
DIVISION OF PENSIONS AND BENEFITS
Notes to Financial Statements
June 30, 2017
18 (Continued)
Contribution Requirements and Benefit Provisions
Significant Legislation
Chapter 19, P.L. 2009, effective March 17, 2009, provided an option for local employers of PFRS and
PERS to contribute 50% of the normal and accrued liability contribution amounts certified for payments
due in State fiscal year 2009. Such an employer will be credited with the full payment and any such
amounts will not be included in their unfunded liability. The actuaries will determine the unfunded liability
of those retirement systems, by employer, for the reduced normal and accrued liability contributions
provided under this law. This unfunded liability is paid by the employer in level annual payments over a
period of 15 years beginning with fiscal year ended June 30, 2012 and will be adjusted by the rate of
return on the actuarial value of assets.
Pursuant to the provisions of Chapter 78, P.L. 2011, COLA increases were suspended for all current and
future retirees of all retirement systems.
The following are specific contribution requirements and benefit provisions related to each defined
benefit plan:
JRS
The contribution policy is set by N.J.S.A. 43:6A and requires contributions by active members and the
State of New Jersey. Members enrolled on January 1, 1996 or after, contribute on their entire base
salary. Contributions by active members enrolled prior to January 1, 1996 are based on the difference
between their current salary and the salary of the position on January 18, 1982. Pursuant to the
provisions of Chapter 78, P.L. 2011, the active member contribution rate is being increased from 3% to
12%, phased-in over seven years for members hired or reappointed after June 28, 2011. In October
2011, the member contribution rate for new members increased. The phase-in of the additional
incremental member contribution rate takes place in July of each subsequent State fiscal year. The
member contribution rate was 10.7% in State fiscal year 2017. The State’s contribution is based on an
actuarially determined amount, which includes the normal cost and unfunded accrued liability.
The vesting and benefit provisions are set by N.J.S.A. 43:6A. JRS provides retirement benefits as well as
death and disability benefits. Retirement is mandatory at age 70. Service retirement benefits are
available to members who have reached certain ages and various years of service. Benefits of 75% of
final salary are available to members at age 70 with 10 years or more of judicial service; members
between ages 65-69 with 15 years or more of judicial service or between ages 60-64 with 20 years or
more of judicial service. Benefits of 50% of final salary are available to those with both judicial service
and non-judicial service for which five or more consecutive years were judicial service. These benefits
are available at age 65 or older with 15 years or more of aggregate service or age 60 or older with 20
years or more of aggregate service. Benefits of 2% of final salary for each year of public service up to 25
years plus 1% of final salary for each year in excess of 25 years are available at age 60 with five
consecutive years of judicial service plus 15 years in the aggregate of public service or at age 60 while
serving as a judge.
Early retirement benefits of 2% of final salary for each year of service up to 25 years and 1% of final
salary for each year over 25 years is available to members who retire before age 60, have 5 or more
consecutive years of judicial service, and 25 years or more in aggregate public service. The amount of
benefits is actuarially reduced for the number of months remaining until the member reaches age 60.
STATE OF NEW JERSEY
DIVISION OF PENSIONS AND BENEFITS
Notes to Financial Statements
June 30, 2017
19 (Continued)
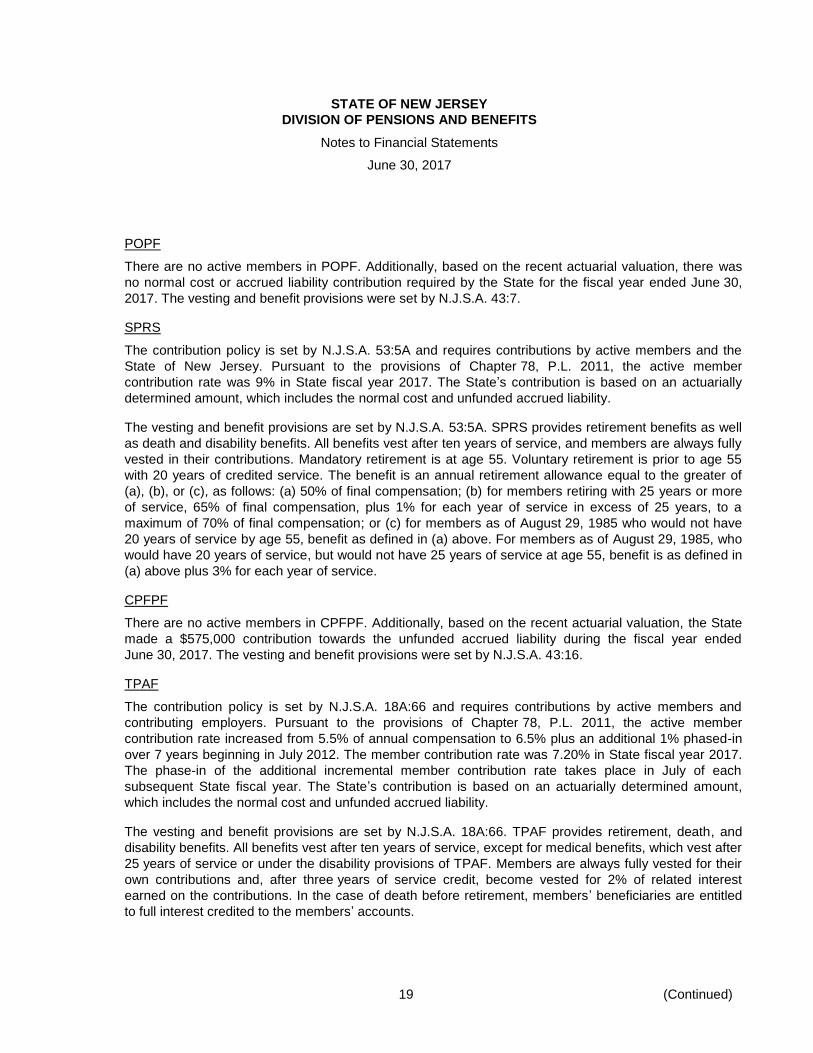
POPF
There are no active members in POPF. Additionally, based on the recent actuarial valuation, there was
no normal cost or accrued liability contribution required by the State for the fiscal year ended June 30,
2017. The vesting and benefit provisions were set by N.J.S.A. 43:7.
SPRS
The contribution policy is set by N.J.S.A. 53:5A and requires contributions by active members and the
State of New Jersey. Pursuant to the provisions of Chapter 78, P.L. 2011, the active member
contribution rate was 9% in State fiscal year 2017. The State’s contribution is based on an actuarially
determined amount, which includes the normal cost and unfunded accrued liability.
The vesting and benefit provisions are set by N.J.S.A. 53:5A. SPRS provides retirement benefits as well
as death and disability benefits. All benefits vest after ten years of service, and members are always fully
vested in their contributions. Mandatory retirement is at age 55. Voluntary retirement is prior to age 55
with 20 years of credited service. The benefit is an annual retirement allowance equal to the greater of
(a), (b), or (c), as follows: (a) 50% of final compensation; (b) for members retiring with 25 years or more
of service, 65% of final compensation, plus 1% for each year of service in excess of 25 years, to a
maximum of 70% of final compensation; or (c) for members as of August 29, 1985 who would not have
20 years of service by age 55, benefit as defined in (a) above. For members as of August 29, 1985, who
would have 20 years of service, but would not have 25 years of service at age 55, benefit is as defined in
(a) above plus 3% for each year of service.
CPFPF
There are no active members in CPFPF. Additionally, based on the recent actuarial valuation, the State
made a $575,000 contribution towards the unfunded accrued liability during the fiscal year ended
June 30, 2017. The vesting and benefit provisions were set by N.J.S.A. 43:16.
TPAF
The contribution policy is set by N.J.S.A. 18A:66 and requires contributions by active members and
contributing employers. Pursuant to the provisions of Chapter 78, P.L. 2011, the active member
contribution rate increased from 5.5% of annual compensation to 6.5% plus an additional 1% phased-in
over 7 years beginning in July 2012. The member contribution rate was 7.20% in State fiscal year 2017.
The phase-in of the additional incremental member contribution rate takes place in July of each
subsequent State fiscal year. The State’s contribution is based on an actuarially determined amount,
which includes the normal cost and unfunded accrued liability.
The vesting and benefit provisions are set by N.J.S.A. 18A:66. TPAF provides retirement, death, and
disability benefits. All benefits vest after ten years of service, except for medical benefits, which vest after
25 years of service or under the disability provisions of TPAF. Members are always fully vested for their
own contributions and, after three years of service credit, become vested for 2% of related interest
earned on the contributions. In the case of death before retirement, members’ beneficiaries are entitled
to full interest credited to the members’ accounts.

STATE OF NEW JERSEY
DIVISION OF PENSIONS AND BENEFITS
Notes to Financial Statements
June 30, 2017
20 (Continued)
The following represents the membership tiers for TPAF:
Tier Definition
1 Members who were enrolled prior to July 1, 2007
2 Members who were eligible to enroll on or after July 1, 2007 and prior to November 2, 2008
3 Members who were eligible to enroll on or after November 2, 2008 and prior to May 22, 2010
4 Members who were eligible to enroll on or after May 22, 2010 and prior to June 28, 2011
5 Members who were eligible to enroll on or after June 28, 2011
Service retirement benefits of 1/55th of final average salary for each year of service credit is available to
tiers 1 and 2 members upon reaching age 60 and to tier 3 members upon reaching age 62. Service
retirement benefits of 1/60th of final average salary for each year of service credit is available to tier 4
members upon reaching age 62 and tier 5 members upon reaching age 65. Early retirement benefits are
available to tiers 1 and 2 members before reaching age 60, tiers 3 and 4 with 25 years or more of service
credit before age 62, and tier 5 before age 65 with 30 years or more of service credit. Benefits are
reduced by a fraction of a percent for each month that a member retires prior to the retirement age for
his/her respective tier. Deferred retirement is available to members who have at least 10 years of service
credit and have not reached the service retirement age for the respective tier.
PFRS
The contribution policy is set by N.J.S.A. 43:16A and requires contributions by active members and
contributing employers. Pursuant to the provisions of Chapter 78, P.L. 2011, the active member
contribution rate was 10% in State fiscal year 2017. Employers’ contributions are based on an actuarially
determined amount, which includes the normal cost and unfunded accrued liability.
The vesting and benefit provisions are set by N.J.S.A. 43:16A. PFRS provides retirement as well as
death and disability benefits. All benefits vest after ten years of service, except disability benefits, which
vest after four years of service.
The following represents the membership tiers for PFRS:
Tier Definition
1 Members who were enrolled prior to May 22, 2010
2 Members who were eligible to enroll on or after May 22, 2010 and prior to June 28, 2011
3 Members who were eligible to enroll on or after June 28, 2011
Service retirement benefits are available at age 55 and are generally determined to be 2% of final
compensation for each year of creditable service up to 30 years plus 1% for each year of service in
excess of 30 years. Members may seek special retirement after achieving 25 years of creditable service,
in which benefits would equal 65% (tiers 1 and 2 members) and 60% (tier 3 members) of final
compensation plus 1% for each year of creditable service over 25 years, but not to exceed 30 years.
Members may elect deferred retirement benefits after achieving ten years of service, in which case
benefits would begin at age 55 equal to 2% of final compensation for each year of service.

STATE OF NEW JERSEY
DIVISION OF PENSIONS AND BENEFITS
Notes to Financial Statements
June 30, 2017
21 (Continued)
PERS
The contribution policy is set by N.J.S.A. 43:15A and requires contributions by active members and
contributing employers. Pursuant to the provisions of Chapter 78, P.L. 2011, the active member
contribution rate increased from 5.5% of annual compensation to 6.5% plus an additional 1% phased-in
over 7 years beginning in July 2012. The member contribution rate was 7.20% in State fiscal year 2017.
The phase-in of the additional incremental member contribution rate takes place in July of each
subsequent State fiscal year. The rate for members who are eligible for the Prosecutors Part of PERS
(Chapter 366, P.L. 2001) was 10% in State fiscal year 2017. Employers’ contributions are based on an
actuarially determined amount, which includes the normal cost and unfunded accrued liability.
The vesting and benefit provisions are set by N.J.S.A. 43:15A. PERS provides retirement, death, and
disability benefits. All benefits vest after ten years of service, except for medical benefits, which vest after
25 years of service or under the disability provisions of PERS.
The following represents the membership tiers for PERS:
Tier Definition
1 Members who were enrolled prior to July 1, 2007
2 Members who were eligible to enroll on or after July 1, 2007 and prior to November 2, 2008
3 Members who were eligible to enroll on or after November 2, 2008 and prior to May 22, 2010
4 Members who were eligible to enroll on or after May 22, 2010 and prior to June 28, 2011
5 Members who were eligible to enroll on or after June 28, 2011
Service retirement benefits of 1/55th of final average salary for each year of service credit is available to
tiers 1 and 2 members upon reaching age 60 and to tier 3 members upon reaching age 62. Service
retirement benefits of 1/60th of final average salary for each year of service credit is available to tier 4
members upon reaching age 62 and tier 5 members upon reaching age 65. Early retirement benefits are
available to tiers 1 and 2 members before reaching age 60, tiers 3 and 4 with 25 years or more of service
credit before age 62, and tier 5 with 30 years or more of service credit before age 65. Benefits are
reduced by a fraction of a percent for each month that a member retires prior to the age at which a
member can receive full early retirement benefits in accordance with their respective tier. Tier 1
members can receive an unreduced benefit from age 55 to age 60 if they have at least 25 years of
service. Deferred retirement is available to members who have at least 10 years of service credit and
have not reached the service retirement age for the respective tier.
CPF
The State of New Jersey makes an annual appropriation payment to CPF to pay current year benefits.
The contribution requirements were established by the statutes mentioned in the previous table and are
not actuarially determined.
Benefits are payable under various State of New Jersey legislation in an amount equal to one-half of the
compensation received by the participant for his/her service.

STATE OF NEW JERSEY
DIVISION OF PENSIONS AND BENEFITS
Notes to Financial Statements
June 30, 2017
22 (Continued)
(c) Defined Contribution Pension Plans
The Division administers the following defined contribution plans to certain members as further
discussed below:
Established
Plan as of Legislation Membership
NJSEDCP June 19, 1978 Chapter 39, P.L. 1978,
amended by Chapter 449,
P.L. 1985, effective January
14, 1986, and further
amended by Chapter 116,
P.L. 1997, effective June 6,
1997
Any state employee who is a member of a state-
administered retirement system or an employee of
an eligible state agency, authority, commission or
instrumentality of state government provided the
employee has at least 12 continuous months of
employment, and any individual employed through a
Governor’s appointment.
SACT 1963 Chapter 123, P.L. 1963,
amended by Chapter 90, P.L.
1965
Active members of several state-administered
retirement systems to provide specific benefits to
supplement the guaranteed benefits that are
provided by their basic retirement system.
Plan Membership
At June 30, 2017, membership in the defined contribution pension plans consisted of the following based
on the information within the Division’s database:
Plan Members
NJSEDCP 53,019
SACT 3,025
Contribution Requirements and Benefit Provisions
NJSEDCP
Participants may defer between 1% and 100% of their salary, less any Internal Revenue Code (IRC)
Section 414(h) reductions, or $18,000 annually. Under the limited “catch-up” provision, a participant may
be eligible to defer up to a maximum of twice the annual maximum in the three years immediately
preceding the retirement age at which no reduction in benefits would be applicable.
There are no employer or nonemployer entities that are required to contribute to the plan.
Assets in the plan are held in trust for the exclusive benefit of plan members and their beneficiaries in
accordance with GASB Statement No. 32, Accounting and Financial Reporting for Internal Revenue
Code Section 457 Deferred Compensation Plans. Plan members are fully vested for the current valuation
of their account from the date of enrollment in the plan. Benefits are payable upon separation from
service with the State of New Jersey.
STATE OF NEW JERSEY
DIVISION OF PENSIONS AND BENEFITS
Notes to Financial Statements
June 30, 2017
23 (Continued)
SACT
Participants contribute through payroll deductions and may contribute from 1% to 100% of their base
salary. Contributions are voluntary and may be suspended at the beginning of any quarter. Contributions
under the Tax Sheltered Supplemental Annuity Plan are subject to Federal law limitations and qualify for
tax-sheltered treatment permitted under Section 403(b) of the IRC. Participants are always fully vested
for the accumulated units in their accounts.
Upon retirement, a participant receives a life annuity benefit or may elect to receive a benefit paid as a
single cash payment or various forms of monthly annuity payments with a beneficiary provision based on
the value of the participant’s account in the month of retirement. Upon the death of a participant, the
designated beneficiary may elect to receive a lump sum equal to the account value or an annuity under
any of the settlement options, which a retiree could elect under SACT. Upon termination of employment
and withdrawal from the basic retirement systems, a participant must also withdraw his/her account
under SACT as a lump-sum settlement.
(d) Other Postemployment Benefit Plan
The Division administers the State Health Benefits Program Fund – Local OPEB plan. The plan was
established in 1961 under Title 52 Article 14 – 17.25 et. seq. and offers medical and prescription
coverage to qualified local government public retirees and their spouses. Local employers must adopt a
resolution to participate. The OPEB plan is overseen by the State Health Benefits Commission (the
Commission), which was established by NJSA 52:14-17.27. The Commission reviews any member
appeals related to member eligibility, benefit or claim denial, and benefit payments for the medical and
prescription drug claims. They also have contracting authority for vendors to administer the medical and
prescription drug programs as well as the health benefit consultant and actuary. Further, they approve
the premiums for the various plans on an annual basis. The Commission is comprised of one
representative each from the Office of the Treasurer, Department of Banking and Insurance, Civil
Service Commission, State Employee Union, and Local Employee Union.
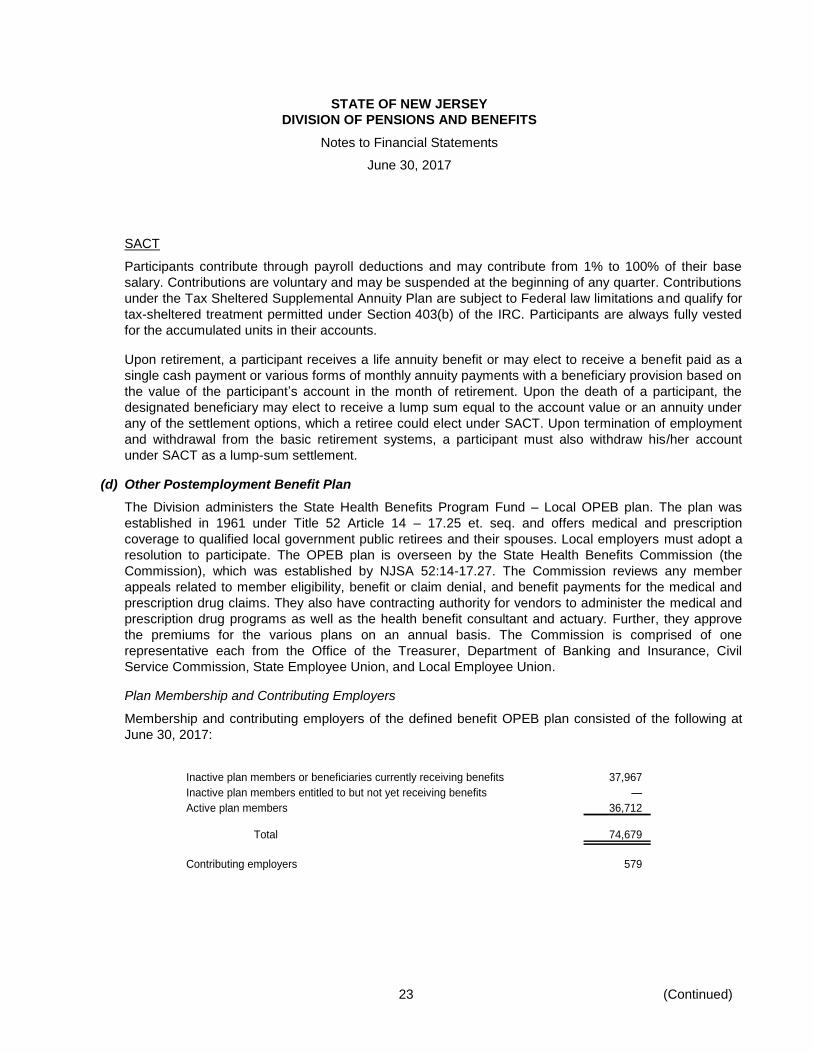
Plan Membership and Contributing Employers
Membership and contributing employers of the defined benefit OPEB plan consisted of the following at
June 30, 2017:
Inactive plan members or beneficiaries currently receiving benefits 37,967
Inactive plan members entitled to but not yet receiving benefits —
Active plan members 36,712
Total 74,679
Contributing employers 579

STATE OF NEW JERSEY
DIVISION OF PENSIONS AND BENEFITS
Notes to Financial Statements
June 30, 2017
24 (Continued)
Contribution Requirements and Benefit Provisions
The funding policy for the OPEB plan is pay-as-you-go; therefore, there is no prefunding of the liability.
However, due to premium rates being set prior to each calendar year, there is a minimal amount of net
position available to cover benefits in future years. Contributions to pay for the health benefit premiums
of participating employees in the OPEB plan are collected from the State of New Jersey, participating
local employers, and retired members. The State of New Jersey makes contributions to cover those
employees eligible under Chapter 330, P.L. 1967, as disclosed below. Local employers remit employer
contributions on a monthly basis. Retired member contributions are generally received on a monthly
basis.
The employers participating in the OPEB plan made a contribution of $381.8 million and the State of
New Jersey, as the non-employer contributing entity, contributed $53.1 million for fiscal year 2017.
Pursuant to Chapter 78, P.L, 2011, future retirees eligible for postretirement medical coverage who have
less than 20 years of creditable service on June 28, 2011 will be required to pay a percentage of the cost
of their health care coverage in retirement provided they retire with 25 or more years of pension service
credit. The percentage of the premium for which the retiree will be responsible will be determined based
on the retiree’s annual retirement benefit and level of coverage.
Partially funded benefits are also available to local police officers and firefighters who retire with 25 years
of service or on disability from an employer who does not provide coverage under the provisions of
Chapter 330, P.L. 1997. Upon retirement, these individuals must enroll in the OPEB plan.
(e) Agency Funds
The Division oversees PAF, ABP and DEP as agency funds. For PAF, the Division utilizes the annual
appropriation payment from the State to pay the cost of living adjustment (COLA) benefits to retirees and
beneficiaries of POPF, CPFPF and CPF. For ABP, the Division collects from the State, the contributions
related to the employer portion of the plan and remits it to the pension providers (insurance and mutual
fund companies) on behalf of the participating employees at the State and county colleges. For DEP, the
Division receives employer contributions from the State and local employers and from active and retired
employees to pay premiums to the plan.
(2) Summary of Significant Accounting Policies
(a) Reporting Entity
The financial statements include all funds, which are administered by the Division over which operating
controls are with the individual Plan’s governing Boards and/or the State of New Jersey. The financial
statements of the Plans and the agency funds are included in the financial statements of the State of
New Jersey; however, the accompanying financial statements are intended to present solely the funds
listed above, which are administered by the Division and not the State of New Jersey as a whole.
(b) Measurement Focus and Basis of Accounting
The accompanying financial statements were prepared in accordance with U.S. generally accepted
accounting principles as applicable to governmental organizations. In doing so, the Division adheres to
reporting requirements established by the Governmental Accounting Standards Board (GASB).

STATE OF NEW JERSEY
DIVISION OF PENSIONS AND BENEFITS
Notes to Financial Statements
June 30, 2017
25 (Continued)
The accrual basis of accounting is used for measuring financial position and changes in net position of
the pension trust funds and other postemployment benefit plan. Under this method, contributions are
recorded in the accounting period in which they are legally due from the employer or plan member, and
deductions are recorded at the time the liabilities are due and payable in accordance with the terms of
each plan. The accounts of the Division are organized and operated on the basis of funds. All funds are
accounted for using an economic resources measurement focus.
Fiduciary Funds
The Division reports the following types of funds:
Pension trust funds and other postemployment benefit plan – Account for monies received for, expenses
incurred by and the net position available for plan benefits of the various public employee retirement
systems and an OPEB plan. The pension trust funds include JRS, POPF, SPRS, CPFPF, TPAF, PFRS,
PERS, CPF, NJSEDCP, and SACT.
Agency funds – Agency funds are used to account for the assets that the Division holds on behalf of
others as their agent. Agency funds are custodial in nature and do not involve measurement of results of
operations.
(c) Receivables
Receivables consist primarily of member and employer contributions and other amounts that are legally
required to be due to the Plans.
(d) Capital Assets
Capital assets utilized by the Division include equipment, which is owned and paid for by the State of
New Jersey.
(e) Investments
The Division of Investment, Department of the Treasury, State of New Jersey (Division of Investment)
manages and invests certain assets of seven of the defined benefit pension plans (JRS, POPF, SPRS,
CPFPF, TPAF, PFRS and PERS) and two defined contribution pension plans (SACT and certain
accounts in NJSEDCP). Accounts managed by the Division of Investment included in the Division of
Pensions and Benefits report are: Common Pension Fund D and Common Pension Fund E (collectively
known as the Common Pension Funds), and other investments owned directly by the seven defined
benefit pension plans. Common Pension Fund D invests primarily in global equity and fixed income
securities. Common Pension Fund E invests primarily in global diversified credit funds and alternative
investments, which includes private equity, real estate, real asset, and absolute return strategy funds.
In addition, the Division of Investment manages the State of New Jersey Cash Management Fund
(CMF), which is available on a voluntary basis for investment by State and certain non-State participants.
CMF is considered to be an investment trust fund as defined in GASB Statement No. 31, Certain
Investments and External Investment Pools. Units of ownership in CMF may be purchased or redeemed
on any given business day (excluding State holidays) at the unit cost or value of $1.00. Participant
shares are valued on a fair value basis. For additional information about CMF, refer to the audited
STATE OF NEW JERSEY
DIVISION OF PENSIONS AND BENEFITS
Notes to Financial Statements
June 30, 2017
26 (Continued)
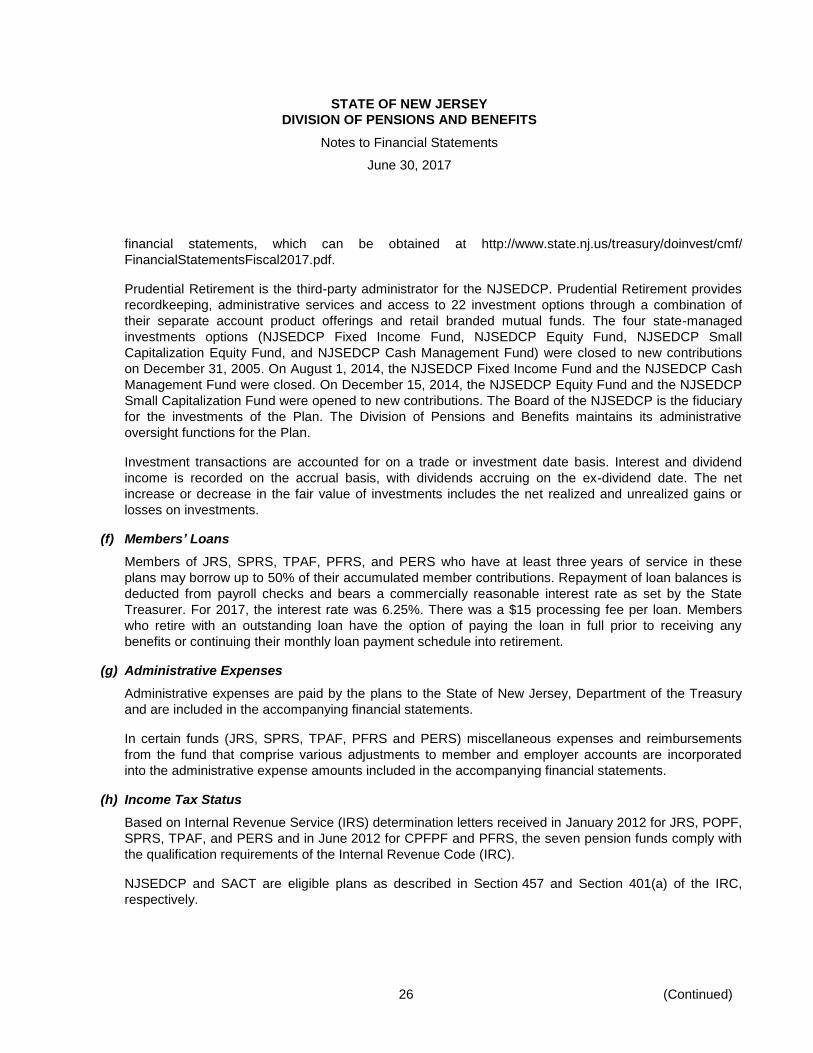
financial statements, which can be obtained at http://www.state.nj.us/treasury/doinvest/cmf/
FinancialStatementsFiscal2017.pdf.
Prudential Retirement is the third-party administrator for the NJSEDCP. Prudential Retirement provides
recordkeeping, administrative services and access to 22 investment options through a combination of
their separate account product offerings and retail branded mutual funds. The four state-managed
investments options (NJSEDCP Fixed Income Fund, NJSEDCP Equity Fund, NJSEDCP Small
Capitalization Equity Fund, and NJSEDCP Cash Management Fund) were closed to new contributions
on December 31, 2005. On August 1, 2014, the NJSEDCP Fixed Income Fund and the NJSEDCP Cash
Management Fund were closed. On December 15, 2014, the NJSEDCP Equity Fund and the NJSEDCP
Small Capitalization Fund were opened to new contributions. The Board of the NJSEDCP is the fiduciary
for the investments of the Plan. The Division of Pensions and Benefits maintains its administrative
oversight functions for the Plan.
Investment transactions are accounted for on a trade or investment date basis. Interest and dividend
income is recorded on the accrual basis, with dividends accruing on the ex-dividend date. The net
increase or decrease in the fair value of investments includes the net realized and unrealized gains or
losses on investments.
(f) Members’ Loans
Members of JRS, SPRS, TPAF, PFRS, and PERS who have at least three years of service in these
plans may borrow up to 50% of their accumulated member contributions. Repayment of loan balances is
deducted from payroll checks and bears a commercially reasonable interest rate as set by the State
Treasurer. For 2017, the interest rate was 6.25%. There was a $15 processing fee per loan. Members
who retire with an outstanding loan have the option of paying the loan in full prior to receiving any
benefits or continuing their monthly loan payment schedule into retirement.
(g) Administrative Expenses
Administrative expenses are paid by the plans to the State of New Jersey, Department of the Treasury
and are included in the accompanying financial statements.
In certain funds (JRS, SPRS, TPAF, PFRS and PERS) miscellaneous expenses and reimbursements
from the fund that comprise various adjustments to member and employer accounts are incorporated
into the administrative expense amounts included in the accompanying financial statements.
(h) Income Tax Status
Based on Internal Revenue Service (IRS) determination letters received in January 2012 for JRS, POPF,
SPRS, TPAF, and PERS and in June 2012 for CPFPF and PFRS, the seven pension funds comply with
the qualification requirements of the Internal Revenue Code (IRC).
NJSEDCP and SACT are eligible plans as described in Section 457 and Section 401(a) of the IRC,
respectively.

STATE OF NEW JERSEY
DIVISION OF PENSIONS AND BENEFITS
Notes to Financial Statements
June 30, 2017
27 (Continued)
(i) Commitments
Common Pension Fund E is obligated, under certain private equity, real estate, real asset, absolute
return strategy, and global diversified credit fund agreements to make additional capital contributions up
to contractual levels over the investment period specified for each investment. As of June 30, 2017,
Common Pension Fund E had unfunded commitments totaling approximately $10.1 billion.
(j) Use of Estimates
The preparation of financial statements in conformity with U.S. generally accepted accounting principles
requires management to make significant estimates and assumptions that affect the reported amounts of
assets and liabilities and disclosures of contingent assets and liabilities at the date of the financial
statements, as well as the reported amounts of revenue and expenses during the reporting period.
Actual results could differ from those estimates.
(k) Adoption of Accounting Pronouncements
The Division adopted GASB Statement No. 74, Financial Reporting for Postemployment Benefit Plans
Other than Pension Plans (GASB Statement No. 74). GASB Statement No. 74 established new
accounting and financial reporting requirements for governments whose employees are provided with
OPEB as well as certain nonemployer governments that have a legal obligation to provide financial
support for OPEB provided to the employees of other entities. GASB Statement No. 74 includes OPEB
plans that are administered through a trust or equivalent arrangement that meets certain criteria: a)
contributions from employers and nonemployer contributing entities to the plan and earnings on those
contributions are irrevocable; b) plan assets are dedicated to providing OPEB to plan members in
accordance with the benefit terms; and c) plan assets are legally protected from creditors. While the
adoption of GASB Statement No. 74 determined the requirements for financial accounting, reporting and
disclosures, it does not impact the funding of the plans, which is determined by State statute.
In connection with the implementation of GASB Statement No. 74, the Division reevaluated the plans
included in the statement of fiduciary activities and determined that certain plans are not administered
through qualified trusts and do not meet equivalent arrangement criteria as defined above, therefore
should not be reported in the fiduciary activities of the Division. As such, the adoption of GASB 74
resulted in the following adjustment:
Net position restricted for pension and other postemployment benefits:
Beginning of year, as previously reported $ 79,228,529,236
Adjustment as result of the adoption of GASB Statement No. 74 48,282,275
Net position restricted for pension and other postemployment benefits:
Beginning of year, as restated $ 79,276,811,511

STATE OF NEW JERSEY
DIVISION OF PENSIONS AND BENEFITS
Notes to Financial Statements
June 30, 2017
28 (Continued)
(3) Employers’ Net Pension Liability – Defined Benefit Plans
Components of Net Pension Liability
The components of the net pension liability of the participating employers for the defined benefit plans at
June 30, 2017 are as follows:
JRS POPF SPRS CPFPF TPAF PFRS PERS
Total pension liability $ 937,395,995 6,477,263 5,124,274,114 7,396,613 90,726,371,000 47,410,721,738 77,388,263,903
Plan fiduciary net
position 175,325,333 5,620,868 1,761,497,335 1,904,496 23,056,161,829 25,847,718,399 28,464,239,518
Net pension liability $ 762,070,662 856,395 3,362,776,779 5,492,117 67,670,209,171 21,563,003,339 48,924,024,385
Plan fiduciary net
position as a
percentage of
the total pension
liability 18.70% 86.78% 34.38% 25.75% 25.41% 54.52% 36.78%
The total pension liability was determined by actuarial valuations as of July 1, 2016, which was rolled forward to
June 30, 2017, using the following actuarial assumptions, applied to all periods in the measurement:
JRS POPF SPRS CPFPF TPAF PFRS PERS
Inflation rate 2.25% 2.25% 2.25% 2.25% 2.25% 2.25% 2.25%
Salary increases:
Initial f iscal year applied
through 2025 N/A 2025 N/A * 2026 2026
Rate 2.00% N/A 2.95% N/A * 2.10 - 8.98% 1.65 to 4.15%
based on age based on age
Thereafter 3.00% N/A 3.95% N/A * 3.10 - 9.98% 2.65 - 5.15%
based on age based on age
Long-term expected rate of return 7.00% 1.00% 7.00% 1.00% 7.00% 7.00% 7.00%
Period of actuarial experience July 1, 2011 - N/A July 1, 2011 - N/A July 1, 2012 - July 1, 2010 - July 1, 2011 -
study upon w hich actuarial June 30, 2014 June 30, 2014 June 30, 2015 June 30, 2013 June 30, 2014
assumptions w ere based
N/A - This is a closed plan, therefore there are no active employees.
* - Salary increases are various based on experience and the valuation year.

STATE OF NEW JERSEY
DIVISION OF PENSIONS AND BENEFITS
Notes to Financial Statements
June 30, 2017
29 (Continued)
The following table represents the mortality table and improvement assumptions used:
Plan Pre-retirement mortality Post-retirement mortality Disability
JRS RP-2000 Combined Healthy Male and RP-2000
Combined Healthy Female Mortality Tables
(unadjusted for males and set forward 3 years for
females) projected on a generational basis from
the base year of 2000 to 2013 using Projection
Scale BB for the base tables. The base tables
are projected beyond the base year using the
plan actuary's modified MP-2014 projection
scale.
RP-2000 Combined Healthy Mortality Tables
(unadjusted for males and set forward 3 years for
females) for service retirement and beneficiaries
of former members projected on a generational
basis from the base year of 2000 to 2013 using
Projection Scale BB for the base tables. The
base tables are projected beyond the base year
using the plan actuary's modified MP-2014
projection scale.
RP-2000 Disability Mortality Tables (set forward
2 years for males and females) are used to value
disabled retirees.
POPF Not applicable as there are no active members. RP-2000 Combined Healthy Mortality Tables
projected on a generational basis from the base
year of 2000 to 2014 using Projection Scale BB
as the base tables and the tables are further
projected beyond the valuation date using the
plan actuary's modified 2014 projection scale.
RP-2000 disabled retiree mortality table is used
for the period after disability retirement.
SPRS RP-2000 Combined Healthy Male (set back 3
years) and RP-2000 Combined Healthy Female
Mortality Tables projected on a generational
basis from the base year of 2000 to 2013 using
Projection Scale BB as the base table. The base
tables are further projected using the plan
actuary's modified MP-2014 projection scale.
RP-2000 Combined Healthy Male (set back 3
years) and RP-2000 Combined Healthy Female
Mortality tables projected on a generational basis
from the base year of 2000 to 2013 using
Projection Scale BB. The base tables are further
projected beyond the valuation date using the
plan actuary's modified MP-2014 projection
scale.
RP-2000 Combined Healthy Male (set forward 5
years) and RP-2000 Combined Healthy Female
Mortality (set forward 5 years) tables.
CPFPF Not applicable as there are no active members. RP-2000 Combined Healthy Mortality Tables
projected on a generational basis from the base
year of 2000 to 2014 using Projection Scale BB
as the base tables.
Special mortality tables are used for the period
after disability retirement with no provisions made
for mortality improvement after the valuation date.

STATE OF NEW JERSEY
DIVISION OF PENSIONS AND BENEFITS
Notes to Financial Statements
June 30, 2017
30 (Continued)
Plan Pre-retirement mortality Post-retirement mortality Disability
TPAF Based on experience of TPAF members
reflecting mortality improvement on a
generational basis based on a 60-year average of
Social Security data from 1953 to 2013.
Based on experience of TPAF members
reflecting mortality improvement on a
generational basis based on a 60-year average of
Social Security data from 1953 to 2013.
Based on experience of TPAF members
reflecting mortality improvement on a
generational basis based on a 60-year average of
Social Security data from 1953 to 2013.
PFRS RP2000 Employee Preretirement mortality tables
projected thirteen-years using Projection Scale
BB and then projected on a generational basis
using the plan actuary's modified 2014 projection
scales.
RP-2000 Combined Healthy Mortality Tables
projected one year using Projection Scale AA
and three years using the plan actuary's modified
2014 Projection Scales is the base table for male
service retirements and are further projected on a
generational basis using the plan actuary's
modified 2014 Projection Scales. RP-2000
Combined Healthy Mortality Tables projected
thirteen-years using Projection Scale BB and
then three years projected using the plan
actuary's modified 2014 Projection Scales is the
base table for female service retirements and
beneficiaries and are further projected on a
generational basis using the plan actuary's
modified 2014 projection scales.
Special mortality tables are used for the period
after disability retirement.
PERS RP-2000 Employee Preretirement Mortality Table
for male and female active participants. For
State, mortality tables are set back 4 years for
males and 4 years for females. For employees of
Local employers, mortality tables are set back 2
years for males and 7 years for females. In
addition, the tables provide for future
improvements in mortality from the base year of
2013 using a generational approach based on the
plan actuary's modified MP-2014 projection
scale.
RP-2000 Combined Healthy Male and Female
Mortality Tables (set back 1 year for males and
females) for service retirement and beneficiaries
of former members and a one year static
projection based on mortality improvement Scale
AA. In addition, the tables for service retirement
and beneficiaries of former members provide for
future improvements in mortality from the base
year of 2013 using a generational approach
based on the plan actuary's modified MP-2014
projection scale.
RP-2000 Disabled Mortality Tables (set back 3
years for males and set forward 1 year for
females).
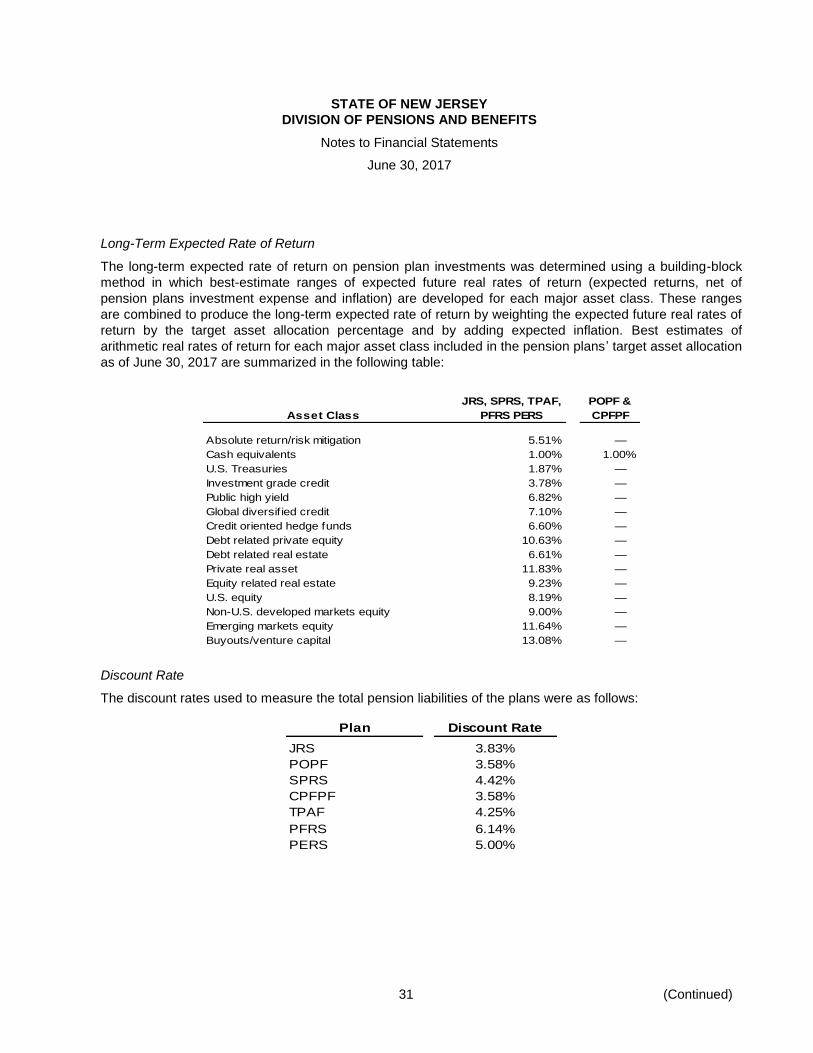
STATE OF NEW JERSEY
DIVISION OF PENSIONS AND BENEFITS
Notes to Financial Statements
June 30, 2017
31 (Continued)
Long-Term Expected Rate of Return
The long-term expected rate of return on pension plan investments was determined using a building-block
method in which best-estimate ranges of expected future real rates of return (expected returns, net of
pension plans investment expense and inflation) are developed for each major asset class. These ranges
are combined to produce the long-term expected rate of return by weighting the expected future real rates of
return by the target asset allocation percentage and by adding expected inflation. Best estimates of
arithmetic real rates of return for each major asset class included in the pension plans’ target asset allocation
as of June 30, 2017 are summarized in the following table:
JRS, SPRS, TPAF,
PFRS PERS
POPF &
CPFPF
Absolute return/risk mitigation 5.51% —
Cash equivalents 1.00% 1.00%
U.S. Treasuries 1.87% —
Investment grade credit 3.78% —
Public high yield 6.82% —
Global diversif ied credit 7.10% —
Credit oriented hedge funds 6.60% —
Debt related private equity 10.63% —
Debt related real estate 6.61% —
Private real asset 11.83% —
Equity related real estate 9.23% —
U.S. equity 8.19% —
Non-U.S. developed markets equity 9.00% —
Emerging markets equity 11.64% —
Buyouts/venture capital 13.08% —
Asset Class
Discount Rate
The discount rates used to measure the total pension liabilities of the plans were as follows:
Plan Discount Rate
JRS 3.83%
POPF 3.58%
SPRS 4.42%
CPFPF 3.58%
TPAF 4.25%
PFRS 6.14%
PERS 5.00%

STATE OF NEW JERSEY
DIVISION OF PENSIONS AND BENEFITS
Notes to Financial Statements
June 30, 2017
32 (Continued)
The following table represents the crossover period, if applicable, for each defined benefit plan:
JRS POPF SPRS CPFPF TPAF PFRS PERS
Period of projected
benefit payments for
w hich the follow ing
rates w ere applied:
Long-term expected Through Not Through Not Through Through Through
rate of return June 30, 2023 applicable June 30, 2037 applicable June 30, 2036 June 30, 2057 June 30, 2040
Municipal Bond rate* From All From All From From From
July 1, 2023 periods July 1, 2037 periods July 1, 2036 July 1, 2057 July 1, 2040
and thereafter and thereafter and thereafter and thereafter and thereafter
* The municipal bond return rate used is 3.58%. The source is the Bond Buyer Go 20-Bond Municipal Bond Index, w hich includes
tax-exempt general obligation municipal bonds w ith an average rating of AA/Aa or higher.
Sensitivity of Net Pension Liability
The following presents the net pension liability of each plan calculated using the discount rates as disclosed
above as well as what each plan’s net pension liability would be if it were calculated using a discount rate
that is 1-percentage point lower or 1-percentage-point higher than the current rate:
At 1% At current At 1%
Pension Plan (rates used) decrease discount rate increase
JRS (2.83%, 3.83%, 4.83%) $ 861,952,973 762,070,662 677,006,861
POPF (2.58%, 3.58%, 4.58%) 1,190,286 856,395 555,217
SPRS (3.42%, 4.42%, 5.42%) 4,177,923,905 3,362,776,779 2,713,454,218
CPFPF (2.58%, 3.58%, 4.58%) 5,819,905 5,492,117 5,194,839
TPAF (3.25%, 4.25%, 5.25%) 80,394,331,171 67,670,209,171 57,188,022,171
PFRS (5.14%, 6.14%, 7.14%) 27,821,627,837 21,563,003,339 16,422,367,495
PERS (4.00%, 5.00%, 6.00%) 58,697,018,759 48,924,024,385 40,792,456,582
(4) Employers’ Net Pension Liability – Defined Benefit Plans - OPEB
Components of Net OPEB Liability – OPEB Plan
The components of the net OPEB liability of the participating employers for the OPEB plan at June 30, 2017
are as follows:
Total OPEB liability $ 14,558,177,389
Plan fiduciary net position 213,255,917
Net OPEB liability $ 14,344,921,472
Plan fiduciary net position as a percentage of
the total OPEB liability 1.46%

STATE OF NEW JERSEY
DIVISION OF PENSIONS AND BENEFITS
Notes to Financial Statements
June 30, 2017
33 (Continued)
The total OPEB liability was determined by an actuarial valuation as of July 1, 2016, which was rolled
forward to June 30, 2017 using the following actuarial assumptions, applied to all periods in the
measurement:
Inflation rate 2.50%
Salary Increases*
Initial f iscal year applied through 2026
Rate 1.65% to 8.98%
Rate thereafter 2.65% to 9.98%
Mortality RP-2006 Headcount-Weighted Healthy Employee Male / Female Mortality Table
w ith fully generational mortality improvement projections from the central year
using Scale MP-2017
Long-term rate of return 1.00%
* Salary increases are based on the defined benefit plan that the individual is enrolled in and his or her age.
Actuarial assumptions used in the July 1, 2016 valuation were based on the results of the PFRS and PERS
experience studies prepared for July 1, 2010 to June 30, 2013 and July 1, 2011 to June 30, 2014,
respectively.
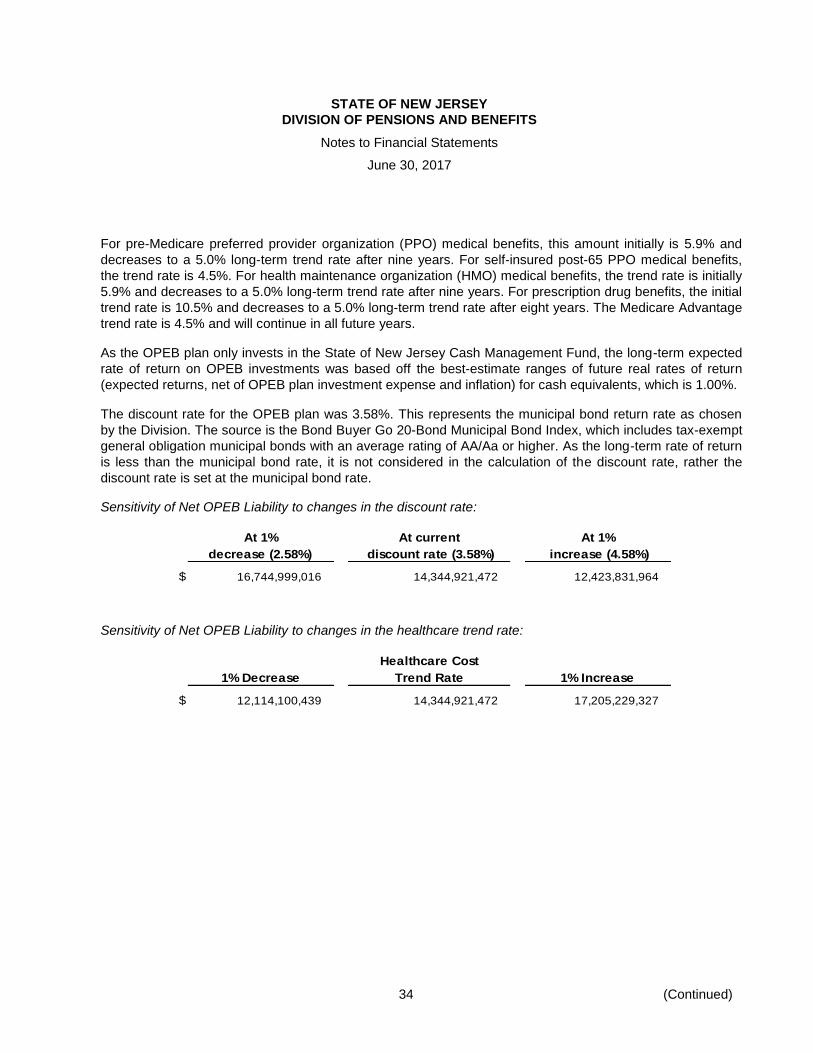
STATE OF NEW JERSEY
DIVISION OF PENSIONS AND BENEFITS
Notes to Financial Statements
June 30, 2017
34 (Continued)
For pre-Medicare preferred provider organization (PPO) medical benefits, this amount initially is 5.9% and
decreases to a 5.0% long-term trend rate after nine years. For self-insured post-65 PPO medical benefits,
the trend rate is 4.5%. For health maintenance organization (HMO) medical benefits, the trend rate is initially
5.9% and decreases to a 5.0% long-term trend rate after nine years. For prescription drug benefits, the initial
trend rate is 10.5% and decreases to a 5.0% long-term trend rate after eight years. The Medicare Advantage
trend rate is 4.5% and will continue in all future years.
As the OPEB plan only invests in the State of New Jersey Cash Management Fund, the long-term expected
rate of return on OPEB investments was based off the best-estimate ranges of future real rates of return
(expected returns, net of OPEB plan investment expense and inflation) for cash equivalents, which is 1.00%.
The discount rate for the OPEB plan was 3.58%. This represents the municipal bond return rate as chosen
by the Division. The source is the Bond Buyer Go 20-Bond Municipal Bond Index, which includes tax-exempt
general obligation municipal bonds with an average rating of AA/Aa or higher. As the long-term rate of return
is less than the municipal bond rate, it is not considered in the calculation of the discount rate, rather the
discount rate is set at the municipal bond rate.
Sensitivity of Net OPEB Liability to changes in the discount rate:
At 1% At current At 1%
decrease (2.58%) discount rate (3.58%) increase (4.58%)
$ 16,744,999,016 14,344,921,472 12,423,831,964
Sensitivity of Net OPEB Liability to changes in the healthcare trend rate:
Healthcare Cost
1% Decrease Trend Rate 1% Increase
$ 12,114,100,439 14,344,921,472 17,205,229,327
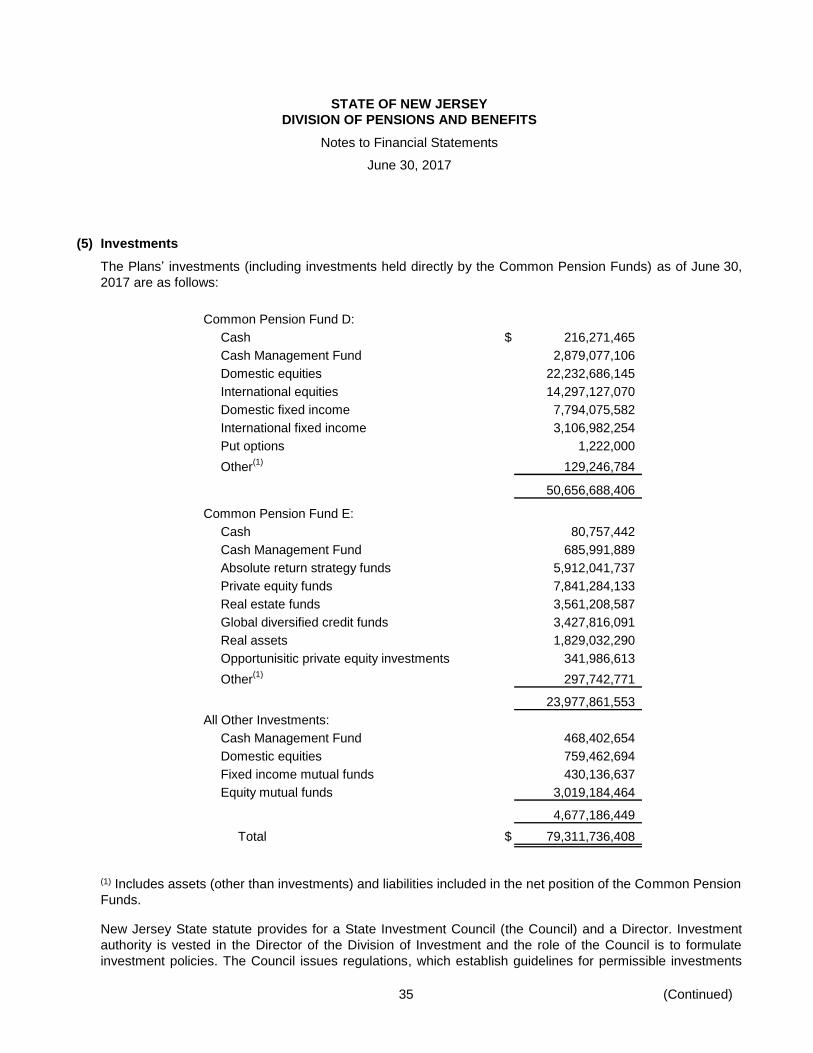
STATE OF NEW JERSEY
DIVISION OF PENSIONS AND BENEFITS
Notes to Financial Statements
June 30, 2017
35 (Continued)
(5) Investments
The Plans’ investments (including investments held directly by the Common Pension Funds) as of June 30,
2017 are as follows:
Common Pension Fund D:
Cash $ 216,271,465
Cash Management Fund 2,879,077,106
Domestic equities 22,232,686,145
International equities 14,297,127,070
Domestic fixed income 7,794,075,582
International fixed income 3,106,982,254
Put options 1,222,000
Other(1)
129,246,784
50,656,688,406
Common Pension Fund E:
Cash 80,757,442
Cash Management Fund 685,991,889
Absolute return strategy funds 5,912,041,737
Private equity funds 7,841,284,133
Real estate funds 3,561,208,587
Global diversified credit funds 3,427,816,091
Real assets 1,829,032,290
Opportunisitic private equity investments 341,986,613
Other(1)
297,742,771
23,977,861,553
All Other Investments:
Cash Management Fund 468,402,654
Domestic equities 759,462,694
Fixed income mutual funds 430,136,637
Equity mutual funds 3,019,184,464
4,677,186,449
Total $ 79,311,736,408
(1) Includes assets (other than investments) and liabilities included in the net position of the Common Pension
Funds.
New Jersey State statute provides for a State Investment Council (the Council) and a Director. Investment
authority is vested in the Director of the Division of Investment and the role of the Council is to formulate
investment policies. The Council issues regulations, which establish guidelines for permissible investments
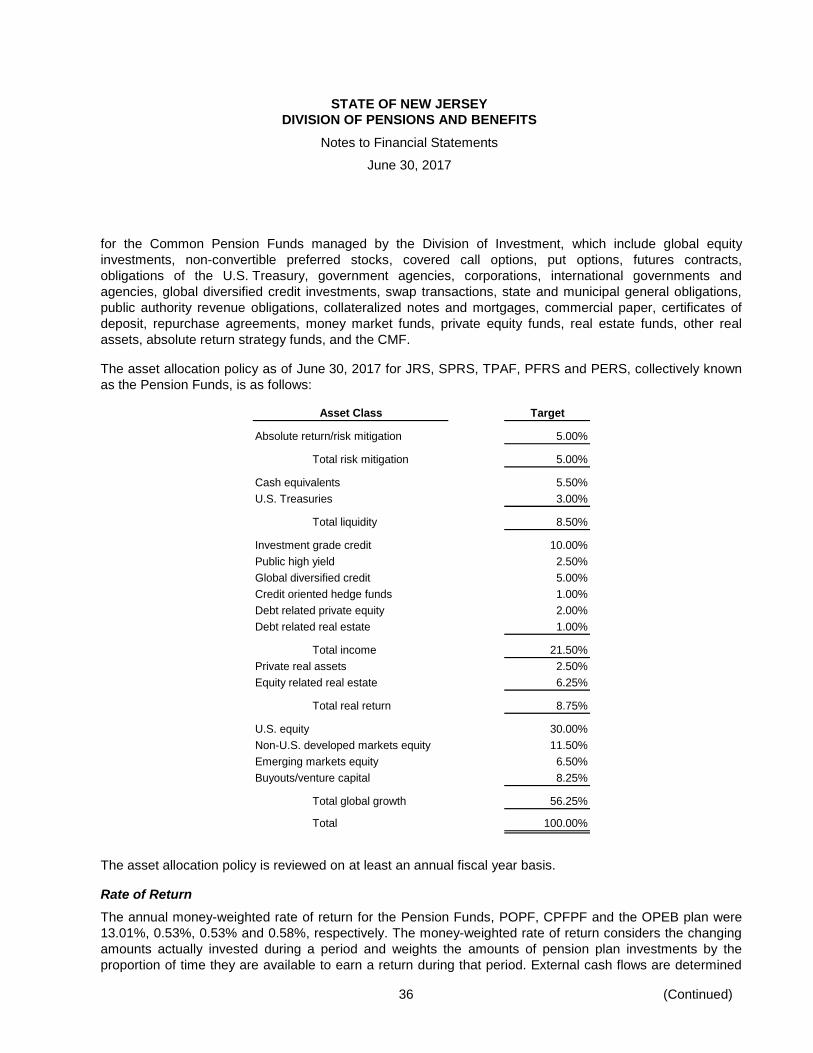
STATE OF NEW JERSEY
DIVISION OF PENSIONS AND BENEFITS
Notes to Financial Statements
June 30, 2017
36 (Continued)
for the Common Pension Funds managed by the Division of Investment, which include global equity
investments, non-convertible preferred stocks, covered call options, put options, futures contracts,
obligations of the U.S. Treasury, government agencies, corporations, international governments and
agencies, global diversified credit investments, swap transactions, state and municipal general obligations,
public authority revenue obligations, collateralized notes and mortgages, commercial paper, certificates of
deposit, repurchase agreements, money market funds, private equity funds, real estate funds, other real
assets, absolute return strategy funds, and the CMF.
The asset allocation policy as of June 30, 2017 for JRS, SPRS, TPAF, PFRS and PERS, collectively known
as the Pension Funds, is as follows:
Target
Absolute return/risk mitigation 5.00%
Total risk mitigation 5.00%
Cash equivalents 5.50%
U.S. Treasuries 3.00%
Total liquidity 8.50%
Investment grade credit 10.00%
Public high yield 2.50%
Global diversified credit 5.00%
Credit oriented hedge funds 1.00%
Debt related private equity 2.00%
Debt related real estate 1.00%
Total income 21.50%
Private real assets 2.50%
Equity related real estate 6.25%
Total real return 8.75%
U.S. equity 30.00%
Non-U.S. developed markets equity 11.50%
Emerging markets equity 6.50%
Buyouts/venture capital 8.25%
Total global growth 56.25%
Total 100.00%
Asset Class
The asset allocation policy is reviewed on at least an annual fiscal year basis.
Rate of Return
The annual money-weighted rate of return for the Pension Funds, POPF, CPFPF and the OPEB plan were
13.01%, 0.53%, 0.53% and 0.58%, respectively. The money-weighted rate of return considers the changing
amounts actually invested during a period and weights the amounts of pension plan investments by the
proportion of time they are available to earn a return during that period. External cash flows are determined

STATE OF NEW JERSEY
DIVISION OF PENSIONS AND BENEFITS
Notes to Financial Statements
June 30, 2017
37 (Continued)
on a monthly basis and are assumed to occur at the end of each month. External cash inflows are netted
with external cash outflows, resulting in a net external cash flow in each month. The money-weighted rate of
return is calculated net of investment expenses.
Deposit and Investment Risk Disclosure
Custodial credit risk, as it relates to investments, is the risk that in the event of the failure of the custodian,
the Plans will not be able to recover the value of investments or collateral securities that are in the
possession of the third party. The Plans’ investment securities are not exposed to custodial credit risk as
they are held in segregated accounts in the name of the Plans with the custodians.
The Plans’ investments are subject to various risks. Among these risks are credit risk, concentration of credit
risk, interest rate risk, and foreign currency risk. Each one of these risks is discussed in more detail below.
Credit risk is the risk that an issuer or other counterparty to an investment will not fulfill its obligations. The
credit risk of issuers and debt instruments is evaluated by nationally recognized statistical rating agencies,
such as Moody’s Investors Service, Inc. (Moody’s), Standard & Poor’s Corporation (S&P), and Fitch Ratings
(Fitch). Concentration of credit risk is the risk of loss attributed to the magnitude of an investment in a single
issuer. There are no restrictions in the amount that can be invested in U.S. Treasury and government agency
obligations. Council regulations require minimum credit ratings for certain categories of fixed income
obligations held directly by the various funds and limit the amount that can be invested in any one issuer or
issue.

STATE OF NEW JERSEY
DIVISION OF PENSIONS AND BENEFITS
Notes to Financial Statements
June 30, 2017
38 (Continued)
The credit ratings and limits for the Pension Funds as of June 30, 2017 are as follows:
Limitation
of issuer’s
Minimum rating (1)
outstanding Limitation
Category Moody’s S&P Fitch debt/stock of issue Other limitations
Certificates of deposit Split rating allowable.
Domestic A3/P-1 A-/A-1 A-/F-1 — — Cannot exceed 10% of
International Aa3/P-1 AA-/A-1 AA-/F-1 — — issuer's primary capital.
Not more than 5% of
pension fund assets
can be invested in any
one issuer and affiliated
entities.
Collateralized notes and Baa3 BBB- BBB- — 25% Not more than 5% of
mortgages fund assets can be
invested in one issue.
Not more than
5% of pension fund
assets can be invested
in any one issuer and
affiliated entities.
Commercial paper P-1 A-1 F-1 — — Split rating allowable.
Not more than 5% of
pension fund assets
can be invested in any
one issuer and affiliated
entities.
Global debt obligations Baa3 BBB- BBB- 10% — Not more than 5% of
pension fund assets can
be invested in any one
issuer and affiliated
entities.
Global diversified credit investments: Not more than 7% of
Direct bank loans Baa3 BBB- BBB- 10% — pension fund assets
Funds Baa3 BBB- BBB- — — can be invested in this
category. Not more than
5% of pension fund
assets can be invested
in any one issuer and
affiliated entities.
International government Baa3 BBB- BBB- 25% 25% Not more than 5% of the
and agency obligations pension fund assets
can be invested in this
category.

STATE OF NEW JERSEY
DIVISION OF PENSIONS AND BENEFITS
Notes to Financial Statements
June 30, 2017
39 (Continued)
Limitation
of issuer’s
Minimum rating (1)
outstanding Limitation
Category Moody’s S&P Fitch debt/stock of issue Other limitations
Money market funds — — — — — Not more than 5% of
pension fund assets can
be invested in money
market funds; limited to
5% of shares or units
outstanding.
Mortgage backed Not more than 10% of
Pass-through securities A3 A- A- — — pension fund assets can
Senior debt securities — — — — 25% be invested in mortgage
backed securities.
Non-convertible preferred Baa3 BBB- BBB- 10% 25% Not more than 5% of
stocks pension fund assets can
be invested in any one
issuer and affiliated
entities.
Repurchase agreements
Bank or trust company — — — — — —
Broker P-1 A-1 F-1 — — —
State, municipal and public A3 A- A- 10% 10% Not more than 2% of
authority obligations pension fund assets can
be invested in debt of
any one obligor.
Swap transactions Baa2 BBB BBB — — Notional value of net
exposure to any one
counterparty shall not
exceed 1% of pension
fund assets. Notional
value of all swap
transactions shall not
exceed 5% of pension
fund assets, but may be
increased to 10% for a
fixed period of time.
(1)Short term ratings (e.g. P‑1, A‑1, F-1) are used for commercial paper and certificates of deposit.
Up to 8% of the fair value of the combined assets of the Pension Funds may be invested in global debt
obligations, collateralized notes and mortgages, global diversified credit investments, non-convertible
preferred stock, and mortgage-backed pass-through securities that do not meet the minimum credit rating
requirements set forth above.
STATE OF NEW JERSEY
DIVISION OF PENSIONS AND BENEFITS
Notes to Financial Statements
June 30, 2017
40 (Continued)
The total amount of a particular class of stock directly purchased of any one entity by the Common Pension
Funds cannot exceed 10% of that class of stock outstanding. The total amount of shares or interests directly
purchased or acquired of any one exchange traded fund or global, regional or country fund by the Common
Pension Funds shall not exceed 10% of the total shares outstanding or interests of such fund.
The NJSEDCP Equity Fund and the NJSEDCP Small Capitalization Equity Fund are invested in equity
securities that are denominated in U.S. dollars that trade on a securities exchange in the United States or the
over-the-counter market. The NJSEDCP Equity Fund and the NJSEDCP Small Capitalization Equity Fund
may hold up to 25% of their assets either in short-term fixed income securities, as permitted by the Council
regulations, or in CMF. Not more than 10% of the fair value of the NJSEDCP Equity Fund or the NJSEDCP
Small Capitalization Equity Fund can be invested in the equity of any one issuer and affiliated entities. The
total amount of a particular class of stock directly purchased or acquired of any one entity cannot exceed 5%
of that class of stock outstanding. The total amount of shares directly purchased or acquired of any one
exchange traded fund shall not exceed 5% of the total shares outstanding of such fund.
The funds managed by Prudential Retirement investments for the NJSEDCP consist of a number of
individual investment managers, which individually have investment guidelines that they comply with and
follow. For Prudential Retirement, the NJSEDCP is a participant directed program offering a range of
diversified investment alternatives. The options include bond investments, which are diversified by sector
and number of securities held, mitigating undue concentration of both credit and foreign currency risks as
well as interest rate risk.
SACT can only invest in equity securities denominated in U.S. dollars that are traded on a securities
exchange in the United States or over-the-counter market. For SACT, not more than 10% of the fair value of
the fund can be invested in the equity of any one issuer and affiliated entities. The total amount of shares
directly purchased or acquired of any one exchange traded fund shall not exceed 5% of the total shares
outstanding of such fund. The total amount of a particular class of stock directly purchased or acquired of
any one entity shall not exceed 5% of that class of stock outstanding.

STATE OF NEW JERSEY
DIVISION OF PENSIONS AND BENEFITS
Notes to Financial Statements
June 30, 2017
41 (Continued)
The following tables disclose aggregate fair value, by major credit quality rating category as of June 30, 2017
for the fixed income securities held directly by the Common Pension Funds. The first table includes fixed
income securities rated by Moody’s. The second table discloses Standard & Poor’s ratings for fixed income
securities not rated by Moody’s (in thousands).
Moody’s rating
Aaa Aa A Baa Ba B Caa Ca C Totals
Corporate obligations $ 686,957 572,701 2,106,255 377,770 282,651 642,516 243,826 3,526 21 4,916,223
Foreign government obligations 611,185 1,510,104 189,611 — — — — — — 2,310,900
U.S. Treasury bonds 1,808,266 — — — — — — — — 1,808,266
International corporate obligations 15,369 49,549 422,646 48,884 68,115 84,192 38,949 1,187 — 728,891
U.S. Treasury TIPS 346,336 — — — — — — — — 346,336
Federal agency obligations 193,480 — — — — — — — — 193,480
Mortgages (FHLMC/FNMA/GNMA) 18,870 — — — — — — — — 18,870
Bank loans — — — — 1,619 1,328 841 521 — 4,309
SBA pass through certificates 3,869 — — — — — — — — 3,869
Other 14,152 197,788 141,394 — — 1,538 — — — 354,872
$ 3,698,484 2,330,142 2,859,906 426,654 352,385 729,574 283,616 5,234 21 10,686,016
Standard and Poor’s rating
AAA A BBB BB B CCC D Totals
Corporate obligations $ — — 65,173 9,770 5,793 1,351 — 82,087
Foreign government obligations — 39,318 — 951 — — — 40,269
Federal agency obligations 30,703 — — — — — — 30,703
Municipal obligations 17,439 7,581 — — — — — 25,020
International corporate obligations — — 1,106 13,544 5,239 1,468 — 21,357
Asset backed securities — — 2,998 — — — — 2,998
Bank loans — — — — — — 253 253
$ 48,142 46,899 69,277 24,265 11,032 2,819 253 202,687
The tables do not include certain domestic and international corporate obligations and certain fixed income
mutual funds, which invest in an underlying portfolio of fixed income securities, totaling $442,491,632, and do
not have a Moody’s or Standard & Poor’s rating. The above tables also do not include investment in the
Cash Management Fund totaling $4,033,471,649, which is not rated.
Interest rate risk is the risk that changes in interest rates will adversely affect the fair value of an investment.
Commercial paper must mature within 270 days. Certificates of deposits are limited to a term of one year or
less. Repurchase agreements must mature within 30 days. Council regulations permit the Common Pension
Funds to enter into foreign exchange contracts for the purpose of hedging the international portfolio.
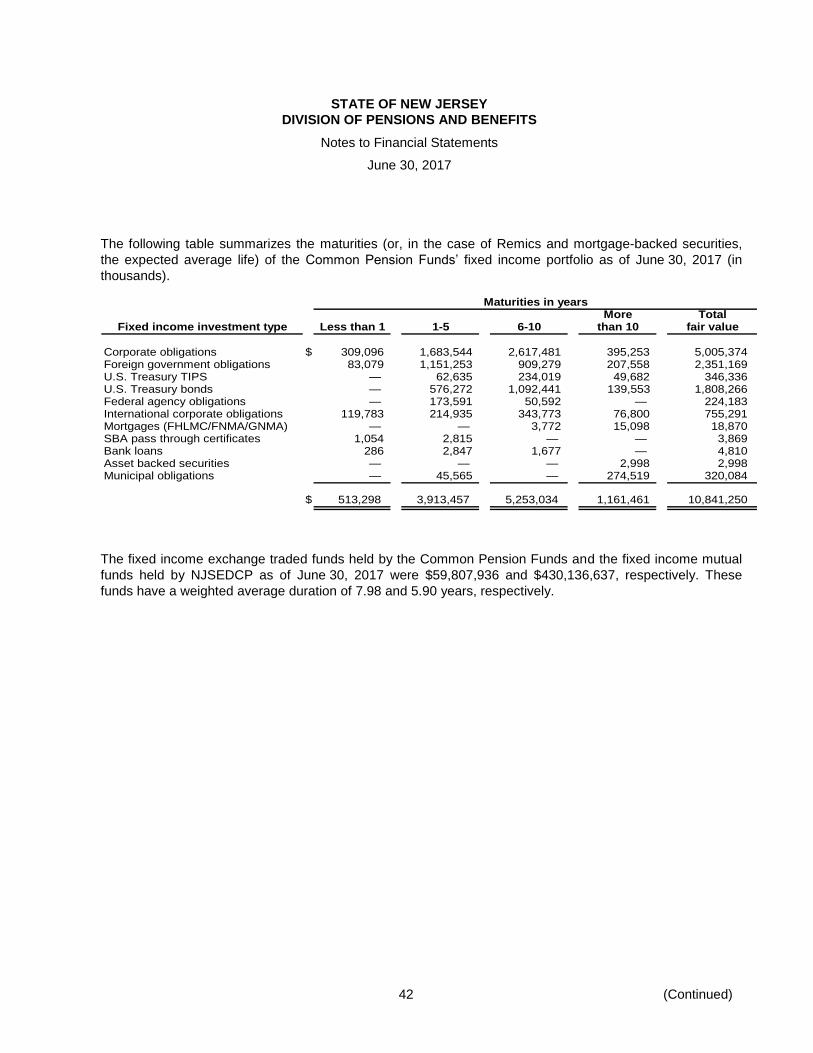
STATE OF NEW JERSEY
DIVISION OF PENSIONS AND BENEFITS
Notes to Financial Statements
June 30, 2017
42 (Continued)
The following table summarizes the maturities (or, in the case of Remics and mortgage-backed securities,
the expected average life) of the Common Pension Funds’ fixed income portfolio as of June 30, 2017 (in
thousands).
Maturities in yearsMore Total
Fixed income investment type Less than 1 1-5 6-10 than 10 fair value
Corporate obligations $ 309,096 1,683,544 2,617,481 395,253 5,005,374 Foreign government obligations 83,079 1,151,253 909,279 207,558 2,351,169 U.S. Treasury TIPS — 62,635 234,019 49,682 346,336 U.S. Treasury bonds — 576,272 1,092,441 139,553 1,808,266 Federal agency obligations — 173,591 50,592 — 224,183 International corporate obligations 119,783 214,935 343,773 76,800 755,291 Mortgages (FHLMC/FNMA/GNMA) — — 3,772 15,098 18,870 SBA pass through certificates 1,054 2,815 — — 3,869 Bank loans 286 2,847 1,677 — 4,810 Asset backed securities — — — 2,998 2,998 Municipal obligations — 45,565 — 274,519 320,084
$ 513,298 3,913,457 5,253,034 1,161,461 10,841,250
The fixed income exchange traded funds held by the Common Pension Funds and the fixed income mutual
funds held by NJSEDCP as of June 30, 2017 were $59,807,936 and $430,136,637, respectively. These
funds have a weighted average duration of 7.98 and 5.90 years, respectively.
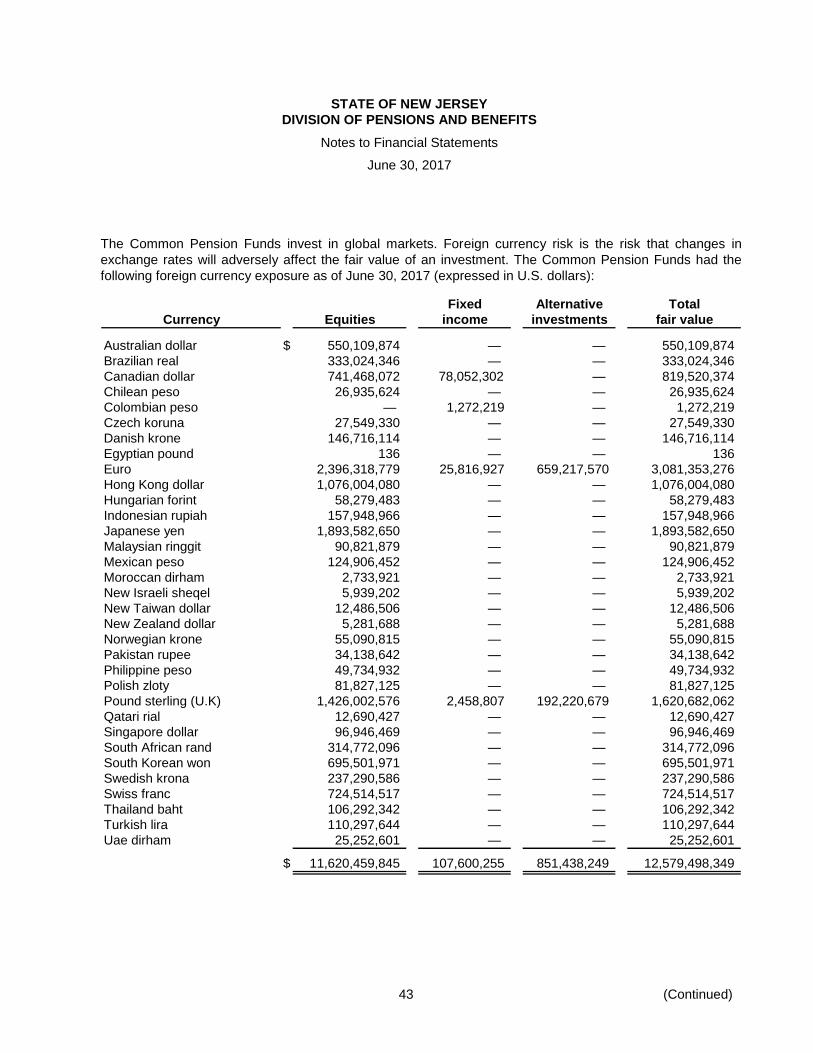
STATE OF NEW JERSEY
DIVISION OF PENSIONS AND BENEFITS
Notes to Financial Statements
June 30, 2017
43 (Continued)
The Common Pension Funds invest in global markets. Foreign currency risk is the risk that changes in
exchange rates will adversely affect the fair value of an investment. The Common Pension Funds had the
following foreign currency exposure as of June 30, 2017 (expressed in U.S. dollars):
Fixed Alternative Total
Currency Equities income investments fair value
Australian dollar $ 550,109,874 — — 550,109,874
Brazilian real 333,024,346 — — 333,024,346
Canadian dollar 741,468,072 78,052,302 — 819,520,374
Chilean peso 26,935,624 — — 26,935,624
Colombian peso — 1,272,219 — 1,272,219
Czech koruna 27,549,330 — — 27,549,330
Danish krone 146,716,114 — — 146,716,114
Egyptian pound 136 — — 136
Euro 2,396,318,779 25,816,927 659,217,570 3,081,353,276
Hong Kong dollar 1,076,004,080 — — 1,076,004,080
Hungarian forint 58,279,483 — — 58,279,483
Indonesian rupiah 157,948,966 — — 157,948,966
Japanese yen 1,893,582,650 — — 1,893,582,650
Malaysian ringgit 90,821,879 — — 90,821,879
Mexican peso 124,906,452 — — 124,906,452
Moroccan dirham 2,733,921 — — 2,733,921
New Israeli sheqel 5,939,202 — — 5,939,202
New Taiwan dollar 12,486,506 — — 12,486,506
New Zealand dollar 5,281,688 — — 5,281,688
Norwegian krone 55,090,815 — — 55,090,815
Pakistan rupee 34,138,642 — — 34,138,642
Philippine peso 49,734,932 — — 49,734,932
Polish zloty 81,827,125 — — 81,827,125
Pound sterling (U.K) 1,426,002,576 2,458,807 192,220,679 1,620,682,062
Qatari rial 12,690,427 — — 12,690,427
Singapore dollar 96,946,469 — — 96,946,469
South African rand 314,772,096 — — 314,772,096
South Korean won 695,501,971 — — 695,501,971
Swedish krona 237,290,586 — — 237,290,586
Swiss franc 724,514,517 — — 724,514,517
Thailand baht 106,292,342 — — 106,292,342
Turkish lira 110,297,644 — — 110,297,644
Uae dirham 25,252,601 — — 25,252,601
$ 11,620,459,845 107,600,255 851,438,249 12,579,498,349
STATE OF NEW JERSEY
DIVISION OF PENSIONS AND BENEFITS
Notes to Financial Statements
June 30, 2017
44 (Continued)
The Pension Funds’ interests in alternative investments may contain elements of credit, currency and market
risk. Such risks include, but are not limited to, limited liquidity, absence of regulatory oversight, dependence
upon key individuals, speculative investments (both derivatives and nonmarketable investments), and
nondisclosure of portfolio composition. Council regulations provide that not more than 38% of the fair value
of the Pension Funds can be invested in alternative investments, with limits on the individual investment
categories of real estate (9%), real assets (7%), private equity (12%) and absolute return strategy (15%).
Not more than 5% of the fair value invested through direct investments, separate accounts, fund-of-funds,
commingled funds, co-investments and joint ventures in global diversified credit, private equity, real asset
and absolute return strategy investments, plus outstanding commitments, may be committed to any one
partnership or investment. These investments cannot comprise more than 20% of any one investment
managers’ total assets.
As of June 30, 2017, the net position of Common Pension Fund E includes receivables of $302 million
related to the secondary sale of real estate funds and redemption of hedge funds.
(6) Securities Lending Collateral
The State Investment Council policies permit the Common Pension Funds and several of the direct pension
plan portfolios to participate in securities lending programs, whereby securities are loaned to brokers or other
borrowers and, in return, the Pension Funds have rights to the collateral received. All of the publicly traded
securities held in Common Pension Funds, and certain securities held directly by the pension plans, are
eligible for the securities lending program. Collateral received may consist of cash, letters of credit, or U.S.
Treasury obligations having a fair value equal to or exceeding 102% (U.S. dollar denominated) or 105%
(non-U.S. dollar denominated) of the value of the loaned securities at the time the loan is made. Collateral is
marked to market daily and adjusted as needed to maintain the required minimum level.
For loans of U.S. government securities or sovereign debt issued by non-U.S. governments, in the event that
the fair value of the collateral falls below 100% of the fair value of the outstanding loaned securities to an
individual borrower, or the fair value of the collateral of all loans of such securities falls below the collateral
requirement, additional collateral shall be transferred by the borrower to the respective funds no later than
the close of the next business day so that the fair value of such additional collateral together with collateral
previously delivered meets the collateral requirements.
For loans of all other types of securities, in the event that the fair value of the collateral falls below the
collateral requirement of either 102% or 105% (depending on whether the securities are denominated in
U.S. dollars or a foreign currency, respectively) of the fair value of the outstanding loaned securities to an
individual borrower, additional collateral shall be transferred in an amount that will increase the aggregate of
the borrower’s collateral to meet the collateral requirements. As of June 30, 2017, the Common Pension
Funds had no aggregate credit risk exposure to borrowers because the collateral amount held by the
Common Pension Funds exceeded the fair value of the securities on loan.
STATE OF NEW JERSEY
DIVISION OF PENSIONS AND BENEFITS
Notes to Financial Statements
June 30, 2017
45 (Continued)
The contract with the Common Pension Funds’ securities lending agent requires them to indemnify the
Common Pension Funds if the brokers or other borrowers fail to return the securities and provide that
collateral securities may be sold in the event of a borrower default. The Common Pension Funds are also
indemnified for any loss of principal or interest on collateral invested in repurchase agreements. The
Common Pension Funds cannot participate in any dividend reinvestment program or vote with respect to any
securities that are on loan on the applicable record date. The securities loans can be terminated by
notification by either the borrower or the Common Pension Funds. The term to maturity of the securities
loans is generally matched with the term to maturity of the investment of the cash collateral.
The securities lending collateral is subject to various risks. Among these risks are custodial credit risk, credit
risk, concentration of credit risk, and interest rate risk. Securities lending collateral is invested in repurchase
agreements, the maturities of which cannot exceed 30 days. The collateral for repurchase agreements is
limited to obligations of the U.S. Government or certain U.S. Government agencies, collateralized notes and
mortgages and corporate obligations meeting certain minimum rating criteria. Total exposure to any
individual issuer is limited consistent with internal policies for funds managed by the Division of Investment.
For securities exposed to credit risk in the collateral portfolio, the following table discloses aggregate fair
value, by major credit quality rating category as of June 30, 2017 (in thousands).
Rating
Aaa/AAA Not rated Totals
Repurchase agreements $ 807,505 — 807,505
State Street Institutional Liquid Reserves Fund — 157,995 157,995
Cash overdraft — (7,159) (7,159)
$ 807,505 150,836 958,341
Custodial credit risk for investments is the risk that in the failure of the counterparty to the transaction, the
pension funds will not recover the value of the investments that are in the possession of an outside party.
The repurchase agreement’s underlying securities are held in the Pension Funds’ name.
As of June 30, 2017, the Pension Funds had outstanding loaned investment securities with an aggregate fair
value of $930,184,975 and did not hold any noncash collateral. There were no borrowers or lending agent
default losses, and no recoveries or prior period losses during the year.
(7) Derivatives
The pension funds (JRS, SPRS, TPAF, PFRS, and PERS) invest in derivative securities through the
Common Pension Funds. A derivative security is an investment whose value is derived from other financial
instruments such as commodity prices, bonds and stock prices, or a market index. The Common Pension
Funds’ derivative securities are considered investment derivative instruments. The fair value of all derivative
securities is reported in the statement of fiduciary net position, and the change in fair value is recorded in the
statement of changes in fiduciary net position as a net increase or decrease in fair value of investments.

STATE OF NEW JERSEY
DIVISION OF PENSIONS AND BENEFITS
Notes to Financial Statements
June 30, 2017
46 (Continued)
Derivative transactions involve, to varying degrees, credit risk and market risk. Credit risk is the possibility
that a loss may occur because a party to a transaction fails to perform according to terms. Market risk
includes, but is not limited to, the possibility that a change in interest rate risk, foreign currency risk or the
value of the underlying securities will cause the value of a financial instrument to decrease or become more
costly to settle. The market or the value of underlying security, or securities, risk associated with derivatives,
the prices of which are constantly fluctuating, is regulated by imposing limits as to the types, amounts and
degree of risk that the Common Pension Funds may undertake as set forth in the Council Regulations.
The Common Pension Funds may use financial futures to replicate an underlying security or indices they
wish to hold in the portfolio. In certain instances, it may be beneficial to own a futures contract rather than the
underlying security. Additionally, the Common Pension Funds may use futures contracts to improve the yield
or adjust the duration of the fixed income portfolio or may sell futures contracts to hedge the portfolio. A
financial futures contract is an agreement between a buyer and a seller that is based on a referenced item,
such as financial indices, or interest rates or a financial instrument, such as equity or fixed income securities,
physical commodities or currencies. Futures contracts may call for physical delivery of specified quantity of
the underlying asset at a specified price (futures or strike price) and date, or be settled in cash. Futures
contracts must be traded on a securities exchange or over-the-counter market. The net change in the futures
contracts value is settled daily in cash with the exchanges. The cash to fulfill these obligations is held in a
margin account. As the fair value of the futures contract varies from the original contract price, a gain or loss
is paid to or received from the clearinghouse and recognized in the statement of changes in fiduciary net
position. The Common Pension Funds had no investments in futures at June 30, 2017.
Foreign currency forward contracts are used as a means to hedge against currency risks in the Common
Pension Fund. Foreign currency forward contracts are agreements to buy or sell a specific amount of a
foreign currency at a specified delivery or maturity date for an agreed upon price. Foreign currency forward
contracts are marked to market on a daily basis with the change in fair value included in investment income
in the statement of changes in fiduciary net position.
The Common Pension Funds utilize covered call and put options in an effort to add value to or reduce the
risk level in the portfolio. Options are agreements that give the owner of the option the right, but not
obligation, to buy (in the case of a call option) or to sell (in the case of a put option) a specific amount of an
asset for a specific price (called the strike price) on or before a specified expiration date. The Common
Pension Funds enter into covered calls when it writes (or sells) call options on underlying stocks held by the
Common Pension Funds or stock indices. The Common Pension Funds enter into covered put options when
it purchases put options on underlying stocks held by the Common Pension Funds or stock indices. The
Common Pension Fund enters into put spreads when it purchases put options while simultaneously writing
put options on the same underlying securities or indices at a lower strike price. The purchaser of put options
pays a premium at the outset of the agreement and stands to gain from an unfavorable change (i.e., a
decrease) in the price of the instrument underlying the option. The writer of call options receives a premium
at the outset of the agreement and may bear the risk of an unfavorable change (i.e., an increase) in the price
of the instrument underlying the option.

STATE OF NEW JERSEY
DIVISION OF PENSIONS AND BENEFITS
Notes to Financial Statements
June 30, 2017
47 (Continued)
As of June 30, 2017, the Common Pension Fund’s derivative investments included foreign currency forward
contracts and equity options:
Notional value Change in
(local currency) Receivable Payable fair value
Foreign currency forw ard contracts:
Buy
Euro 888,427 $ 1,014,191 997,171 17,020
Pound sterling 423,186 549,978 542,357 7,621
Sell:
Euro 397,667,415 $ 429,418,949 455,560,356 (26,141,407)
Japanese yen 25,000,000,000 219,849,423 222,793,923 (2,944,500)
Pound sterling 102,519,845 127,308,414 133,485,348 (6,176,934)
Total Forw ard contracts $ 778,140,955 813,379,155 (35,238,200)
Notional value Fair value
Change in fair
value
Options:
Purchased Options:
Puts $ 96,936,400 1,222,000 (102,000)
Written Options:
Put 96,936,400 (490,000) 122,000
Call 235,487,800 (682,000) 259,810
Total Options $ 429,360,600 50,000 279,810
Certain of the alternative investment funds and partnerships may use derivative instruments to hedge against
market risk and to enhance investment returns. At any point during the year, the Common Pension Funds
may have additional exposure to derivatives primarily through limited liability vehicles such as limited
partnerships and commingled investment funds.
(8) Fair Value Measurements
Fair value is defined as the price that would be received to sell an asset or paid to transfer a liability in an
orderly transaction between independent market participants at the measurement date. Inputs refer broadly
to the assumptions that market participants would use in pricing the asset or liability, including assumptions
about risk. Inputs may be observable or unobservable. Observable inputs are inputs that reflect the
assumptions market participants would use in pricing the asset or liability developed based on market data
obtained from sources independent of the reporting entity. Unobservable inputs are inputs that reflect the
reporting entity’s own assumptions about the assumptions market participants would use in pricing the asset
or liability developed based on the best information available in the circumstances. The three levels of the
fair value hierarchy are as follows:
Level 1 – Quoted prices are available in active markets for identical investments as of the reporting date.

STATE OF NEW JERSEY
DIVISION OF PENSIONS AND BENEFITS
Notes to Financial Statements
June 30, 2017
48 (Continued)
Level 2 – Pricing inputs are other than quoted prices in active markets, which are either directly or indirectly
observable as of the reporting date, and fair value is determined through the use of models or other valuation
methodologies.
Level 3 – Pricing inputs are unobservable for the investment and inputs into the determination of fair value
require significant management judgment or estimation, including assumptions about risk.
Investments are reported at fair value as follows:
Domestic and international equity securities and exchange traded funds are valued using closing
sales prices reported on recognized securities exchanges on which the securities are principally
traded; these securities are included as Level 1 in the chart below. For listed securities having no
sales reported and for unlisted securities, such securities will be valued based upon the last
reported bid price; these securities are included as Level 2 in the chart below.
Fixed income and equity mutual funds are valued using the published daily closing prices reported
by Prudential and are included as Level 1 in the chart below.
Foreign and domestic government, agency and corporate obligations, municipal bonds, mortgages, bank loans and asset-backed securities are valued using an evaluated price, which is based on a compilation of primarily observable market information or broker quotes in a non-active market. These are included as Level 2 in the chart below.
Foreign exchange contracts are valued using industry recognized market-based models to
calculate the value that a holder or counterparty would receive within the bid-ask spread, in an
orderly transaction under current market conditions. These securities are included as Level 2 in the
chart below.
Options are valued using closing sales prices reported on recognized securities exchanges on
which the securities are principally traded. These securities are included as Level 1 in the chart
below.
Distributions from private equity vehicles are received as the underlying investments are liquidated. The Plan’s ownership interest in partners’ capital can never be redeemed, but could be sold subject to approval by the fund’s management. As of June 30, 2017, a buyer (or buyers) for these investments have not yet been identified. The partnership interest may be sold at an amount different from the net asset value (NAV) per share (or its equivalent) of the plan’s ownership interest in partners’ capital.
The valuation methods for investments measured at the NAV per share (or its equivalent) is presented in the table below.

STATE OF NEW JERSEY
DIVISION OF PENSIONS AND BENEFITS
Notes to Financial Statements
June 30, 2017
49 (Continued)
The following table summarizes the fair value hierarchy of the investment portfolio as of June 30, 2017 (in
thousands):
Total Level 1 Level 2
Investments by fair value
Equity securities
Domestic equities $ 22,641,596 22,638,722 2,874
International equities 13,457,534 13,437,346 20,188
Equity mutual funds 3,019,184 3,019,184 —
Exchange traded funds 1,190,146 1,190,146 —
Total equity securities 40,308,460 40,285,398 23,062
Debt securities
Corporate obligations 5,005,374 — 5,005,374
Foreign government obligations 2,351,169 — 2,351,169
U.S. Treasury bonds 1,808,266 — 1,808,266
International corporate obligations 755,291 — 755,291
U.S. Treasury Tips 346,336 — 346,336
Municipal obligations 320,084 — 320,084
Federal agency obligations 224,183 — 224,183
Fixed income mutual funds 430,137 430,137 —
Exchanged traded funds 59,808 59,808 —
Mortgages (FHLMC/FNMA/GNMA) 18,870 — 18,870
Bank loans 4,810 — 4,810
SBA pass through certificates 3,869 — 3,869
Asset backed securities 2,998 — 2,998
Total debt securities 11,331,195 489,945 10,841,250
Total investments by fair value level 51,639,655 40,775,343 10,864,312
Investments measured at the net asset value (NAV)
Buyout private equity funds 6,597,374
Global diversified credit funds 3,427,816
Real estate funds - equity 3,114,442
Credit oriented hedge funds 2,345,956
Real assets 1,829,032
Multi-strategy hedge funds 1,482,271
Opportunistic hedge funds 1,067,504
Equity oriented hedge funds 1,016,311
Debt related private equity funds 698,506
Venture capital private equity funds 481,958
Real estate funds - debt 446,767
Opportunistic private equity investments 341,987
Secondary private equity funds 63,446
Total investments measured at NAV 22,913,370
Local Government Investment Pool
Cash Management Fund 4,033,471
Total investments measured at fair value $ 78,586,496
Investment derivative instruments
Put options (assets) $ 1,222 1,222 —
Foreign currency forward contracts (assets) 778,141 — 778,141
Foreign currency forward contracts (liabilities) (813,379) — (813,379)
Options written (liabilities) (1,172) (1,172) —
Total investment derivative instruments $ (35,188) 50 (35,238)

STATE OF NEW JERSEY
DIVISION OF PENSIONS AND BENEFITS
Notes to Financial Statements
June 30, 2017
50 (Continued)
The following table represents the unfunded commitments, redemptions frequency and redemption notice
period for investments measured at NAV as of June 30, 2017 (in thousands).
Fair Value
Unfunded
Commitments
Redemption
Frequency
(if currently
Eligible)
Redemption
Notice Period
Buyout private equity funds (1) $ 6,597,374 3,301,083 None N/A
Global diversif ied credit funds (2) 3,427,816 1,778,204 Semi-annual 90 days
Real estate funds - equity (3) 3,114,442 1,854,250 Quarterly 90 days
Credit oriented hedge funds (4) 2,345,956 125,000 Monthly, quarterly,
semi-annual, annually45-60 days
Real assets (5) 1,829,032 1,056,091 Daily, monthly 1-30 days
Multi-strategy hedge funds (6) 1,482,271 58,741 Quarterly, semi-annual None
Opportunistic hedge funds (7) 1,067,504 45,000 Monthly, quarterly 2-90 days
Equity oriented hedge funds (8) 1,016,311 187,458 Quarterly, semi-
annual, annually45-92 days
Debt related private equity funds (9) 698,506 866,259 None N/A
Venture capital private equity funds (10) 481,958 87,954 None N/A
Real estate funds - debt (11) 446,767 429,300 Quarterly 90 days
Opportunistic private equity funds (12) 341,987 298,315 None N/A
Secondary private equity funds (13) 63,446 28,093 None N/A
Total investment measured at the NAV $ 22,913,370 10,115,748
1. Buyout private equity funds include investments in 75 partnership vehicles, which invest primarily in the
equity of established operating companies in order to restructure the target company’s reserve capital,
management and/or organizational structure or facilitate ongoing growth of the firm. Return on
investment is typically realized through an initial public offering, sale or merger of the company, or a
recapitalization. It is expected that the underlying assets will be liquidated over the next 1 to 12 years.
The fair value of the investments in this type have been determined using the NAV per share (or its
equivalent) of the investment.
2. Global diversified credit funds include investments in 15 funds and separate account investments that
make investment in mezzanine debt, credit structured products, commercial and residential mortgage-
backed securities, commercial and residential whole loans, and other similar strategies. Investments in
this type cannot be redeemed because the investments include restrictions. As of June 30, 2017, these
remaining redemption restriction periods range from 30 to 84 months. It is expected that the underlying
assets will be liquidated over the next 3 to 7 years. The fair value of the investments in this type have
been determined using the NAV per share (or its equivalent) of the investment.
3. Real estate funds - equity include investments in 46 funds or separate accounts that make investments
in the equity of the underlying asset, where the investor acts as a shareholder in a specific property and
receives a share of the rental income the property generates. Investments representing approximately
59% of real estate equity investments can never be redeemed. Distributions from each fund and
separate account will be received as the underlying investments are liquidated. It is expected that the
STATE OF NEW JERSEY
DIVISION OF PENSIONS AND BENEFITS
Notes to Financial Statements
June 30, 2017
51 (Continued)
underlying assets will be liquidated over the next 1 to 12 years. The fair value of the investments in this
type have been determined using the NAV per share (or its equivalent) of the investment.
4. Credit oriented hedge funds include investments in 13 hedge fund and separate account strategies that
include both credit and distressed debt funds. Credit strategies typically invest both long and short in
high yield and high-grade bonds, and structured products using fundamental credit analysis. These
securities tend to be relatively liquid. Distressed debt strategies take advantage of corporate securities in
default, under bankruptcy protection, in distress, or in liquidation. These securities are often illiquid.
Investments representing approximately 60% of the value of the investments cannot be redeemed
because the investment includes restrictions that do not allow for redemptions. As of June 30, 2017,
these remaining redemption restriction periods range from 3 to 30 months. The fair value of the
investments in this type have been determined using the NAV per share (or its equivalent) of the
investment.
5. Real asset funds includes investments in 17 fund or separate account strategies, which invest in the
equity or debt of infrastructure, energy, utilities, water, timber, agriculture, metals, mining, and
commodity-related and commodity-linked investments. Real asset investments include investments in
products, services and technology related to the above. Investments representing approximately 92% of
the value of the investments can never be redeemed. Distributions from each fund and separate account
will be received as the underlying investments are liquidated. It is expected that the underlying assets will
be liquidated over the next 2 to 12 years. The fair value of the investments in this type have been
determined using the NAV per share (or its equivalent) of the investment.
6. Multi-strategy hedge funds include investments in 9 hedge funds that pursue multiple strategies to
diversify risks and reduce volatility. Investments representing approximately 56% of the value of the
investments cannot be redeemed because the investment includes restrictions that do not allow for
redemptions. As of June 30, 2017, the remaining redemption restriction periods range from 6 to 18
months. The fair values of the investments in this type have been determined using the NAV per share
(or its equivalent) of the investments.
7. Opportunistic hedge funds include investments in 5 hedge funds that invest in speculative opportunities
with high net market exposure across varied markets. Opportunistic funds include global macro funds,
commodity trading advisor funds, and funds employing other similar strategies. Investments representing
approximately 33% of the value of the investments in this type cannot be redeemed because the
investments include restrictions. As of June 30, 2017, this remaining redemption restriction period is 18
months. The fair value of the investments in this type have been determined using the NAV per share (or
its equivalent) of the investment.
8. Equity oriented hedge funds include investments in 9 hedge fund and separate account strategies that
include both equity long/short and event driven funds. Equity long/short funds hold a combination of long
and short positions primarily in publicly traded equities. Event driven funds invest in merger arbitrage,
capital structure arbitrage, relative value, activist or other similar strategies. Investments representing
approximately 29% of the value of the investments cannot be redeemed because the investment
includes restrictions that do not allow for redemptions. As of June 30, 2017, these remaining redemption
restriction periods range from 9 to 36 months. The fair value of the investments in this type have been
determined using the NAV per share (or its equivalent) of the investment.
9. Debt related private equity funds include investments in 25 funds employing distressed, turnaround and
mezzanine debt strategies. Distressed debt involves purchasing debt securities that are trading at a
STATE OF NEW JERSEY
DIVISION OF PENSIONS AND BENEFITS
Notes to Financial Statements
June 30, 2017
52 (Continued)
distressed level, in anticipation that those securities will have a higher market valuation and generate
profit at a future date, or strategies, which take a position to potentially gain control of an asset.
Turnaround investments focus on acquiring voting control in companies that are in distress, and aim to
subsequently restore the company to profitability. Mezzanine debt strategies provide a middle level of
financing in leveraged buyouts, which is below the senior debt layer and above the equity layer. A typical
mezzanine investment includes a loan to the borrower, in addition to the borrower's issuance of equity in
the form of warrants, common stock, preferred stock, or some other equity investment. Distributions from
each fund will be received as the underlying investments of the funds are liquidated. It is expected that
the underlying assets of the funds will be liquidated over the next 1 to 12 years. The fair value of the
investments in this type have been determined using the NAV per share (or its equivalent) of the
investment.
10. Venture capital private equity funds include investments in 8 partnership vehicles that make equity
investments primarily in high growth companies during their early or expansion stages. These companies
may or may not have revenues or a client base and in most cases will not be cash flow positive.
Distributions from each vehicle will be received as the underlying investments are liquidated. It is
expected that the underlying assets will be liquidated over the next 1 to 12 years. The fair value of the
investments in this type have been determined using the NAV per share (or its equivalent) of the
investment.
11. Real estate funds - debt include investments in 7 funds or separate accounts that make investments in
the debt of the underlying asset, where the investor acts as a lender to the property owner and receives
an interest rate on the loan. Investments representing approximately 61% of real estate debt investments
can never be redeemed. Distributions from each fund and separate account will be received as the
underlying investments are liquidated. It is expected that the underlying assets will be liquidated over the
next 4 to 9 years. The fair value of the investments in this type have been determined using the NAV per
share (or its equivalent) of the investment.
12. Opportunistic private equity funds include investments in 3 funds and separate accounts, which acquire
minority equity interests in investment management companies. Investments representing approximately
80% of the value of the investments have a perpetual term and cannot be redeemed. Investments
representing approximately 20% of the value of the investments can be redeemed after 8 years or
December 2025. The fair value of the investments in this type have been determined using the NAV per
share (or its equivalent) of the investment.
13. Secondary private equity funds include investments in 4 funds that purchase secondary interests in
private equity partnerships. The underlying investments represent ownership interests in private equity
funds managed by buyout or venture capital firms after the capital has been deployed. Distributions from
each fund will be received as the underlying investments are liquidated. It is expected that the underlying
assets will be liquidated over the next 2 to 10 years. The fair value of the investments in this type have
been determined using the NAV per share (or its equivalent) of the investment.

STATE OF NEW JERSEY
DIVISION OF PENSIONS AND BENEFITS
Notes to Financial Statements
June 30, 2017
53 (Continued)
(9) Local Employer’s Contributions under Chapter 19, P.L. 2009
As discussed in Note 1, in the fiscal year ended June 30, 2009, the State passed Chapter 19, P.L. 2009 to
allow local employers of PFRS and PERS to contribute 50% of the normal and accrued liability contributions
amounts, while deferring the remaining amount for a 15-year period with payments beginning in the fiscal
year ended June 30, 2012. At June 30, 2017, the remaining receivable balances related to Chapter 19, P.L.
2009 were $116.2 million and $39.1 million for PFRS and PERS, respectively.
(10) Reserves
The Plans maintain the following legally required reserves as follows (amounts indicated in parenthesis
represent net position restricted for the respective reserve as indicated):
Members’ Annuity Savings Reserve and Accumulative Interest Reserve – JRS ($70,319,118); SPRS
($212,674,110); TPAF ($12,531,120,389); PFRS ($3,752,205,896); PERS ($14,571,683,577)
The Members’ Annuity Savings Reserve (New Jersey Statutes Annotated (NJSA): JRS 43:6A- 34.1 and
34.2; SPRS 53:5A-35; TPAF 18A:66-19 and 25; PFRS 43:16A-16; PERS 43:15A-25 and 33) is credited with
all contributions made by active members of the Plans. Interest earned on member contributions is credited
to the Accumulative Interest Reserve, which is applied to JRS, TPAF and PERS. Member withdrawals are
paid out of these Reserves.
Contingent Reserve – JRS ($-91,660,071); SPRS ($862,021,018); TPAF ($-27,927,869,120); PERS
($-17,308,333,750)
The Contingent Reserve (NJSA: JRS 43:6A-33; SPRS 53:5A-34; TPAF 18A:66-18; PERS 43:15A-24) is
credited with the contributions of contributing employers. Interest earnings, after crediting the Accumulative
Interest Reserve and Retirement Reserve, as required, are credited to this account. Additionally, payments
for administrative and miscellaneous expenses are made from this Reserve.
Retirement Reserve – JRS ($196,666,286); SPRS ($686,802,207); TPAF ($38,452,910,560); PFRS
($25,282,180,037); PERS ($30,976,473,916)
The Retirement Reserve (NJSA: JRS 43:6A-34; SPRS 53:5A-36; TPAF 18A:66-21; PFRS 43:16A-16; PERS
43:15A-27) is the account from which retirement benefits including COLA adjustments are paid. Upon
retirement of a member, accumulated contributions together with accumulated interest are transferred to the
Retirement Reserve from the Members’ Annuity Savings Reserve and Accumulative Interest Reserve. Any
additional reserves needed to fund the balance of the retirement benefit are transferred from the Contingent
Reserve or Pension Accumulation Reserve. Annually, interest as determined by the State Treasurer (7.65%
for State fiscal year 2017) is credited to the Retirement Reserve.
Retirement Reserve – POPF ($5,620,868)
The Retirement Reserve (NJSA: POPF 43:7-13) is credited with State of New Jersey contributions and
investment income. In addition, all benefits are paid from this account.
Non-Contributory Group Insurance Premium Reserve – PFRS – Local ($34,659,280); PERS – Local
($64,452,031)
The Non-Contributory Group Insurance Premium Reserve (NJSA: PFRS 43:16A-56; PERS 43:15A-91)
represents the accumulation of employer group life insurance contributions in excess of premiums disbursed

STATE OF NEW JERSEY
DIVISION OF PENSIONS AND BENEFITS
Notes to Financial Statements
June 30, 2017
54 (Continued)
to the insurance carrier since the inception of the noncontributory death benefit program plus reserves held
by the insurance carrier. Members are eligible by statute for the noncontributory group life insurance plan in
the first year of membership. TPAF, PFRS – State and PERS – State show a zero balance as these
premium expenses are funded on a monthly basis.
Pension Accumulation Reserve – PFRS ($-3,221,326,814)
The Pension Accumulation Reserve (NJSA: PFRS 43:16A-16) is credited with the contributions of the State
of New Jersey and other employers. Interest earnings, after crediting the Retirement Reserve, as required,
are credited to this account. Additionally, payments for administrative and miscellaneous expenses are made
from this Reserve.
Pension Reserve – CPFPF ($1,904,496)
The Pension Reserve (NJSA: CPFPF 43:16-5) is credited with State of New Jersey contributions and
investment income.
Benefit Enhancement Reserve – PERS – Local ($159,963,744)
The Benefit Enhancement Reserve (NJSA: 43:15A-22) is a special reserve from which the required normal
contributions to provide benefit increases under Chapter 353, P.L. 2001 and Chapter 133, P.L. 2001 will be
charged. The reserve was established in 2002 and credited with excess assets equivalent to member
contributions for State fiscal years 2000 and 2001 by transferring reserves in the Contingent Reserve to the
Benefit Enhancement Reserve. Additional transfers will be made, as required, to maintain a reserve balance
equal to the present value of expected additional normal contributions due to the increased benefits.
SHBP Reserve Fund – Local - Retired ($213,255,917)
The net position of SHBP – Local (NJSA: SHBP 52:14-17.42) is available to pay claims of future periods.
These reserves are maintained by the fund to stabilize rates and to meet unexpected increase in claims.
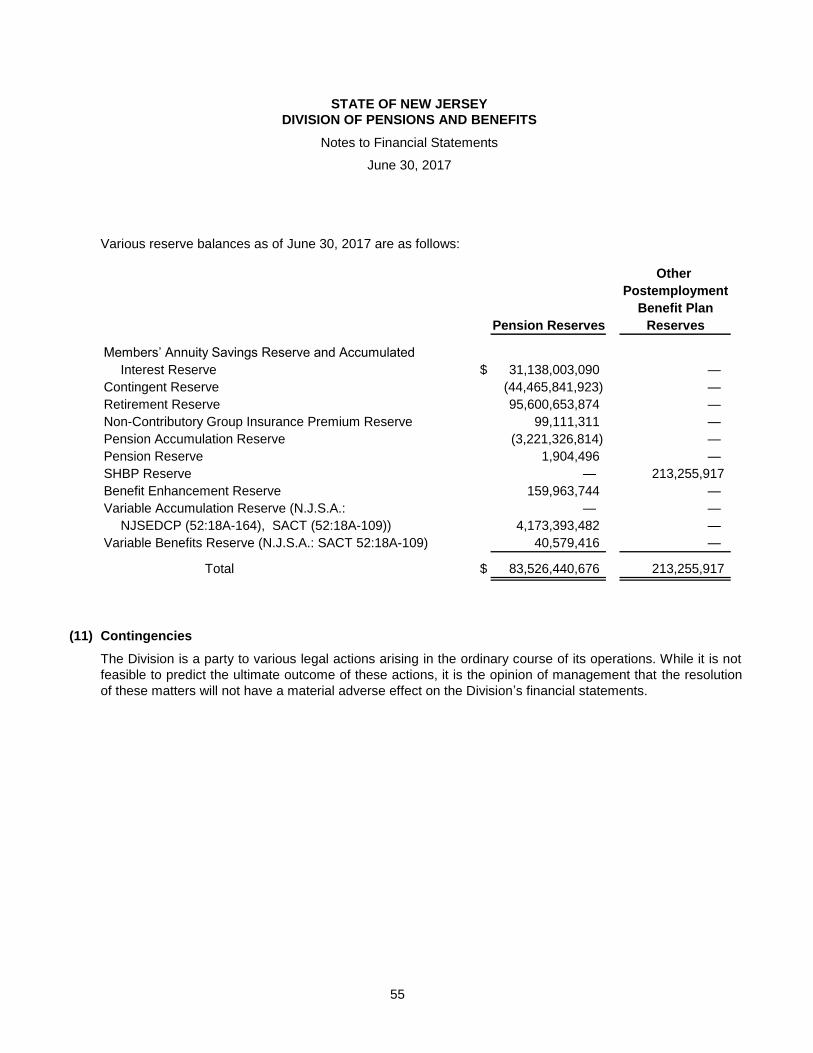
STATE OF NEW JERSEY
DIVISION OF PENSIONS AND BENEFITS
Notes to Financial Statements
June 30, 2017
55
Various reserve balances as of June 30, 2017 are as follows:
Other
Postemployment
Benefit Plan
Pension Reserves Reserves
Members’ Annuity Savings Reserve and Accumulated
Interest Reserve $ 31,138,003,090 —
Contingent Reserve (44,465,841,923) —
Retirement Reserve 95,600,653,874 —
Non-Contributory Group Insurance Premium Reserve 99,111,311 —
Pension Accumulation Reserve (3,221,326,814) —
Pension Reserve 1,904,496 —
SHBP Reserve — 213,255,917
Benefit Enhancement Reserve 159,963,744 —
Variable Accumulation Reserve (N.J.S.A.: — —
NJSEDCP (52:18A-164), SACT (52:18A-109)) 4,173,393,482 —
Variable Benefits Reserve (N.J.S.A.: SACT 52:18A-109) 40,579,416 —
Total $ 83,526,440,676 213,255,917
(11) Contingencies
The Division is a party to various legal actions arising in the ordinary course of its operations. While it is not
feasible to predict the ultimate outcome of these actions, it is the opinion of management that the resolution
of these matters will not have a material adverse effect on the Division’s financial statements.
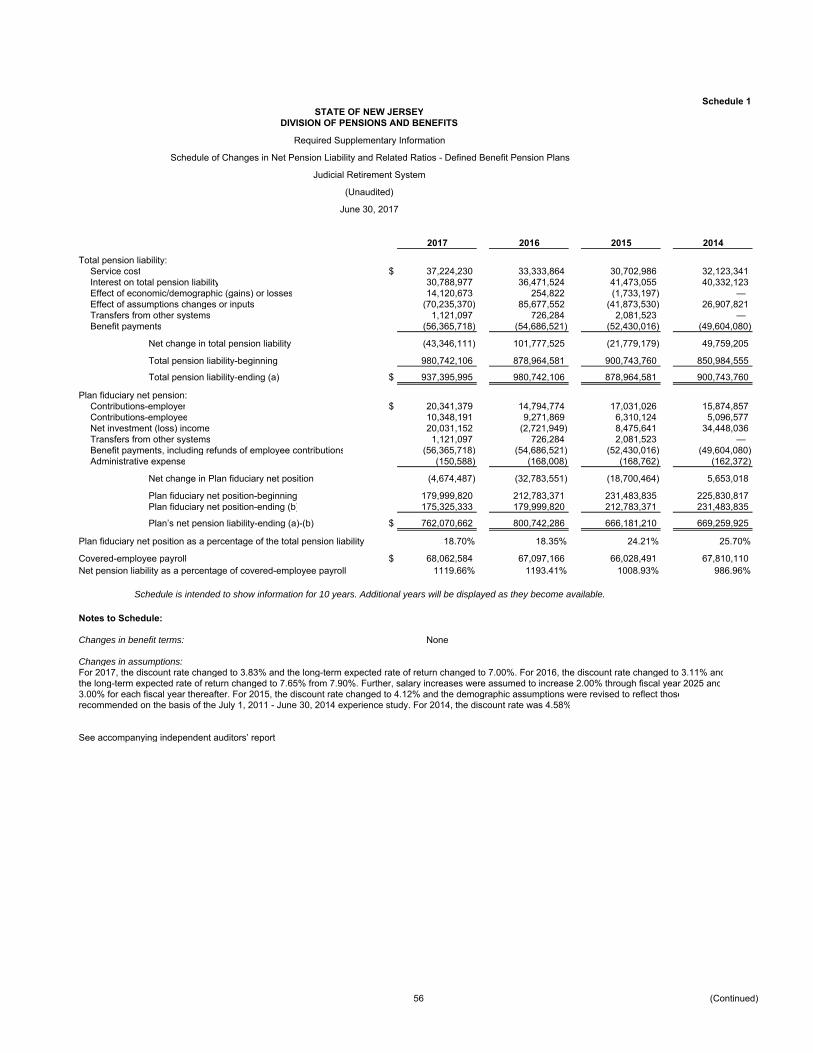
Schedule 1
2017 2016 2015 2014
Total pension liability:Service cost $ 37,224,230 33,333,864 30,702,986 32,123,341 Interest on total pension liability 30,788,977 36,471,524 41,473,055 40,332,123 Effect of economic/demographic (gains) or losses 14,120,673 254,822 (1,733,197) — Effect of assumptions changes or inputs (70,235,370) 85,677,552 (41,873,530) 26,907,821 Transfers from other systems 1,121,097 726,284 2,081,523 — Benefit payments (56,365,718) (54,686,521) (52,430,016) (49,604,080)
Net change in total pension liability (43,346,111) 101,777,525 (21,779,179) 49,759,205
Total pension liability-beginning 980,742,106 878,964,581 900,743,760 850,984,555
Total pension liability-ending (a) $ 937,395,995 980,742,106 878,964,581 900,743,760
Plan fiduciary net pension:Contributions-employer $ 20,341,379 14,794,774 17,031,026 15,874,857 Contributions-employee 10,348,191 9,271,869 6,310,124 5,096,577 Net investment (loss) income 20,031,152 (2,721,949) 8,475,641 34,448,036 Transfers from other systems 1,121,097 726,284 2,081,523 — Benefit payments, including refunds of employee contributions (56,365,718) (54,686,521) (52,430,016) (49,604,080)Administrative expense (150,588) (168,008) (168,762) (162,372)
Net change in Plan fiduciary net position (4,674,487) (32,783,551) (18,700,464) 5,653,018
Plan fiduciary net position-beginning 179,999,820 212,783,371 231,483,835 225,830,817 Plan fiduciary net position-ending (b) 175,325,333 179,999,820 212,783,371 231,483,835
Plan’s net pension liability-ending (a)-(b) $ 762,070,662 800,742,286 666,181,210 669,259,925
Plan fiduciary net position as a percentage of the total pension liability 18.70% 18.35% 24.21% 25.70%
Covered-employee payroll $ 68,062,584 67,097,166 66,028,491 67,810,110 Net pension liability as a percentage of covered-employee payroll 1119.66% 1193.41% 1008.93% 986.96%
Notes to Schedule:
Changes in benefit terms: None
Changes in assumptions: For 2017, the discount rate changed to 3.83% and the long-term expected rate of return changed to 7.00%. For 2016, the discount rate changed to 3.11% andthe long-term expected rate of return changed to 7.65% from 7.90%. Further, salary increases were assumed to increase 2.00% through fiscal year 2025 and3.00% for each fiscal year thereafter. For 2015, the discount rate changed to 4.12% and the demographic assumptions were revised to reflect thoserecommended on the basis of the July 1, 2011 - June 30, 2014 experience study. For 2014, the discount rate was 4.58%
See accompanying independent auditors’ report.
Schedule is intended to show information for 10 years. Additional years will be displayed as they become available.
STATE OF NEW JERSEY
June 30, 2017
(Unaudited)
Schedule of Changes in Net Pension Liability and Related Ratios - Defined Benefit Pension Plans
Required Supplementary Information
DIVISION OF PENSIONS AND BENEFITS
Judicial Retirement System
56 (Continued)
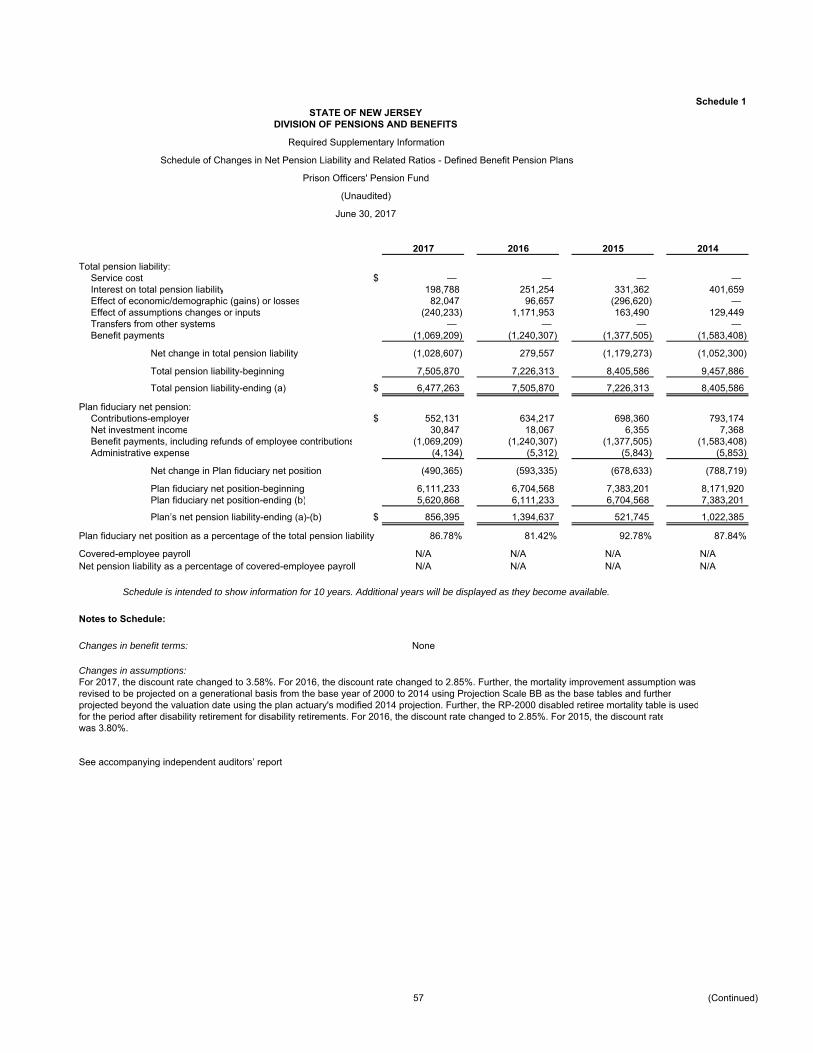
Schedule 1
2017 2016 2015 2014
Total pension liability:Service cost $ — — — — Interest on total pension liability 198,788 251,254 331,362 401,659 Effect of economic/demographic (gains) or losses 82,047 96,657 (296,620) — Effect of assumptions changes or inputs (240,233) 1,171,953 163,490 129,449 Transfers from other systems — — — — Benefit payments (1,069,209) (1,240,307) (1,377,505) (1,583,408)
Net change in total pension liability (1,028,607) 279,557 (1,179,273) (1,052,300)
Total pension liability-beginning 7,505,870 7,226,313 8,405,586 9,457,886
Total pension liability-ending (a) $ 6,477,263 7,505,870 7,226,313 8,405,586
Plan fiduciary net pension:Contributions-employer $ 552,131 634,217 698,360 793,174 Net investment income 30,847 18,067 6,355 7,368 Benefit payments, including refunds of employee contributions (1,069,209) (1,240,307) (1,377,505) (1,583,408)Administrative expense (4,134) (5,312) (5,843) (5,853)
Net change in Plan fiduciary net position (490,365) (593,335) (678,633) (788,719)
Plan fiduciary net position-beginning 6,111,233 6,704,568 7,383,201 8,171,920 Plan fiduciary net position-ending (b) 5,620,868 6,111,233 6,704,568 7,383,201
Plan’s net pension liability-ending (a)-(b) $ 856,395 1,394,637 521,745 1,022,385
Plan fiduciary net position as a percentage of the total pension liability 86.78% 81.42% 92.78% 87.84%
Covered-employee payroll N/A N/A N/A N/ANet pension liability as a percentage of covered-employee payroll N/A N/A N/A N/A
Notes to Schedule:
Changes in benefit terms: None
Changes in assumptions: For 2017, the discount rate changed to 3.58%. For 2016, the discount rate changed to 2.85%. Further, the mortality improvement assumption was revised to be projected on a generational basis from the base year of 2000 to 2014 using Projection Scale BB as the base tables and further projected beyond the valuation date using the plan actuary's modified 2014 projection. Further, the RP-2000 disabled retiree mortality table is usedfor the period after disability retirement for disability retirements. For 2016, the discount rate changed to 2.85%. For 2015, the discount ratewas 3.80%.
See accompanying independent auditors’ report.
June 30, 2017
Schedule is intended to show information for 10 years. Additional years will be displayed as they become available.
STATE OF NEW JERSEYDIVISION OF PENSIONS AND BENEFITS
Required Supplementary Information
Schedule of Changes in Net Pension Liability and Related Ratios - Defined Benefit Pension Plans
(Unaudited)
Prison Officers' Pension Fund
57 (Continued)

Schedule 1
2017 2016 2015 2014Total pension liability:
Service cost $ 139,506,057 113,546,510 93,740,921 93,623,020 Interest on total pension liability 202,545,532 221,675,495 216,980,562 209,010,706 Effect of economic/demographic (gains) or losses 23,786,696 (17,580,385) 35,245,543 — Effect of assumptions changes or inputs (697,970,471) 747,941,075 435,691,094 92,686,900 Transfers from other systems 3,925 54,000 222,557 — Benefit payments (217,303,946) (213,436,150) (206,493,624) (197,958,938)
Net change in total pension liability (549,432,207) 852,200,545 575,387,053 197,361,688
Total pension liability-beginning 5,673,706,321 4,821,505,776 4,246,118,723 4,048,757,035
Total pension liability-ending (a) $ 5,124,274,114 5,673,706,321 4,821,505,776 4,246,118,723
Plan fiduciary net pension:Contributions-employer $ 53,006,614 37,435,541 38,527,297 36,436,923 Contributions-employee 23,721,785 22,818,295 22,315,431 24,034,496 Net investment (loss) income 207,401,590 (19,284,054) 75,532,779 287,098,217 Transfers from other systems 3,925 54,000 222,557 — Benefit payments, including refunds of employee contributions (217,303,946) (213,436,150) (206,493,624) (197,958,938)Administrative expense (294,745) (334,630) (351,724) (280,026)
Net change in Plan fiduciary net position 66,535,223 (172,746,998) (70,247,284) 149,330,672
Plan fiduciary net position-beginning 1,694,962,112 1,867,709,110 1,937,956,394 1,788,625,722 Plan fiduciary net position-ending (b) 1,761,497,335 1,694,962,112 1,867,709,110 1,937,956,394
Plan’s net pension liability-ending (a)-(b) $ 3,362,776,779 3,978,744,209 2,953,796,666 2,308,162,329
Plan fiduciary net position as a percentage of the total pension liability 34.38% 29.87% 38.74% 45.64%
Covered-employee payroll $ 277,771,135 275,477,457 262,496,289 262,063,829 Net pension liability as a percentage of covered-employee payroll 1210.63% 1444.31% 1125.27% 880.76%
Notes to Schedule:
Changes in benefit terms: In 2017, Chapter 26, P.L. 2016 amended statutes to change the definition of child to include a child 18 years of age or older and enrolled in asecondary school, or under the age of 24 and enrolled in a degree program in an institution of higher education for at least 12 credits in eachsemester, provided that the member died in the line of duty while in active service. It also increases the accidental death benefit payable to childrenif there is no surviving spouse to 70% of final compensation.
Changes in assumptions: For 2017, the discount rate changed to 4.42% and the long-term expected rate of return changed to 7.00%. For 2016, the discount rate changed to 3.55% and the long-term expected rate of return changed to 7.65% from 7.90%. Further, salary increases were assumed to increased 2.95% throughfiscal year 2025 and 3.95% for each fiscal year thereafter. For 2015, the discount rate changed to 4.59% and the demographic assumptions wererevised to reflect those recommended on the basis of the July 1, 2011 - June 30, 2014 experience study. In addition, the social security wage basewas set at $118,500 for 2015, increasing 4.00% per annum, compounded annually and the 401(a)(17) pay limit was set at $265,000 for 2015,increasing 3.00% per annum, compounded annually. For 2014, the discount rate was 5.12%
See accompanying independent auditors’ report.
June 30, 2017
Schedule is intended to show information for 10 years. Additional years will be displayed as they become available.
(Unaudited)
STATE OF NEW JERSEYDIVISION OF PENSIONS AND BENEFITS
Required Supplementary Information
Schedule of Changes in Net Pension Liability and Related Ratios - Defined Benefit Pension Plans
State Police Retirement System
58 (Continued)

Schedule 1
2017 2016 2015 2014
Total pension liability:Service cost $ — — — — Interest on total pension liability 260,211 352,889 504,066 632,080 Effect of economic/demographic (gains) or losses (984,588) (71,313) (993,528) — Effect of assumptions changes or inputs (236,022) 1,273,909 193,719 163,528 Benefit payments (1,535,623) (1,881,252) (2,445,627) (2,942,035)
Net change in total pension liability (2,496,022) (325,767) (2,741,370) (2,146,427)
Total pension liability-beginning 9,892,635 10,218,402 12,959,772 15,106,199
Total pension liability-ending (a) $ 7,396,613 9,892,635 10,218,402 12,959,772
Plan fiduciary net pension:Contributions-employer $ 1,539,280 1,344,017 1,577,751 1,900,831 Net investment income 10,099 10,856 198 585 Benefit payments, including refunds of employee contributions (1,535,623) (1,881,252) (2,445,627) (2,942,035)Administrative expense (4,188) (6,643) (8,003) (9,566)
Net change in Plan fiduciary net position 9,568 (533,022) (875,681) (1,050,185)
Plan fiduciary net position-beginning 1,894,928 2,427,950 3,303,631 4,353,816 Plan fiduciary net position-ending (b) 1,904,496 1,894,928 2,427,950 3,303,631
Plan’s net pension liability-ending (a)-(b) $ 5,492,117 7,997,707 7,790,452 9,656,141
Plan fiduciary net position as a percentage of the total pension liability 25.75% 19.15% 23.76% 25.49%
Covered-employee payroll N/A N/A N/A N/ANet pension liability as a percentage of covered-employee payroll N/A N/A N/A N/A
Notes to Schedule:
Changes in benefit terms: None
Changes in assumptions: For 2017, the discount rate changed to 3.58%. For 2016, the discount rate changed to 2.85%. Further, the mortality improvement assumption was revised to be projected on a generational basis from the base year of 2000 to 2014 using Projection Scale BB as the base tables and further projected beyond the valuation date using the plan actuary's modified 2014 projection. Further, the RP-2000 disabled retiree mortality table is usedfor the period after disability retirement for disability retirements. For 2015, the discount rate changed to 3.80%. For 2014, the discount ratewas 4.29%.
See accompanying independent auditors’ report.
June 30, 2017
Schedule is intended to show information for 10 years. Additional years will be displayed as they become available.
STATE OF NEW JERSEYDIVISION OF PENSIONS AND BENEFITS
Required Supplementary Information
Schedule of Changes in Net Pension Liability and Related Ratios - Defined Benefit Pension Plans
Consolidated Police and Firemen's Pension Fund
(Unaudited)
59 (Continued)
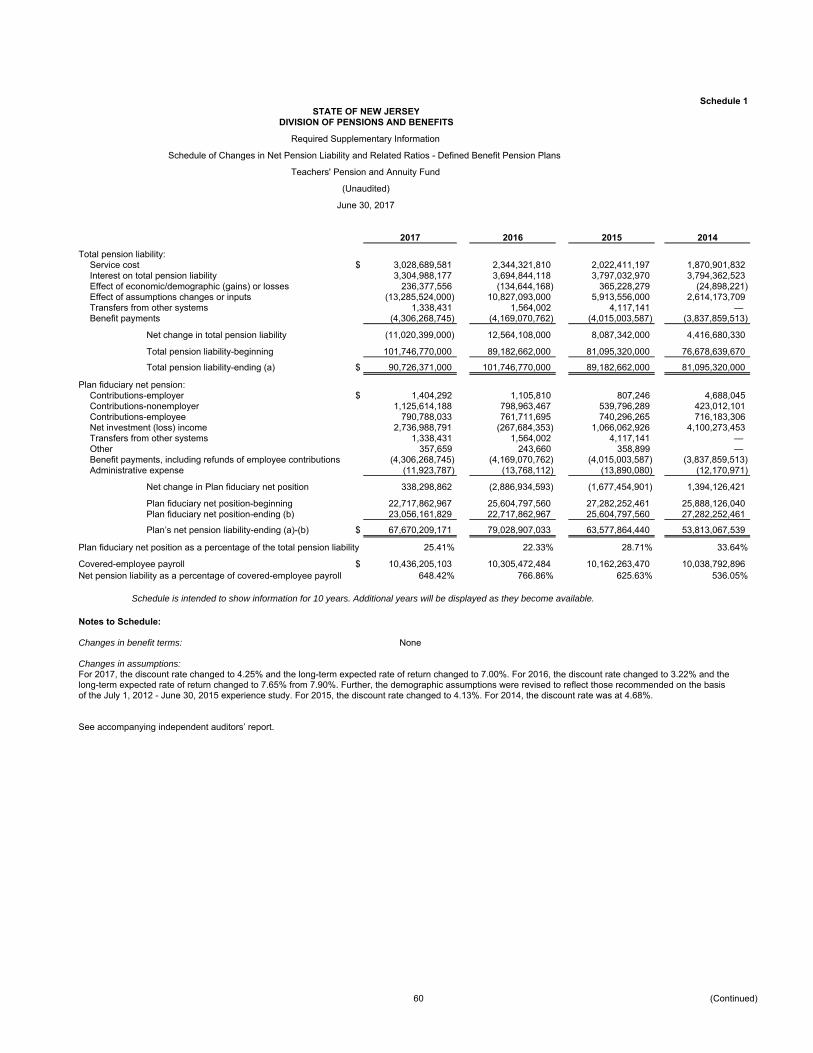
Schedule 1
2017 2016 2015 2014
Total pension liability:Service cost $ 3,028,689,581 2,344,321,810 2,022,411,197 1,870,901,832 Interest on total pension liability 3,304,988,177 3,694,844,118 3,797,032,970 3,794,362,523 Effect of economic/demographic (gains) or losses 236,377,556 (134,644,168) 365,228,279 (24,898,221)Effect of assumptions changes or inputs (13,285,524,000) 10,827,093,000 5,913,556,000 2,614,173,709 Transfers from other systems 1,338,431 1,564,002 4,117,141 — Benefit payments (4,306,268,745) (4,169,070,762) (4,015,003,587) (3,837,859,513)
Net change in total pension liability (11,020,399,000) 12,564,108,000 8,087,342,000 4,416,680,330
Total pension liability-beginning 101,746,770,000 89,182,662,000 81,095,320,000 76,678,639,670
Total pension liability-ending (a) $ 90,726,371,000 101,746,770,000 89,182,662,000 81,095,320,000
Plan fiduciary net pension:Contributions-employer $ 1,404,292 1,105,810 807,246 4,688,045 Contributions-nonemployer 1,125,614,188 798,963,467 539,796,289 423,012,101 Contributions-employee 790,788,033 761,711,695 740,296,265 716,183,306 Net investment (loss) income 2,736,988,791 (267,684,353) 1,066,062,926 4,100,273,453 Transfers from other systems 1,338,431 1,564,002 4,117,141 — Other 357,659 243,660 358,899 — Benefit payments, including refunds of employee contributions (4,306,268,745) (4,169,070,762) (4,015,003,587) (3,837,859,513)Administrative expense (11,923,787) (13,768,112) (13,890,080) (12,170,971)
Net change in Plan fiduciary net position 338,298,862 (2,886,934,593) (1,677,454,901) 1,394,126,421
Plan fiduciary net position-beginning 22,717,862,967 25,604,797,560 27,282,252,461 25,888,126,040 Plan fiduciary net position-ending (b) 23,056,161,829 22,717,862,967 25,604,797,560 27,282,252,461
Plan’s net pension liability-ending (a)-(b) $ 67,670,209,171 79,028,907,033 63,577,864,440 53,813,067,539
Plan fiduciary net position as a percentage of the total pension liability 25.41% 22.33% 28.71% 33.64%
Covered-employee payroll $ 10,436,205,103 10,305,472,484 10,162,263,470 10,038,792,896 Net pension liability as a percentage of covered-employee payroll 648.42% 766.86% 625.63% 536.05%
Notes to Schedule:
Changes in benefit terms: None
Changes in assumptions: For 2017, the discount rate changed to 4.25% and the long-term expected rate of return changed to 7.00%. For 2016, the discount rate changed to 3.22% and the long-term expected rate of return changed to 7.65% from 7.90%. Further, the demographic assumptions were revised to reflect those recommended on the basis of the July 1, 2012 - June 30, 2015 experience study. For 2015, the discount rate changed to 4.13%. For 2014, the discount rate was at 4.68%.
See accompanying independent auditors’ report.
June 30, 2017
Schedule is intended to show information for 10 years. Additional years will be displayed as they become available.
STATE OF NEW JERSEYDIVISION OF PENSIONS AND BENEFITS
Required Supplementary Information
Schedule of Changes in Net Pension Liability and Related Ratios - Defined Benefit Pension Plans
Teachers' Pension and Annuity Fund
(Unaudited)
60 (Continued)

Schedule 1
2017 2016 2015 2014
Total pension liability:Service cost $ 1,136,338,028 1,148,613,712 994,248,683 1,079,166,175 Interest on total pension liability 2,738,598,309 2,751,445,220 2,680,664,300 2,535,619,539 Effect of economic/demographic (gains) or losses 89,364,940 (34,916,637) (215,122,438) — Effect of assumptions changes or inputs (3,534,553,975) 343,078,737 3,755,474,472 649,814,155 Transfers from other systems 289,960 358,929 800,782 — Benefit payments (2,421,485,437) (2,324,175,953) (2,205,464,297) (2,105,829,011)
Net change in total pension liability (1,991,448,175) 1,884,404,008 5,010,601,502 2,158,770,858
Total pension liability-beginning 49,402,169,913 47,517,765,905 42,507,164,403 40,348,393,545
Total pension liability-ending (a) $ 47,410,721,738 49,402,169,913 47,517,765,905 42,507,164,403
Plan fiduciary net pension:Contributions-employer $ 1,002,043,734 900,033,567 883,776,917 858,047,628 Contributions-nonemployer 86,467,000 61,466,000 76,038,000 — Contributions-employee 395,878,384 388,681,408 386,991,641 385,660,096 Net investment (loss) income 2,791,104,860 (150,693,159) 922,598,676 3,381,553,869 Transfers from other systems 289,960 358,929 800,782 — Employer specific contributions - additional contribution 268,910 1,923,531 535,424 — Employer specific contributions - delayed appropriation 892,514 763,176 865,936 — Employer specific contributions - delayed enrollments 179,386 142,034 224,629 — Employer specific contributions - retroactive 11,476,881 3,661,101 24,536,440 — Benefit payments, including refunds of employee contributions (2,421,485,437) (2,324,175,953) (2,205,464,297) (2,105,829,011)Administrative expense (4,124,457) (4,292,891) (4,531,012) (3,884,342)
Net change in Plan fiduciary net position 1,862,991,735 (1,122,132,257) 86,373,136 2,515,548,240
Plan fiduciary net position-beginning 23,984,726,664 25,106,858,921 25,020,485,785 22,504,937,545 Plan fiduciary net position-ending (b) 25,847,718,399 23,984,726,664 25,106,858,921 25,020,485,785
Plan’s net pension liability-ending (a)-(b) $ 21,563,003,339 25,417,443,249 22,410,906,984 17,486,678,618
Plan fiduciary net position as a percentage of the total pension liability 54.52% 48.55% 52.84% 58.86%
Covered-employee payroll $ 3,726,807,562 3,695,509,355 3,682,677,356 3,678,910,266 Net pension liability as a percentage of covered-employee payroll 578.59% 687.79% 608.55% 475.32%
Notes to Schedule:
Changes in benefit terms: In 2017, Chapter 26, P.L. 2016 increased the accidental death benefit payable to children if there is no surviving spouse to 70% of final compensation.
Changes in assumptions: For 2017, the discount rate changed to 6.14% and the long-term rate of returned changed to 7.00%. For 2016, the discount rate changed to 5.55%, thelong-term expected rate of return changed to 7.65% from 7.90%, and the mortality improvement scale incorporated the plan actuary's modified 2014projection scale. Further, salary increases were assumed to increase between 2.10% and 8.98% (based on age) through fiscal year 2026 and 3.10%and 9.98% (based on age) for each fiscal year thereafter. For 2015, the discount rate changed to 5.79% and demographic assumptions were revised inaccordancewith the results of the July 1, 2010 - June 30, 2013 experience study. For 2014, the discount rate was 6.32%
See accompanying independent auditors’ report.
June 30, 2017
Schedule is intended to show information for 10 years. Additional years will be displayed as they become available.
STATE OF NEW JERSEYDIVISION OF PENSIONS AND BENEFITS
Required Supplementary Information
Schedule of Changes in Net Pension Liability and Related Ratios - Defined Benefit Pension Plans
Police and Firemen's Retirement System
(Unaudited)
61 (Continued)

Schedule 1
2017 2016 2015 2014
Total pension liability:Service cost $ 1,865,398,219 1,628,065,678 1,523,631,386 1,592,214,831 Interest on total pension liability 3,412,789,012 3,653,373,426 3,647,688,354 3,506,486,225 Effect of economic/demographic (gains) or losses 306,941,390 600,806,505 1,050,795,158 — Effect of assumptions changes or inputs (10,156,789,076) 8,792,817,065 4,091,557,460 1,222,437,554 Transfers from other systems 854,976 778,753 1,651,542 — Benefit payments (3,810,818,692) (3,629,651,915) (3,441,046,065) (3,259,290,114)
Net change in total pension liability (8,381,624,171) 11,046,189,512 6,874,277,835 3,061,848,496
Total pension liability-beginning 85,769,888,074 74,723,698,562 67,849,420,727 64,787,572,231
Total pension liability-ending (a) $ 77,388,263,903 85,769,888,074 74,723,698,562 67,849,420,727
Plan fiduciary net pension:Contributions-employer $ 1,465,931,579 1,273,425,342 1,085,237,214 917,689,000 Contributions-employee 847,952,137 821,305,787 805,232,235 797,818,225 Net investment (loss) income 3,202,393,837 (237,215,643) 1,117,827,113 4,102,964,869 Transfers from other systems 854,976 778,753 1,651,542 — Employer specific contributions - additional contribution 25,676 257,850 111,824 — Employer specific contributions - delayed appropriation 3,224,612 1,721,199 1,664,415 — Employer specific contributions - delayed enrollments 1,030,774 532,612 594,843 — Employer specific contributions - retroactive 11,230,521 687,225 6,504,878 — Other (7,797) (51,586) (31,006) — Benefit payments, including refunds of employee contributions (3,810,818,692) (3,629,651,915) (3,441,046,065) (3,259,290,114)Administrative expense (19,648,715) (23,285,920) (23,761,860) (21,756,019)
Net change in Plan fiduciary net position 1,702,168,908 (1,791,496,296) (446,014,867) 2,537,425,961
Plan fiduciary net position-beginning 26,762,070,610 28,553,566,906 28,999,581,773 26,462,155,812 Plan fiduciary net position-ending (b) 28,464,239,518 26,762,070,610 28,553,566,906 28,999,581,773
Plan’s net pension liability-ending (a)-(b) $ 48,924,024,385 59,007,817,464 46,170,131,656 38,849,838,954
Plan fiduciary net position as a percentage of the total pension liability 36.78% 31.20% 38.21% 42.74%
Covered-employee payroll $ 11,296,345,312 11,320,198,747 11,441,433,226 11,448,531,265 Net pension liability as a percentage of covered-employee payroll 433.10% 521.26% 403.53% 339.34%
Notes to Schedule:
Changes in benefit terms: None
Changes in assumptions: For 2017, the discount rate changed to 5.00% and the long-term rate of return changed to 7.00%. For 2016, the discount rate changed to 3.98%, the long-term expected rate of return changed to 7.65% from 7.90%, demographic assumptions were revised in accordance with the results of the July 1, 2011 - June 30, 2014 experience study and the mortality improvement scale incorporated the plan actuary's modified MP-2014 projection scale. Further, salary increases were assumed to increase between 1.65% and 4.15% (based on age) through fiscal year 2026 and 2.65% and 5.15% (based on age) for each fiscal year thereafter. For 2015, the discount rate changed to 4.90%. In addition, the social security wage base was set at $118,500 for 2015,increasing 4.00% per annum, compounded annually and the 401(a)(17) pay limit was set at $265,000 for 2015, increasing 3.00% per annum, compounded annually. For 2014, the discount rate was 5.39%.
See accompanying independent auditors’ report.
June 30, 2017
Schedule is intended to show information for 10 years. Additional years will be displayed as they become available.
(Unaudited)
STATE OF NEW JERSEYDIVISION OF PENSIONS AND BENEFITS
Required Supplementary Information
Schedule of Changes in Net Pension Liability and Related Ratios - Defined Benefit Pension Plans
Public Employees' Retirement System
62 (Continued)
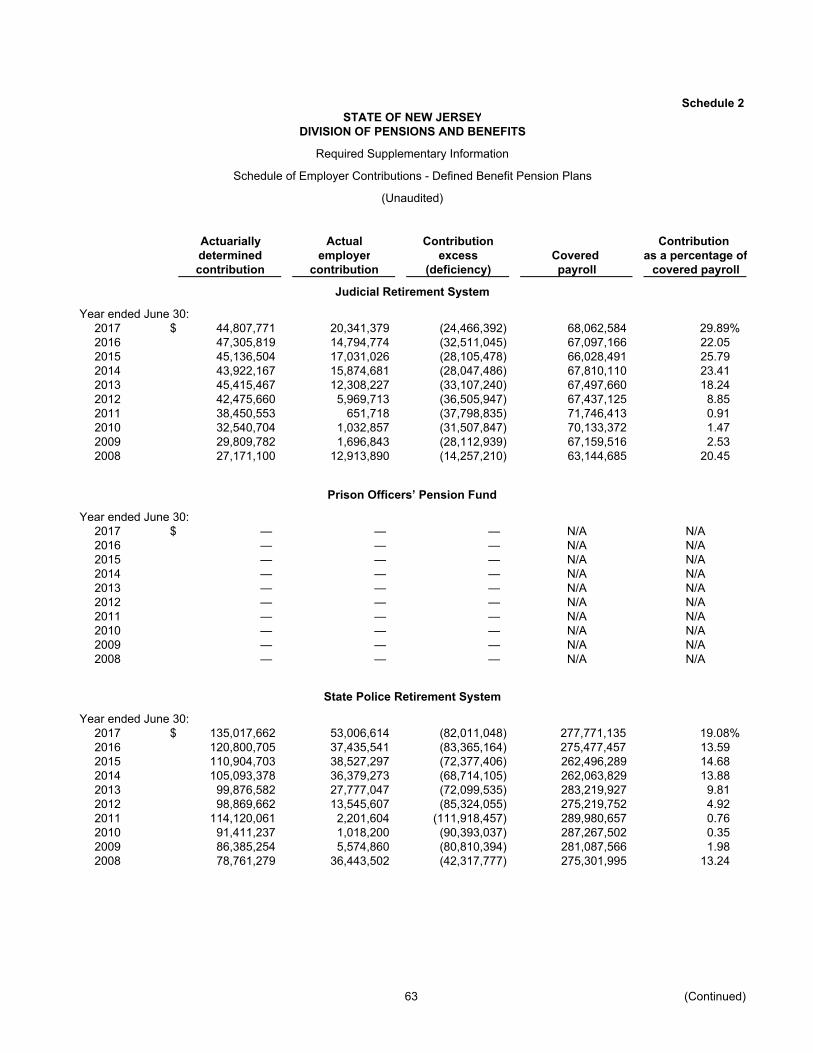
Schedule 2STATE OF NEW JERSEY
DIVISION OF PENSIONS AND BENEFITS
Required Supplementary Information
Schedule of Employer Contributions - Defined Benefit Pension Plans
(Unaudited)
Actuarially Actual Contribution Contribution determined employer excess Covered as a percentage ofcontribution contribution (deficiency) payroll covered payroll
Judicial Retirement System
Year ended June 30:2017 $ 44,807,771 20,341,379 (24,466,392) 68,062,584 29.89%2016 47,305,819 14,794,774 (32,511,045) 67,097,166 22.05 2015 45,136,504 17,031,026 (28,105,478) 66,028,491 25.79 2014 43,922,167 15,874,681 (28,047,486) 67,810,110 23.41 2013 45,415,467 12,308,227 (33,107,240) 67,497,660 18.24 2012 42,475,660 5,969,713 (36,505,947) 67,437,125 8.85 2011 38,450,553 651,718 (37,798,835) 71,746,413 0.91 2010 32,540,704 1,032,857 (31,507,847) 70,133,372 1.47 2009 29,809,782 1,696,843 (28,112,939) 67,159,516 2.53 2008 27,171,100 12,913,890 (14,257,210) 63,144,685 20.45
Prison Officers’ Pension Fund
Year ended June 30:2017 $ — — — N/A N/A2016 — — — N/A N/A2015 — — — N/A N/A2014 — — — N/A N/A2013 — — — N/A N/A2012 — — — N/A N/A2011 — — — N/A N/A2010 — — — N/A N/A2009 — — — N/A N/A2008 — — — N/A N/A
State Police Retirement System
Year ended June 30:2017 $ 135,017,662 53,006,614 (82,011,048) 277,771,135 19.08%2016 120,800,705 37,435,541 (83,365,164) 275,477,457 13.59 2015 110,904,703 38,527,297 (72,377,406) 262,496,289 14.68 2014 105,093,378 36,379,273 (68,714,105) 262,063,829 13.88 2013 99,876,582 27,777,047 (72,099,535) 283,219,927 9.81 2012 98,869,662 13,545,607 (85,324,055) 275,219,752 4.92 2011 114,120,061 2,201,604 (111,918,457) 289,980,657 0.76 2010 91,411,237 1,018,200 (90,393,037) 287,267,502 0.35 2009 86,385,254 5,574,860 (80,810,394) 281,087,566 1.98 2008 78,761,279 36,443,502 (42,317,777) 275,301,995 13.24
63 (Continued)
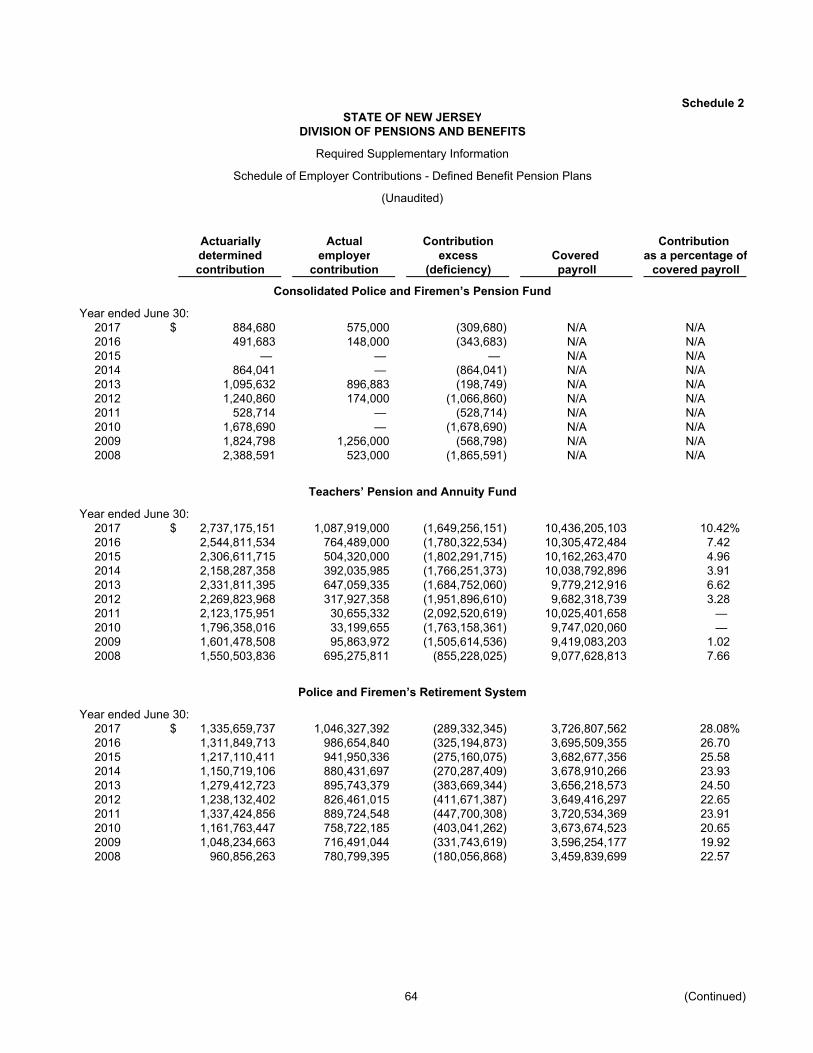
Schedule 2STATE OF NEW JERSEY
DIVISION OF PENSIONS AND BENEFITS
Required Supplementary Information
Schedule of Employer Contributions - Defined Benefit Pension Plans
(Unaudited)
Actuarially Actual Contribution Contribution determined employer excess Covered as a percentage ofcontribution contribution (deficiency) payroll covered payroll
Consolidated Police and Firemen’s Pension Fund
Year ended June 30:2017 $ 884,680 575,000 (309,680) N/A N/A2016 491,683 148,000 (343,683) N/A N/A2015 — — — N/A N/A2014 864,041 — (864,041) N/A N/A2013 1,095,632 896,883 (198,749) N/A N/A2012 1,240,860 174,000 (1,066,860) N/A N/A2011 528,714 — (528,714) N/A N/A2010 1,678,690 — (1,678,690) N/A N/A2009 1,824,798 1,256,000 (568,798) N/A N/A2008 2,388,591 523,000 (1,865,591) N/A N/A
Teachers’ Pension and Annuity Fund
Year ended June 30:2017 $ 2,737,175,151 1,087,919,000 (1,649,256,151) 10,436,205,103 10.42%2016 2,544,811,534 764,489,000 (1,780,322,534) 10,305,472,484 7.42 2015 2,306,611,715 504,320,000 (1,802,291,715) 10,162,263,470 4.96 2014 2,158,287,358 392,035,985 (1,766,251,373) 10,038,792,896 3.91 2013 2,331,811,395 647,059,335 (1,684,752,060) 9,779,212,916 6.62 2012 2,269,823,968 317,927,358 (1,951,896,610) 9,682,318,739 3.28 2011 2,123,175,951 30,655,332 (2,092,520,619) 10,025,401,658 — 2010 1,796,358,016 33,199,655 (1,763,158,361) 9,747,020,060 — 2009 1,601,478,508 95,863,972 (1,505,614,536) 9,419,083,203 1.02 2008 1,550,503,836 695,275,811 (855,228,025) 9,077,628,813 7.66
Police and Firemen’s Retirement System
Year ended June 30:2017 $ 1,335,659,737 1,046,327,392 (289,332,345) 3,726,807,562 28.08%2016 1,311,849,713 986,654,840 (325,194,873) 3,695,509,355 26.70 2015 1,217,110,411 941,950,336 (275,160,075) 3,682,677,356 25.58 2014 1,150,719,106 880,431,697 (270,287,409) 3,678,910,266 23.93 2013 1,279,412,723 895,743,379 (383,669,344) 3,656,218,573 24.50 2012 1,238,132,402 826,461,015 (411,671,387) 3,649,416,297 22.65 2011 1,337,424,856 889,724,548 (447,700,308) 3,720,534,369 23.91 2010 1,161,763,447 758,722,185 (403,041,262) 3,673,674,523 20.65 2009 1,048,234,663 716,491,044 (331,743,619) 3,596,254,177 19.92 2008 960,856,263 780,799,395 (180,056,868) 3,459,839,699 22.57
64 (Continued)

Schedule 2STATE OF NEW JERSEY
DIVISION OF PENSIONS AND BENEFITSRequired Supplementary Information
Schedule of Employer Contributions - Defined Benefit Pension Plans
(Unaudited)
Actuarially Actual Contribution Contribution determined employer excess Covered as a percentage ofcontribution contribution (deficiency) payroll covered payroll
Public Employees’ Retirement SystemYear ended June 30:
2017 $ 2,207,859,541 1,448,520,025 (759,339,516) 11,296,345,312 12.82%2016 2,097,570,117 1,265,246,226 (832,323,891) 11,320,198,747 11.18 2015 1,935,315,246 1,067,584,583 (867,730,663) 11,441,433,226 9.33 2014 1,797,073,081 941,023,184 (856,049,897) 11,448,531,265 8.22 2013 1,911,359,009 1,087,389,140 (823,969,869) 11,433,091,635 9.51 2012 1,895,158,413 976,093,907 (919,064,506) 11,609,042,726 8.41 2011 1,824,391,081 832,016,186 (992,374,895) 11,981,354,783 6.94 2010 1,422,475,763 640,282,996 (782,192,767) 11,995,447,141 5.34 2009 1,285,791,399 627,989,949 (657,801,450) 11,815,800,825 5.31 2008 1,145,564,136 646,690,366 (498,873,770) 11,418,467,816 5.66
See accompanying independent auditors’ report.
65 (Continued)
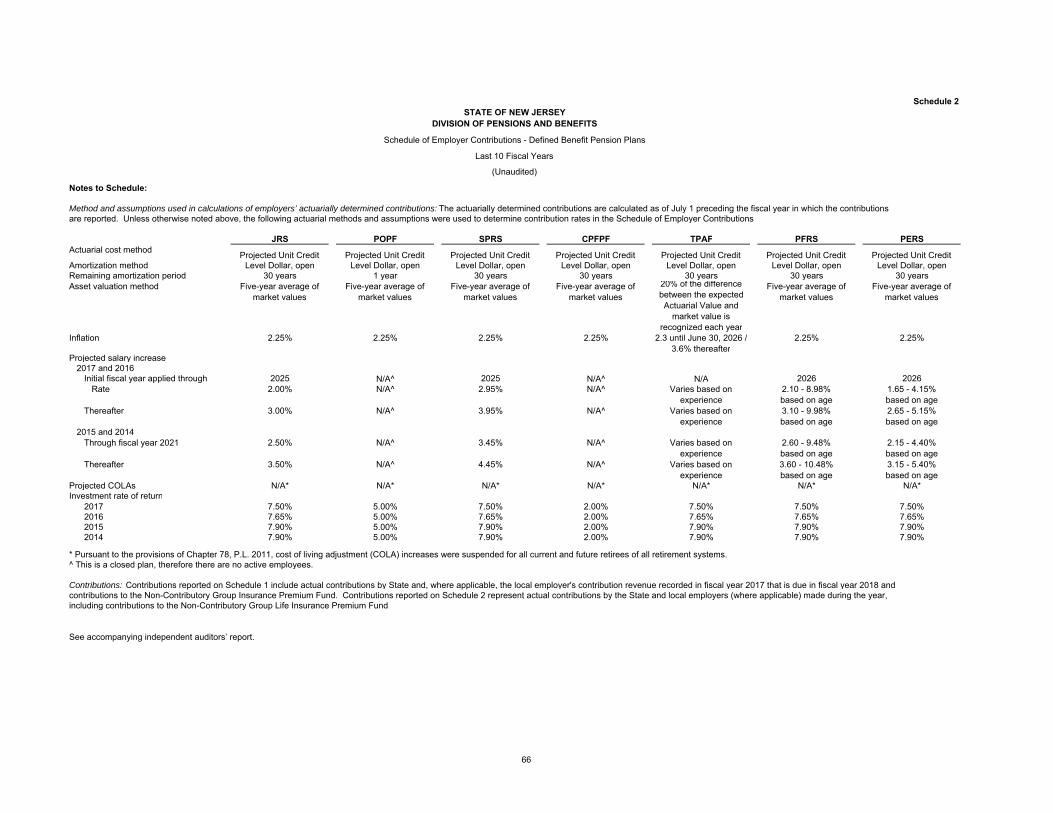
Schedule 2
Notes to Schedule:
Method and assumptions used in calculations of employers’ actuarially determined contributions: The actuarially determined contributions are calculated as of July 1 preceding the fiscal year in which the contributions are reported. Unless otherwise noted above, the following actuarial methods and assumptions were used to determine contribution rates in the Schedule of Employer Contributions.
JRS POPF SPRS CPFPF TPAF PFRS PERSActuarial cost method Projected Unit Credit Projected Unit Credit Projected Unit Credit Projected Unit Credit Projected Unit Credit Projected Unit Credit Projected Unit CreditAmortization method Level Dollar, open Level Dollar, open Level Dollar, open Level Dollar, open Level Dollar, open Level Dollar, open Level Dollar, openRemaining amortization period 30 years 1 year 30 years 30 years 30 years 30 years 30 yearsAsset valuation method Five-year average of
market values Five-year average of
market values Five-year average of
market values Five-year average of
market values 20% of the difference between the expected Actuarial Value and
market value is recognized each year
Five-year average of market values
Five-year average of market values
Inflation 2.25% 2.25% 2.25% 2.25% 2.3 until June 30, 2026 / 3.6% thereafter
2.25% 2.25%
Projected salary increase2017 and 2016
Initial fiscal year applied through 2025 N/A^ 2025 N/A^ N/A 2026 2026Rate 2.00% N/A^ 2.95% N/A^ Varies based on
experience2.10 - 8.98% based on age
1.65 - 4.15% based on age
Thereafter 3.00% N/A^ 3.95% N/A^ Varies based on experience
3.10 - 9.98% based on age
2.65 - 5.15% based on age
2015 and 2014Through fiscal year 2021 2.50% N/A^ 3.45% N/A^ Varies based on
experience2.60 - 9.48% based on age
2.15 - 4.40% based on age
Thereafter 3.50% N/A^ 4.45% N/A^ Varies based on experience
3.60 - 10.48% based on age
3.15 - 5.40% based on age
Projected COLAs N/A* N/A* N/A* N/A* N/A* N/A* N/A*Investment rate of return
2017 7.50% 5.00% 7.50% 2.00% 7.50% 7.50% 7.50%2016 7.65% 5.00% 7.65% 2.00% 7.65% 7.65% 7.65%2015 7.90% 5.00% 7.90% 2.00% 7.90% 7.90% 7.90%2014 7.90% 5.00% 7.90% 2.00% 7.90% 7.90% 7.90%
* Pursuant to the provisions of Chapter 78, P.L. 2011, cost of living adjustment (COLA) increases were suspended for all current and future retirees of all retirement systems.^ This is a closed plan, therefore there are no active employees.
Contributions: Contributions reported on Schedule 1 include actual contributions by State and, where applicable, the local employer's contribution revenue recorded in fiscal year 2017 that is due in fiscal year 2018 and contributions to the Non-Contributory Group Insurance Premium Fund. Contributions reported on Schedule 2 represent actual contributions by the State and local employers (where applicable) made during the year,including contributions to the Non-Contributory Group Life Insurance Premium Fund.
See accompanying independent auditors’ report.
STATE OF NEW JERSEYDIVISION OF PENSIONS AND BENEFITS
Schedule of Employer Contributions - Defined Benefit Pension Plans
Last 10 Fiscal Years
(Unaudited)
66
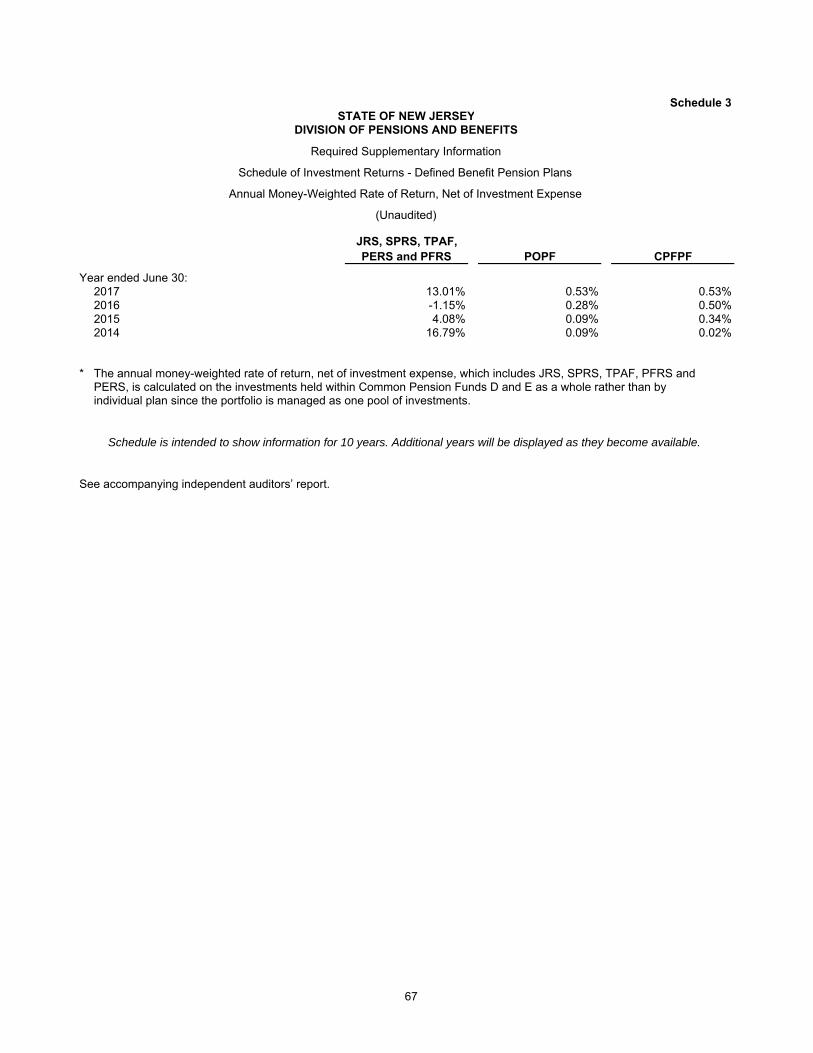
Schedule 3
JRS, SPRS, TPAF, PERS and PFRS POPF CPFPF
Year ended June 30:2017 13.01% 0.53% 0.53%2016 -1.15% 0.28% 0.50%2015 4.08% 0.09% 0.34%2014 16.79% 0.09% 0.02%
* The annual money-weighted rate of return, net of investment expense, which includes JRS, SPRS, TPAF, PFRS andPERS, is calculated on the investments held within Common Pension Funds D and E as a whole rather than by individual plan since the portfolio is managed as one pool of investments.
See accompanying independent auditors’ report.
Schedule is intended to show information for 10 years. Additional years will be displayed as they become available.
Schedule of Investment Returns - Defined Benefit Pension Plans
STATE OF NEW JERSEYDIVISION OF PENSIONS AND BENEFITS
Required Supplementary Information
Annual Money-Weighted Rate of Return, Net of Investment Expense
(Unaudited)
67
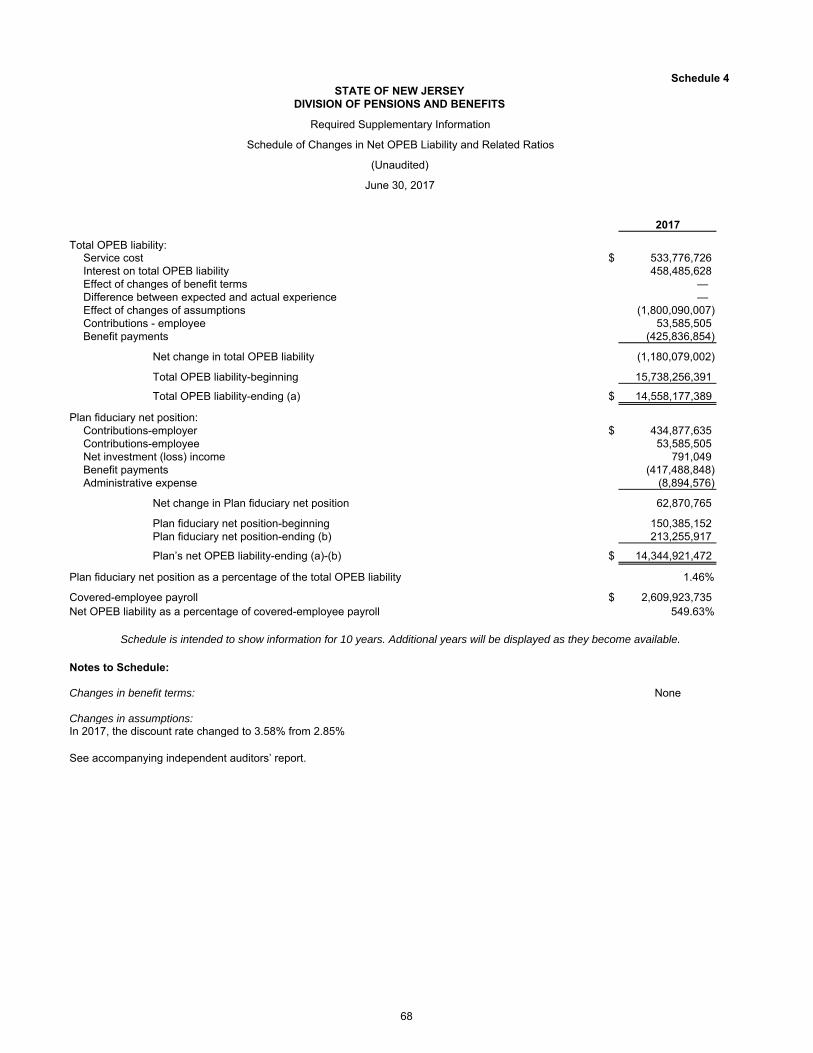
Schedule 4
2017
Total OPEB liability:Service cost $ 533,776,726 Interest on total OPEB liability 458,485,628 Effect of changes of benefit terms — Difference between expected and actual experience — Effect of changes of assumptions (1,800,090,007)Contributions - employee 53,585,505 Benefit payments (425,836,854)
Net change in total OPEB liability (1,180,079,002)
Total OPEB liability-beginning 15,738,256,391
Total OPEB liability-ending (a) $ 14,558,177,389
Plan fiduciary net position:Contributions-employer $ 434,877,635 Contributions-employee 53,585,505 Net investment (loss) income 791,049 Benefit payments (417,488,848)Administrative expense (8,894,576)
Net change in Plan fiduciary net position 62,870,765
Plan fiduciary net position-beginning 150,385,152 Plan fiduciary net position-ending (b) 213,255,917
Plan’s net OPEB liability-ending (a)-(b) $ 14,344,921,472
Plan fiduciary net position as a percentage of the total OPEB liability 1.46%
Covered-employee payroll $ 2,609,923,735 Net OPEB liability as a percentage of covered-employee payroll 549.63%
Notes to Schedule:
Changes in benefit terms: None
Changes in assumptions: In 2017, the discount rate changed to 3.58% from 2.85%.
See accompanying independent auditors’ report.
Schedule is intended to show information for 10 years. Additional years will be displayed as they become available.
STATE OF NEW JERSEYDIVISION OF PENSIONS AND BENEFITS
Required Supplementary Information
Schedule of Changes in Net OPEB Liability and Related Ratios
(Unaudited)
June 30, 2017
68

Schedule 5
Year ended June 30:2017 0.58%
See accompanying independent auditors’ report.
Schedule is intended to show information for 10 years. Additional years will be displayed as they become available.
STATE OF NEW JERSEYDIVISION OF PENSIONS AND BENEFITS
Required Supplementary Information
Schedule of Investment Returns - Other Postemployment Benefit Plan
Annual Money-Weighted Rate of Return, Net of Investment Expense
(Unaudited)
69

Schedule 6STATE OF NEW JERSEY
DIVISION OF PENSIONS AND BENEFITS
Schedule of Administrative Expenses
Year ended June 30, 2017
JRS POPF SPRS CPFPF TPAF PFRS PERS NJSEDCP Total
Personnel services:Salaries and wages $ 82,714 1,424 82,653 1,435 4,221,544 958,754 6,868,339 260,674 12,477,537 Employee benefits 35,312 759 32,143 784 2,306,210 436,329 3,155,931 144,270 6,111,738
Total personnelservices 118,026 2,183 114,796 2,219 6,527,754 1,395,083 10,024,270 404,944 18,589,275
Professional services:Actuarial services 6,241 436 36,766 430 401,401 511,185 461,397 — 1,417,856 Data processing 3,961 276 23,335 273 947,053 324,433 1,571,304 23,643 2,894,278 Information systems 9,155 593 50,360 630 1,683,685 666,913 3,602,669 — 6,014,005 Other professional (1) 240 17 1,636 17 59,213 22,705 97,616 115 181,559 Medical reviews (exams/hearings) 2,700 — 16,762 — 331,462 424,872 888,807 — 1,664,603 Elections — — — — — 33,590 30,000 — 63,590 Internal audit and legal 3,447 241 20,303 237 824,005 282,281 1,367,150 — 2,497,664
Total professionalservices 25,744 1,563 149,162 1,587 4,246,819 2,265,979 8,018,943 23,758 14,733,555
Communication:Travel 14 1 84 1 6,302 4,808 10,430 — 21,640 Telephone 376 26 2,215 26 89,874 30,788 149,114 2,800 275,219 Postage 1,441 101 8,488 99 344,487 118,011 571,556 1,000 1,045,183 Motor pool 14 1 83 1 3,383 1,159 5,613 — 10,254 Printing and office 470 33 2,769 32 112,401 38,505 186,491 — 340,701
Total communication 2,315 162 13,639 159 556,447 193,271 923,204 3,800 1,692,997
Miscellaneous:Office space 3,127 218 18,418 215 747,512 256,077 1,240,237 — 2,265,804 Maintenance 30 2 178 2 7,209 2,469 11,960 — 21,850 Equipment 87 6 514 6 20,851 7,143 34,594 — 63,201 Other services and charges 1 — 5 — 247 85 411 12,001 12,750
Total miscellaneous 3,245 226 19,115 223 775,819 265,774 1,287,202 12,001 2,363,605
Total administrativeexpenses $ 149,330 4,134 296,712 4,188 12,106,839 4,120,107 20,253,619 444,503 37,379,432
(1) Portion of consulting
See accompanying independent auditors’ report.
70
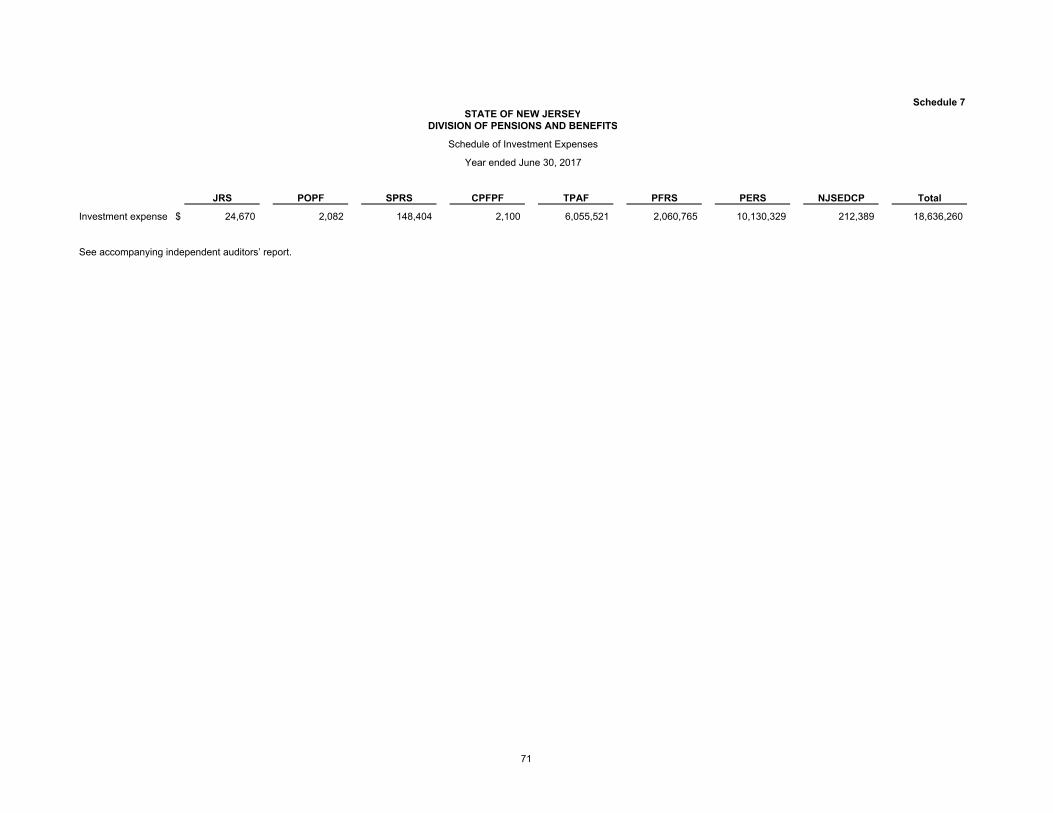
Schedule 7STATE OF NEW JERSEY
DIVISION OF PENSIONS AND BENEFITS
Schedule of Investment Expenses
Year ended June 30, 2017
JRS POPF SPRS CPFPF TPAF PFRS PERS NJSEDCP Total
Investment expense $ 24,670 2,082 148,404 2,100 6,055,521 2,060,765 10,130,329 212,389 18,636,260
See accompanying independent auditors’ report.
71

Schedule 8STATE OF NEW JERSEY
DIVISION OF PENSIONS AND BENEFITS
Schedule of Expenses for Consultants
Year ended June 30, 2017
JRS POPF SPRS CPFPF TPAF PFRS PERS Total
Actuarial:Conduent $ 6,241 436 36,766 430 — 511,185 461,397 1,016,455 Milliman — — — — 401,401 — — 401,401
Medical reviews (exams/hearings) 2,700 — 16,762 — 331,462 424,872 888,807 1,664,603 Board elections:
Global support — — — — — 33,590 30,000 63,590
Total expenses forconsultants $ 8,941 436 53,528 430 732,863 969,647 1,380,204 3,146,049
See accompanying independent auditors’ report.
72

Schedule 9STATE OF NEW JERSEY
DIVISION OF PENSIONS AND BENEFITS
Combining Schedule of Fiduciary Net Position InformationFiduciary Funds – Select Pension Trust Funds
June 30, 2017
ConsolidatedPrison State Police and Teachers’ Police and Public
Judicial Officers’ Police Firemen’s Pension and Firemen’s Employees’Retirement Pension Retirement Pension Annuity Retirement Retirement
System Fund System Fund Fund System System Total
Assets:Cash and cash equivalents $ 5,000,117 284,097 18,969,604 177,544 353,178,098 196,682,671 307,314,387 881,606,518
Receivables:Contributions:
Members 676,066 — 1,094,446 — 76,505,113 51,842,902 59,619,441 189,737,968 Employers — — 80,304 — 26,569,423 1,032,873,483 1,042,303,973 2,101,827,183
Accrued interest and dividends 486 17 2,024 26 41,228 4,201,002 35,826 4,280,609 Other 1,307,451 2,507 1,259,094 237,752 12,647,936 7,178,418 22,164,889 44,798,047
Total receivables 1,984,003 2,524 2,435,868 237,778 115,763,700 1,096,095,805 1,124,124,129 2,340,643,807
Investments, at fair value:Cash Management Fund 3,912,496 5,417,728 13,376,644 1,638,567 61,465,645 46,031,975 38,789,354 170,632,409 Common Pension Fund D 121,379,434 — 1,175,226,557 — 15,621,176,710 15,613,185,805 18,125,719,900 50,656,688,406 Common Pension Fund E 47,103,013 — 553,910,211 — 7,066,359,178 7,640,826,759 8,669,662,392 23,977,861,553
Total investments 172,394,943 5,417,728 1,742,513,412 1,638,567 22,749,001,533 23,300,044,539 26,834,171,646 74,805,182,368
Securities lending collateral 2,296,449 — 22,234,804 — 295,546,248 295,395,064 342,931,177 958,403,742 Members’ loans and mortgages 511,721 — 15,479,955 — 283,207,356 1,462,285,744 619,523,933 2,381,008,709
Total assets 182,187,233 5,704,349 1,801,633,643 2,053,889 23,796,696,935 26,350,503,823 29,228,065,272 81,366,845,144
Liabilities:Accounts payable and accrued expenses — 1,011 — — 81,688,581 5,988,986 96,699,759 184,378,337 Retirement benefits payable 4,515,169 81,006 17,722,568 147,911 355,065,159 196,739,631 309,203,462 883,474,906 Noncontributory group life insurance premiums payable — — 80,304 — 4,029,942 3,288,170 7,911,760 15,310,176 Administrative expense payable 50,960 1,464 105,195 1,482 4,292,415 1,460,768 7,180,823 13,093,107 Securities lending collateral and rebates payable 2,295,771 — 22,228,241 — 295,459,009 295,307,869 342,829,950 958,120,840
Total liabilities 6,861,900 83,481 40,136,308 149,393 740,535,106 502,785,424 763,825,754 2,054,377,366
Net position restricted for pensions $ 175,325,333 5,620,868 1,761,497,335 1,904,496 23,056,161,829 25,847,718,399 28,464,239,518 79,312,467,778
See accompanying independent auditors’ report.
73

Schedule 10STATE OF NEW JERSEY
DIVISION OF PENSIONS AND BENEFITS
Combining Schedule of Changes In Fiduciary Net Position InformationFiduciary Funds – Select Pension Trust Funds
Year ended June 30, 2017
ConsolidatedPrison State Police and Teachers’ Police and Public
Judicial Officers’ Police Firemen’s Pension and Firemen’s Employees’Retirement Pension Retirement Pension Annuity Retirement Retirement
System Fund System Fund Fund System System Total
Additions:Contributions:
Members:State $ 10,348,191 — 23,721,785 — 790,788,033 51,759,235 331,469,748 1,208,086,992 Local — — 344,119,149 516,482,389 860,601,538
Employers:State 20,341,379 — 53,006,614 575,000 1,127,018,480 117,025,276 539,538,390 1,857,505,139 Local — — — — — 885,018,458 926,393,189 1,811,411,647
Nonemployer — — — — — 86,467,000 — 86,467,000 Employer specific and other 1,121,097 552,131 3,925 964,280 1,696,090 13,107,651 16,358,762 33,803,936
Total contributions 31,810,667 552,131 76,732,324 1,539,280 1,919,502,603 1,497,496,769 2,330,242,478 5,857,876,252
Investment income:Net increase/(decrease) in fair value of investments 16,847,510 (1,719) 175,221,726 (486) 2,300,089,571 2,304,714,942 2,662,886,052 7,459,757,596 Interest 3,208,312 34,648 32,328,268 12,685 442,954,741 488,450,683 549,638,114 1,516,627,451
20,055,822 32,929 207,549,994 12,199 2,743,044,312 2,793,165,625 3,212,524,166 8,976,385,047
Less investment expense 24,670 2,082 148,404 2,100 6,055,521 2,060,765 10,130,329 18,423,871
Net investment income 20,031,152 30,847 207,401,590 10,099 2,736,988,791 2,791,104,860 3,202,393,837 8,957,961,176
Total additions 51,841,819 582,978 284,133,914 1,549,379 4,656,491,394 4,288,601,629 5,532,636,315 14,815,837,428
Deductions:Benefits:
Benefit expense - retirement allowances 55,642,074 1,069,209 215,243,453 1,535,623 4,198,977,288 2,374,959,072 3,587,215,468 10,434,642,187 Noncontributory group insurance expense 664,379 — 1,968,614 — 39,099,480 38,969,665 80,002,130 160,704,268
Refunds of contributions 59,265 — 91,879 — 68,191,977 7,556,700 143,601,094 219,500,915 Administrative and miscellaneous expenses 150,588 4,134 294,745 4,188 11,923,787 4,124,457 19,648,715 36,150,614
Total deductions 56,516,306 1,073,343 217,598,691 1,539,811 4,318,192,532 2,425,609,894 3,830,467,407 10,850,997,984
Change in net position (4,674,487) (490,365) 66,535,223 9,568 338,298,862 1,862,991,735 1,702,168,908 3,964,839,444
Net position restricted for pensions:Beginning of year 179,999,820 6,111,233 1,694,962,112 1,894,928 22,717,862,967 23,984,726,664 26,762,070,610 75,347,628,334
End of year $ 175,325,333 5,620,868 1,761,497,335 1,904,496 23,056,161,829 25,847,718,399 28,464,239,518 79,312,467,778
See accompanying independent auditors’ report.
74

Schedule 11STATE OF NEW JERSEY
DIVISION OF PENSIONS AND BENEFITS
Combining Schedule of Balance Sheet InformationFiduciary Funds – Agency Funds
June 30, 2017
Alternate Pension Dental TotalBenefit Adjustment Expense Agency
Program Fund Fund Program Fund Funds
Assets:Cash and cash equivalents $ 950,247 1,028,528 225,496 2,204,271
Receivables:State related employer contributions — 258,955 — 258,955 Other 38,879,816 3,457 1,476,104 40,359,377
Total receivables 38,879,816 262,412 1,476,104 40,618,332
Investments, at fair value:Cash Management Fund 896,915 1,009,611 47,362,532 49,269,058
Total investments 896,915 1,009,611 47,362,532 49,269,058
Total assets $ 40,726,978 2,300,551 49,064,132 92,091,661
Liabilities:Accounts payable and accrued expenses $ 40,644,958 — 49,064,132 89,709,090 Assets held for local contributing employers — 2,023,233 — 2,023,233 Pension adjustment payroll payable — 72,370 — 72,370 Due to State of New Jersey 82,020 44,420 — 126,440 Due to other funds — 160,528 — 160,528
Total liabilities $ 40,726,978 2,300,551 49,064,132 92,091,661
See accompanying independent auditors’ report.
75

Schedule 12STATE OF NEW JERSEY
DIVISION OF PENSIONS AND BENEFITS
Combining Schedule of Changes in Fiduciary Net Position InformationFiduciary Funds – Agency Funds
Year ended June 30, 2017
Alternate Pension Dental TotalBenefit Adjustment Expense Agency
Program Fund Fund Program Fund Funds
Additions:Contributions:
Members $ 817,835 — 101,975,407 102,793,242 Employers 198,032,827 1,365,090 37,118,575 236,516,492
Total contributions 198,850,662 1,365,090 139,093,982 339,309,734
Investment income:Net decrease in fair value of investments (205) (151) (11,589) (11,945)Interest 12,149 11,736 282,229 306,114
Total investment income 11,944 11,585 270,640 294,169
Total additions 198,862,606 1,376,675 139,364,622 339,603,903
Deductions:Benefits 198,797,510 1,559,942 136,383,871 336,741,323 Refunds of contributions 65,096 (183,267) 2,980,751 2,862,580
Total deductions 198,862,606 1,376,675 139,364,622 339,603,903
Change in net position — — — —
Net position – beginning of year — — — —
Net position – end of year $ — — — —
See accompanying independent auditors’ report.
76

Schedule 13STATE OF NEW JERSEY
DIVISION OF PENSIONS AND BENEFITS
Combining Schedule of Balance Sheet InformationAgency Fund – Dental Expense Program Fund
June 30, 2017
Total AgencyFund – Dental
ExpenseState Local Program Fund
Assets:Cash and cash equivalents $ 217,316 8,180 225,496
Receivables:Other 1,388,124 87,980 1,476,104
Total receivables 1,388,124 87,980 1,476,104
Investments, at fair value:Cash Management Fund 33,094,127 14,268,405 47,362,532
Total investments 33,094,127 14,268,405 47,362,532
Total assets $ 34,699,567 14,364,565 49,064,132
Liabilities:Accounts payable and accrued expenses $ 34,699,567 14,364,565 49,064,132
Total liabilities $ 34,699,567 14,364,565 49,064,132
See accompanying independent auditors’ report.
77

Schedule 14STATE OF NEW JERSEY
DIVISION OF PENSIONS AND BENEFITS
Combining Schedule of Changes in Fiduciary Net Position InformationAgency Fund – Dental Expense Program Fund
Year ended June 30, 2017
Total AgencyFund – Dental
ExpenseState Local Program Fund
Additions:Contributions:
Members $ 54,759,378 47,216,029 101,975,407 Employers 31,923,772 5,194,803 37,118,575
Total contributions 86,683,150 52,410,832 139,093,982
Investment income:Net decrease in fair value of investments (11,009) (580) (11,589)Interest 203,893 78,336 282,229
Total investment income 192,884 77,756 270,640
Total additions 86,876,034 52,488,588 139,364,622
Deductions:Benefits 83,774,750 52,609,121 136,383,871 Refunds of contributions 3,101,284 (120,533) 2,980,751
Total deductions 86,876,034 52,488,588 139,364,622
Change in net position — — —
Net position – beginning of year — — —
Net position – end of year $ — — —
See accompanying independent auditors’ report.
78
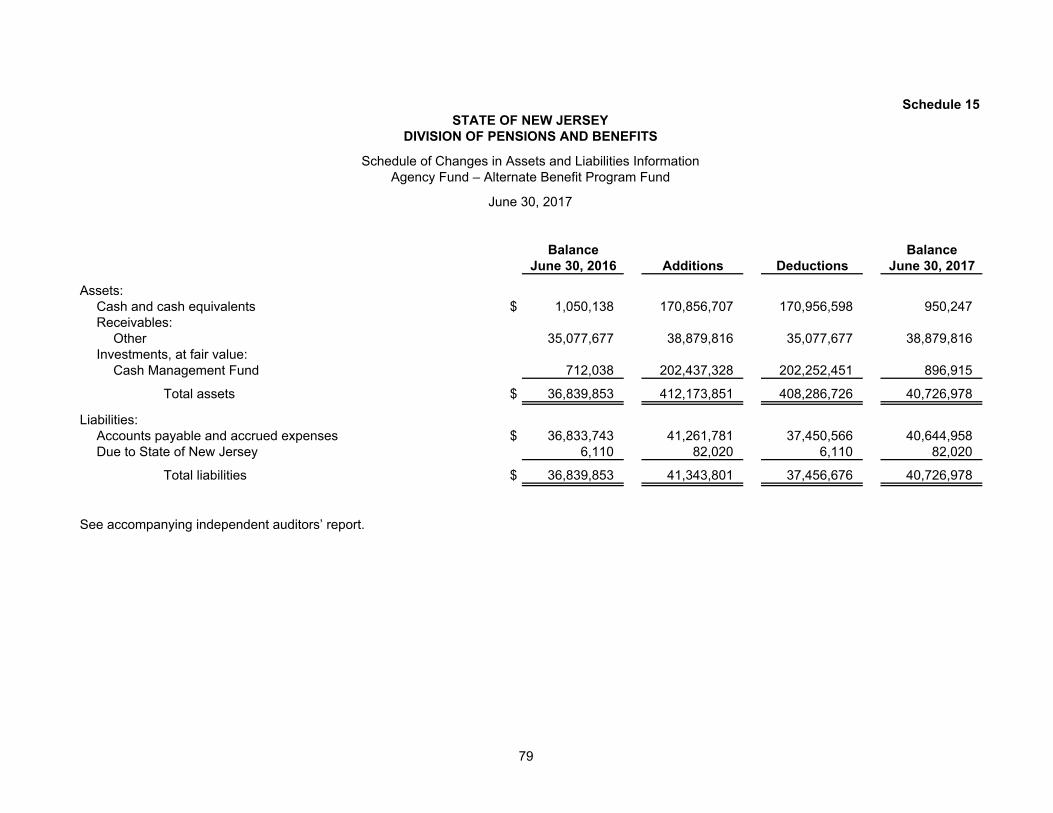
Schedule 15STATE OF NEW JERSEY
DIVISION OF PENSIONS AND BENEFITS
Schedule of Changes in Assets and Liabilities InformationAgency Fund – Alternate Benefit Program Fund
June 30, 2017
Balance BalanceJune 30, 2016 Additions Deductions June 30, 2017
Assets:Cash and cash equivalents $ 1,050,138 170,856,707 170,956,598 950,247 Receivables:
Other 35,077,677 38,879,816 35,077,677 38,879,816 Investments, at fair value:
Cash Management Fund 712,038 202,437,328 202,252,451 896,915
Total assets $ 36,839,853 412,173,851 408,286,726 40,726,978
Liabilities:Accounts payable and accrued expenses $ 36,833,743 41,261,781 37,450,566 40,644,958 Due to State of New Jersey 6,110 82,020 6,110 82,020
Total liabilities $ 36,839,853 41,343,801 37,456,676 40,726,978
See accompanying independent auditors’ report.
79

Schedule 16STATE OF NEW JERSEY
DIVISION OF PENSIONS AND BENEFITS
Schedule of Changes in Assets and Liabilities InformationAgency Fund – Pension Adjustment Fund
June 30, 2017
Balance BalanceJune 30, 2016 Additions Deductions June 30, 2017
Assets:Cash and cash equivalents $ 1,737,674 856,998 1,566,144 1,028,528 Receivables:
State related employer contributions 316,085 1,077,286 1,134,416 258,955 Other 683 14,879 12,105 3,457
Investments, at fair value:Cash Management Fund 525,341 2,155,239 1,670,969 1,009,611
Total assets $ 2,579,783 4,104,402 4,383,634 2,300,551
Liabilities:Assets held for local contributing employers $ 2,226,939 — 203,706 2,023,233 Pension adjustment payroll payable 140,204 1,562,740 1,630,574 72,370 Due to State of New Jersey 23,980 44,420 23,980 44,420 Due to other funds 188,660 985,532 1,013,664 160,528
Total liabilities $ 2,579,783 2,592,692 2,871,924 2,300,551
See accompanying independent auditors’ report.
80

Schedule 17STATE OF NEW JERSEY
DIVISION OF PENSIONS AND BENEFITS
Schedule of Changes in Assets and Liabilities InformationAgency Fund – Dental Expense Program Fund – Total
June 30, 2017
Balance BalanceJune 30, 2016 Additions Deductions June 30, 2017
Assets:Cash and cash equivalents $ 35,083 44,965,819 44,775,406 225,496 Receivables:
Other 839,880 144,745,254 144,109,030 1,476,104 Investments, at fair value:
Cash Management Fund 40,175,944 221,464,831 214,278,243 47,362,532
Total assets $ 41,050,907 411,175,904 403,162,679 49,064,132
Liabilities:Accounts payable and accrued expenses $ 41,050,907 43,374,118 35,360,893 49,064,132
Total liabilities $ 41,050,907 43,374,118 35,360,893 49,064,132
See accompanying independent auditors’ report.
81
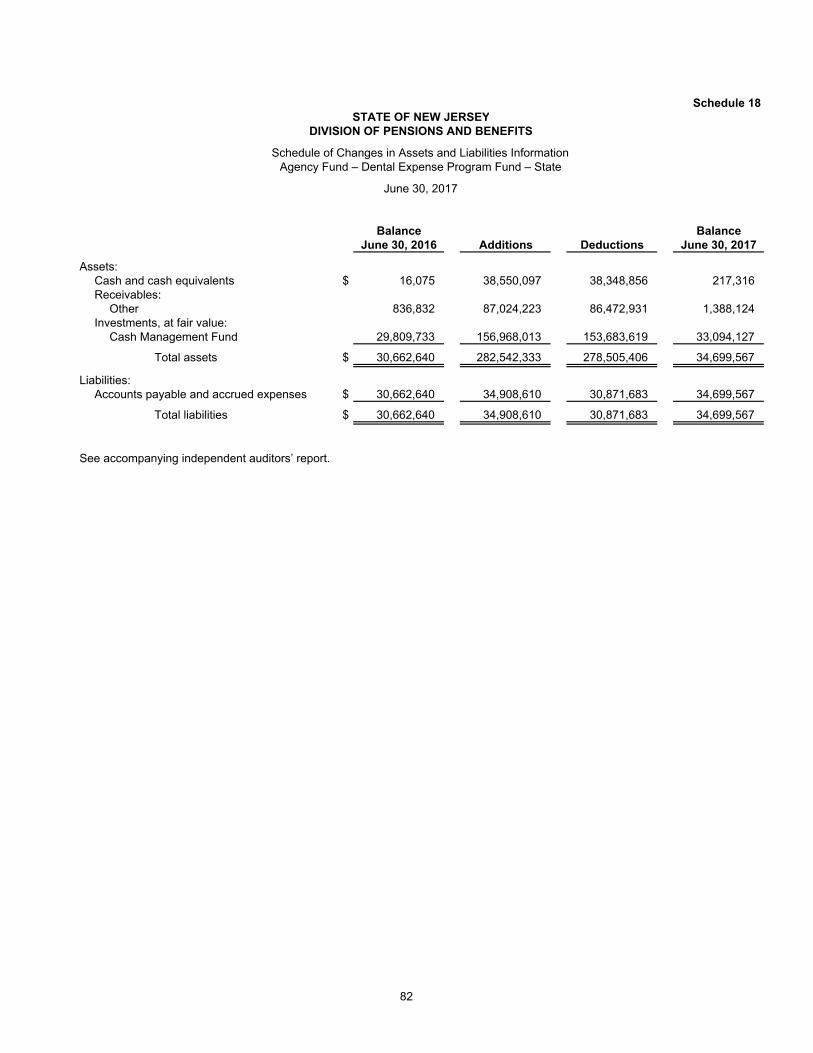
Schedule 18STATE OF NEW JERSEY
DIVISION OF PENSIONS AND BENEFITS
Schedule of Changes in Assets and Liabilities InformationAgency Fund – Dental Expense Program Fund – State
June 30, 2017
Balance BalanceJune 30, 2016 Additions Deductions June 30, 2017
Assets:Cash and cash equivalents $ 16,075 38,550,097 38,348,856 217,316 Receivables:
Other 836,832 87,024,223 86,472,931 1,388,124 Investments, at fair value:
Cash Management Fund 29,809,733 156,968,013 153,683,619 33,094,127
Total assets $ 30,662,640 282,542,333 278,505,406 34,699,567
Liabilities:Accounts payable and accrued expenses $ 30,662,640 34,908,610 30,871,683 34,699,567
Total liabilities $ 30,662,640 34,908,610 30,871,683 34,699,567
See accompanying independent auditors’ report.
82

Schedule 19STATE OF NEW JERSEY
DIVISION OF PENSIONS AND BENEFITS
Schedule of Changes in Assets and Liabilities InformationAgency Fund – Dental Expense Program Fund – Local
June 30, 2017
Balance BalanceJune 30, 2016 Additions Deductions June 30, 2017
Assets:Cash and cash equivalents $ 19,008 6,415,722 6,426,550 8,180 Receivables:
Other 3,048 57,721,031 57,636,099 87,980 Investments, at fair value:
Cash Management Fund 10,366,211 64,496,818 60,594,624 14,268,405
Total assets $ 10,388,267 128,633,571 124,657,273 14,364,565
Liabilities:Accounts payable and accrued expenses $ 10,388,267 8,465,508 4,489,210 14,364,565
Total liabilities $ 10,388,267 8,465,508 4,489,210 14,364,565
See accompanying independent auditors’ report.
83
Related Documents