Shin-Etsu Chemical Co., Ltd. (4063) Fiscal Year ended March 31, 2009 1 Press Release Financial Results for the fiscal year ended March 31, 2009 Shin-Etsu Chemical Co., Ltd. April 28, 2009 Listing Code: No. 4063 (URL: http://www.shinetsu.co.jp/) Listing Stock Exchange: Tokyo, Osaka and Nagoya Representative: Chihiro Kanagawa (Mr.) President and CEO Personnel to contact: Toshiyuki Kasahara (Mr.) Director, General Manager of Finance & Accounting Department Tel: +81-3-3246-5051 Date of the annual shareholder’s meeting …… June 26, 2009 Date of the filing of the consolidated financial statements …… June 30, 2009 Date of year-end dividend payout …… June 29, 2009 Amounts are stated in millions of yen by discarding fractional amounts less than 1 million. Percentage figures indicate changes over previous corresponding fiscal year. 1. Consolidated Operating Performance for the Fiscal Year ended March 31, 2009 (From April 1, 2008 to March 31, 2009) (1) Results of Consolidated operations (Millions of Yen) Net sales Operating income Ordinary income Net income April 2008 – March 2009 1,200,813 (12.8%) 232,927 (18.9%) 250,533 (16.5%) 154,731 (15.7%) April 2007 – March 2008 1,376,364 5.5% 287,145 19.1% 300,040 21.5% 183,580 19.2% Net income per share (in yen) Diluted net income per share (in yen) Ratio of net income to stockholders’ equity Ratio of ordinary income to total assets Ratio of operating income to net sales April 2008 – March 2009 362.39 362.35 11.0% 13.9% 19.4% April 2007 – March 2008 426.63 426.35 13.3% 15.9% 20.9% (Note) Equity in earnings of affiliates(Millions of Yen) April 2008-March 2009 : 12,441 April 2007-March 2008 : 14,117 (2) Consolidated financial position (Millions of Yen) Total assets Net assets Stockholders’ equity ratio Net assets per share (in yen) March 31, 2009 1,684,944 1,407,353 81.1% 3,218.28 March 31, 2008 1,918,544 1,483,669 75.0% 3,344.17 (Note) Stockholders’ equity(Millions of Yen) As of March 31, 2009 : 1,366,061 As of March 31, 2008: 1,438,797 Stockholders’ equity used for the calculation of indices is Net assets excluding both Share subscription rights and Minority interests in consolidated subsidiaries. (3) Consolidated statement of cash flows (Millions of Yen) Cash flows from operating activities Cash flows from investing activities Cash flows from financing activities Cash & Cash Equivalents at end of fiscal year April 2008 – March 2009 256,579 (200,790) (80,084) 251,044 April 2007 – March 2008 202,413 (248,626) (53,534) 301,619 2. Cash dividends Cash dividend per share (in Yen) 1 st quarter 2 nd quarter 3 rd quarter 4 th quarter Fiscal year Total annual cash dividend paid(in millions of Yen) Dividend payout ratio Ratio of dividend payout to net assets April 2007 – March 2008 - 40.00 - 50.00 90.00 38,713 21.1% 2.8% April 2008 – March 2009 - 50.00 - 50.00 100.00 42,595 27.6% 3.0% April 2009 – March 2010 (forecast) - - - - - - - - 3. The Forecast of Consolidated Operating Performance for the Fiscal Year ended March 31, 2010 (From April 1, 2009 to March 31, 2010) With regard to the business forecast for the fiscal year ending March 2010, we made a judgment that it is quite difficult to appropriately calculate forecast figures at this point, and in this announcement of the Shin-Etsu Group’s results of operations in FY 2009 we have decided not to issue a forecast. For more information about the company’s decision, please see “1. Results of Operation and Financial Position, (1) Results of Operations, 3) Business Prospects” on page 4.

Welcome message from author
This document is posted to help you gain knowledge. Please leave a comment to let me know what you think about it! Share it to your friends and learn new things together.
Transcript
Shin-Etsu Chemical Co., Ltd. (4063) Fiscal Year ended March 31, 2009
1
Press Release Financial Results for the fiscal year ended March 31, 2009
Shin-Etsu Chemical Co., Ltd.
April 28, 2009 Listing Code: No. 4063 (URL: http://www.shinetsu.co.jp/) Listing Stock Exchange: Tokyo, Osaka and Nagoya Representative: Chihiro Kanagawa (Mr.) President and CEO Personnel to contact: Toshiyuki Kasahara (Mr.) Director, General Manager of Finance & Accounting Department Tel: +81-3-3246-5051 Date of the annual shareholder’s meeting …… June 26, 2009 Date of the filing of the consolidated financial statements …… June 30, 2009 Date of year-end dividend payout …… June 29, 2009
Amounts are stated in millions of yen by discarding fractional amounts less than 1 million. Percentage figures indicate changes over previous corresponding fiscal year.
1. Consolidated Operating Performance for the Fiscal Year ended March 31, 2009 (From April 1, 2008 to March 31, 2009) (1) Results of Consolidated operations (Millions of Yen) Net sales Operating income Ordinary income Net income April 2008 – March 2009 1,200,813 (12.8%) 232,927 (18.9%) 250,533 (16.5%) 154,731 (15.7%)April 2007 – March 2008 1,376,364 5.5% 287,145 19.1% 300,040 21.5% 183,580 19.2%
Net income
per share (in yen)
Diluted net income per
share (in yen)
Ratio of net income to stockholders’
equity
Ratio of ordinary income to total
assets
Ratio of operating income
to net sales April 2008 – March 2009 362.39 362.35 11.0% 13.9% 19.4% April 2007 – March 2008 426.63 426.35 13.3% 15.9% 20.9%
(Note) Equity in earnings of affiliates(Millions of Yen) April 2008-March 2009 : 12,441 April 2007-March 2008 : 14,117 (2) Consolidated financial position (Millions of Yen) Total assets Net assets Stockholders’
equity ratio Net assets per share
(in yen) March 31, 2009 1,684,944 1,407,353 81.1% 3,218.28 March 31, 2008 1,918,544 1,483,669 75.0% 3,344.17
(Note) Stockholders’ equity(Millions of Yen) As of March 31, 2009 : 1,366,061 As of March 31, 2008: 1,438,797 Stockholders’ equity used for the calculation of indices is Net assets excluding both Share subscription rights and Minority interests in consolidated subsidiaries.
(3) Consolidated statement of cash flows (Millions of Yen) Cash flows from
operating activities Cash flows from
investing activities Cash flows from
financing activities Cash & Cash Equivalents
at end of fiscal year April 2008 – March 2009 256,579 (200,790) (80,084) 251,044 April 2007 – March 2008 202,413 (248,626) (53,534) 301,619 2. Cash dividends
Cash dividend per share (in Yen)
1st quarter
2nd quarter
3rd quarter
4th quarter
Fiscal year
Total annual cash dividend paid(in millions of Yen)
Dividend payout ratio
Ratio of dividend
payout to net assets
April 2007 – March 2008 - 40.00 - 50.00 90.00 38,713 21.1% 2.8% April 2008 – March 2009 - 50.00 - 50.00 100.00 42,595 27.6% 3.0% April 2009 – March 2010 (forecast) - - - - - - - - 3. The Forecast of Consolidated Operating Performance for the Fiscal Year ended March 31, 2010
(From April 1, 2009 to March 31, 2010)
With regard to the business forecast for the fiscal year ending March 2010, we made a judgment that it is quite difficult to appropriately calculate forecast figures at this point, and in this announcement of the Shin-Etsu Group’s results of operations in FY 2009 we have decided not to issue a forecast.
For more information about the company’s decision, please see “1. Results of Operation and Financial Position, (1) Results of Operations, 3) Business Prospects” on page 4.
Shin-Etsu Chemical Co., Ltd. (4063) Fiscal Year ended March 31, 2009
2
4. Other information (1) Changes in significant subsidiaries which affected the scope of consolidation
during the current fiscal year: No (2) Changes of accounting policies applied, procedures and disclosures for presenting consolidated financial statement
Changes by revision of accounting standard : Yes Changes other than the above : No
(Note) Please see “4-6. Changes in Basis of Presenting Consolidated Financial Statements” on page 14 for further details. (3) Number of shares outstanding (in shares)
March 31, 2009 March 31, 2008 Number of shares outstanding at year end 432,106,693 432,106,693 Number of treasury stocks at year end 7,636,973 1,865,726
(Note) Please see the “Per share information” on page 24 regarding the weighted-average number of shares outstanding, which is the basis for the calculation of consolidated net income per share.
(Reference) Summary of Non-consolidated Financial Results 1. Non-consolidated Operating Performance for the Fiscal Year ended March 31, 2009 (From April 1, 2008 to March 31, 2009) (1) Results of non-consolidated operations (Millions of Yen)
Net sales Operating income Ordinary income Net income April 2008 – March 2009 606,722 (14.4%) 78,440 (4.3%) 93,952 1.5% 63,984 27.4%April 2007 – March 2008 708,580 1.6% 81,931 0.9% 92,528 15.6% 50,229 (1.7%)
Net income per share
(in yen) Diluted net income per share (in yen)
April 2008 – March 2009 149.86 149.84 April 2007 – March 2008 116.73 116.66 (2) Non-consolidated financial position (Millions of Yen)
Total assets Net assets Stockholders’ equity ratio
Net assets per share (in yen)
March 31, 2009 770,762 651,765 84.3% 1,530.36 March 31, 2008 853,936 669,105 78.2% 1,551.95
(Note) Stockholders’ equity(Millions of Yen) As of March 31, 2009 : 649,593 As of March 31, 2008 : 667,712 Stockholders’ equity used for the calculation of indices is Net assets excluding Share subscription rights.
(Note) Forward-looking statements such as the forecast of results of operations made in this document involves risks and uncertainties since they are based on management’s assumptions and beliefs in light of the information currently available to it. The reader should be aware that actual results may be materially different from any future results expressed herein due to various factors. Material factors affecting the actual results may include overall economic conditions in which the businesses of our company and our group companies are involved, the relevant market trends and fluctuations in foreign exchange rates of the yen, in particular, the exchange rate between the U.S. dollars and the yen; provided, however, that such factors as may affect results of operations are not limited to those enumerated above.
Shin-Etsu Chemical Co., Ltd. (4063) Fiscal Year ended March 31, 2009
3
1. Results of Operations and Financial Position (1) Results of Operations
1) General Overview The business environment that surrounded the Shin-Etsu Group during FY 2009 (April
1, 2008 to March 31, 2009) became quite severe. During the first half of the year, raw materials prices, starting with crude oil, remained at a high level and in the second half of the year, due to the financial crisis stemming from the U.S., the world economy rapidly worsened. With regard to the Japanese economy, although at the beginning of the fiscal year it remained strong, from the latter part of the fiscal year, due to the decline in demand on a global level, corporate earnings experienced a sharp downturn and the condition of the economy turned into a serious situation, which was clearly indicated by such things as the fall in the employment rate.
Under these circumstances, the Shin-Etsu Group has conducted aggressive sales activities aimed at its wide range of worldwide customers, while at the same time it has earnestly carried out rationalization and streamlining of its businesses and the development and commercialization of new products. We are also making strenuous efforts in all of our operations to always assure that our utmost priorities are put on safety-first and environmental protection.
As a result, the consolidated business results for the FY 2009 show that net sales decreased by 12.8% (¥175,551 million) compared to the previous fiscal year to become ¥1,200,813 million. Compared to the performance of the previous fiscal year, operating income decreased 18.9% (¥54,218 million) to ¥232,927 million, ordinary income decreased 16.5% (¥49,507 million) to ¥250,533 million and net income decreased 15.7% (¥28,849 million) to ¥154,731 million.
2) Business Segment Overview
Organic and inorganic chemicals
PVC Although the housing market continued to be weak, by making strong sales efforts
aimed at its worldwide customers, Shintech in the U.S. maintained a high level of operations and increased its profit greatly.
In addition, Shin-Etsu PVC in The Netherlands maintained strong sales in Europe. On the other hand, the PVC business in Japan continued in a tough situation, with weakness in shipments heavily influenced by the sluggishness in demand. Silicones
Although during the first half of the fiscal year, sales in such application fields as automobiles and information technology equipment remained firm, from the latter half of the fiscal year, in the wide range of fields demand deteriorated and the performance of the business fell below that of the previous fiscal year. The business of keypads for mobile phones supplied by Shin-Etsu Polymer Co., Ltd. experienced a sharp downturn as a result of intensified price competition and a decrease in shipments. Other Products
The cellulose derivatives business was strong, mainly as a result of the performance of cellulose applications for pharmaceutical products in Japan. However, the business results of SE Tylose in Germany were sluggish because of the decreased demand for construction materials. The metallic silicon business did well, buoyed by a price rise for the product.
As a result, the net sales of this business segment decreased 10.2% (¥71,828 million) compared to the previous fiscal year to ¥629,174 million. Operating income also decreased 4.4% (¥4,339 million) to ¥95,142 million.
Shin-Etsu Chemical Co., Ltd. (4063) Fiscal Year ended March 31, 2009
4
Electronics Materials
Semiconductor silicon For the first half of the fiscal year, this business continued to be firm, centering on
300mm wafers. However, from the latter half of the fiscal year, with the rapid decrease in demand for semiconductor devices in a wide number of fields, the results of this business fell below that of the previous fiscal year. Other Products
Sales of rare earth magnets for the electronics industry continued to be weak as a consequence of the effects of manufacturing adjustments of hard disk drives for PCs. Shipments of photoresists products and organic materials for the electronics industry also did not do well. The results of this business fell below that of the previous fiscal year.
As a result, the net sales of this business segment decreased 17.2% (¥97,176 million) compared to the previous fiscal year to ¥467,520 million. Operating income decreased 30.8% (¥49,866 million) to ¥112,234 million.
Functional Materials and Others
Synthetic quartz With regard to synthetic quartz, although sales of optical fiber preform continued to be
strong with the increase in demand coming as a result of expanding worldwide volume of data communications, sales of large-size photomask substrates used for LCDs remained weak due to a decline in demand and continued market sluggishness. Rare earth magnets and other functional materials
Sales of rare earth magnets for general industrial use were good in the first half of the fiscal year for such applications as in energy-saving motors for air-conditioners. However, from the latter half of the fiscal year, demand declined mainly for such applications as optical pickups and FA motors, and the results of this business were sluggish. Sales of liquid fluoroelastomers stagnated, but shipments of pellicles continued to be favorable.
As a result, the net sales of this business segment decreased 5.9% (¥6,547 million) compared to the previous fiscal year to ¥104,118 million. Operating income decreased 1.1% (¥288 million) to ¥25,724 million.
3) Business Prospects With regard to business prospects going forward, the situation regarding the severe
downturn in the world economy is getting more serious, and in Japan, there is concern that personal consumption will continue to be weak due to decreasing facility investments as well as a worsening in the employment situation. Thus, a quite severe business environment is expected to continue during the current fiscal year.
Under these circumstances, in order to overcome the effects of the severe business environment facing us, the Shin-Etsu Group will continue to make all-out efforts through such means as accurately grasping market changes and developing aggressive sales activities toward our customers worldwide. In addition, we will focus on further strengthening our world’s highest-level technologies and product quality and on improving productivity, and we will strive to build an even stronger business foundation for the future.
Rapid changes in the market environment in a wide range of business fields are continuing globally, and this turmoil is particularly affecting Shin-Etsu’s main customers, such as the electronic/electric industry and automobile industry. Thus, with regard to the business forecast for the fiscal year ending March 2010, we made a judgment that it is quite difficult to appropriately calculate forecast figures at this point, and in this announcement of the Shin-Etsu Group’s results of operations in FY 2009 we have decided not to issue a forecast.

Shin-Etsu Chemical Co., Ltd. (4063) Fiscal Year ended March 31, 2009
5
(2) Financial position Overview
1) Status of assets, liabilities and net assets At the end of FY2009, total assets decreased by ¥233,600 million compared to that at
the end of FY2008 (April 1, 2007 to March 31, 2008), to become ¥1,684,944 million. This decline was mainly due to a decrease in the yen-translated sum of the total assets held by the overseas consolidated subsidiaries caused by the appreciation of the yen.
Total liabilities decreased by ¥157,284 million, compared to that at the end of FY2008, to become ¥277,591 million. This decline was mainly due to a decrease in accounts payable, other accounts payable for construction of facilities.
Retained earnings increased due to ¥154,731 million in net income; however, total net assets decreased by ¥76,316 million compared to that at the end of FY2008, to become ¥1,407,353 million. This decline was mainly due to a decrease of valuation and translation adjustments as a result of the appreciation of the yen.
The stockholders’ equity ratio increased by 6.1 percentage points to 81.1% from 75.0% at the end of previous fiscal year.
2) Status of cash flows
Millions of Yen April 2008 -
March 2009 April 2007 -
March 2008
Increase (Decrease)
(A) (B) (A-B)
Cash and cash equivalents at beginning of fiscal year 301,619 404,532
(102,913)
Cash flows from operating activities 256,579 202,413 54,166 Cash flows from investing activities (200,790) (248,626) 47,836 Cash flows from financing activities (80,084) (53,534) (26,550) Effect of foreign exchange and others (26,278) (3,165)
(23,113)
Net increase (decrease) in cash and cash equivalents (50,574) (102,913) 52,339 Cash and cash equivalents at end of fiscal year 251,044 301,619 (50,575)
The balance of cash and cash equivalents at the end of the FY 2009 decreased by 16.8% (¥50,574 million) compared to that at the end of previous fiscal year, to become ¥251,044 million.
Cash flows from operating activities
Net cash provided by operating activities amounted to ¥256,579 million, which was
¥54,166 million greater than that of the previous fiscal year. This mainly consisted of ¥244,485 million of income before income taxes, ¥119,457 million of depreciation and amortization, ¥91,656 million of income tax payment, ¥20,782 million of increase in inventories and others.
Cash flows from investing activities
Net cash used for investing activities amounted to ¥200,790 million, which was
¥47,836 million smaller than that of the previous fiscal year. This result was mainly due to ¥189,696 million of expenditures for the purchases of tangible fixed assets.
Cash flows from financing activities
Net cash used for financing activities amounted to ¥80,084 million, which was ¥26,550
million greater than that of the previous fiscal year. This result was mainly due to ¥42,884 million in cash dividends paid and ¥29,938 million of the purchase of treasury stock.

Shin-Etsu Chemical Co., Ltd. (4063) Fiscal Year ended March 31, 2009
6
(Reference)
The trend of cash flow indices
For the fiscal year ended
March 31,
2009 March 31,
2008 March 31,
2007 March 31,
2006 March 31, 2005
Stockholders’ equity ratio (%) 81.1 75.0 71.0 70.2 67.5 Stockholders’ equity ratio on
market value basis (%) 120.2 115.5 166.5 164.7
117.6
Debt repayment ratio (%) 9.2 16.8 16.6 38.0 67.9 Interest coverage ratio 148.3 86.0 103.5 78.5 57.2
(Notes)- Stockholders’ equity ratio: stockholders’ equity/total assets
Stockholders’ equity used for the calculation of indices is Net assets, excluding both Share subscription rights and Minority interests in consolidated subsidiaries
- Stockholders’ equity ratio on market value basis: aggregate market value of common stock/Total Assets
- Debt repayment ratio: interest-bearing liabilities/cash flows from operating activities
- Interest coverage ratio: cash flows from operating activities/interest payments
1. All indices based on consolidated financial figures.
2. Aggregate market value of common stock is calculated by multiplying the market price at the end of each fiscal year by the number of outstanding shares, excluding Treasury stock, at the end of each fiscal year.
3. Interest-bearing liabilities include all liabilities on the consolidated balance sheets that incur interest.
(3) Basic policy concerning profit-sharing
Taking a long-term perspective, Shin-Etsu will focus on expanding company earnings
and strengthening the make-up of the Group’s structure as well as on sharing the results of such successful management efforts. It is our basic policy to distribute dividends so as to appropriately reward all of our shareholders. The company will use its financial reserves for such needs as facility and R&D investment, acquisition of businesses, strengthening the company’s global competitive power and developing promising future businesses. Shin-Etsu is making strenuous efforts to enhance the company’s value.
In line with this policy, we are planning a year-end dividend for FY 2009 of ¥50 per share, the same as the interim dividend of ¥50. With this announcement, the dividend for FY2009 will become ¥100 per share, which increased by ¥10, compared to the annual dividend ¥90 paid out during the previous fiscal year.
The dividend for shareholders in FY2010 is uncertain. 2. Corporate Overview
There have been no significant changes after the release of the last financial report filed on June 30, 2008. Thus, we are omitting in this report the table about the “Shin-Etsu Group’s Business Activities” and the flowchart concerning “Business Flows Within the Group”.
Shin-Etsu Chemical Co., Ltd. (4063) Fiscal Year ended March 31, 2009
7
3. Management Policies (1) Basic management policies
The Shin-Etsu Group makes safety its utmost priority in each and every instance, and by
performing fair corporate activities and by providing key materials and technologies, we contribute to people’s daily lives, industry and society. Through these contributions, we aim to meet the expectations of all shareholders by enhancing the worth of the company. Towards this end, our management policy is to establish the world’s best technology and product quality while, at the same time, continuing with unceasing improvement in productivity. We endeavor to build a stable business relationship with our customers around the world, and strive to appropriately respond to changes in the market and the economic situation.
(2) Policy implementation
In the PVC business, Shintech in the U.S. is constructing integrated manufacturing facilities from electrolysis to PVC. The first-phase of the construction work has been completed, and this facility has begun operation. In Europe as well, in order to strengthen the business base of Shin-Etsu PVC B.V. in The Netherlands, we are going forward with the process of making CIRES in Portugal a 100%-owned Shin-Etsu Group company. In the future, by fully making use of our tri-polar production base system of Japan, U.S. and Europe, we will further solidify Shin-Etsu’s position as the world’s largest PVC maker.
In the silicone business, by utilizing the diverse characteristics of silicone products, which are in demand for a wide range of application fields, we will promote the development of new products and new applications. At the same time, we will strive to further improve the productivity of each of our silicone plants in Japan, Thailand, the U.S. and other facilities and will strengthen this business not only in Japan but also globally.
In the semiconductor silicon business, by accurately anticipating demand trends for 300mm silicon wafers, Shin-Etsu, as the largest silicon wafer manufacturer in the world, will stably supply high quality products. For silicon wafers up to 200mm, Shin-Etsu will focus on strengthening its competitive power by increasing the added value of our products and further differentiating them from those of other companies in applications for specialized uses.
In the rare earth magnet business, by utilizing our new rare earth separation and refinement facility, we will strive to improve further productivity, and at the same time, we will carry out sales expansion centering around applications for hybrid cars, for which demand is expected to increase.
In the cellulose business, in order to establish stable supply of pharmaceutical products, we are proceeding with the construction of manufacturing facilities at SE Tylose in Germany. With our bi-polar production system combining our bases in Japan and Germany, Shin-Etsu will continue to make further efforts to strengthen this business.
Moreover, to expand our business, Shin-Etsu will make strenuous efforts with regard to the R&D and commercialization of new products and we will also cultivate new businesses, including through M&A activities.
At the same time, Shin-Etsu will continue to fulfill its corporate social responsibilities through such basic policies as putting our utmost priority on safety, vigorously promoting environmental conservation and strictly following compliance procedures, and we will continue to strive to maximize the worth of our company.
Shin-Etsu Chemical Co., Ltd. (4063) Fiscal Year ended March 31, 2009
8
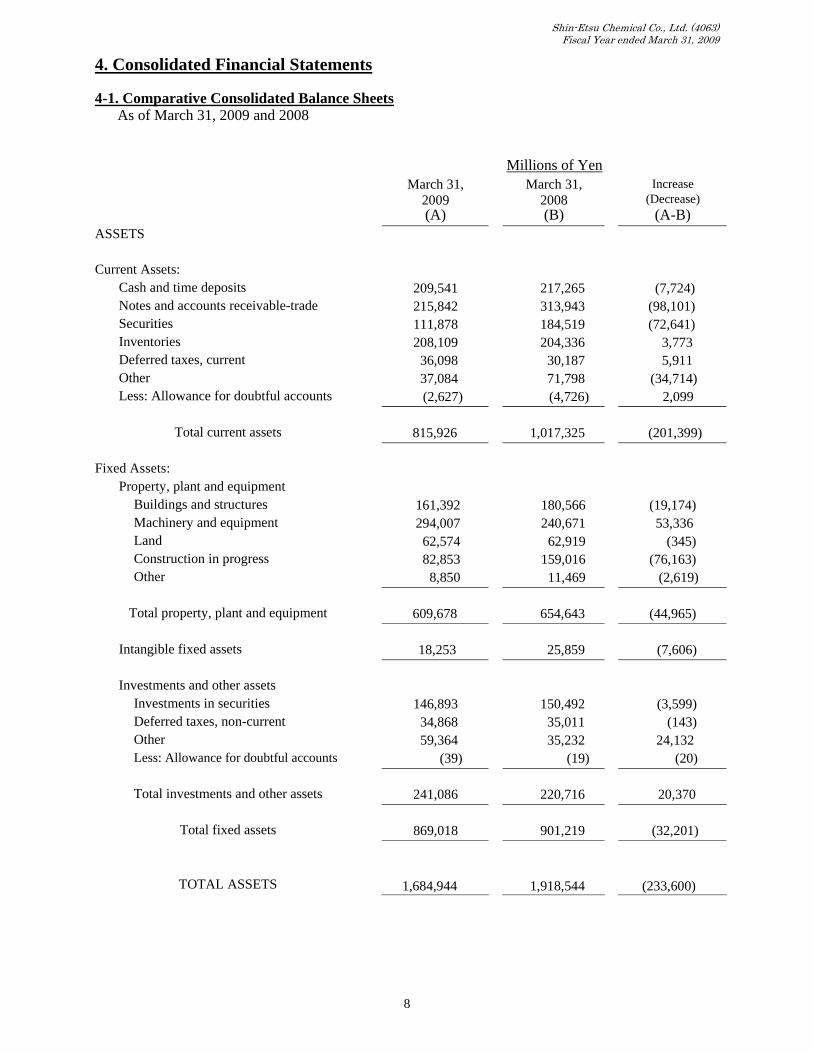
4. Consolidated Financial Statements 4-1. Comparative Consolidated Balance Sheets
As of March 31, 2009 and 2008 Millions of Yen March 31,
2009 March 31,
2008 Increase
(Decrease) (A) (B) (A-B) ASSETS Current Assets:
Cash and time deposits 209,541 217,265 (7,724) Notes and accounts receivable-trade 215,842 313,943 (98,101) Securities 111,878 184,519 (72,641) Inventories 208,109 204,336 3,773 Deferred taxes, current 36,098 30,187 5,911 Other 37,084 71,798 (34,714) Less: Allowance for doubtful accounts (2,627) (4,726) 2,099
Total current assets 815,926 1,017,325 (201,399)
Fixed Assets:
Property, plant and equipment Buildings and structures 161,392 180,566 (19,174) Machinery and equipment 294,007 240,671 53,336 Land 62,574 62,919 (345) Construction in progress 82,853 159,016 (76,163) Other 8,850 11,469 (2,619)
Total property, plant and equipment 609,678 654,643 (44,965)
Intangible fixed assets 18,253 25,859 (7,606) Investments and other assets
Investments in securities 146,893 150,492 (3,599) Deferred taxes, non-current 34,868 35,011 (143) Other 59,364 35,232 24,132 Less: Allowance for doubtful accounts (39) (19) (20)
Total investments and other assets 241,086 220,716 20,370
Total fixed assets 869,018 901,219 (32,201)
TOTAL ASSETS 1,684,944 1,918,544 (233,600)
Shin-Etsu Chemical Co., Ltd. (4063) Fiscal Year ended March 31, 2009
9
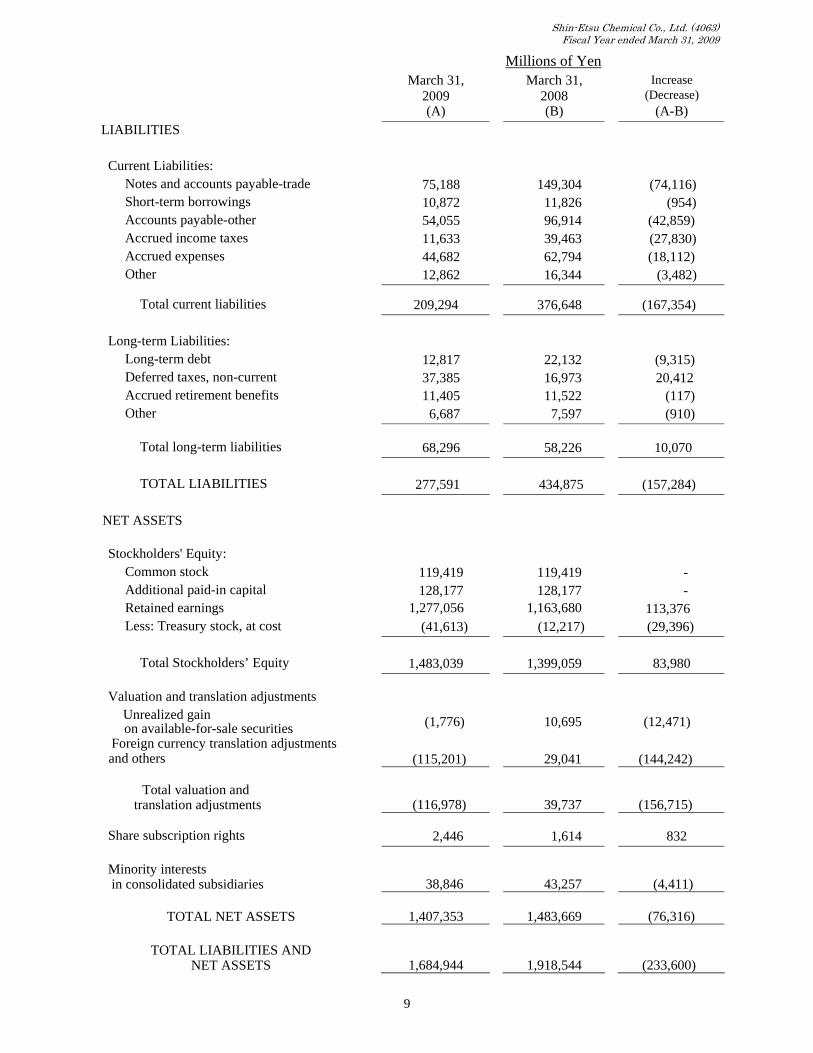
Millions of Yen March 31,
2009 March 31,
2008 Increase
(Decrease) (A) (B) (A-B) LIABILITIES Current Liabilities:
Notes and accounts payable-trade 75,188 149,304 (74,116) Short-term borrowings 10,872 11,826 (954) Accounts payable-other 54,055 96,914 (42,859) Accrued income taxes 11,633 39,463 (27,830) Accrued expenses 44,682 62,794 (18,112) Other 12,862 16,344 (3,482)
Total current liabilities 209,294 376,648 (167,354)
Long-term Liabilities:
Long-term debt 12,817 22,132 (9,315) Deferred taxes, non-current 37,385 16,973 20,412 Accrued retirement benefits 11,405 11,522 (117) Other 6,687 7,597 (910)
Total long-term liabilities 68,296 58,226 10,070 TOTAL LIABILITIES 277,591 434,875 (157,284)
NET ASSETS Stockholders' Equity:
Common stock 119,419 119,419 - Additional paid-in capital 128,177 128,177 - Retained earnings 1,277,056 1,163,680 113,376 Less: Treasury stock, at cost (41,613) (12,217) (29,396)
Total Stockholders’ Equity 1,483,039 1,399,059 83,980
Valuation and translation adjustments Unrealized gain on available-for-sale securities (1,776) 10,695 (12,471)
Foreign currency translation adjustments and others (115,201) 29,041 (144,242)
Total valuation and translation adjustments (116,978) 39,737 (156,715)
Share subscription rights 2,446 1,614 832 Minority interests
in consolidated subsidiaries 38,846 43,257 (4,411)
TOTAL NET ASSETS 1,407,353 1,483,669 (76,316)
TOTAL LIABILITIES AND NET ASSETS 1,684,944 1,918,544 (233,600)
Shin-Etsu Chemical Co., Ltd. (4063) Fiscal Year ended March 31, 2009
10
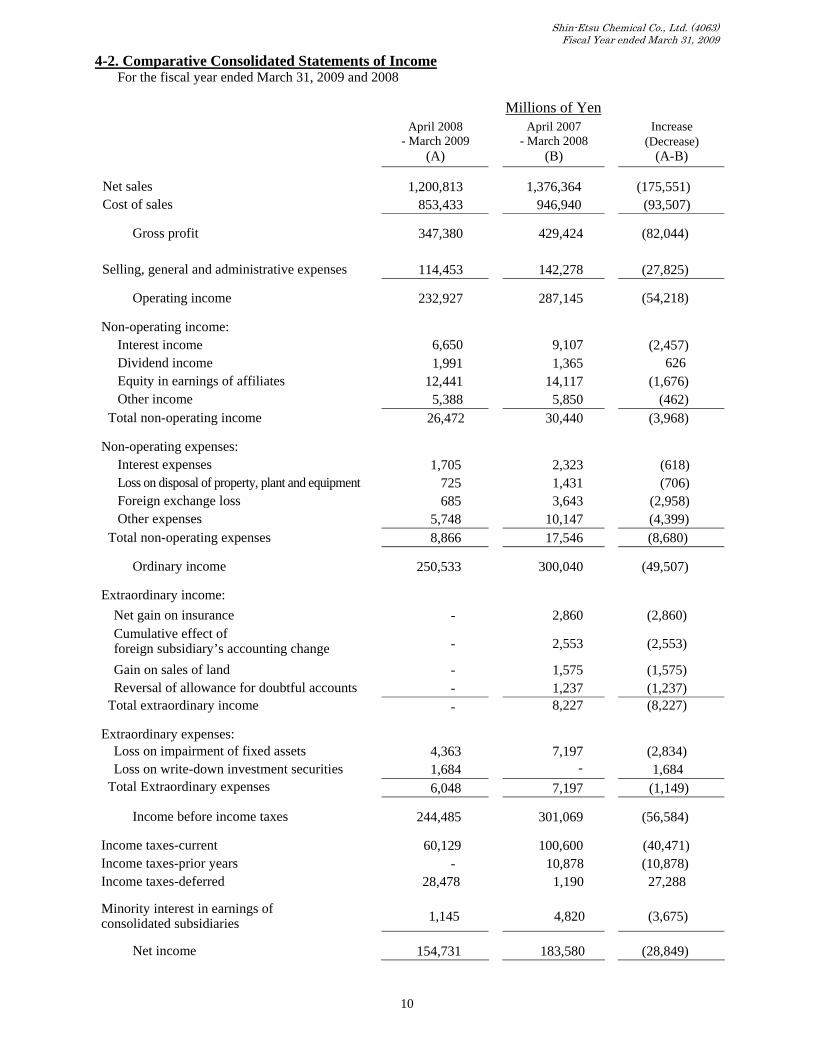
4-2. Comparative Consolidated Statements of Income For the fiscal year ended March 31, 2009 and 2008
Millions of Yen April 2008
- March 2009 April 2007
- March 2008 Increase
(Decrease) (A) (B) (A-B)
Net sales 1,200,813 1,376,364 (175,551) Cost of sales 853,433 946,940 (93,507)
Gross profit 347,380 429,424 (82,044)
Selling, general and administrative expenses 114,453 142,278 (27,825)
Operating income 232,927 287,145 (54,218) Non-operating income:
Interest income 6,650 9,107 (2,457) Dividend income 1,991 1,365 626 Equity in earnings of affiliates 12,441 14,117 (1,676) Other income 5,388 5,850 (462)
Total non-operating income 26,472 30,440 (3,968) Non-operating expenses:
Interest expenses 1,705 2,323 (618) Loss on disposal of property, plant and equipment 725 1,431 (706) Foreign exchange loss 685 3,643 (2,958) Other expenses 5,748 10,147 (4,399)
Total non-operating expenses 8,866 17,546 (8,680) Ordinary income 250,533 300,040 (49,507)
Extraordinary income: Net gain on insurance - 2,860 (2,860) Cumulative effect of foreign subsidiary’s accounting change - 2,553 (2,553)
Gain on sales of land - 1,575 (1,575) Reversal of allowance for doubtful accounts - 1,237 (1,237)
Total extraordinary income - 8,227 (8,227)
Extraordinary expenses: Loss on impairment of fixed assets 4,363 7,197 (2,834) Loss on write-down investment securities 1,684 - 1,684
Total Extraordinary expenses 6,048 7,197 (1,149)
Income before income taxes 244,485 301,069 (56,584)
Income taxes-current 60,129 100,600 (40,471) Income taxes-prior years - 10,878 (10,878) Income taxes-deferred 28,478 1,190 27,288 Minority interest in earnings of consolidated subsidiaries 1,145 4,820 (3,675)
Net income 154,731 183,580 (28,849)
Shin-Etsu Chemical Co., Ltd. (4063) Fiscal Year ended March 31, 2009
11
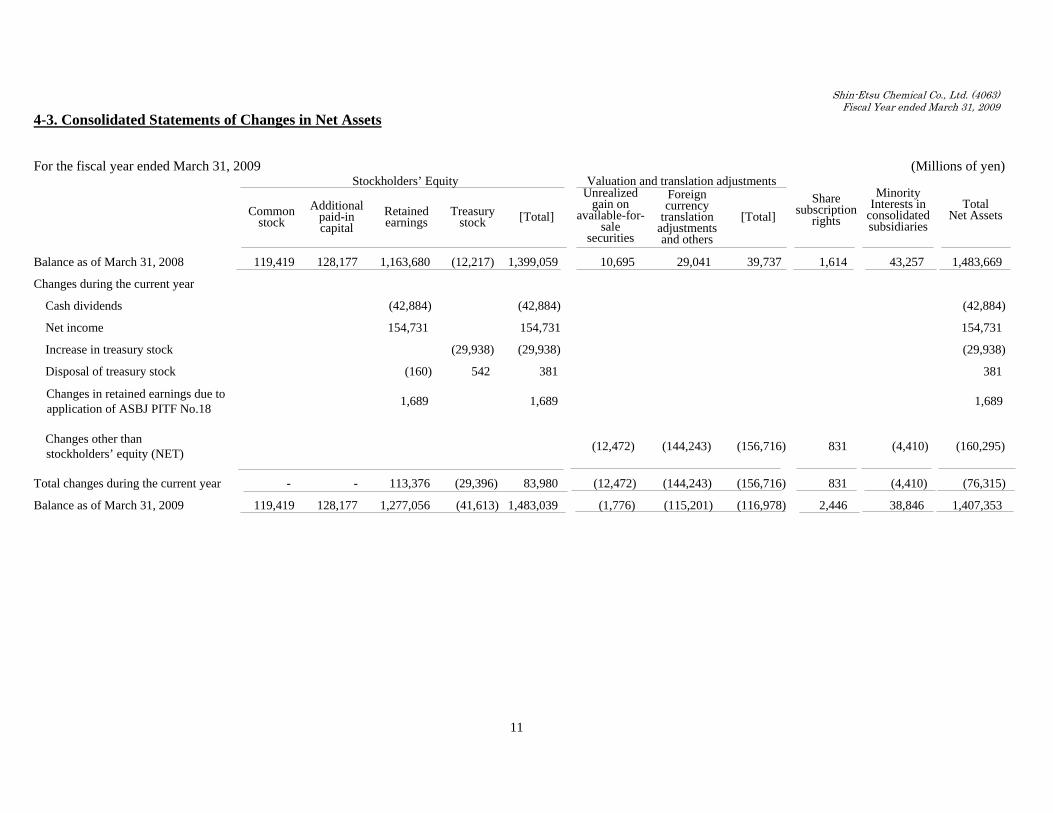
4-3. Consolidated Statements of Changes in Net Assets For the fiscal year ended March 31, 2009 (Millions of yen) Stockholders’ Equity Valuation and translation adjustments
Common stock
Additional paid-in capital
Retained earnings
Treasury stock [Total]
Unrealized gain on
available-for- sale
securities
Foreign currency
translation adjustments and others
[Total] Share
subscription rights
Minority Interests in
consolidated subsidiaries
Total Net Assets
Balance as of March 31, 2008 119,419 128,177 1,163,680 (12,217) 1,399,059 10,695 29,041 39,737 1,614 43,257 1,483,669
Changes during the current year
Cash dividends (42,884) (42,884) (42,884)
Net income 154,731 154,731 154,731
Increase in treasury stock (29,938) (29,938) (29,938)
Disposal of treasury stock (160) 542 381 381
Changes in retained earnings due to application of ASBJ PITF No.18 1,689 1,689 1,689
Changes other than stockholders’ equity (NET) (12,472) (144,243) (156,716) 831 (4,410) (160,295)
Total changes during the current year - - 113,376 (29,396) 83,980 (12,472) (144,243) (156,716) 831 (4,410) (76,315)
Balance as of March 31, 2009 119,419 128,177 1,277,056 (41,613) 1,483,039 (1,776) (115,201) (116,978) 2,446 38,846 1,407,353
Shin-Etsu Chemical Co., Ltd. (4063) Fiscal Year ended March 31, 2009
12
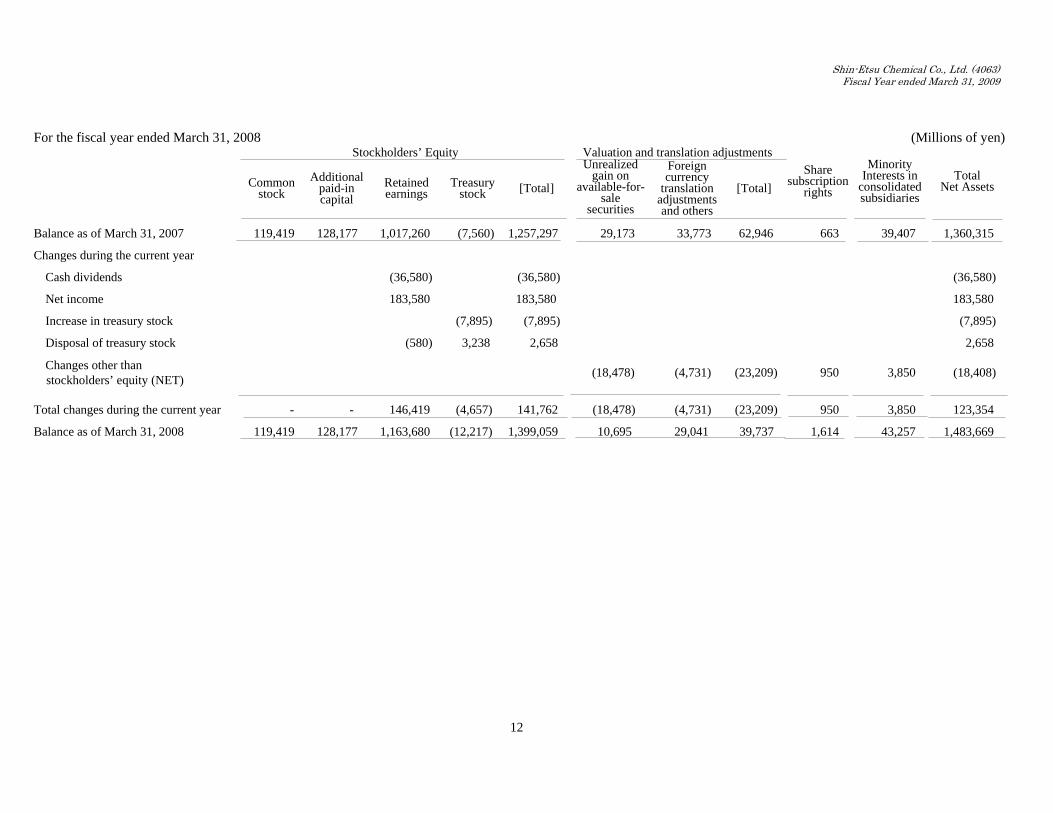
For the fiscal year ended March 31, 2008 (Millions of yen) Stockholders’ Equity Valuation and translation adjustments
Common stock
Additional paid-in capital
Retained earnings
Treasury stock [Total]
Unrealized gain on
available-for- sale
securities
Foreign currency
translation adjustments and others
[Total] Share
subscription rights
Minority Interests in
consolidated subsidiaries
Total Net Assets
Balance as of March 31, 2007 119,419 128,177 1,017,260 (7,560) 1,257,297 29,173 33,773 62,946 663 39,407 1,360,315
Changes during the current year
Cash dividends (36,580) (36,580) (36,580)
Net income 183,580 183,580 183,580
Increase in treasury stock (7,895) (7,895) (7,895)
Disposal of treasury stock (580) 3,238 2,658 2,658
Changes other than stockholders’ equity (NET) (18,478) (4,731) (23,209) 950 3,850 (18,408)
Total changes during the current year - - 146,419 (4,657) 141,762 (18,478) (4,731) (23,209) 950 3,850 123,354
Balance as of March 31, 2008 119,419 128,177 1,163,680 (12,217) 1,399,059 10,695 29,041 39,737 1,614 43,257 1,483,669
Shin-Etsu Chemical Co., Ltd. (4063) Fiscal Year ended March 31, 2009
13
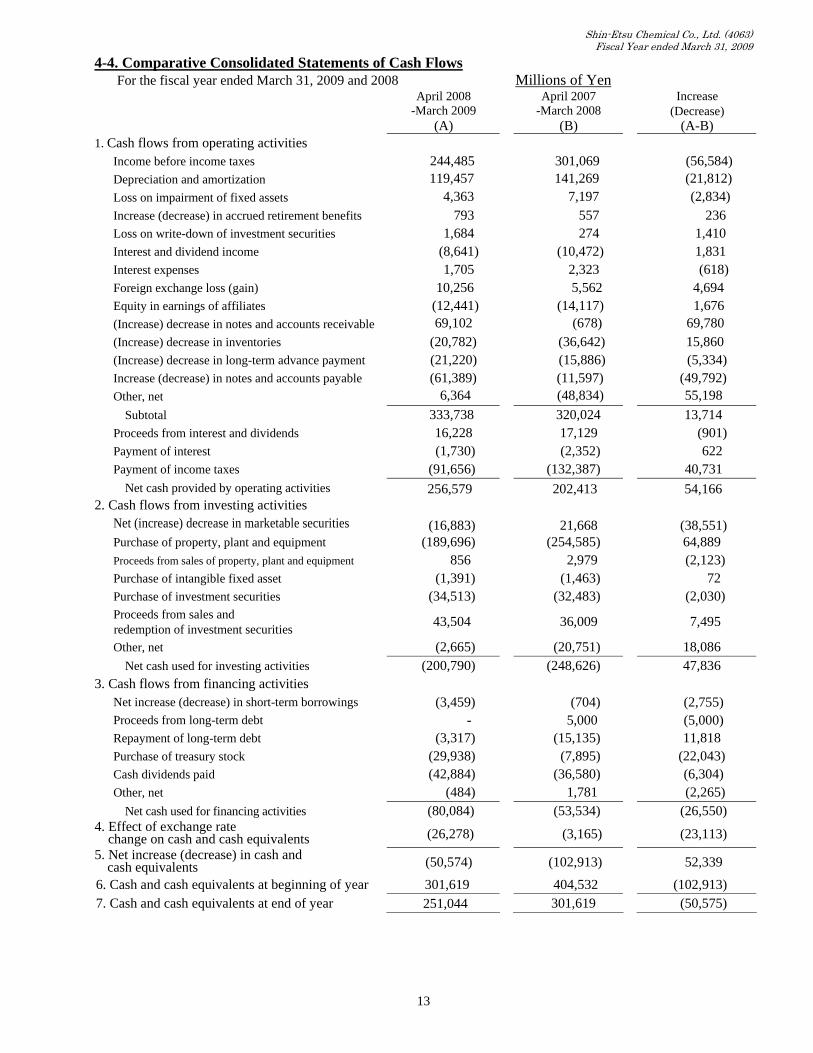
4-4. Comparative Consolidated Statements of Cash Flows For the fiscal year ended March 31, 2009 and 2008 Millions of Yen
April 2008 -March 2009
April 2007 -March 2008
Increase (Decrease)
(A) (B) (A-B) 1. Cash flows from operating activities
Income before income taxes 244,485 301,069 (56,584) Depreciation and amortization 119,457 141,269 (21,812) Loss on impairment of fixed assets 4,363 7,197 (2,834) Increase (decrease) in accrued retirement benefits 793 557 236 Loss on write-down of investment securities 1,684 274 1,410 Interest and dividend income (8,641) (10,472) 1,831 Interest expenses 1,705 2,323 (618) Foreign exchange loss (gain) 10,256 5,562 4,694 Equity in earnings of affiliates (12,441) (14,117) 1,676 (Increase) decrease in notes and accounts receivable 69,102 (678) 69,780 (Increase) decrease in inventories (20,782) (36,642) 15,860 (Increase) decrease in long-term advance payment (21,220) (15,886) (5,334) Increase (decrease) in notes and accounts payable (61,389) (11,597) (49,792) Other, net 6,364 (48,834) 55,198
Subtotal 333,738 320,024 13,714 Proceeds from interest and dividends 16,228 17,129 (901) Payment of interest (1,730) (2,352) 622 Payment of income taxes (91,656) (132,387) 40,731
Net cash provided by operating activities 256,579 202,413 54,166 2. Cash flows from investing activities
Net (increase) decrease in marketable securities (16,883) 21,668 (38,551) Purchase of property, plant and equipment (189,696) (254,585) 64,889 Proceeds from sales of property, plant and equipment 856 2,979 (2,123) Purchase of intangible fixed asset (1,391) (1,463) 72 Purchase of investment securities (34,513) (32,483) (2,030) Proceeds from sales and redemption of investment securities 43,504 36,009 7,495
Other, net (2,665) (20,751) 18,086 Net cash used for investing activities (200,790) (248,626) 47,836
3. Cash flows from financing activities Net increase (decrease) in short-term borrowings (3,459) (704) (2,755) Proceeds from long-term debt - 5,000 (5,000) Repayment of long-term debt (3,317) (15,135) 11,818 Purchase of treasury stock (29,938) (7,895) (22,043) Cash dividends paid (42,884) (36,580) (6,304) Other, net (484) 1,781 (2,265)
Net cash used for financing activities (80,084) (53,534) (26,550) 4. Effect of exchange rate
change on cash and cash equivalents (26,278) (3,165) (23,113) 5. Net increase (decrease) in cash and
cash equivalents (50,574) (102,913) 52,339 6. Cash and cash equivalents at beginning of year 301,619 404,532 (102,913) 7. Cash and cash equivalents at end of year 251,044 301,619 (50,575)
Shin-Etsu Chemical Co., Ltd. (4063) Fiscal Year ended March 31, 2009
14
4-5. Basis of Presenting Consolidated Financial Statements
After the release of last year’s financial report presented on June 30, 2008, there have been no significant changes, except for the following item. Thus, we are omitting Notes concerning all other matters.
4-6. Changes in Basis of Presenting Consolidated Financial Statements
The Evaluation Standard and the Evaluation Method for Inventories Previously, a cost method mainly based on the weighted-average method was adopted for
measuring inventories held for sale in the ordinary course of business. However, the “Accounting Standard for Measurement of Inventories” (ASBJ Statement No. 9) has been applied from FY2009, and now these inventories are measured by means of a cost method mainly based on the weighted-average method, which determines the amount of the inventories shown on the balance sheet by writing them down based on the decrease in their profitability. As a result, Operating income, Ordinary income and Income before income taxes each decreased by ¥3,397 million.
Please see the segment information regarding the effect on segment information.
Accounting Standards for Lease Transactions Previously, finance lease transactions that do not transfer ownership of the leased property to
the lessee followed methods applicable to ordinary rental transactions. However, effective from FY2009, the “Accounting Standard for Lease Transactions” (ASBJ Statement No. 13) and “Implementation Guidance on Accounting Standard for Lease Transactions” (ASBJ Guidance No. 16) have been applied, and such transactions are now accounted for as ordinary sale and purchase transactions. Finance lease transactions starting before FY2009 that do not transfer ownership of the leased property to the lessee are accounted for as operating leases.
The impact of this change on income is immaterial.
Practical Solution on Unification of Accounting Policies Applied to Foreign Subsidiaries for Consolidated Financial Statements
Effective from FY2009, the “Practical Solution on Unification of Accounting Policies Applied to Foreign Subsidiaries for Consolidated Financial Statements” (ASBJ PITF No.18) has been applied, and accordingly some revisions have been made to the consolidated accounts as necessary.
As a result, Operating income decreased by ¥459 million, Ordinary income and Income before income taxes decreased by ¥383 million respectively.
The disclosure of the effect on segment information is omitted because it is considered immaterial.
(Additional Information) Depreciation Method of Tangible Fixed Assets
In accordance with the revised Japanese Corporation Tax Law, Shin-Etsu Chemical Co., Ltd. (the “Company”) and its domestic subsidiaries changed the period of depreciation for tangible fixed assets (except for semiconductor silicon manufacturing facilities/equipment). As a result, the depreciation expenses for the current fiscal year decreased by ¥307 million, and Operating income, Ordinary income and Income before income taxes each increased by ¥165 million, compared with the amounts under the formerly applied method.
The disclosure of the effect on segment information is omitted because it is considered immaterial.
Shin-Etsu Chemical Co., Ltd. (4063) Fiscal Year ended March 31, 2009
15
(Note to Consolidated Balance Sheets) Millions of Yen March 31, March 31, 2009 2008 Accumulated depreciation of property, plant and equipment 1,248,324 1,243,922
(Notes to Consolidated Statements of Income) Millions of Yen March 31, March 31, 2009 2008 1. Research and development costs 37,165 47,944 2. Loss on impairment of fixed assets
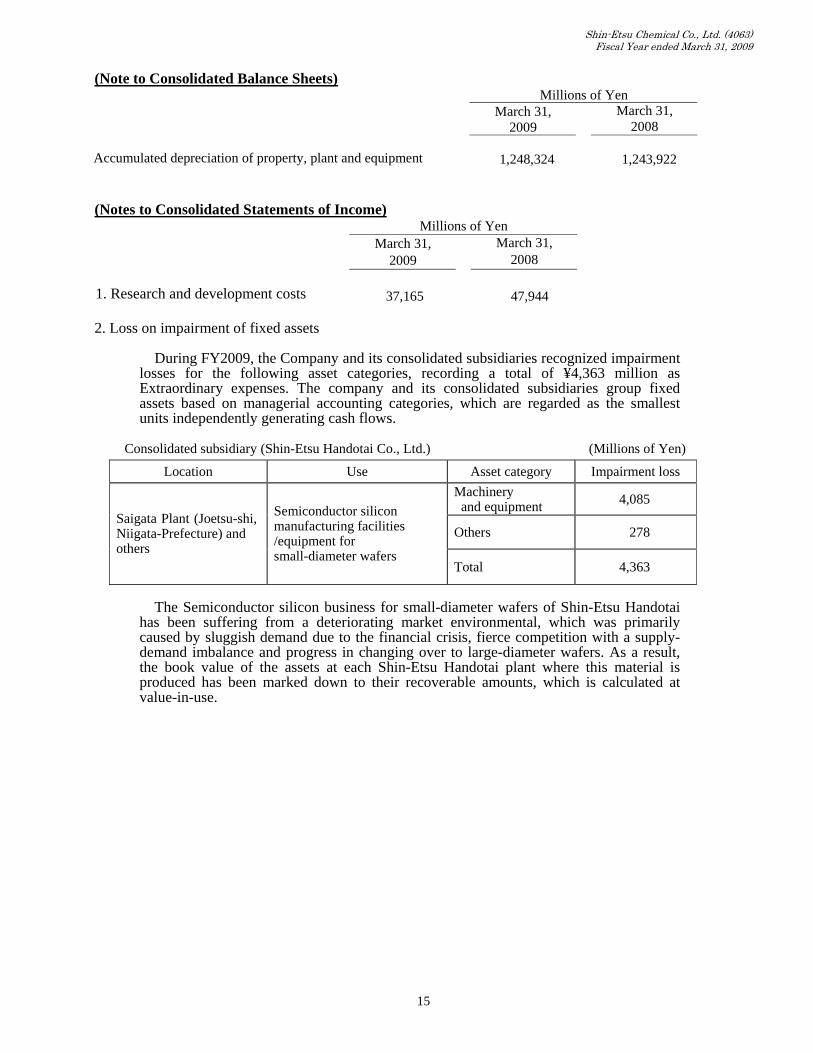
During FY2009, the Company and its consolidated subsidiaries recognized impairment losses for the following asset categories, recording a total of ¥4,363 million as Extraordinary expenses. The company and its consolidated subsidiaries group fixed assets based on managerial accounting categories, which are regarded as the smallest units independently generating cash flows.
Consolidated subsidiary (Shin-Etsu Handotai Co., Ltd.) (Millions of Yen)
Location Use Asset category Impairment loss Machinery and equipment 4,085
Others 278 Saigata Plant (Joetsu-shi, Niigata-Prefecture) and others
Semiconductor silicon manufacturing facilities /equipment for small-diameter wafers
Total 4,363
The Semiconductor silicon business for small-diameter wafers of Shin-Etsu Handotai
has been suffering from a deteriorating market environmental, which was primarily caused by sluggish demand due to the financial crisis, fierce competition with a supply-demand imbalance and progress in changing over to large-diameter wafers. As a result, the book value of the assets at each Shin-Etsu Handotai plant where this material is produced has been marked down to their recoverable amounts, which is calculated at value-in-use.
Shin-Etsu Chemical Co., Ltd. (4063) Fiscal Year ended March 31, 2009
16
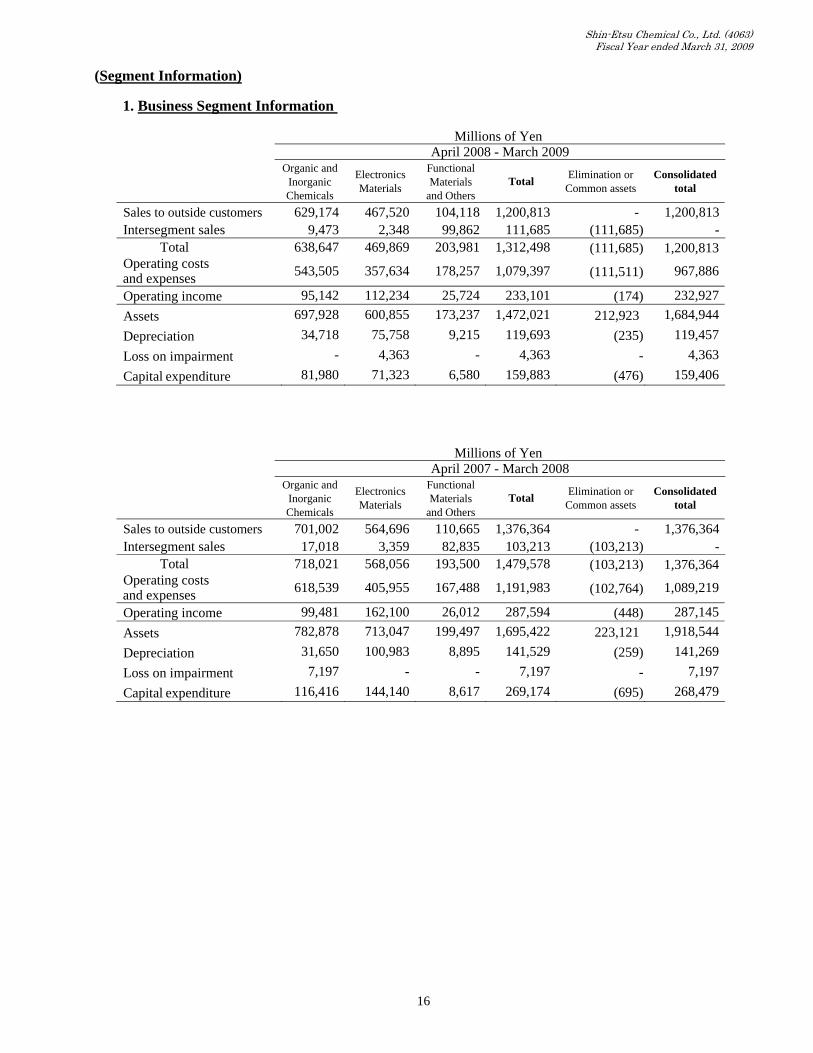
(Segment Information)
1. Business Segment Information
Millions of Yen April 2008 - March 2009
Organic and Inorganic Chemicals
Electronics Materials
Functional Materials
and Others Total Elimination or
Common assets Consolidated
total
Sales to outside customers 629,174 467,520 104,118 1,200,813 - 1,200,813 Intersegment sales 9,473 2,348 99,862 111,685 (111,685) -
Total 638,647 469,869 203,981 1,312,498 (111,685) 1,200,813Operating costs and expenses 543,505 357,634 178,257 1,079,397 (111,511) 967,886
Operating income 95,142 112,234 25,724 233,101 (174) 232,927Assets 697,928 600,855 173,237 1,472,021 212,923 1,684,944Depreciation 34,718 75,758 9,215 119,693 (235) 119,457Loss on impairment - 4,363 - 4,363 - 4,363Capital expenditure 81,980 71,323 6,580 159,883 (476) 159,406
Millions of Yen April 2007 - March 2008
Organic and Inorganic Chemicals
Electronics Materials
Functional Materials
and Others Total Elimination or
Common assets Consolidated
total
Sales to outside customers 701,002 564,696 110,665 1,376,364 - 1,376,364 Intersegment sales 17,018 3,359 82,835 103,213 (103,213) -
Total 718,021 568,056 193,500 1,479,578 (103,213) 1,376,364Operating costs and expenses 618,539 405,955 167,488 1,191,983 (102,764) 1,089,219
Operating income 99,481 162,100 26,012 287,594 (448) 287,145Assets 782,878 713,047 199,497 1,695,422 223,121 1,918,544Depreciation 31,650 100,983 8,895 141,529 (259) 141,269Loss on impairment 7,197 - - 7,197 - 7,197Capital expenditure 116,416 144,140 8,617 269,174 (695) 268,479
Shin-Etsu Chemical Co., Ltd. (4063) Fiscal Year ended March 31, 2009
17
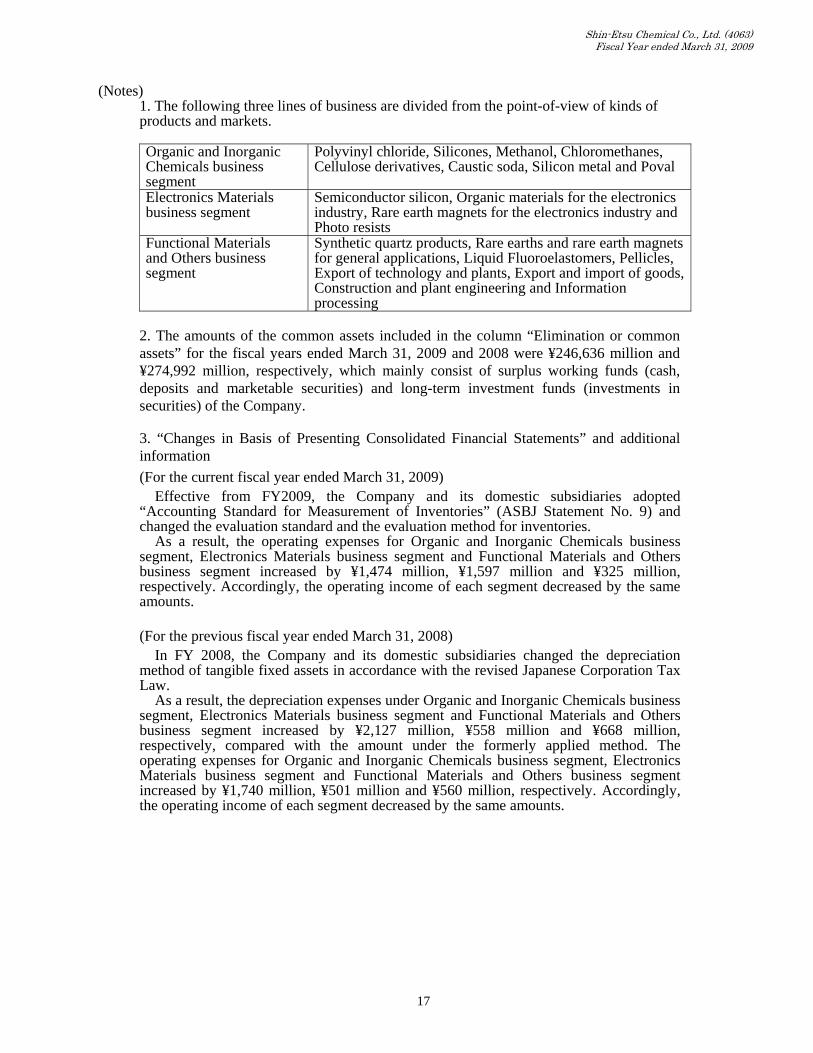
(Notes)
1. The following three lines of business are divided from the point-of-view of kinds of products and markets.
Organic and Inorganic Chemicals business segment
Polyvinyl chloride, Silicones, Methanol, Chloromethanes, Cellulose derivatives, Caustic soda, Silicon metal and Poval
Electronics Materials business segment
Semiconductor silicon, Organic materials for the electronics industry, Rare earth magnets for the electronics industry and Photo resists
Functional Materials and Others business segment
Synthetic quartz products, Rare earths and rare earth magnets for general applications, Liquid Fluoroelastomers, Pellicles, Export of technology and plants, Export and import of goods, Construction and plant engineering and Information processing
2. The amounts of the common assets included in the column “Elimination or common assets” for the fiscal years ended March 31, 2009 and 2008 were ¥246,636 million and ¥274,992 million, respectively, which mainly consist of surplus working funds (cash, deposits and marketable securities) and long-term investment funds (investments in securities) of the Company. 3. “Changes in Basis of Presenting Consolidated Financial Statements” and additional information (For the current fiscal year ended March 31, 2009)
Effective from FY2009, the Company and its domestic subsidiaries adopted “Accounting Standard for Measurement of Inventories” (ASBJ Statement No. 9) and changed the evaluation standard and the evaluation method for inventories.
As a result, the operating expenses for Organic and Inorganic Chemicals business segment, Electronics Materials business segment and Functional Materials and Others business segment increased by ¥1,474 million, ¥1,597 million and ¥325 million, respectively. Accordingly, the operating income of each segment decreased by the same amounts.
(For the previous fiscal year ended March 31, 2008)
In FY 2008, the Company and its domestic subsidiaries changed the depreciation method of tangible fixed assets in accordance with the revised Japanese Corporation Tax Law.
As a result, the depreciation expenses under Organic and Inorganic Chemicals business segment, Electronics Materials business segment and Functional Materials and Others business segment increased by ¥2,127 million, ¥558 million and ¥668 million, respectively, compared with the amount under the formerly applied method. The operating expenses for Organic and Inorganic Chemicals business segment, Electronics Materials business segment and Functional Materials and Others business segment increased by ¥1,740 million, ¥501 million and ¥560 million, respectively. Accordingly, the operating income of each segment decreased by the same amounts.
Shin-Etsu Chemical Co., Ltd. (4063) Fiscal Year ended March 31, 2009
18
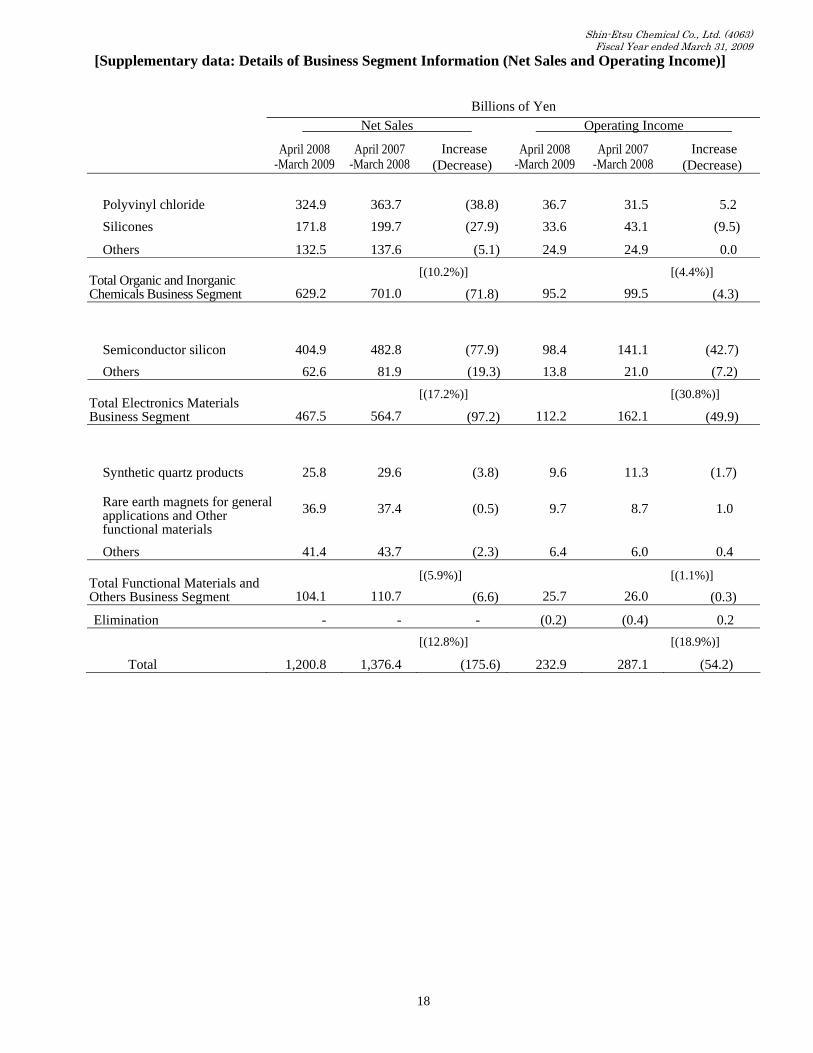
[Supplementary data: Details of Business Segment Information (Net Sales and Operating Income)] Billions of Yen Net Sales Operating Income
April 2008 -March 2009
April 2007 -March 2008
Increase (Decrease)
April 2008 -March 2009
April 2007 -March 2008
Increase (Decrease)
Polyvinyl chloride 324.9 363.7 (38.8) 36.7 31.5 5.2 Silicones 171.8 199.7 (27.9) 33.6 43.1 (9.5)
Others 132.5 137.6 (5.1) 24.9 24.9 0.0 [(10.2%)] [(4.4%)] Total Organic and Inorganic
Chemicals Business Segment 629.2 701.0 (71.8) 95.2 99.5 (4.3) Semiconductor silicon 404.9 482.8 (77.9) 98.4 141.1 (42.7) Others 62.6 81.9 (19.3) 13.8 21.0 (7.2)
[(17.2%)] [(30.8%)] Total Electronics Materials Business Segment 467.5 564.7 (97.2) 112.2 162.1 (49.9)
Synthetic quartz products 25.8 29.6 (3.8) 9.6 11.3 (1.7)
Rare earth magnets for general applications and Other functional materials
36.9 37.4 (0.5) 9.7 8.7 1.0
Others 41.4 43.7 (2.3) 6.4 6.0 0.4
[(5.9%)] [(1.1%)] Total Functional Materials andOthers Business Segment 104.1 110.7 (6.6) 25.7 26.0 (0.3)
Elimination - - - (0.2) (0.4) 0.2 [(12.8%)] [(18.9%)]
Total 1,200.8 1,376.4 (175.6) 232.9 287.1 (54.2)
Shin-Etsu Chemical Co., Ltd. (4063) Fiscal Year ended March 31, 2009
19
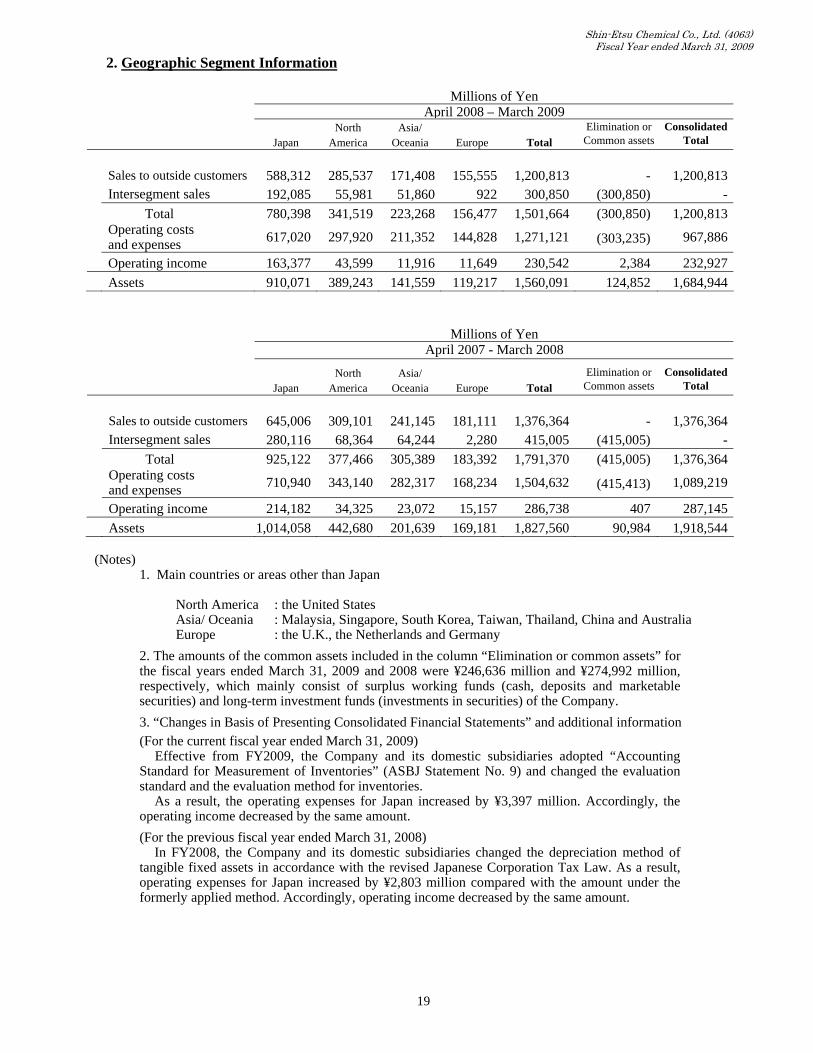
2. Geographic Segment Information
Millions of Yen April 2008 – March 2009
Japan North
America Asia/
Oceania Europe
Total Elimination or Common assets
Consolidated Total
Sales to outside customers 588,312 285,537 171,408 155,555 1,200,813 - 1,200,813 Intersegment sales 192,085 55,981 51,860 922 300,850 (300,850) - Total 780,398 341,519 223,268 156,477 1,501,664 (300,850) 1,200,813 Operating costs
and expenses 617,020 297,920 211,352 144,828 1,271,121 (303,235) 967,886
Operating income 163,377 43,599 11,916 11,649 230,542 2,384 232,927 Assets 910,071 389,243 141,559 119,217 1,560,091 124,852 1,684,944 Millions of Yen April 2007 - March 2008
Japan North
America Asia/
Oceania
Europe
Total Elimination or Common assets
ConsolidatedTotal
Sales to outside customers 645,006 309,101 241,145 181,111 1,376,364 - 1,376,364 Intersegment sales 280,116 68,364 64,244 2,280 415,005 (415,005) - Total 925,122 377,466 305,389 183,392 1,791,370 (415,005) 1,376,364 Operating costs
and expenses 710,940 343,140 282,317 168,234 1,504,632 (415,413) 1,089,219
Operating income 214,182 34,325 23,072 15,157 286,738 407 287,145 Assets 1,014,058 442,680 201,639 169,181 1,827,560 90,984 1,918,544 (Notes)
1. Main countries or areas other than Japan
North America : the United States Asia/ Oceania : Malaysia, Singapore, South Korea, Taiwan, Thailand, China and Australia Europe : the U.K., the Netherlands and Germany
2. The amounts of the common assets included in the column “Elimination or common assets” for the fiscal years ended March 31, 2009 and 2008 were ¥246,636 million and ¥274,992 million, respectively, which mainly consist of surplus working funds (cash, deposits and marketable securities) and long-term investment funds (investments in securities) of the Company. 3. “Changes in Basis of Presenting Consolidated Financial Statements” and additional information (For the current fiscal year ended March 31, 2009)
Effective from FY2009, the Company and its domestic subsidiaries adopted “Accounting Standard for Measurement of Inventories” (ASBJ Statement No. 9) and changed the evaluation standard and the evaluation method for inventories.
As a result, the operating expenses for Japan increased by ¥3,397 million. Accordingly, the operating income decreased by the same amount. (For the previous fiscal year ended March 31, 2008)
In FY2008, the Company and its domestic subsidiaries changed the depreciation method of tangible fixed assets in accordance with the revised Japanese Corporation Tax Law. As a result, operating expenses for Japan increased by ¥2,803 million compared with the amount under the formerly applied method. Accordingly, operating income decreased by the same amount.
Shin-Etsu Chemical Co., Ltd. (4063) Fiscal Year ended March 31, 2009
20
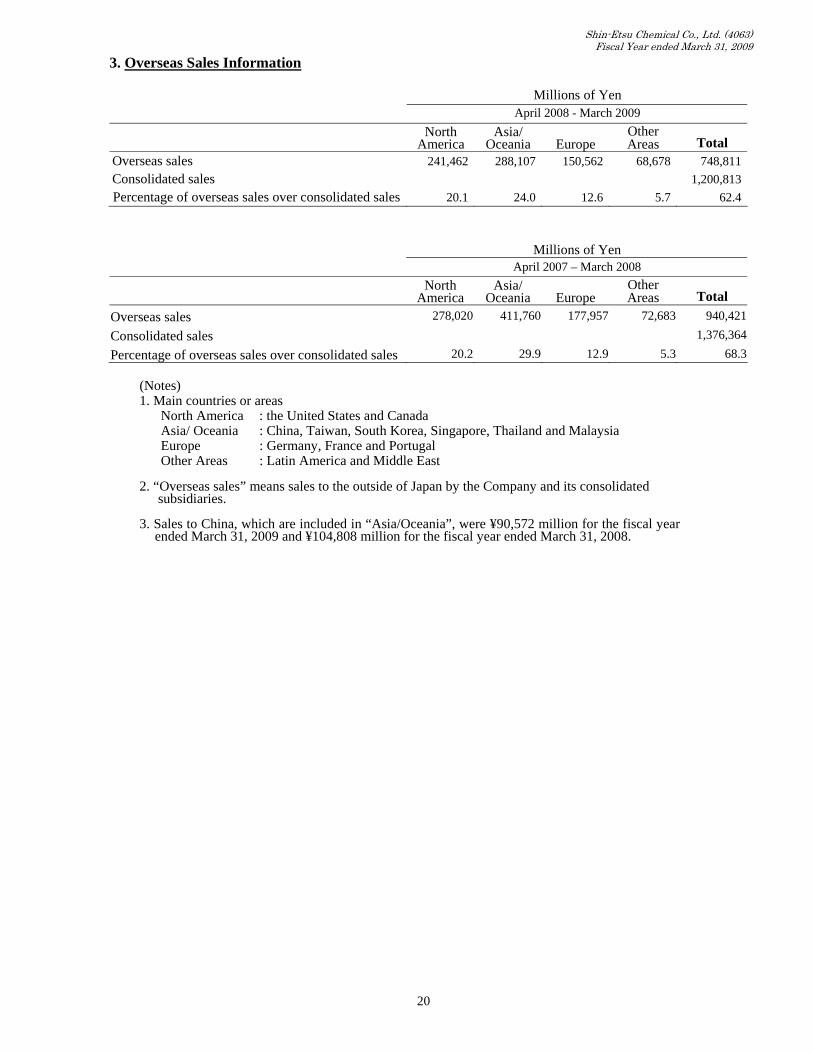
3. Overseas Sales Information
Millions of Yen April 2008 - March 2009 North
America Asia/
Oceania Europe Other Areas
Total
Overseas sales 241,462 288,107 150,562 68,678 748,811Consolidated sales 1,200,813Percentage of overseas sales over consolidated sales 20.1 24.0 12.6 5.7 62.4
Millions of Yen April 2007 – March 2008 North
America Asia/
Oceania Europe Other Areas
Total
Overseas sales 278,020 411,760 177,957 72,683 940,421
Consolidated sales 1,376,364Percentage of overseas sales over consolidated sales 20.2 29.9 12.9 5.3 68.3
(Notes) 1. Main countries or areas
North America : the United States and Canada Asia/ Oceania : China, Taiwan, South Korea, Singapore, Thailand and Malaysia Europe : Germany, France and Portugal Other Areas : Latin America and Middle East
2. “Overseas sales” means sales to the outside of Japan by the Company and its consolidated
subsidiaries.
3. Sales to China, which are included in “Asia/Oceania”, were ¥90,572 million for the fiscal year ended March 31, 2009 and ¥104,808 million for the fiscal year ended March 31, 2008.
Shin-Etsu Chemical Co., Ltd. (4063) Fiscal Year ended March 31, 2009
21
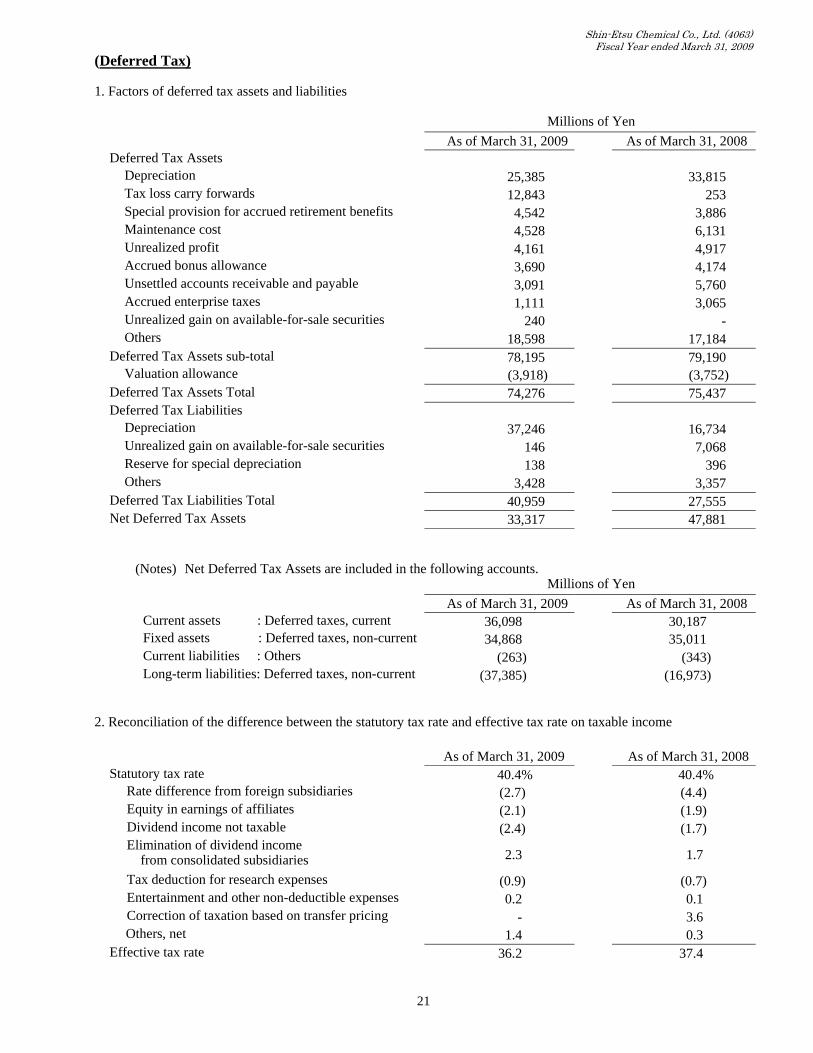
(Deferred Tax) 1. Factors of deferred tax assets and liabilities
Millions of Yen
As of March 31, 2009 As of March 31, 2008 Deferred Tax Assets
Depreciation 25,385 33,815 Tax loss carry forwards 12,843 253 Special provision for accrued retirement benefits 4,542 3,886 Maintenance cost 4,528 6,131 Unrealized profit 4,161 4,917 Accrued bonus allowance 3,690 4,174 Unsettled accounts receivable and payable 3,091 5,760 Accrued enterprise taxes 1,111 3,065 Unrealized gain on available-for-sale securities 240 - Others 18,598 17,184
Deferred Tax Assets sub-total 78,195 79,190 Valuation allowance (3,918) (3,752)
Deferred Tax Assets Total 74,276 75,437 Deferred Tax Liabilities
Depreciation 37,246 16,734 Unrealized gain on available-for-sale securities 146 7,068 Reserve for special depreciation 138 396 Others 3,428 3,357
Deferred Tax Liabilities Total 40,959 27,555 Net Deferred Tax Assets 33,317 47,881
(Notes) Net Deferred Tax Assets are included in the following accounts. Millions of Yen
As of March 31, 2009 As of March 31, 2008 Current assets : Deferred taxes, current 36,098 30,187 Fixed assets : Deferred taxes, non-current 34,868 35,011 Current liabilities : Others (263) (343) Long-term liabilities: Deferred taxes, non-current (37,385) (16,973)
2. Reconciliation of the difference between the statutory tax rate and effective tax rate on taxable income
As of March 31, 2009 As of March 31, 2008
Statutory tax rate 40.4% 40.4% Rate difference from foreign subsidiaries (2.7) (4.4)
Equity in earnings of affiliates (2.1) (1.9) Dividend income not taxable (2.4) (1.7) Elimination of dividend income from consolidated subsidiaries 2.3 1.7
Tax deduction for research expenses (0.9) (0.7) Entertainment and other non-deductible expenses 0.2 0.1 Correction of taxation based on transfer pricing - 3.6 Others, net 1.4 0.3 Effective tax rate 36.2 37.4
Shin-Etsu Chemical Co., Ltd. (4063) Fiscal Year ended March 31, 2009
22
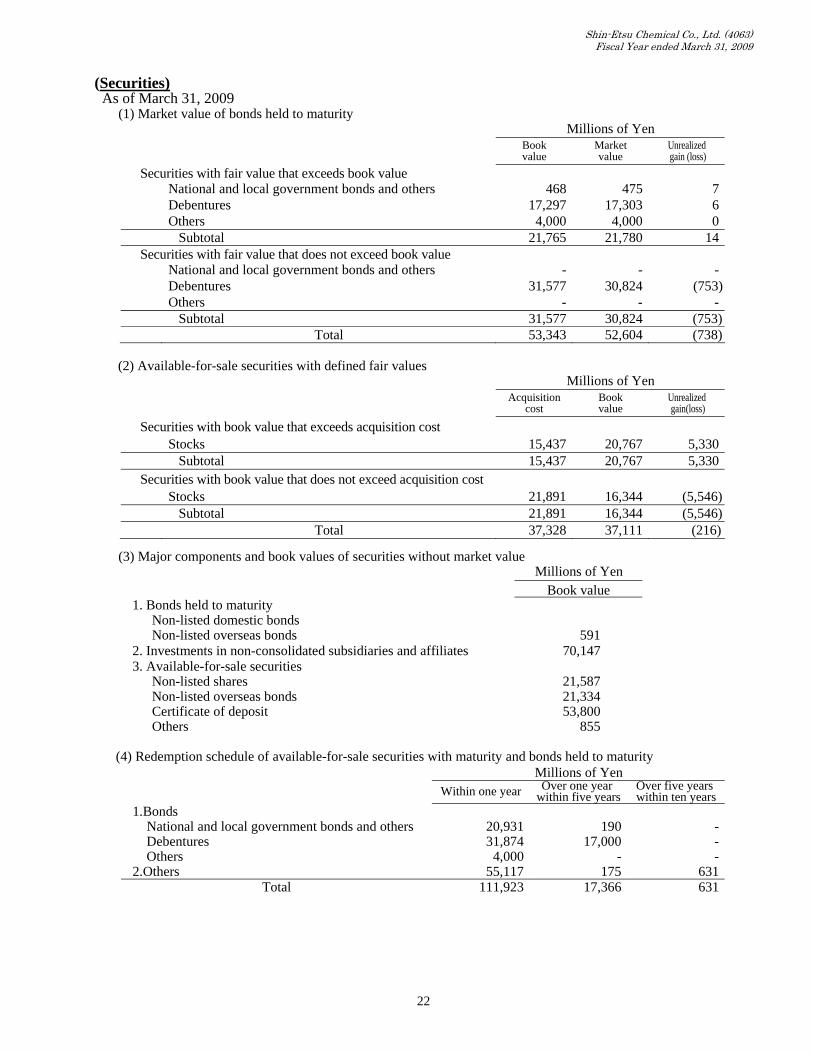
(Securities) As of March 31, 2009 (1) Market value of bonds held to maturity
Millions of Yen Book
value Market value
Unrealized gain (loss)
Securities with fair value that exceeds book value National and local government bonds and others 468 475 7 Debentures 17,297 17,303 6 Others 4,000 4,000 0 Subtotal 21,765 21,780 14 Securities with fair value that does not exceed book value
National and local government bonds and others - - - Debentures 31,577 30,824 (753) Others - - - Subtotal 31,577 30,824 (753)
Total 53,343 52,604 (738) (2) Available-for-sale securities with defined fair values
Millions of Yen Acquisition
cost Book
value Unrealized gain(loss)
Securities with book value that exceeds acquisition cost Stocks 15,437 20,767 5,330 Subtotal 15,437 20,767 5,330 Securities with book value that does not exceed acquisition cost
Stocks 21,891 16,344 (5,546) Subtotal 21,891 16,344 (5,546) Total 37,328 37,111 (216)
(3) Major components and book values of securities without market value
Millions of Yen Book value 1. Bonds held to maturity
Non-listed domestic bonds Non-listed overseas bonds 591
2. Investments in non-consolidated subsidiaries and affiliates 70,147 3. Available-for-sale securities
Non-listed shares 21,587 Non-listed overseas bonds 21,334 Certificate of deposit 53,800 Others 855
(4) Redemption schedule of available-for-sale securities with maturity and bonds held to maturity
Millions of Yen Within one year Over one year
within five years Over five years within ten years
1.Bonds National and local government bonds and others 20,931 190 -Debentures 31,874 17,000 -Others 4,000 - -
2.Others 55,117 175 631Total 111,923 17,366 631
Shin-Etsu Chemical Co., Ltd. (4063) Fiscal Year ended March 31, 2009
23
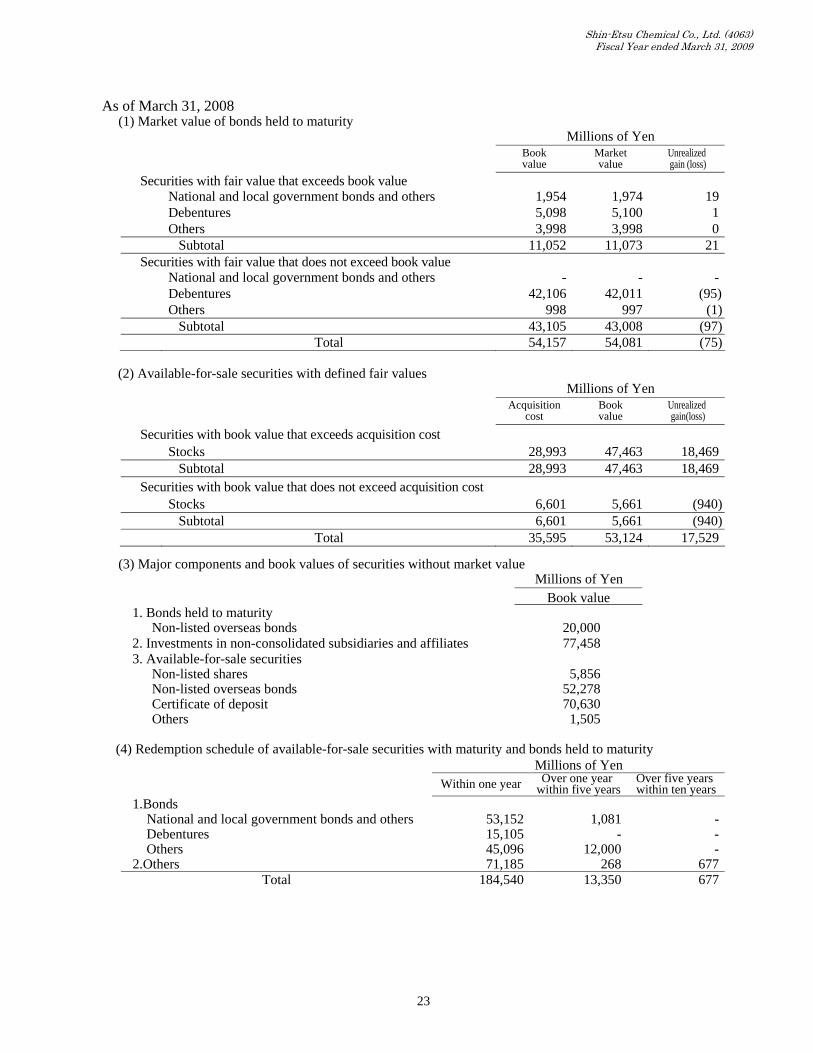
As of March 31, 2008 (1) Market value of bonds held to maturity
Millions of Yen Book
value Market value
Unrealized gain (loss)
Securities with fair value that exceeds book value National and local government bonds and others 1,954 1,974 19 Debentures 5,098 5,100 1 Others 3,998 3,998 0 Subtotal 11,052 11,073 21 Securities with fair value that does not exceed book value
National and local government bonds and others - - - Debentures 42,106 42,011 (95) Others 998 997 (1) Subtotal 43,105 43,008 (97)
Total 54,157 54,081 (75) (2) Available-for-sale securities with defined fair values
Millions of Yen Acquisition
cost Book
value Unrealized gain(loss)
Securities with book value that exceeds acquisition cost Stocks 28,993 47,463 18,469 Subtotal 28,993 47,463 18,469 Securities with book value that does not exceed acquisition cost
Stocks 6,601 5,661 (940) Subtotal 6,601 5,661 (940) Total 35,595 53,124 17,529
(3) Major components and book values of securities without market value
Millions of Yen Book value 1. Bonds held to maturity
Non-listed overseas bonds 20,000 2. Investments in non-consolidated subsidiaries and affiliates 77,458 3. Available-for-sale securities
Non-listed shares 5,856 Non-listed overseas bonds 52,278 Certificate of deposit 70,630 Others 1,505
(4) Redemption schedule of available-for-sale securities with maturity and bonds held to maturity
Millions of Yen Within one year Over one year
within five years Over five years within ten years
1.Bonds National and local government bonds and others 53,152 1,081 -Debentures 15,105 - -Others 45,096 12,000 -
2.Others 71,185 268 677Total 184,540 13,350 677
Shin-Etsu Chemical Co., Ltd. (4063) Fiscal Year ended March 31, 2009
24
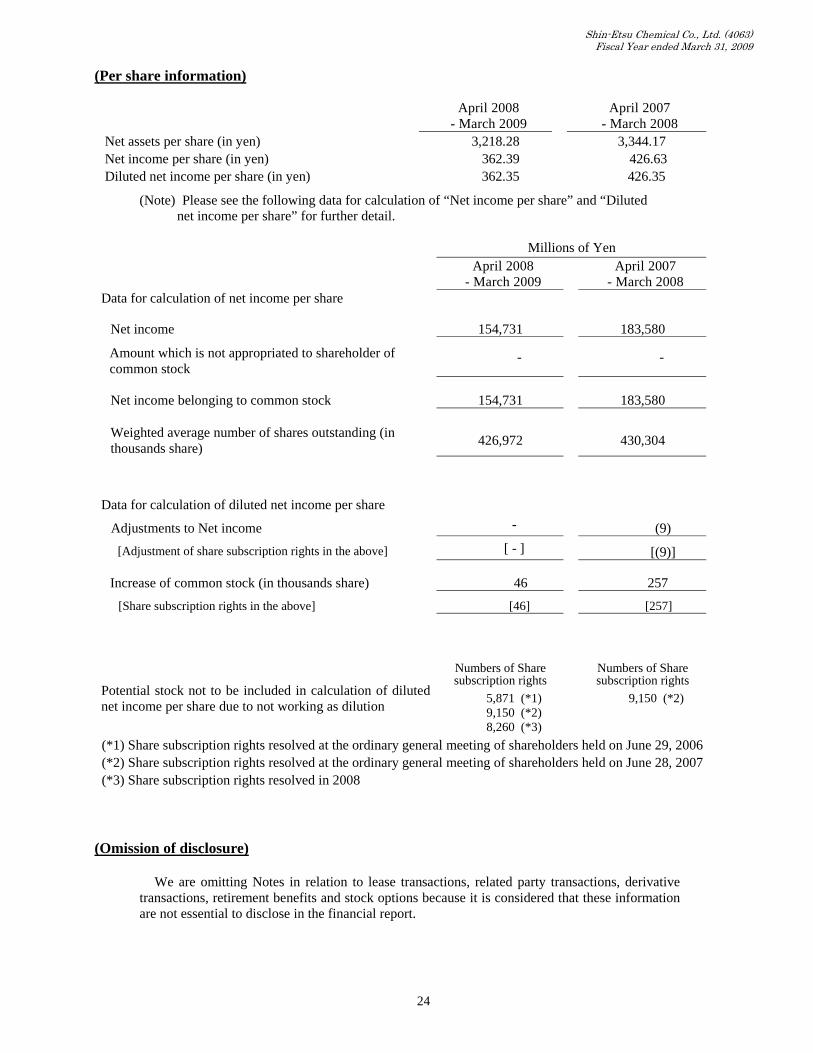
(Per share information)
April 2008
- March 2009 April 2007
- March 2008 Net assets per share (in yen) 3,218.28 3,344.17 Net income per share (in yen) 362.39 426.63 Diluted net income per share (in yen) 362.35 426.35
(Note) Please see the following data for calculation of “Net income per share” and “Diluted net income per share” for further detail.
Millions of Yen April 2008
- March 2009 April 2007
- March 2008 Data for calculation of net income per share
Net income 154,731 183,580
Amount which is not appropriated to shareholder of common stock
-
-
Net income belonging to common stock 154,731 183,580 Weighted average number of shares outstanding (in thousands share) 426,972 430,304
Data for calculation of diluted net income per share
Adjustments to Net income - (9)
[Adjustment of share subscription rights in the above] [ - ] [(9)] Increase of common stock (in thousands share) 46 257
[Share subscription rights in the above] [46] [257]
Potential stock not to be included in calculation of diluted net income per share due to not working as dilution
Numbers of Share subscription rights
5,871 (*1) 9,150 (*2) 8,260 (*3)
Numbers of Share subscription rights
9,150 (*2)
(*1) Share subscription rights resolved at the ordinary general meeting of shareholders held on June 29, 2006 (*2) Share subscription rights resolved at the ordinary general meeting of shareholders held on June 28, 2007 (*3) Share subscription rights resolved in 2008
(Omission of disclosure)
We are omitting Notes in relation to lease transactions, related party transactions, derivative transactions, retirement benefits and stock options because it is considered that these information are not essential to disclose in the financial report.
Shin-Etsu Chemical Co., Ltd. (4063) Fiscal Year ended March 31, 2009
25
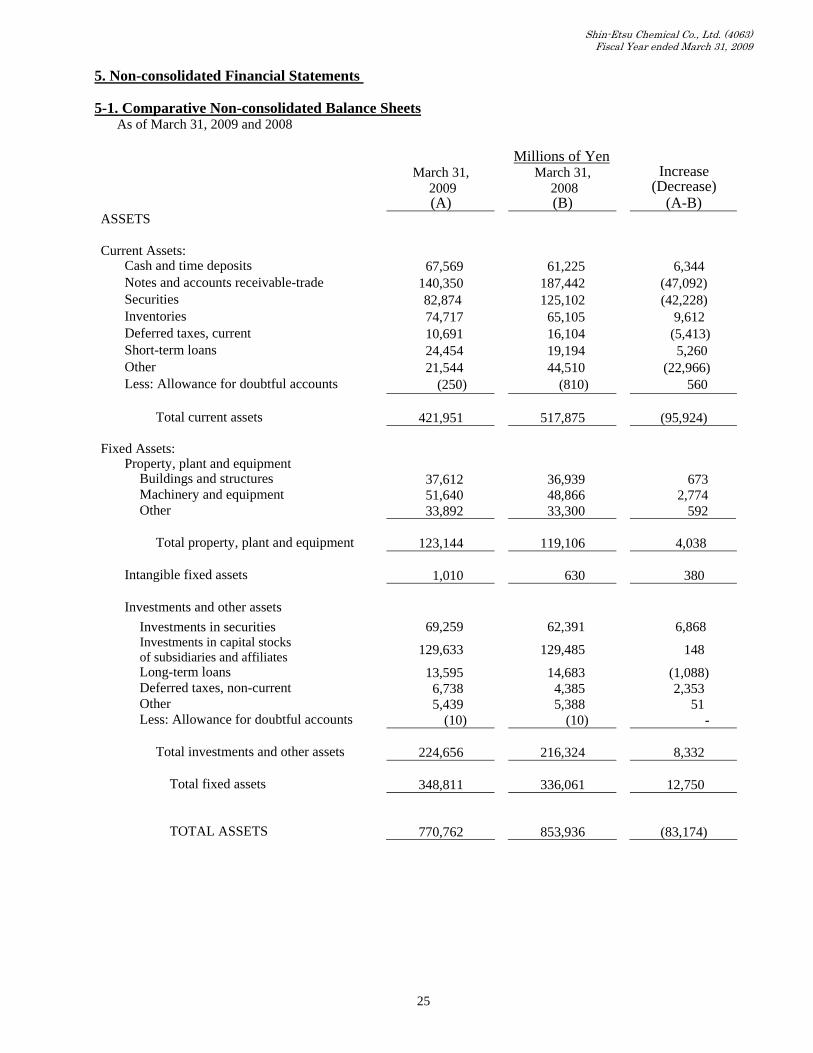
5. Non-consolidated Financial Statements 5-1. Comparative Non-consolidated Balance Sheets
As of March 31, 2009 and 2008
Millions of Yen March 31,
2009 March 31,
2008 Increase
(Decrease) (A) (B) (A-B) ASSETS Current Assets:
Cash and time deposits 67,569 61,225 6,344 Notes and accounts receivable-trade 140,350 187,442 (47,092) Securities 82,874 125,102 (42,228) Inventories 74,717 65,105 9,612 Deferred taxes, current 10,691 16,104 (5,413) Short-term loans 24,454 19,194 5,260 Other 21,544 44,510 (22,966) Less: Allowance for doubtful accounts (250) (810) 560
Total current assets 421,951 517,875 (95,924) Fixed Assets:
Property, plant and equipment Buildings and structures 37,612 36,939 673 Machinery and equipment 51,640 48,866 2,774 Other 33,892 33,300 592
Total property, plant and equipment 123,144 119,106 4,038
Intangible fixed assets 1,010 630 380 Investments and other assets
Investments in securities 69,259 62,391 6,868 Investments in capital stocks of subsidiaries and affiliates 129,633 129,485 148 Long-term loans 13,595 14,683 (1,088) Deferred taxes, non-current 6,738 4,385 2,353 Other 5,439 5,388 51 Less: Allowance for doubtful accounts (10) (10) -
Total investments and other assets 224,656 216,324 8,332
Total fixed assets 348,811 336,061 12,750
TOTAL ASSETS 770,762 853,936 (83,174)
Shin-Etsu Chemical Co., Ltd. (4063) Fiscal Year ended March 31, 2009
26
Millions of Yen March 31,
2009 March 31,
2008 Increase
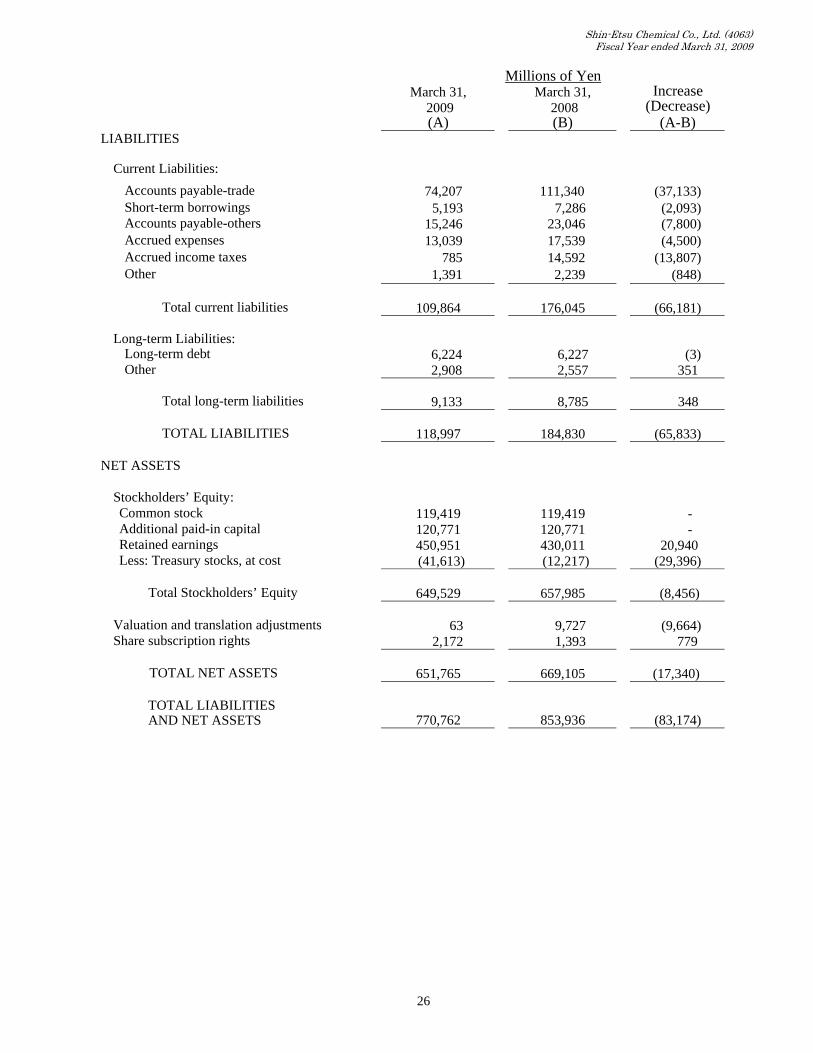
(Decrease) (A) (B) (A-B) LIABILITIES
Current Liabilities: Accounts payable-trade 74,207 111,340 (37,133) Short-term borrowings 5,193 7,286 (2,093) Accounts payable-others 15,246 23,046 (7,800) Accrued expenses 13,039 17,539 (4,500) Accrued income taxes 785 14,592 (13,807) Other 1,391 2,239 (848)
Total current liabilities 109,864 176,045 (66,181)
Long-term Liabilities:
Long-term debt 6,224 6,227 (3) Other 2,908 2,557 351
Total long-term liabilities 9,133 8,785 348
TOTAL LIABILITIES 118,997 184,830 (65,833)
NET ASSETS
Stockholders’ Equity: Common stock 119,419 119,419 - Additional paid-in capital 120,771 120,771 - Retained earnings 450,951 430,011 20,940 Less: Treasury stocks, at cost (41,613) (12,217) (29,396)
Total Stockholders’ Equity 649,529 657,985 (8,456)
Valuation and translation adjustments 63 9,727 (9,664) Share subscription rights 2,172 1,393 779
TOTAL NET ASSETS 651,765 669,105 (17,340)
TOTAL LIABILITIES AND NET ASSETS 770,762 853,936 (83,174)
Shin-Etsu Chemical Co., Ltd. (4063) Fiscal Year ended March 31, 2009
27
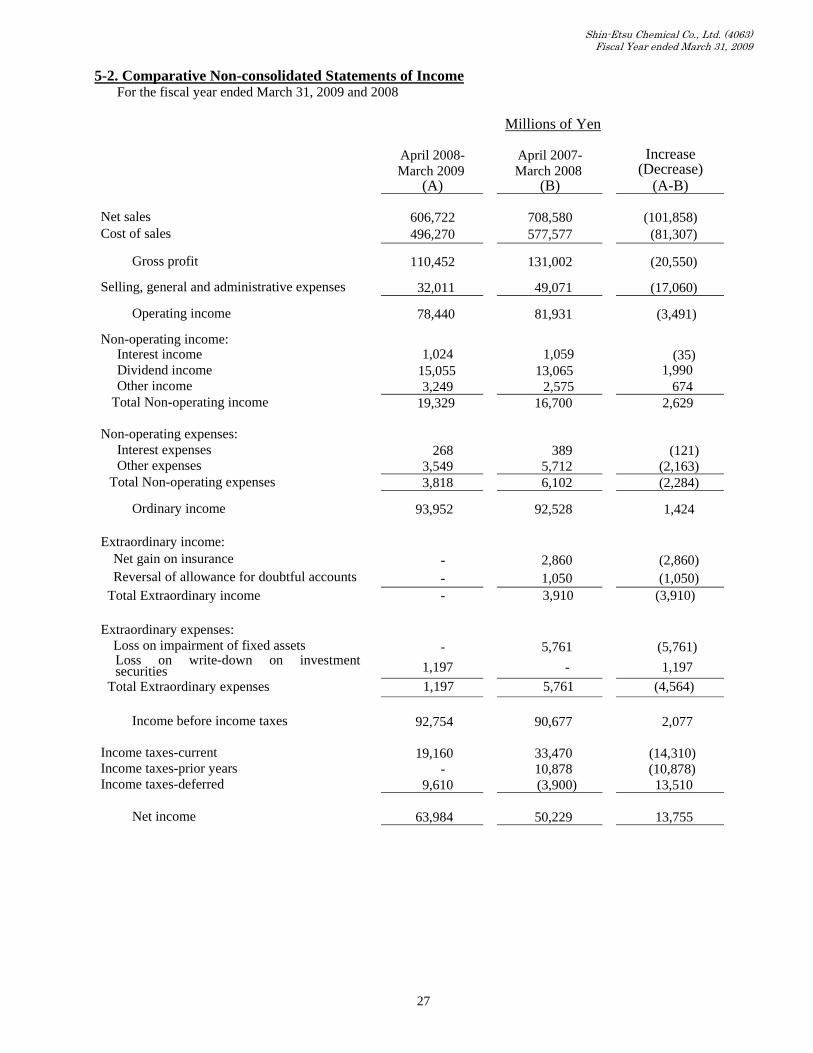
5-2. Comparative Non-consolidated Statements of Income
For the fiscal year ended March 31, 2009 and 2008
Millions of Yen April 2008-
March 2009 April 2007-
March 2008 Increase
(Decrease) (A) (B) (A-B) Net sales 606,722 708,580 (101,858) Cost of sales 496,270 577,577 (81,307)
Gross profit 110,452 131,002 (20,550)
Selling, general and administrative expenses 32,011 49,071 (17,060) Operating income 78,440 81,931 (3,491)
Non-operating income:
Interest income 1,024 1,059 (35) Dividend income 15,055 13,065 1,990 Other income 3,249 2,575 674
Total Non-operating income 19,329 16,700 2,629 Non-operating expenses:
Interest expenses 268 389 (121) Other expenses 3,549 5,712 (2,163)
Total Non-operating expenses 3,818 6,102 (2,284) Ordinary income 93,952 92,528 1,424
Extraordinary income:
Net gain on insurance - 2,860 (2,860) Reversal of allowance for doubtful accounts - 1,050 (1,050)
Total Extraordinary income - 3,910 (3,910) Extraordinary expenses:
Loss on impairment of fixed assets - 5,761 (5,761) Loss on write-down on investment securities 1,197 - 1,197
Total Extraordinary expenses 1,197 5,761 (4,564) Income before income taxes 92,754 90,677 2,077
Income taxes-current 19,160 33,470 (14,310) Income taxes-prior years - 10,878 (10,878) Income taxes-deferred 9,610 (3,900) 13,510
Net income 63,984 50,229 13,755
Shin-Etsu Chemical Co., Ltd. (4063) Fiscal Year ended March 31, 2009
28
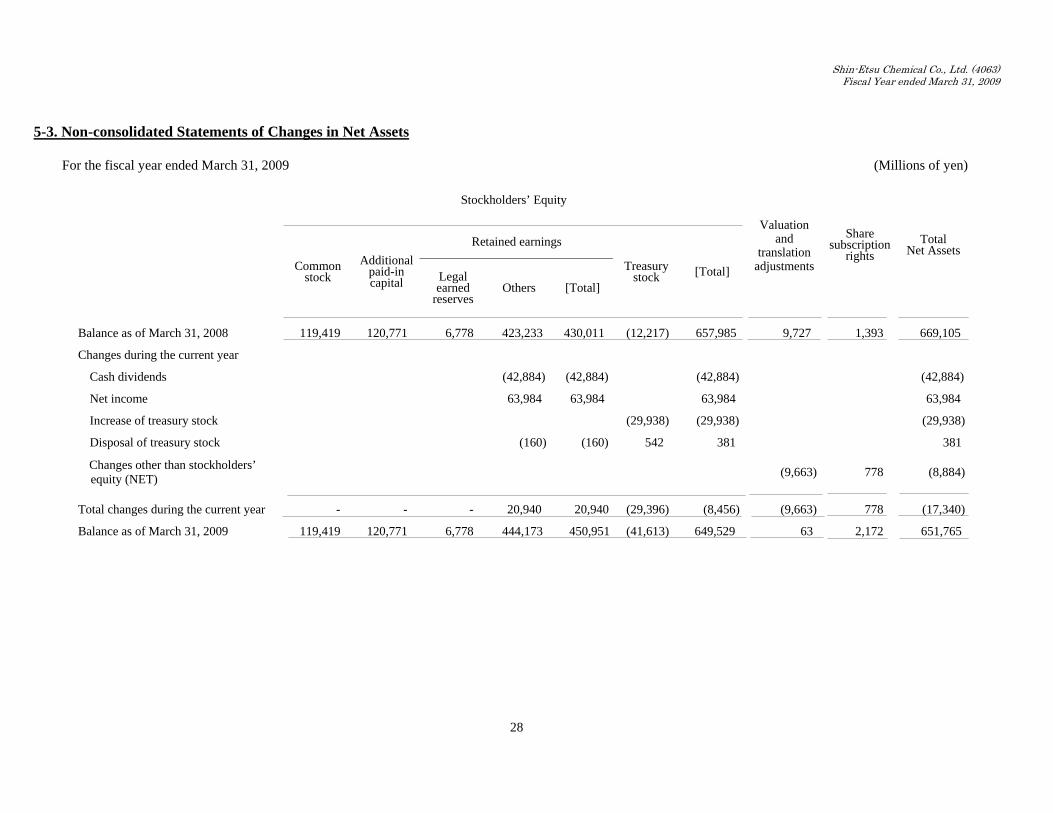
5-3. Non-consolidated Statements of Changes in Net Assets
For the fiscal year ended March 31, 2009 (Millions of yen)
Stockholders’ Equity
Retained earnings
Common stock
Additional paid-in capital Legal
earned reserves
Others [Total]
Treasury stock [Total]
Valuation and
translation adjustments
Share subscription
rights Total
Net Assets
Balance as of March 31, 2008 119,419 120,771 6,778 423,233 430,011 (12,217) 657,985 9,727 1,393 669,105
Changes during the current year
Cash dividends (42,884) (42,884) (42,884) (42,884)
Net income 63,984 63,984 63,984 63,984
Increase of treasury stock (29,938) (29,938) (29,938)
Disposal of treasury stock (160) (160) 542 381 381
Changes other than stockholders’ equity (NET) (9,663) 778 (8,884)
Total changes during the current year - - - 20,940 20,940 (29,396) (8,456) (9,663) 778 (17,340)
Balance as of March 31, 2009 119,419 120,771 6,778 444,173 450,951 (41,613) 649,529 63 2,172 651,765
Shin-Etsu Chemical Co., Ltd. (4063) Fiscal Year ended March 31, 2009
29
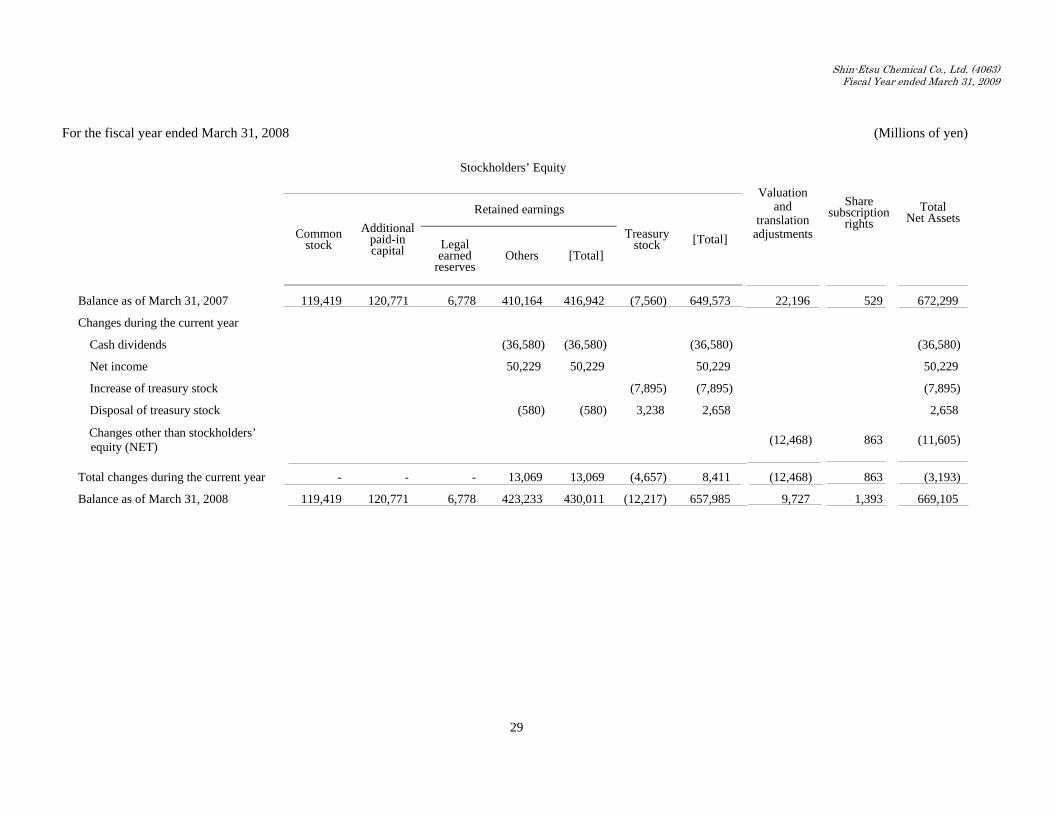
For the fiscal year ended March 31, 2008 (Millions of yen)
Stockholders’ Equity
Retained earnings
Common stock
Additional paid-in capital Legal
earned reserves
Others [Total]
Treasury stock [Total]
Valuation and
translation adjustments
Share subscription
rights Total
Net Assets
Balance as of March 31, 2007 119,419 120,771 6,778 410,164 416,942 (7,560) 649,573 22,196 529 672,299
Changes during the current year
Cash dividends (36,580) (36,580) (36,580) (36,580)
Net income 50,229 50,229 50,229 50,229
Increase of treasury stock (7,895) (7,895) (7,895)
Disposal of treasury stock (580) (580) 3,238 2,658 2,658
Changes other than stockholders’ equity (NET) (12,468) 863 (11,605)
Total changes during the current year - - - 13,069 13,069 (4,657) 8,411 (12,468) 863 (3,193)
Balance as of March 31, 2008 119,419 120,771 6,778 423,233 430,011 (12,217) 657,985 9,727 1,393 669,105
Related Documents