arXiv:astro-ph/0008054v1 2 Aug 2000 Accepted by Astrophysical Journal, August 2, 2000 NEW PULSARS FROM AN ARECIBO DRIFT SCAN SEARCH Andrea N. Lommen 1 , Alex Zepka 12 , Donald C. Backer 1 , Maura McLaughlin 3 , James M. Cordes 3 , Zaven Arzoumanian 4 , Kiriaki Xilouris 5 ABSTRACT We report the discovery of pulsars J0030+0451, J0711+0931, and J1313+0931 that were found in a search of 470 square degrees at 430 MHz using the 305m Arecibo tele- scope. The search has an estimated sensitivity for long period, low dispersion measure, low zenith angle, and high Galactic latitude pulsars of ∼ 1 mJy, comparable to previous Arecibo searches. Spin and astrometric parameters for the three pulsars are presented along with polarimetry at 430 MHz. PSR J0030+0451, a nearby pulsar with a period of 4.8 ms, belongs to the less common category of isolated millisecond pulsars. We have measured significant polarization in PSR J0030+0451 over more than 50% of the period, and use these data for a detailed discussion of its magnetospheric geometry. Scintil- lation observations of PSR J0030+0451 provide an estimate of the plasma turbulence level along the line of sight through the local interstellar medium. Subject headings: surveys — stars: neutron — pulsars: individual (PSR J0030+0451, PSR J0711+0931, PSR J1313+0931) — polarization 1. Introduction Pulsar searches work toward completion of the Galactic inventory of active neutron stars, and provide new tests of both the validity and robustness of emission models and ideas concerning the 1 Astronomy Department & Radio Astronomy Laboratory, University of California, Berkeley, CA 94720, email: [email protected], [email protected] 2 Currently at Cadabra Design Technology, 3031 Tisch Way, Suite 200, San Jose, CA 95128, email: [email protected] 3 Department of Astronomy, Space Sciences Building, Cornell University, Ithaca, NY 14853; [email protected], [email protected] 4 Center for Radiophysics and Space Research, Cornell University, currently at NASA-Goddard Space Flight Center, Mailstop 662.0, Greenbelt, MD 20771, email: [email protected] 5 University of Virginia, Astronomy Department, P.O. Box 3818, Charlottesville, VA 22903, email: [email protected]

Welcome message from author
This document is posted to help you gain knowledge. Please leave a comment to let me know what you think about it! Share it to your friends and learn new things together.
Transcript
arX
iv:a
stro
-ph/
0008
054v
1 2
Aug
200
0
Accepted by Astrophysical Journal, August 2, 2000
NEW PULSARS FROM AN ARECIBO DRIFT SCAN SEARCH
Andrea N. Lommen1, Alex Zepka12, Donald C. Backer1, Maura McLaughlin3, James M. Cordes3,
Zaven Arzoumanian4, Kiriaki Xilouris5
ABSTRACT
We report the discovery of pulsars J0030+0451, J0711+0931, and J1313+0931 that
were found in a search of 470 square degrees at 430 MHz using the 305m Arecibo tele-
scope. The search has an estimated sensitivity for long period, low dispersion measure,
low zenith angle, and high Galactic latitude pulsars of ∼ 1 mJy, comparable to previous
Arecibo searches. Spin and astrometric parameters for the three pulsars are presented
along with polarimetry at 430 MHz. PSR J0030+0451, a nearby pulsar with a period
of 4.8 ms, belongs to the less common category of isolated millisecond pulsars. We have
measured significant polarization in PSR J0030+0451 over more than 50% of the period,
and use these data for a detailed discussion of its magnetospheric geometry. Scintil-
lation observations of PSR J0030+0451 provide an estimate of the plasma turbulence
level along the line of sight through the local interstellar medium.
Subject headings: surveys — stars: neutron — pulsars: individual (PSR J0030+0451,
PSR J0711+0931, PSR J1313+0931) — polarization
1. Introduction
Pulsar searches work toward completion of the Galactic inventory of active neutron stars, and
provide new tests of both the validity and robustness of emission models and ideas concerning the
1Astronomy Department & Radio Astronomy Laboratory, University of California, Berkeley, CA 94720, email:
[email protected], [email protected]
2Currently at Cadabra Design Technology, 3031 Tisch Way, Suite 200, San Jose, CA 95128, email:
3Department of Astronomy, Space Sciences Building, Cornell University, Ithaca, NY 14853;
[email protected], [email protected]
4Center for Radiophysics and Space Research, Cornell University, currently at NASA-Goddard Space Flight
Center, Mailstop 662.0, Greenbelt, MD 20771, email: [email protected]
5University of Virginia, Astronomy Department, P.O. Box 3818, Charlottesville, VA 22903, email:
– 2 –
origin of pulsars. During the time of the Gregorian Dome upgrade at the Arecibo Observatory, a
joint effort by several collaborations was aimed at surveying the sky visible from Arecibo (declina-
tion range roughly −1◦ to 39◦ ) in search of new pulsars. A total of 44 pulsars including 5 MSPs
have been discovered so far by the other institutions (Foster et al. 1995; Camilo et al. 1996; Ray
et al. 1996b). The Berkeley/Cornell effort was divided into two independent areas of the sky, in
which a total of 5 more pulsars have been discovered: 2 are reported by McLaughlin, Arzoumanian,
& Cordes (2000), and 3 are reported here.
This paper presents the discovery of the 9th isolated millisecond pulsar (MSP1) in the disk of
the Galaxy and two additional slow pulsars. We investigate the new pulsars in terms of the Rotating
Vector Model (RVM) (Radhakrishnan & Cooke 1969) and models of core vs. cone emission (Rankin
1983). The new isolated MSP adds to the 8 other known objects in this category that require
disruption of their companions if they achieved millisecond periods through accretion of matter
and angular momentum from a companion star (Bhattacharya & van den Heuvel 1991; Phinney &
Kulkarni 1994; van den Heuvel & Bitzaraki 1995).
We present the details of the search in §2, the confirmation process in §3, and our observations
and the resulting new pulsar timing models in §4. In §5 we present both intensity and polarization
profiles of the new objects and use the results for a detailed study of the magnetospheric geometry
of PSR J0030+0451. In §6 we summarize the results and briefly discuss MSP evolution.
2. Arecibo Drift Search for Pulsars
For the purposes of the joint search effort, the sky was divided into declination strips of 1◦.
The Berkeley/Cornell team was assigned the declinations centered at −0.5◦, 4.5◦, 9.5◦, 14.5◦, 19.5◦,
24.5◦, 29.5◦ and 34.5◦. We are reporting here on a total of 470 square degrees of these strips that
were successfully surveyed with a manageable level of radio frequency interference (RFI) between
1994 October and 1995 February.
During the upgrade construction the azimuth arm was fixed, but observations were still possi-
ble as the sky drifted past the parked receiver. We used the 430-MHz line feed receiver with 8 MHz
bandwidth which was divided by analog filters into 32 channels. The detected powers from orthog-
onally polarized channels were summed and Nyquist sampled at a 4-kHz rate using the ADAGIO
data acquisition system. The observations consisted of long integrations taken with the telescope
at a fixed azimuth and elevation. Because a pulsar transits the telescope beam (10′ half-power
width) in about 30 seconds, we analyzed the data in blocks of 217 time samples (∼ 32s) with each
block sensitive to roughly a 8′ × 10′ region of the sky.
In the first column of Table 1 we list in square degrees the total sky area that was relatively
1By convention ‘MSP’ refers to an object having both a millisecond period (P < 100 ms) and a low period
derivative (P . 10−19 s s−1). Young pulsars with periods of tens of milliseconds are therefore excluded.
– 3 –
RFI-free for each declination strip. We obtained no data for strips centered at 14.5◦ and 19.5◦.
About 41% of the area covered was observed more than once. The area observed in each declination
strip is given in the second column of Table 1. In parentheses are the percentages corresponding
to the fraction of the strip covered in our survey, and the area observed more than once is given in
column 3. There was an abundance of data taken at 9◦ declination as a result of the telescope being
essentially fixed there during the final days before telescope operations were completely halted for
the upgrade.
We processed the data using essentially the same well-tested software from previous pulsar
searches performed with the same instrumentation (Zepka et al. 1996). Our analysis used clusters
of workstations at Berkeley and Cornell. We discarded pulsar candidates from observations in
which strong RFI was detected. The discarded fraction was nearly 30% of the total.
The off-line data processing, which is described more fully in Zepka et al. (1996), consists of
removing trial dispersive delays followed by fast Fourier transforming and harmonic summing to
look for maxima in frequency. The harmonic summing (up to 8 harmonics per candidate) increases
the sensitivity of the search more for long period pulsars, so the sensitivity limit to the shortest
period MSPs will be higher than the 1 mJy we have quoted. See Foster et al. 1995, Ray et al.
1995, and Camilo, Nice, & Taylor 1996 for curves showing typical sensitivity vs. pulse period.
Three candidate pulsars were confirmed in the analysis of the drift scan data. All three were
detected at the same Dispersion Measure (DM) and position on at least 3 days and with a similar
profile on each of the days. In addition to these 3 pulsars we selected the top 22 candidates
detected by the search code which had a significance at least 6σ above the noise and which were
also promising candidates based on either the cleanliness of the data (amount of RFI present) or
their detection on multiple days. These 25 candidates were reobserved in targeted searches during
the confirmation run described in §3.
A rough estimate of the sensitivity of the search is obtained by using the following expression
which gives the minimum detectable flux at 10σ for a pulsar at high Galactic latitude and at the
beam center for zero zenith angle:
Smin =10Tsys
G√
n∆ντ
√
W
P − W= 0.6 mJy, (1)
where G = 17 K Jy−1 is the effective gain of the Arecibo telescope at 430 MHz, n = 2 is the
number of polarizations summed, ∆ν = 8 MHz is the total observing bandwidth, Tsys = 70 K
is the system temperature, τ = 32 s is the integration time, P is the period of the pulsar and
W = 0.1P is a typical pulsar duty cycle, including effects of dispersion smearing within the channel
bandwidth and scattering. The minimum flux increases monotonically with zenith angle, which
means that for declinations away from ∼ 18◦ (the latitude of the Arecibo Observatory) the search is
less sensitive (see Camilo, Nice, & Taylor 1996 for gain vs. zenith angle at the Arecibo Observatory
using the 430-MHz linefeed). The maximum detectable period of the search was set by software to
5s. We estimate the overall sensitivity of the search to be approximately 1 mJy. There is a large

– 4 –
uncertainty in the completeness of the search at the 1 mJy limit owing to the “clean” candidate
selection process, the favoritism given to multiply observed candidates and to high numbers of
harmonics, and the systematic effects related to zenith angle.
In addition, we detected the previously known pulsars J0621+1002 (28ms), B0626+24 (0.48s),
J1022+1001 (16ms), B1541+09 (0.75s), B1633+24 (0.49s), B1726−00 (0.38s) and J2222+2923
(0.28s), the first 6 of which have flux densities of 7, 27, 14, 54, 9, and 10 mJy respectively, while
the flux of J2222+2923 is unknown. The following pulsars were missed, i.e. their positions are in
a region that was searched at least once and we did not detect them: J0051+04 (0.36s), J0533+04
(0.96s), J1834−0010 (0.52s), J1913+0935 (1.2s), and J1926+0431 (1.1s). The fluxes of the last
three are 5, 22, and 3 mJy, respectively, while those of the first two are unknown. The new pulsars
have flux densities of 2 to 8 mJy as reported below.
One measure of the sensitivity of a search is the total number of pulsars, new and previously
known, detected per area. Our search has similar sensitivity to the 3 other declination strip surveys
(Ray et al. 1996a; Foster et al. 1995; Camilo et al. 1996), which had a detection rate ranging from 1
pulsar per 36 to 46 sq. deg., with an average detection rate of 1 pulsar per 41 sq. deg. We detected
1 pulsar per 47 sq. deg.
3. Confirmation of Pulsar Candidates
In 1997 December the Arecibo Observatory was just seeing first light after the upgrade. Our
initial observation made use of the 430-MHz line-feed receiver on Carriage House 1, the same
system used in the drift search. The entire platform was higher than normal which led to a
pointing uncertainty of about 0.5′ and a shift in the center frequency of the 430-MHz line-feed to
433 MHz. With the telescope in this state we made our confirmation run of the 25 candidates from
our search. For each of the 25 candidates we took a 30-minute time-series data set using the Penn
State Pulsar Machine which has 128 channels covering 8 MHz of bandwidth and uses a sample time
of 80 µs (Foster et al. 1995).
Of the 25 candidate pulsars gleaned from our search, only the ones detected on multiple
days were confirmed: J0030+0451 (4.8ms), J0711+0931 (2.4s), and J1313+0933 (0.85s). PSR
J0030+0451 was also detected independently by D’Amico (2000). A fourth candidate which had
been seen on multiple days of the search (J0814+09, 0.65s) was not confirmed in the 1997 De-
cember observations discussed, and has not been confirmed thus far. We looked for each of the
remaining candidates on at least one other night, and in most cases two nights, without detecting
any additional pulsars.

– 5 –
4. Timing Models for the New Pulsars
Follow up observations of the 3 new pulsars were conducted over a period of 2.3 years from
1997 December through 2000 March at the Arecibo Observatory using the Arecibo-Berkeley Pulsar
Processor. This signal processor provides coherent dispersion removal within each of 32 channels;
see Backer et al. (1997) for a partial technical description. The dispersion removal is done via
complex convolution of voltage samples in the time domain, using up to 1024 time samples for
each channel for channel bandwidths less than or equal to 1 MHz. For intensity data one can use
up to 3.6-MHz bandwidth per channel, making available 112-MHz overall bandwidth. Full Stokes
parameters can be acquired for channel bandwidths up to 0.875 MHz.
The timing data were cross correlated with a template, and the resulting TOAs analyzed using
the TEMPO software package2. Table 2 provides spin, astrometric and other parameters for each
of the 3 new pulsars. Finding the timing solution was challenging. Though we have more than 2
years of data on each pulsar, the time series are sparsely sampled. For PSR J0711+0931 we have
7 independent epochs of data, for J1313+0931 we have 5, and for PSR J0030+0451 we have 9,
an epoch being defined by data separated from other data by two weeks or more. However, there
are several epochs for each object, in which we have three or more days of data spread over a
week. These epochs were critical for finding an overall timing solution because we obtain a phase
connected solution within the epoch, i.e. a period, P , and apparent period derivative for that
epoch, P ′. P ′ differs from the intrinsic period derivative owing primarily to ∼ 1′ position errors.
Connecting the P and P ′ from different epochs then required finding this position offset, a simple
task of fitting a sine wave to P vs. epoch, whose derivative must be P ′ vs. epoch. Having found
the position in this manner to within ∼ 1′′, we were then able to phase connect the entire data set
and fit for the timing parameters shown in Table 2.
The root mean square (RMS) of the timing residuals quoted in Table 2 are from fits to the
combined 430-MHz and 1.4-GHz data sets. The uncertainties in Right Ascension, Declination, P ,
and P , are estimated by doubling the errors given by TEMPO, an ad hoc procedure that attempts
to account for timing noise, if any, and other nonrandom sources of error in the fits.
The P and P for PSR J0030+0451, 4.8 ms and 1 ×10⁻²⁰ s s−1 respectively, are near the
“death line”3 of the MSP distribution (see §6 for further discussion). The P and P of the two slow
pulsars fall centrally in the distribution of slow pulsars. PSR J0711+0931 is close to the plane of
the Galaxy, while the other two are out of the plane. The 430-MHz luminosity of PSR J0030+0451
contends with two other pulsars for the lowest luminosity of the known MSPs: PSRs J1744-1134
and J2124-3358 at 0.4 ± 0.2 mJy kpc2 (Bailes et al. 1997).
PSR J0030+0451 is the 4th closest known MSP, and is potentially one of the most observable
2http://pulsar.princeton.edu/tempo
3See, e.g., Lorimer (1999) and Zhang, Harding, & Muslimov (2000) for discussions on the pulsar death line.
– 6 –
MSPs as an X-ray source. There is evidence that X-ray flux scales as ED2 ∝ P
P 3D2 , where E is the
energy loss rate, and D is the distance to the pulsar (Becker & Truemper 1997). By this relation
PSR J0030+0451 is expected to be the second brightest MSP in X-rays. Becker et al. (2000)
report an X-ray detection using ROSAT. PSR J0030+0451 is the 11th MSP detected in X-rays and
displays an X-ray profile similar to the radio profile.
We were able to fit for the proper motion of PSR J0030+0451 ( µα = −20± 13 mas yr−1 and
µδ = 32 ± 31 mas yr−1), but this has limited significance owing to the two remaining degrees of
freedom (9 epochs minus 7 free parameters including phase). The fit is actually more meaningful
for the upper limit of 70 mas yr−1 that it places on the proper motion. Additionally, the measured
P places an upper limit on the transverse velocity of the pulsar via the Shklovskii effect (Shklovskii
1970; Camilo, Thorsett, & Kulkarni 1994). In the case of PSR J0030+0451 the Shklovskii limit is
60 mas yr−1, similar to the upper limit from the proper motion fit. A typical space velocity for a
recycled pulsar is 80 km s−1 (Cordes & Chernoff 1997), which corresponds to about 75 mas yr−1
for PSR J0030+0451 at a distance of 230 pc. Therefore most of the pulsar’s apparent P may be
due to its proper motion.
5. Profiles: Intensity and Polarization
In addition to total intensity measurements of pulse profiles at 430-MHz and 1.4-GHz obtained
during timing programs, polarization observations were made in 1998 June at the Arecibo Observa-
tory with the 430 MHz line-feed receiver on Carriage House 1. See Sallmen (1998) for information
on techniques employed. The data were not corrected for instrumental polarization, which would
at worst convert 10% of linear power into circular power (Weisberg, Sellgren, & Rankin 1979;
Stinebring et al. 1984). Relative phase between the two circular polarizations was measured by
injecting a linearly polarized noise source into the receiver after the feed. The raw polarization
data (orthogonal circular polarizations) were converted to absolute flux units using the standard
bootstrap calibration method of determining the flux of a pulsed noise source by comparison with
an unpolarized standard continuum source, and then calibrating the pulsar flux using the flux of
the pulsed noise source. For standard flux calibrators at 430 MHz and 1.4 GHz we used nearby
sources PKS 0829+18 (0.71 Jy at 410 MHz, Wright & Otrupcek 1990) and J0149+0555 (0.91 Jy
at 1420 MHz, Condon et al. 1998).
5.1. PSR J0711+0531
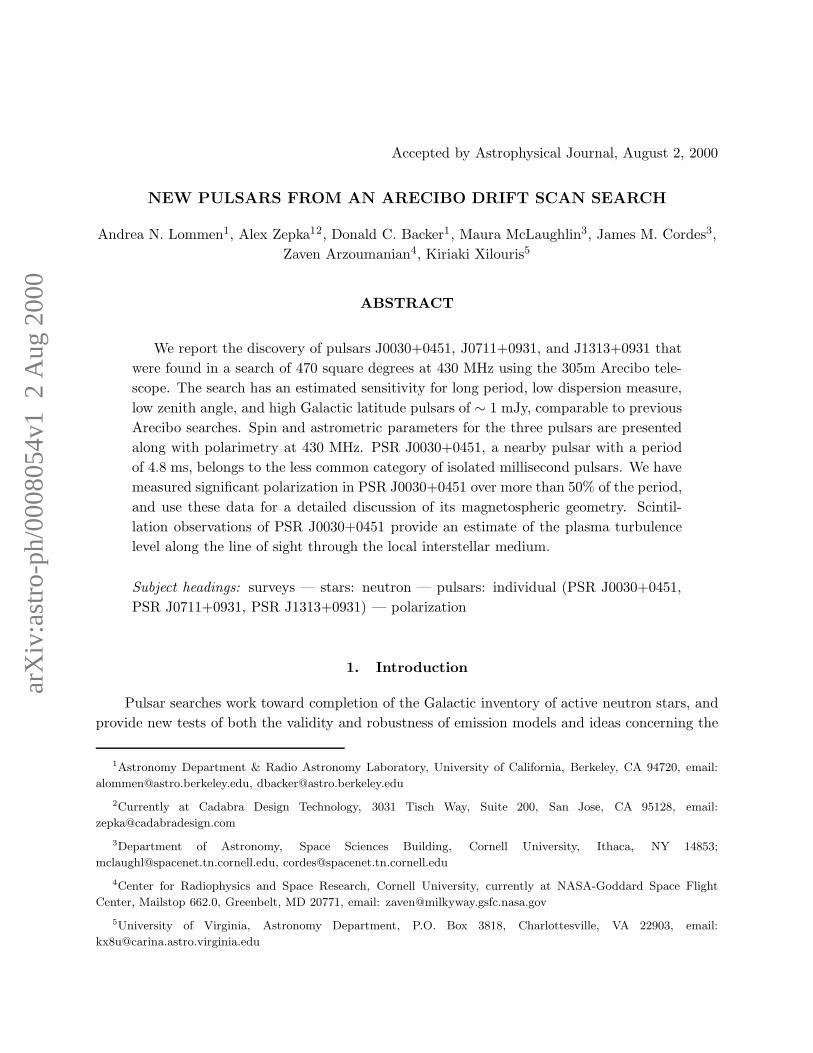
PSR J0711+0931 is a slow pulsar with P=1.2 s that is close to the Galactic plane (b =8.8◦)
and at a distance of ∼ 2.5 kpc which is calculated from the DM using the model of Taylor &
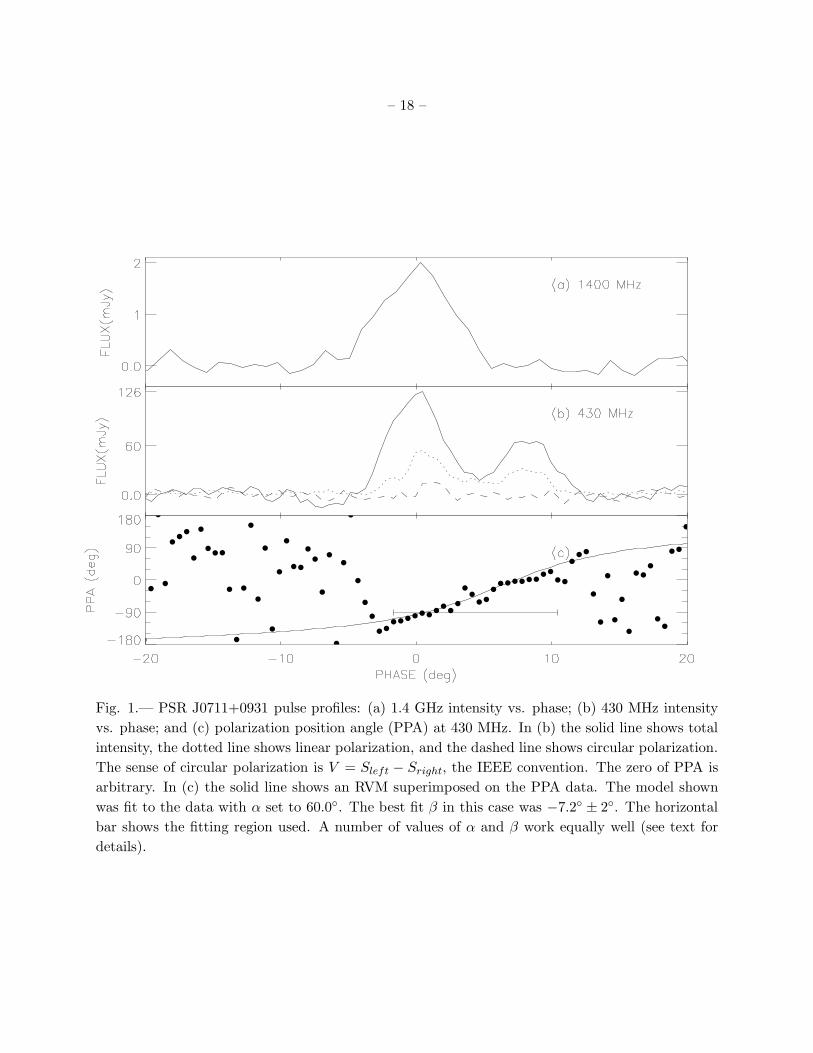
Cordes (1993). At 430 MHz this pulsar displays two components, while at 1.4 GHz there is a single
component (Fig. 1). The bifurcation of component structure as frequency is decreased is indicative
– 7 –
of “conal” emission (Rankin 1983). However our data are not sufficient to determine whether the
peak actually bifurcates, or whether a new component becomes visible at lower frequencies. Better
frequency coverage between 430 MHz and 1.4 GHz is required to make this determination. The
DM quoted in Table 2 is calculated by lining up the single peak of the 1.4-GHz template profile
with the main peak of the 430-MHz template profile. The small dip in intensity just before the
peak is a real-time signal processing error that appeared in our data around the time these data
were taken. This dip is also visible in Figure 2 (PSR J1313+0931), and does not represent any
phenomenon intrinsic to the pulsar.
The polarization position angle swing in PSR J0711+0931 is fit well by the rotating vector
model (RVM), but due to the limited extent of significant polarization in this profile, there is no
unique determination of α, the dipole magnetic field inclination angle with respect to the rotation
axis, and β, the separation of the line of sight with respect to the magnetic axis at closest approach.
We show a likely RVM in Figure 1 that results from setting α = 60.0◦, the a priori most likely
inclination angle, and then finding the best-fit value of β which is 7.2◦ ± 2.0◦. The data are fit
equally well with any α and β with equivalent sin(α)/ sin(β), the steepest slope of the PPA swing.
The center of symmetry of the fitted RVM falls between the two 430-MHz peaks, but mostly by
virtue of that being the center of the available polarization data. This pulsar falls on the long-
period, small spin-down end of the pulsar population, which is where most of the conal-profile
(single and double) pulsars are found (Rankin 1983).
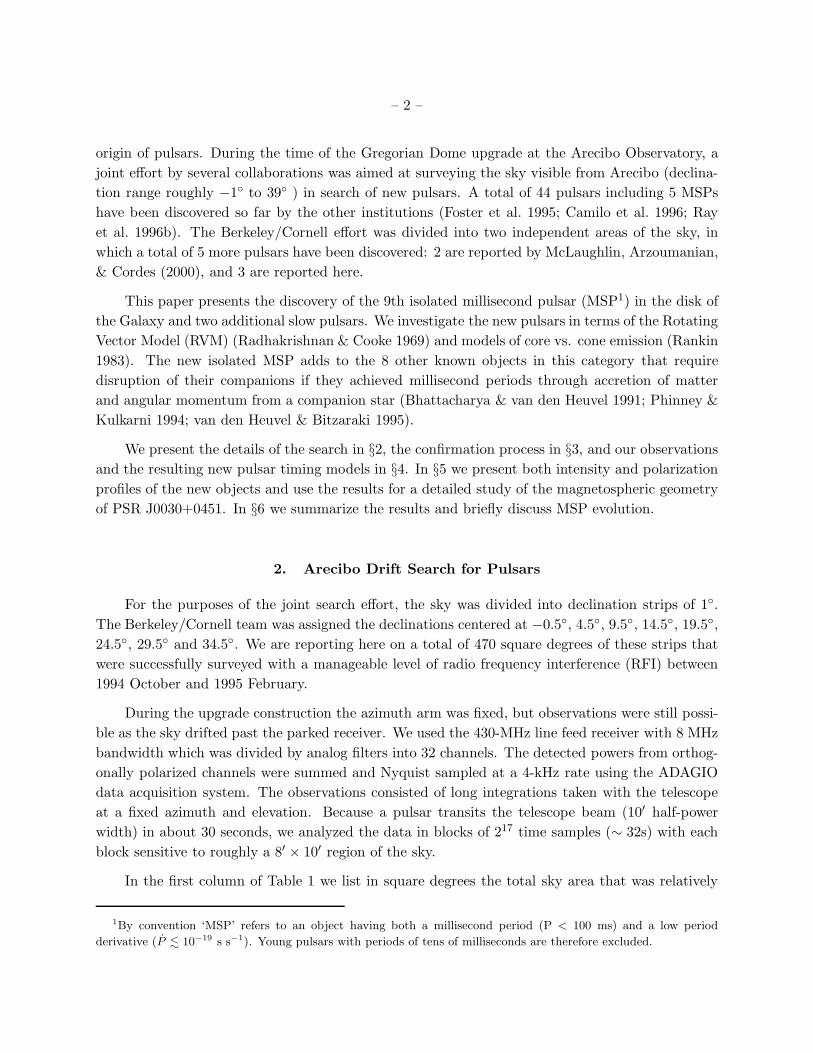
5.2. PSR J1313+0931
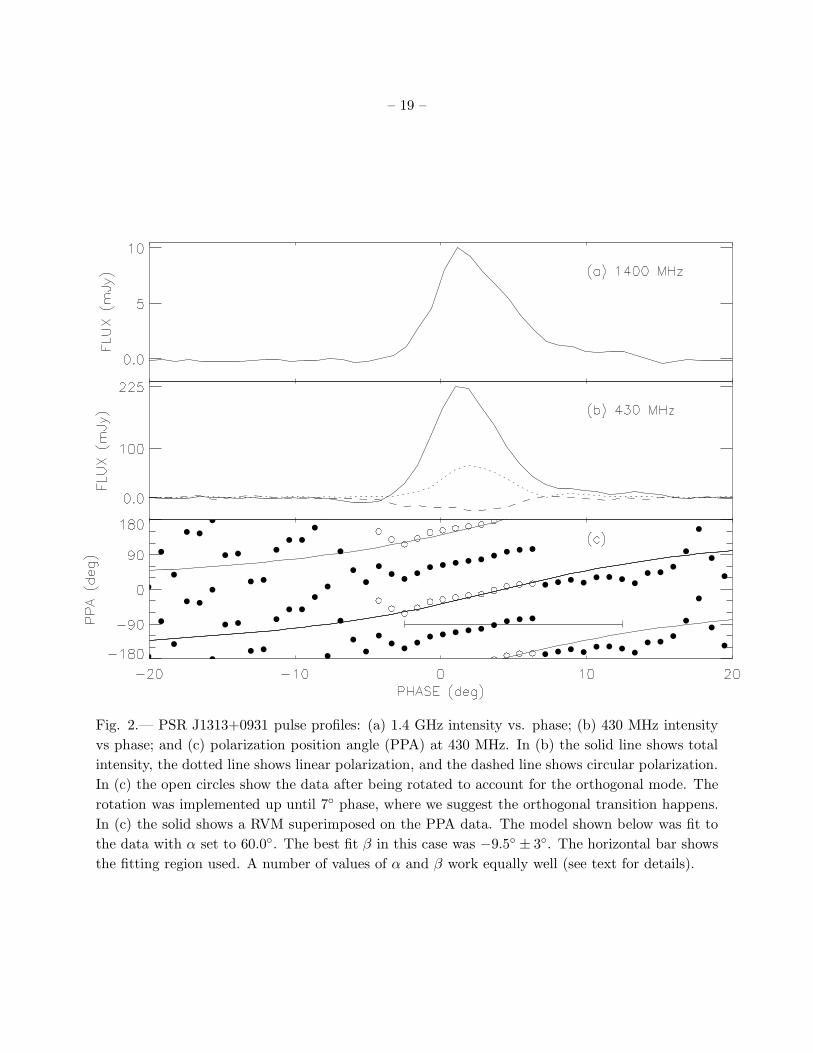
PSR J1313+0931 is a single-peaked pulsar with P=0.85 s. The pulse peak is asymmetric, with
a FWHM of approximately 6◦ at both 1.4 GHz and 430 MHz . The polarization data show a clear
position angle sweep through the main pulse peak (Fig. 2) with a 90◦ discontinuous transition,
indicative of an “orthogonal mode” (suggested rotation shown with open circles). Setting α to
60.0◦, β fits to −9.5◦ ± 3.0◦ as shown in the figure, but the data are fit equally well with any α and
β where the slope sin(α)/ sin(β) is the same.
We note that in addition to the presence of extended emission on the trailing side of the pulse,
the center of the polarized emission falls toward the trailing edge of the main pulse. These char-
acteristics imply that this profile in fact represents a double-peak with the second peak suppressed
in intensity compared to the first. Lyne & Manchester (1988) note a tendency for the leading
component to be the stronger of the two, and suggest that the emission process is somehow more
effective at the leading edge of the polar cap. We see this effect in PSR J0711+0931 and possibly
PSR J0030+0451 as well (see §5.1 and §5.4).
– 8 –
5.3. Millisecond Pulsar J0030+0451
The pulse profiles of PSR J0030+0451 at 430 MHz and 1.4 GHz are presented in Figure 3
to show the evolution of the pulse profile with frequency. A pulsar displaying an interpulse like
PSR J0030+0451 has two distinct possible geometries: nearly aligned, with the interpulse resulting
from the second crossing of a wide-angle hollow “cone” of radiation, or orthogonal with the two
emission regions coming from opposite poles (Rankin 1983; Lyne & Manchester 1988). The question
of the basic geometry of interpulse pulsars has been debated extensively (Rankin 1983; Lyne &
Manchester 1988), with most interpulse MSPs exhibiting qualities of both orthogonal and aligned
rotators (see, e.g. Xilouris et al. 1998). Knowing which model was correct for each pulsar would
greatly enhance our knowledge of the geometry of the underlying emission geometry. The simplest
test of geometry is that if the pulse-interpulse separation changes with frequency we suspect we
are seeing a single cone of emission, with a frequency dependent emission height. Unfortunately
this test is not possible with PSR J0030+0451 because both the pulse and interpulse are made of
at least two components whose positions in frequency cannot be identified using our two-frequency
data due to the complexity of the pulse shape.
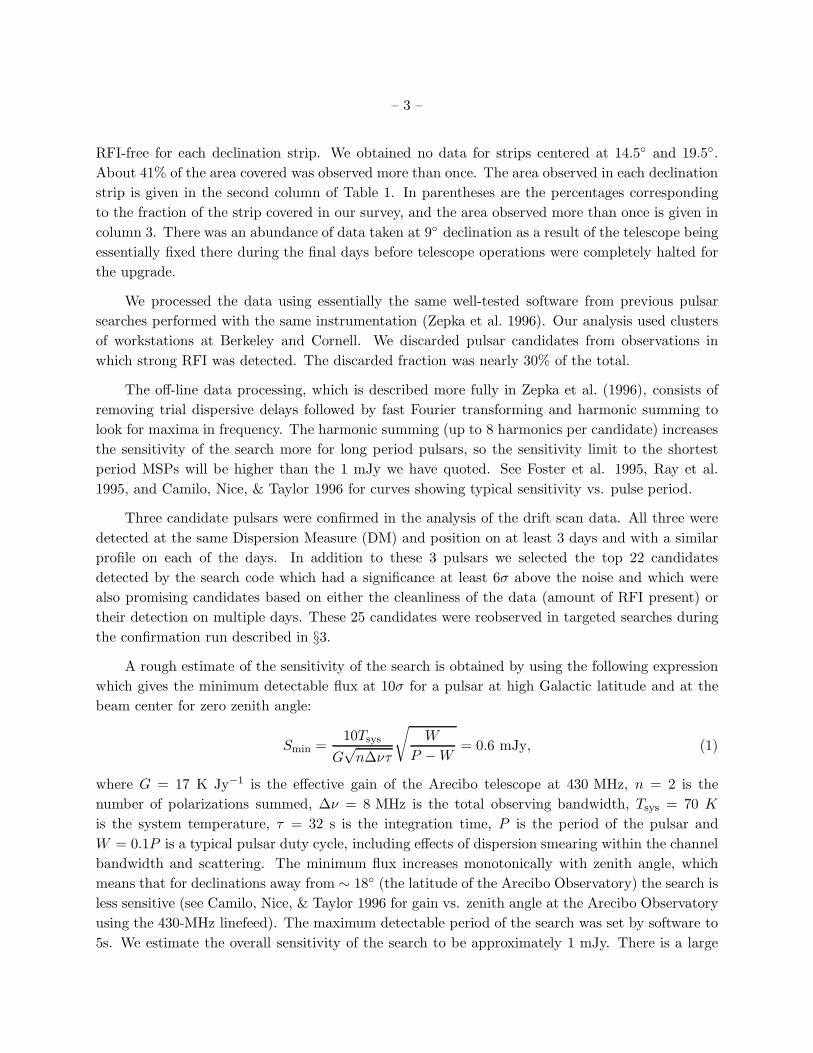
In an attempt to quantify the evolution of the profile with frequency, we fitted the 1.4-GHz
average profile to a 6-Gaussian-component model using the software of Kramer et al. (1994) and
Kramer (1994). The Gaussian parameters of these components are given in Table 3. The amplitude
of component 2 has been set to 1.0 arbitrarily and all other component amplitudes are measured
relative to component 2. The components chosen are not uniquely determined by the data, but
are chosen in order to study the dependence of profile shape on frequency. For example, there is a
small “bump” of emission beginning at a phase of ∼ 350◦ in Figure 3a, which we did not address
in this fitting process. After fitting the 1.4-GHz profile we fit the 430-MHz profile (shown in Fig.
3b) by holding the positions and widths of each of these 1.4-GHz components constant and varying
only amplitudes. Some features of the 430-MHz profile are left unmodeled under this scheme. The
largest discrepancy is at the edge of the main peak located at ∼ 70◦. This discrepancy could be
eliminated by shifting the position of component 1 earlier in phase. This apparent spreading out of
the components as we go to lower frequency suggests that some of this emission may be “conal”.
MSPs are thought to have possibly complex magnetic field topologies from their history of
accretion (Ruderman 1991). Furthermore the work of Xilouris et al. (1998) suggests that pulsars
with compact light cylinders are more likely to exhibit abnormal profile evolution with respect to the
Rankin (1983) model. PSR J0030+0451 does indeed have a relatively small light cylinder radius
(∼ 230 km) and a complex field topology even among MSPs as measured by the total number
of Gaussian components required to model its profile. PSR J0030+0451 requires 6 components
compared to the average for MSPs, 4.2 ± 0.4, measured by Kramer et al. (1998), hereafter K98.
We also calculate the 10% and 50% widths of the main pulse for comparison with the table of
pulse widths for MSPs from K98. Note that we let all 18 parameters vary at both 430 MHz and
1.4 GHz in order to do this calculation. The 10% and 50% widths at 1.4 GHz are 64◦ ± 1◦ and

– 9 –
48◦ ± 1◦ respectively. These numbers fall in the middle of the distribution for MSPs shown in K98.
At 430 MHz the 10% and 50% widths are 74◦ ± 5◦ and 54◦ ± 5◦ respectively.
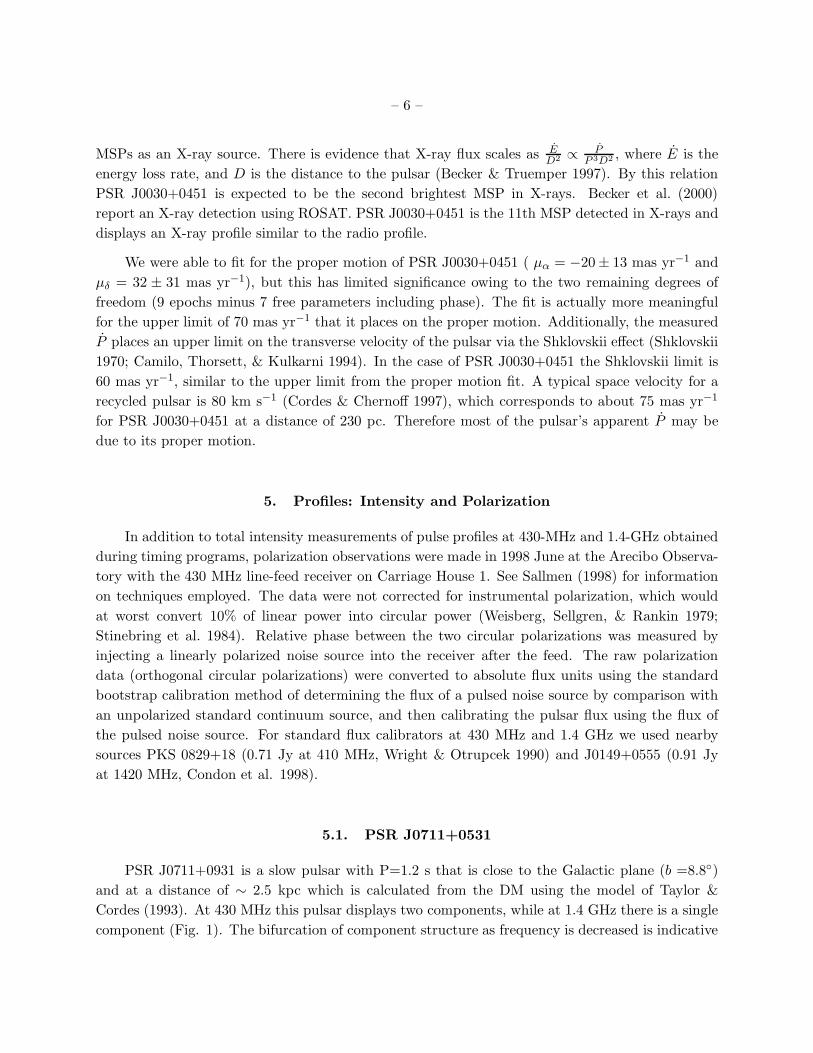
5.4. Polarimetry and Geometry of MSP J0030+0451
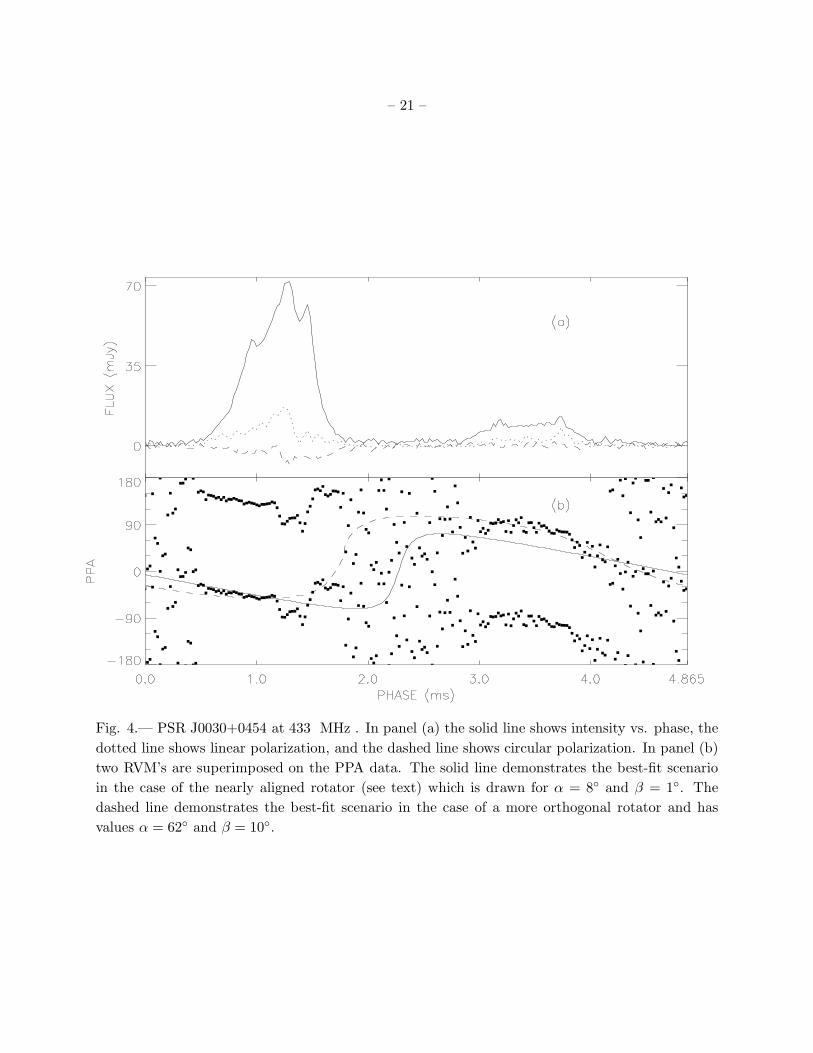
The large duty cycle of PSR J0030+0451 with both main pulse and interpulse emission is a
common characteristic of MSPs. The availability of polarization information over a wide range of
phases (see Fig. 4) in theory allows an accurate determination of the magnetic field inclination angle
α. Of particular interest is the measurable polarization position angle (PPA) at the trailing edge
of the interpulse (from ∼4.0 ms to about ∼4.4 ms in phase in Fig. 4b) in a region where emission
is at its minimum. (Note that a constant offset, equal to the level of emission from 4.5 to 4.9 and
0.0 to 0.2 ms of phase, has been subtracted from these data in each of the 4 Stokes parameters)
Either the emission from this region is nearly 100% linearly polarized or in subtracting a constant
offset from our data we have subtracted off what is significant baseline emission from this pulsar.
Using polarimetric information, it is possible in some cases to determine whether observed
emission is ‘core’ or ‘cone’ emission, thereby giving additional clues about the geometry. Rankin
(1983) (also see Rankin 1993) identifies several properties of core emission that are present in
component 3: (1) the steepest (either positive or negative) slope in polarization position angle is
at the phase of components 3 and 4; (2) component 3 is significantly linearly polarized; and (3) the
circular polarization, although very weak, changes sign underneath component 3. In the following
paragraphs we look to RVM fits to the observed PPA profile for further information.
Two possible RVMs are shown in Figure 4, the first with α=8◦ and the second with α=62◦.
The first thing to note is that neither case is particularly appealing. Moreover there is no RVM
that would fit the jaggedness of the PPA sweep near the main pulse peak. We consider the nearly
aligned case first, shown with parameters α=8◦ and β=1◦ . Actually fitting to the data returns a
range of parameters which depend on initial values, so this is not a fit to the data but rather an
example of a plausible model. From this model we expect the emission to be primarily conal and
thus the center of symmetry actually should be at a flux minimum. We therefore place the center
of symmetry of the model, which represents the magnetic pole, in between the pulse and interpulse.
The pulse and the interpulse represent two crossings of a single very wide “cone” of emission, and
therefore we expect that all the components will display properties of conal emission, which they
do not (see preceding paragraph).
In the second case we attempted to make α as large as possible while still providing a reasonable
fit to the data. The model shown has α=62◦ and β=10◦ (see Fig. 4). This model places the center
of symmetry of the RVM at the trailing edge of the main pulse near to, but not coincident with,
peaks 3 and 4. This is consistent with the RVM’s prediction of core emission from this location.
Specifically we expect the center of symmetry of the PPA is at the phase of the core emission
with any cone emission falling on either side of it in phase. We in fact only see emission on the

– 10 –
leading edge of this core emission (i.e. we see no emission to the right of component 4, only to
the left). Perhaps we only see one-half of the “cone”, a situation discussed earlier in the case of
PSR J1313+0931 (see §5.2). Alternatively Hibschman & Arons (2000) show that corrections to
the simple RVM, resulting from the effects of a Goldreich-Julian current on the magnetic field and
aberration, will produce various asymmetries in the polarization sweep that we could be seeing.
We conclude that the polarimetry data suggest a large α and that we are likely seeing two
poles.
5.5. MSP J0030+0451 and the Local ISM
This pulsar allows new measurements of the physical state of the ionized component of the
local ISM. PSR J0030+0451 lies roughly in the middle of the quadrant of the Galaxy from l = 90◦
to l = 180◦ which is devoid of any pulsars with independent distance estimates. Ultimately we will
able to determine the mean density using the trigonometric parallax derived from ongoing timing
measurements. The result can be compared with that from other pulsars within 1 kpc of the sun
(Toscano et al. 1999 and references therein) to improve the 3D map of the local ionized gas.
The diffractive scintillation parameters for J0030+0451 provide an estimate of the turbulent
state of the local ISM on scales of 1010 cm which can be compared to results of recent studies of
nearby pulsars (Bhat, Gupta, & Rao 1998; Phillips & Clegg 1992; Rickett, Coles, & Markkanen
2000). We expect that J0030+0451 will exhibit weak scattering at 1.4 GHz given its low DM of
4.3328 ± 0.0002 cm−3pc. Backer (1975) estimates the critical frequency at which the scintillation
modulation index drops below unity to be 2.4 GHz for this DM, although there are significant
variations along different paths through comparable column densities. Our observations indicate
that J0030+0451 is indeed weakly scattered at 1.4 GHz. In order to measure the scintillation
modulation index we inspect the variation from epoch to epoch of the signal to noise ratio (S/N)
of our 1.4-GHz profiles. This is a reliable measure of the modulation index owing to the stability of
the 1.4-GHz receiver and observing conditions. Our dominant concern in using S/N as a measure
of flux variability is the possible correlation of S/N with zenith angle. However, a plot of S/N vs
zenith angle for all of the 3-minute average profiles shows no correlation, and indeed the documents
characterizing the latest Arecibo upgrade show that the system temperature is expected to be nearly
constant for zenith angle . 19 deg (Taylor & Davis 1986) and the gain is expected to decrease by
2% going from 15◦ to 20◦ in zenith angle 4. We see the signal to noise ratio (S/N) vary from 4 to 13,
with a mean of 10 and a standard deviation of 2.5, yielding an estimate of 0.25 for the scintillation
modulation index. Flux measurements at both the Arecibo Observatory and the VLA are consistent
with this value. At the VLA we obtained two one-hour observations on 1998 February 23 and 26
at 1.4 GHz. Flux transfer from primary and secondary calibrators yielded fluxes of 1.0 ± 0.1 mJy
4also http://www.naic.edu/techinfo/teltech/statisti.htm

– 11 –
and 0.7 ± 0.1 mJy. The typical flux we obtain from the Arecibo observations is 0.6 ± 0.1 mJy at
1.4 GHz. The range of these three values is consistent with our measured scintillation modulation
index of 0.25. This value of the modulation index leads to an estimate of the amplitude of the
electron-density power spectrum, C2n ∼ 1.5 × 10⁻⁴m−20/3, using relation C2 in Rickett, Coles, &
Markkanen (2000).
At 430-MHz we looked for scintillation effects across the 10-MHz band which is divided into 32
channels. In some scans we see a variation by as much as a factor of 3 across the band, but always
monotonically changing across the bandpass. We conclude that the scintillation bandwidth is
greater than, but on the order of 10 MHz. We use this lower bound on the scintillation bandwidth
to estimate an upper bound on C2n . 7 × 10⁻⁵ m−20/3 using relation C3 in Rickett, Coles, &
Markkanen (2000). C2n depends on the pulsar’s distance to the 11/6 power which leads to an
uncertainty in C2n of a factor of 4 in either direction given variations in the local electron density
reported by Toscano et al. (1999). We conclude that C2n along the path the PSR J0030+0451 is
probably in the range between the low values reported by Rickett, Coles, & Markkanen (2000) and
Phillips & Clegg (1992) toward B0809+74 and B09050+08 and the higher values reported by Bhat,
Gupta, & Rao (1998) toward a dozen different objects.
Temporal variations of the DM inform us about perturbations on larger scales of 1014 cm. Our
multifrequency timing observations (4 days of dual frequency observations) allow us to place an
upper limit on the DM gradient of 0.0003 cm−3pc yr−1. This small value is consistent with the
relationship of DM gradient to DM suggested by Backer et al. (1993).
6. Discussion
We have confirmed three new pulsars in a search of the Arecibo sky covering 470 square degrees
with a sensitivity of 1 mJy. The objects are solitary pulsars.
Our polarimetric study of PSR J0030+0451 suggests an orthogonal or nearly orthogonal model
with a large α . Multi-frequency (as opposed to dual-frequency) observations of PSR J0030+0451
are needed to fully assess the component evolution and thereby determine whether it is an orthog-
onal or an aligned rotator.
PSR J0030+0451 provides a useful new probe of the plasma in the local interstellar medium.
Of the approximately dozen MSPs which display interpulses PSRs B1012+5307, B1855+09,
and J2322+2057 (Nicastro et al. 1995; Segelstein et al. 1986; Nice, Taylor, & Fruchter 1993; Xilouris
et al. 1998) bear striking resemblance to PSR J0030+0451: Pulse periods are between 4.8 ms and
5.4 ms and the magnetic fields are between 2.2 ×10⁸ G and 3.2 ×10⁸ G. Each one is thought to
be an orthogonal rotator, and in each case the interpulse increases in amplitude compared to the
main pulse at higher frequency. Xilouris et al. (1998) suggests that the interesting properties of
this group of pulsars are due to a quadrupolar moment of the magnetic field becoming important,

– 12 –
and that outer-gap emission also is visible.
Of the 56 known MSPs in the disk of the Galaxy (Camilo 1999; Edwards 2000; Lyne et al. 2000;
Manchester et al. 2000) PSR J0030+0451 is the 9th solitary MSP (i.e., it is not in a binary system).
These objects present particular requirements on the standard evolutionary scenario of MSPs. If
the neutron star is spun up via accretion by mass transfer from a companion star, the companion
must somehow be obliterated. Various solutions have been proposed such as a common envelope
evolution whereby during the accretion phase, the core of the companion and the neutron star
spiral in and finally collapse into a single star (van den Heuvel & Bitzaraki 1995). Alternatively the
new MSP may evaporate or ablate its companion as is suggested in observations of PSR B1957+20
(Fruchter et al. 1991; Arzoumanian, Fruchter, & Taylor 1994), and PSR B1744−24A (Lyne et al.
1990). Neither of these solutions is manifest in observations, and the evolutionary history of solitary
MSPs remains an unsolved problem.
We wish to thank Michael Kramer for the use of his Gaussian fitting program, and Christophe
Lange for his TOA uncertainty code. We also thank Shauna Sallmen for her expertise in polarimetry
measurements and for use of her software. We are grateful to the Arecibo telescope operators for
running the search observations and for their assistance in the follow-up timing observations. We
thank Alex Wolszczan for use of the Penn State Pulsar Processor, Fernando Camilo for comments
on an earlier version of this manuscript, and Duncan Lorimer and Dan Stinebring for assistance in
observations. Lastly we thank Dick Manchester, the referee, whose comments significantly improved
the manuscript.
– 13 –
REFERENCES
Arzoumanian, Z., Fruchter, A. S., & Taylor, J. H. 1994, ApJ, 426, L85
Backer, D. C. 1975, A&A, 43, 395
Backer, D. C., Hama, S., van Hook, S., & Foster, R. S. 1993, ApJ, 404, 636
Backer, D. C., Dexter, M. R., Zepka, A., Ng, D., Werthimer, D. J., Ray, P. S., & Foster, R. S. 1997,
PASP, 109, 61
Bailes, M., Johnston, S., Bell, J. F., Lorimer, D. R., Stappers, B. W., Manchester, R. N., Lyne,
A. G., Nicastro, L., D’Amico, N., & Gaensler, B. M. 1997, ApJ, 481, 386
Becker, W., & Truemper, J. 1997, A&A, 326, 682
Becker, W., Trumper, J., Lommen, A., & Backer, D. 2000, ApJ, submitted
Bhat, N. D. R., Gupta, Y., & Rao, A. P. 1998, ApJ, 500, 262
Bhattacharya, D., & van den Heuvel, E. P. J. 1991, Phys. Rep., 203, 1
Camilo, F. 1999, In Pulsar Timing, General Relativity and the Internal Structure of Neutron Stars,
ed. Z. Arzoumanian, F. Van der Hooft, & E. P. J. van den Heuvel. (Koninklijke Nederlandse
Akademie van Wetenschappen, Amsterdam), p. 115
Camilo, F., Thorsett, S. E., & Kulkarni, S. R. 1994, ApJ, 421, L15
Camilo, F., Nice, D. J., Shrauner, J. A., & Taylor, J. H. 1996, ApJ, 469, 819
Camilo, F., Nice, D. J., & Taylor, J. H. 1996, ApJ, 461, 812
Condon, J. J., Cotton, W. D., Greisen, E. W., & Yin, Q. F. 1998, AJ, 115, 1693
Cordes, J. M., & Chernoff, D. F. 1997, ApJ, 482, 971
D’Amico, N. 2000, In ASP Conf. Ser. 202, Pulsar Astronomy - 2000 and Beyond, ed. M. Kramer,
N. Wex, & R. Wielebinski, (San Francisco: ASP), p. 27
Edwards, R. T. 2000, In ASP Conf. Ser. 202, Pulsar Astronomy - 2000 and Beyond, ed. M. Kramer,
N. Wex, & R. Wielebinski, (San Francisco: ASP), p. 33
Foster, R. S., Cadwell, B. J., Wolszczan, A., & Anderson, S. B. 1995, ApJ, 454, 826
Fruchter, A., Rupman, G., Bower, G., Convery, M., Goss, W. M., Hankins, T. H., Klein, J. R.,
Nice, D. J., Ryba, M. F., Stinebring, D. R., Taylor, J. H., Thorsett, S. E., & Weisberg, J. M.
1991, ApJ, 351, 642

– 14 –
Hibschman, J. A., & Arons, J. 2000, In ASP Conf. Ser. 202, Pulsar Astronomy - 2000 and Beyond,
ed. M. Kramer, N. Wex, & R. Wielebinski, (San Francisco: ASP), p. 253
Kramer, M. 1994, A&AS, 107, 527
Kramer, M., Wielebinski, R., Jessner, A., Gil, J. A., & Seiradakis, J. H. 1994, A&AS, 107, 515
Kramer, M., Xilouris, K. M., Lorimer, D. R., Doroshenko, O., Jessner, A., Wielebinski, R., Wol-
szczan, A., & Camilo, F. 1998, ApJ, 501, 270
Lorimer, D. R. 1999, To be published in the proceedings of “The Neutron Star - Black Hole
Connection”, June 1999, Elounda, Crete, Astro-ph 9911519
Lyne, A., & Manchester, D. 1988, MNRAS, 234, 477
Lyne, A. G., Johnston, S., Manchester, R. N., Staveley-Smith, L., & D’Amico, N. 1990, Nature,
347, 650
Lyne, A. G., Camilo, F., Manchester, R. N., Bell, J. F., Kaspi, V. M., D’Amico, N., McKay, N.
P. F., Crawford, F., Morris, D. J., Sheppard, D. C., & Stairs, I. H. 2000, MNRAS, 312, 698
Manchester, R. N., Lyne, A. G., Camilo, F., Kaspi, V. M., Stairs, I. H., Crawford, F., Morris,
D. J., Bell, J. F., & D’Amico, N. 2000, In ASP Conf. Ser. 202, Pulsar Astronomy - 2000 and
Beyond, ed. M. Kramer, N. Wex, & R. Wielebinski, (San Francisco: ASP), p. 49
McLaughlin, M., Arzoumanian, Z. A., & Cordes, J. M. 2000, In ASP Conf. Ser. 202, Pulsar
Astronomy - 2000 and Beyond, ed. M. Kramer, N. Wex, & R. Wielebinski, (San Francisco:
ASP), p. 41
Nicastro, L., Lyne, A. G., Lorimer, D. R., Harrison, P. A., Bailes, M., & Skidmore, B. D. 1995,
MNRAS, 273, L68
Nice, D. J., Taylor, J. H., & Fruchter, A. S. 1993, ApJ, 402, L49
Phillips, J. A., & Clegg, A. W. 1992, Nature, 360, 137
Phinney, E., & Kulkarni, S. R. 1994, ARA&A, 32, 591
Radhakrishnan, V., & Cooke, D. J. 1969, ApL, 3, 225
Rankin, J. M. 1983, ApJ, 274, 333
Rankin, J. M. 1993, ApJ, 405, 285
Ray, P., Deich, W., Kulkarni, S., Prince, T., Thorsett, S., Vashist, G., Wolszczan, A., & Backer,
D. 1996a, ApJ, 443, 265
– 15 –
Ray, P., van Kerkwijk, M. H., Kulkarni, S. R., Prince, T. A., Sandhu, J. S., & Nice, D. J. 1996b,
ApJ, 470, 1103
Rickett, B. J., Coles, W. A., & Markkanen, J. 2000, ApJ, 533, 304
Ruderman, M. 1991, ApJ, 366, 261
Sallmen, S. 1998, PhD Thesis, UC Berkeley
Segelstein, D. J., Rawley, L. A., Stinebring, D. R., Fruchter, A. S., & Taylor, J. H. 1986, Nature,
322, 714
Shklovskii, I. 1970, Soviet Astron., 13, 562
Stinebring, D. R., Cordes, J. M., Rankin, J. M., Weisberg, J. M., & Boriakoff, V. 1984, ApJS, 55,
247
Taylor, J. H., & Cordes, J. M. 1993, ApJ, 411, 674
Taylor, J. H., & Davis, M. M., eds. 1986. Proceedings of the Arecibo Upgrading Workshop, National
Astronomy and Ionosphere Center
Toscano, M., Britton, M. C., Manchester, R. N., Bailes, M., Sandhu, J. S., Kulkarni, S. R., &
Anderson, S. B. 1999, ApJ, 523, L171
van den Heuvel, E. P. J., & Bitzaraki, O. 1995, ARA&A, 297, L41
Weisberg, J. M., Sellgren, K., & Rankin, J. M. 1979, NAIC Report, No. 113
Wright, A., & Otrupcek, R., eds. 1990. Parkes Catalog, Australia Telescope National Facility
Xilouris, K. M., Kramer, M., Jessner, A., von Hoensbroech, A., Lorimer, D. R., Wielebinski, R.,
Wolszczan, A., & Camilo, F. 1998, ApJ, 501, 286
Zepka, A., Cordes, J. M., Wasserman, I., & Lundgren, S. C. 1996, ApJ, 456, 305
Zhang, B., Harding, A. K., & Muslimov, A. G. 2000, ApJ, 531, L135
This preprint was prepared with the AAS LATEX macros v5.0.
– 16 –
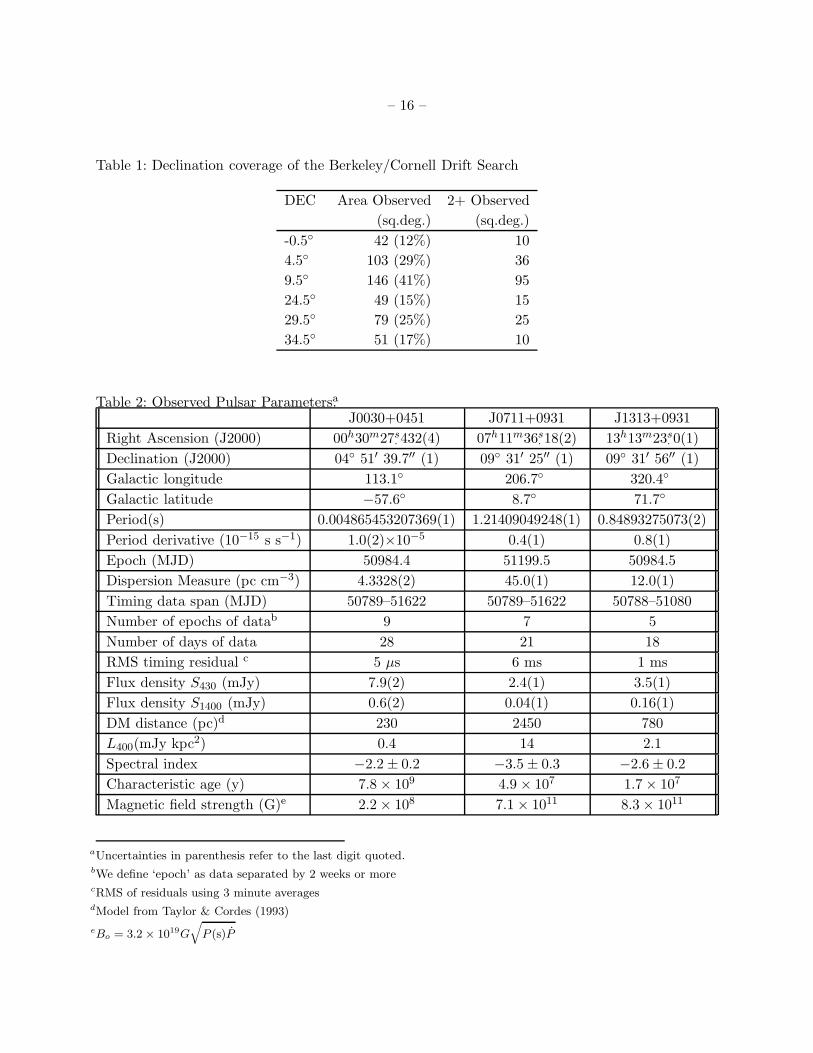
Table 1: Declination coverage of the Berkeley/Cornell Drift Search
DEC Area Observed 2+ Observed
(sq.deg.) (sq.deg.)
-0.5◦ 42 (12%) 10
4.5◦ 103 (29%) 36
9.5◦ 146 (41%) 95
24.5◦ 49 (15%) 15
29.5◦ 79 (25%) 25
34.5◦ 51 (17%) 10
Table 2: Observed Pulsar Parametersa.J0030+0451 J0711+0931 J1313+0931
Right Ascension (J2000) 00h30m27s·432(4) 07h11m36s
·18(2) 13h13m23s
·0(1)
Declination (J2000) 04◦ 51′ 39.7′′ (1) 09◦ 31′ 25′′ (1) 09◦ 31′ 56′′ (1)
Galactic longitude 113.1◦ 206.7◦ 320.4◦
Galactic latitude −57.6◦ 8.7◦ 71.7◦
Period(s) 0.004865453207369(1) 1.21409049248(1) 0.84893275073(2)
Period derivative (10−15 s s−1) 1.0(2)×10−5 0.4(1) 0.8(1)
Epoch (MJD) 50984.4 51199.5 50984.5
Dispersion Measure (pc cm−3) 4.3328(2) 45.0(1) 12.0(1)
Timing data span (MJD) 50789–51622 50789–51622 50788–51080
Number of epochs of datab 9 7 5
Number of days of data 28 21 18
RMS timing residual c 5 µs 6 ms 1 ms
Flux density S430 (mJy) 7.9(2) 2.4(1) 3.5(1)
Flux density S1400 (mJy) 0.6(2) 0.04(1) 0.16(1)
DM distance (pc)d 230 2450 780
L400(mJy kpc2) 0.4 14 2.1
Spectral index −2.2 ± 0.2 −3.5 ± 0.3 −2.6 ± 0.2
Characteristic age (y) 7.8 × 10⁹ 4.9 × 10⁷ 1.7 × 10⁷
Magnetic field strength (G)e 2.2 × 10⁸ 7.1 × 10¹¹ 8.3 × 10¹¹
aUncertainties in parenthesis refer to the last digit quoted.bWe define ‘epoch’ as data separated by 2 weeks or morecRMS of residuals using 3 minute averagesdModel from Taylor & Cordes (1993)
eBo = 3.2× 10¹⁹
G
√
P (s)P

– 17 –
Table 3: Gaussian Component Parameters of PSR J0030+0451.
Peak # 1 2 3 4 5 6
Center (deg) 78.7 88.1 95.9 107.9 253.1 271.5
Width (deg) 16.0 3.9 5.2 7.0 32.8 12.2
Amplitude (430 MHz) 1.95 1.00 2.35 2.62 0.363 0.162
Amplitude (1.4 GHz) 1.15 1.00 1.25 1.67 0.311 0.444
– 18 –
Fig. 1.— PSR J0711+0931 pulse profiles: (a) 1.4 GHz intensity vs. phase; (b) 430 MHz intensity
vs. phase; and (c) polarization position angle (PPA) at 430 MHz. In (b) the solid line shows total
intensity, the dotted line shows linear polarization, and the dashed line shows circular polarization.
The sense of circular polarization is V = Sleft − Sright, the IEEE convention. The zero of PPA is
arbitrary. In (c) the solid line shows an RVM superimposed on the PPA data. The model shown
was fit to the data with α set to 60.0◦. The best fit β in this case was −7.2◦ ± 2◦. The horizontal
bar shows the fitting region used. A number of values of α and β work equally well (see text for
details).
– 19 –
Fig. 2.— PSR J1313+0931 pulse profiles: (a) 1.4 GHz intensity vs. phase; (b) 430 MHz intensity
vs phase; and (c) polarization position angle (PPA) at 430 MHz. In (b) the solid line shows total
intensity, the dotted line shows linear polarization, and the dashed line shows circular polarization.
In (c) the open circles show the data after being rotated to account for the orthogonal mode. The
rotation was implemented up until 7◦ phase, where we suggest the orthogonal transition happens.
In (c) the solid shows a RVM superimposed on the PPA data. The model shown below was fit to
the data with α set to 60.0◦. The best fit β in this case was −9.5◦ ± 3◦. The horizontal bar shows
the fitting region used. A number of values of α and β work equally well (see text for details).

– 20 –
Fig. 3.— Decomposition of PSR J0030+0454 intensity profile into 6 components: (a) 1.4 GHz
and (b) 430 MHz . The best-fit Gaussian components at 1.4 GHz were only allowed to vary in
amplitude in order to fit the 430 MHz profile. See text and Table 3 for details.
– 21 –
Fig. 4.— PSR J0030+0454 at 433 MHz . In panel (a) the solid line shows intensity vs. phase, the
dotted line shows linear polarization, and the dashed line shows circular polarization. In panel (b)
two RVM’s are superimposed on the PPA data. The solid line demonstrates the best-fit scenario
in the case of the nearly aligned rotator (see text) which is drawn for α = 8◦ and β = 1◦. The
dashed line demonstrates the best-fit scenario in the case of a more orthogonal rotator and has
values α = 62◦ and β = 10◦.
Related Documents