Eur Radiol (2008) 18: 2901–2911 DOI 10.1007/s00330-008-1079-6 MAGNETIC RESONANCE Qiang Yue Tomonori Isobe Yasushi Shibata Izumi Anno Hiraku Kawamura Youhei Yamamoto Shingo Takano Akira Matsumura Received: 27 March 2008 Revised: 4 May 2008 Accepted: 9 May 2008 Published online: 19 July 2008 # European Society of Radiology 2008 New observations concerning the interpretation of magnetic resonance spectroscopy of meningioma Abstract This study was aimed to clarify some ambiguities in the inter- pretation of proton magnetic reso- nance spectroscopy (1H-MRS) of meningiomas. The cases of 31 men- ingioma patients (27 benign and 4 nonbenign meningiomas) that under- went single-voxel 1H-MRS (PRESS sequence, TR/TE=2,000 ms/68, 136, 272 ms) were retrospectively ana- lyzed. To verify the findings of in-vivo study, phantoms were measured, and pathological sections of 11 patients were reviewed. All meningiomas demonstrated increased choline and decreased creatine, except for a lipo- matous meningioma that only dis- played a prominent lipid (Lip) peak. Alanine (Ala) and lactate (Lac) coex- isted in eight cases, indicating an alternative pathway of energy metab- olism in meningiomas. They partially overlapped with each other and dem- onstrated a triplet-like spectral pattern, which was consistent with phantom study. Glutamine/glutamate (Glx) was helpful for the recognition of menin- gioma when Ala was absent. N-acetyl compounds(NACs) were observed in nine cases whose voxels were com- pletely limited within the tumors, indicating that meningiomas might have endogenous NACs. Lac was indicative of an aggressive meningio- ma, although not always a nonbenign one. Lip not only represented micro- necrosis in nonbenign meningiomas, but also reflected microcystic changes or fatty degeneration in benign me- ningiomas. 1H-MRS reflects some distinctive biochemical and patholog- ical changes of meningiomas that might be misinterpreted. Keywords Meningioma . Proton magnetic resonance spectroscopy . Phantom . Pathology Introduction As the most common tumor arising from meninges, meningioma accounts for approximately 25% of all primary intracranial tumors [1]. Proton magnetic resonance spec- troscopy (1H-MRS) is considered to be useful for the diagnosis of meningiomas whose radiological appearance is atypical [2, 3] and may also play a role in the evaluation of the malignant potential [4, 5]. Until now the spectral pattern of meningiomas has been well discussed in the literature. However, controversy exists in several aspects: (1) Alanine (Ala) is considered as the maker of meningioma [3, 6–8], but how can the fact that Ala is not detected in some meningiomas be interpreted? And when Ala is absent, Grant: This study was supported by the Japan-China Sasakawa Medical Fellowship (Nippon Foundation, Japan) Q. Yue . Y. Shibata . H. Kawamura . Y. Yamamoto . S. Takano . A. Matsumura (*) Department of Neurosurgery, Institute of Clinical Medicine, University of Tsukuba, 1–1–1 Tennodai, Tsukuba Science City, Ibaraki, 305–8575, Japan e-mail: [email protected] Tel.: +81-298-533220 Fax: +81-298-533214 Q. Yue Huaxi MR Research Center, Department of Radiology, West China Hospital of Sichuan University, Chengdu, 610041, People’ s Republic of China T. Isobe Department of Medical Technology, School of Allied Health Sciences, Kitasato University, Minato, Japan I. Anno Department of Radiology, Institute of Clinical Medicine, University of Tsukuba, Tsukuba, Japan

Welcome message from author
This document is posted to help you gain knowledge. Please leave a comment to let me know what you think about it! Share it to your friends and learn new things together.
Transcript
Eur Radiol (2008) 18: 2901–2911DOI 10.1007/s00330-008-1079-6 MAGNETIC RESONANCE
Qiang YueTomonori IsobeYasushi ShibataIzumi AnnoHiraku KawamuraYouhei YamamotoShingo TakanoAkira Matsumura
Received: 27 March 2008Revised: 4 May 2008Accepted: 9 May 2008Published online: 19 July 2008# European Society of Radiology 2008
New observations concerningthe interpretation of magnetic resonancespectroscopy of meningioma
Abstract This study was aimed toclarify some ambiguities in the inter-pretation of proton magnetic reso-nance spectroscopy (1H-MRS) ofmeningiomas. The cases of 31 men-ingioma patients (27 benign and 4nonbenign meningiomas) that under-went single-voxel 1H-MRS (PRESSsequence, TR/TE=2,000 ms/68, 136,272 ms) were retrospectively ana-lyzed. To verify the findings of in-vivostudy, phantoms were measured, andpathological sections of 11 patientswere reviewed. All meningiomasdemonstrated increased choline anddecreased creatine, except for a lipo-matous meningioma that only dis-played a prominent lipid (Lip) peak.
Alanine (Ala) and lactate (Lac) coex-isted in eight cases, indicating analternative pathway of energy metab-olism in meningiomas. They partiallyoverlapped with each other and dem-onstrated a triplet-like spectral pattern,which was consistent with phantomstudy. Glutamine/glutamate (Glx) washelpful for the recognition of menin-gioma when Ala was absent. N-acetylcompounds(NACs) were observed innine cases whose voxels were com-pletely limited within the tumors,indicating that meningiomas mighthave endogenous NACs. Lac wasindicative of an aggressive meningio-ma, although not always a nonbenignone. Lip not only represented micro-necrosis in nonbenign meningiomas,but also reflected microcystic changesor fatty degeneration in benign me-ningiomas. 1H-MRS reflects somedistinctive biochemical and patholog-ical changes of meningiomas thatmight be misinterpreted.
Keywords Meningioma . Protonmagnetic resonance spectroscopy .Phantom . Pathology
Introduction
As the most common tumor arising from meninges,meningioma accounts for approximately 25% of all primaryintracranial tumors [1]. Proton magnetic resonance spec-troscopy (1H-MRS) is considered to be useful for thediagnosis of meningiomas whose radiological appearance is
atypical [2, 3] and may also play a role in the evaluation ofthe malignant potential [4, 5]. Until now the spectral patternof meningiomas has been well discussed in the literature.However, controversy exists in several aspects: (1) Alanine(Ala) is considered as the maker of meningioma [3, 6–8], buthow can the fact that Ala is not detected in somemeningiomas be interpreted? And when Ala is absent,
Grant: This study was supported by theJapan-China Sasakawa Medical Fellowship(Nippon Foundation, Japan)
Q. Yue . Y. Shibata . H. Kawamura .Y. Yamamoto . S. Takano .A. Matsumura (*)Department of Neurosurgery,Institute of Clinical Medicine,University of Tsukuba,1–1–1 Tennodai,Tsukuba Science City, Ibaraki,305–8575, Japane-mail: [email protected].: +81-298-533220Fax: +81-298-533214
Q. YueHuaxi MR Research Center,Department of Radiology,WestChinaHospital of SichuanUniversity,Chengdu, 610041, People’sRepublic of China
T. IsobeDepartment of Medical Technology,School of Allied Health Sciences,Kitasato University,Minato, Japan
I. AnnoDepartment of Radiology,Institute of Clinical Medicine,University of Tsukuba,Tsukuba, Japan
which metabolite may help to recognize a meningioma? (2)A peak around 2.02 ppm is observed in some meningiomas[2, 6]. Does it represent N-acetylaspartic acid (NAA)resulting from the partial volume effect of brain? (3) Lactate(Lac) and lipid (Lip) are usually taken as proof of nonbenigntumors, indicating intratumoral hypoxia and micronecrosis,respectively [9–11]. Do they represent the same pathologicalchanges and thus also indicate malignancy in meningiomas?This study aimed to answer these questions.
Materials and methods
1H-MRS study of meningiomas
Thirty-one consecutive cases were retrospectively reviewed.The gender ratio of men to women was 11:20, with anaverage age of 59.7 (25–77) years. Patients who underwentembolization or radiotherapy before 1H-MRS were ex-cluded. All patients received surgery, and intracranialtumors were pathologically proven as meningiomas,including 12 meningotheliomatous, 4 fibrous, 7 transitional,1 microcystic, 1 secretory, 1 angiomatous, 1 lipomatous, 1atypical, and 3 anaplastic meningiomas. Anaplastic (WHOgrade III) and atypical (WHO grade II) meningiomas wereclassified as nonbenign group (totally 4 cases); othermeningiomas of WHO grade I were classified as benigngroup (totally 27 cases). This study was approved by theEthical Committee of the University Hospital, and informedconsent was obtained for every case.
All patients underwent MR examination on the PhilipsGyroscan NT Intera 1.5-Twhole-body MR system (PhilipsMedical System, The Netherlands) with uniform examina-tion protocol, which is the routine MRS procedure in theUniversity Hospital. MRI plain scan was first carried out inthree orthogonal planes to define the volume of interest(VOI). Then single-voxel 1H-MRS was performed usingthe point-resolved spectroscopy (PRESS) sequence. Thevoxel size ranged from 10 mm×10 mm×10 mm to30 mm×30 mm×30 mm (in two cases the voxel size was10 mm×10 mm×10 mm; in one case the voxel size was30 mm×30 mm×30 mm. Others were between 1,000–27,000 mm3; the average voxel size was 4,752 mm3)according to tumor size. The parameters of PRESS were asfollows: TR/TE=2,000ms/68, 136, 272ms; spectral width=1,000 Hz; data points=512; number of signals averaged=32–128 in metabolites and 16 in tissue water.
Using the standard Philips software, raw spectral datawere post-processed, including: zero filling to 1,024 points,Gaussian filtering of 3 Hz and exponential filtering of-1 Hz, Fourier transformation, and manual phase andchemical shift correction with water peak set as thereference. Then metabolite peaks were assigned accordingto their chemical shifts: choline (Cho) at 3.22 ppm, creatine(Cr) at 3.03 ppm, N-acetyl compounds (NACs) at2.02 ppm, Ala at 1.47 ppm, Lac at 1.33 ppm, Lip at
0.9/1.3 ppm, α-proton group of glutamine/glutamate(Glx-α) at 3.75 ppm, and β and γ-proton group ofglutamine/glutamate (Glx-β and γ) at 2.1–2.5 ppm [12,13]. Spectral patterns were also used for the assignment:short-TE metabolites such as Lip and Glx were recognizedwhen they appeared on the series of the shortest TE (68 ms)and decreased rapidly on the series of longer TEs(136/272 ms); long-TE metabolites such as Cho andNACs were confirmed through all three series. Ala and Lacwere recognized as doublet peaks that demonstrated phasereversal when TE was 136 ms.
Histopathological examination
With a research microscope (Olympus BX51, OlympusCorporation, Japan), histopathological examination wasperformed on the hematoxylin-eosin (HE) sections of casesthat demonstrated Lip on 1H-MRS. These sections weremade and preserved from the time of operation. Specialattention was paid to find out if there was micronecrosis.Representative parts of the resection were photographed bya microphotographic system (Olympus Corporation,Japan) and reviewed by an experienced pathologist.
1H-MRS study of phantom
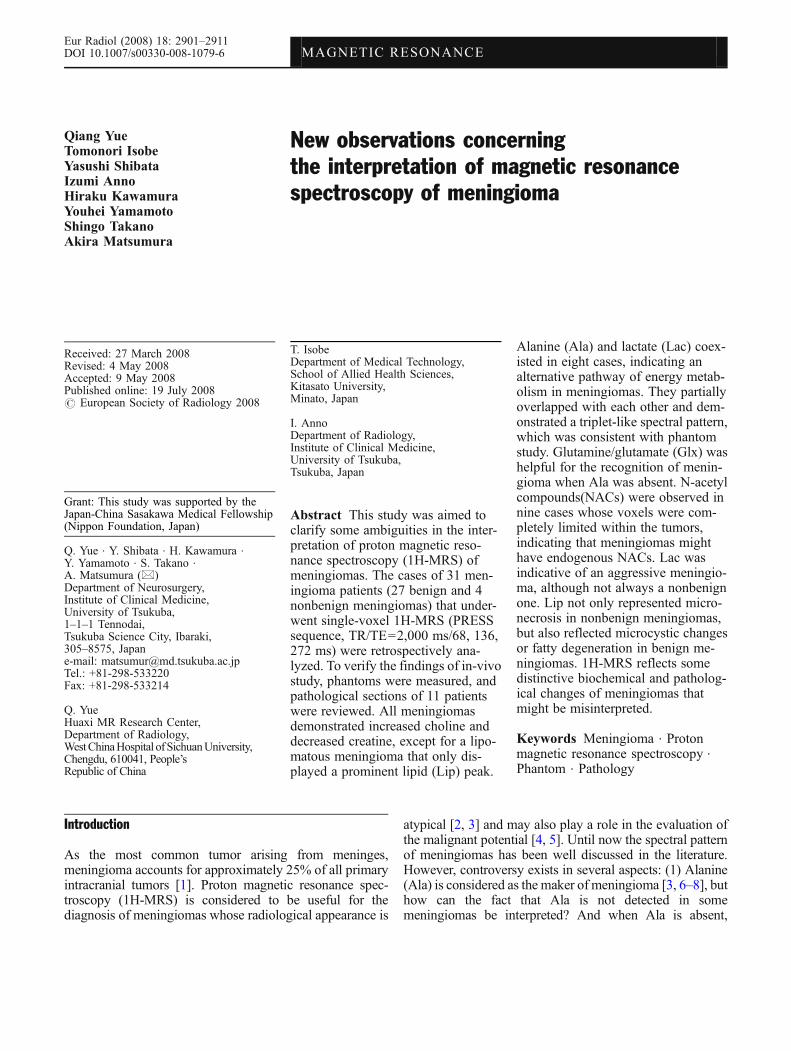
To examine the interaction between Ala and Lac observedin meningioma spectra, three kinds of phantoms wereprepared and measured: (1) Ala (20 mmol/l) and Cr(10 mmol/l); (2) Lac (20 mmol/l) and Cr (10 mmol/l); (3)Ala (20 mmol/l), Lac (20 mmol/l), and Cr (10 mmol/l).Chemicals used for the preparation of solution were L-alanine, creatine monohydrate and DL-lactic acid (WakoChemicals Corporation, Japan). Mixed solution wasinfused into a small glass bottle, and then the small bottlewas fixed at the center of a bigger glass bottle infused withphysiological saline to produce homogeneous background(Fig. 1a). The measurement equipment and methods werethe same as for in-vivo study.
Results
1H-MRS of meningiomas
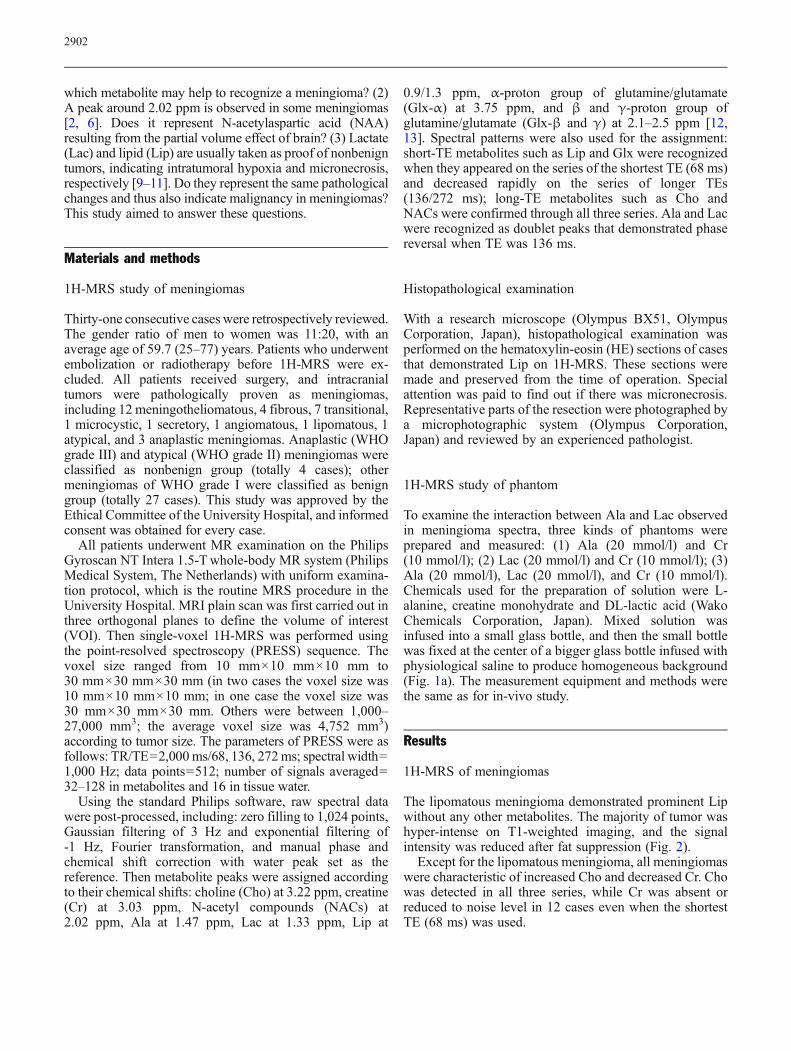
The lipomatous meningioma demonstrated prominent Lipwithout any other metabolites. The majority of tumor washyper-intense on T1-weighted imaging, and the signalintensity was reduced after fat suppression (Fig. 2).
Except for the lipomatous meningioma, all meningiomaswere characteristic of increased Cho and decreased Cr. Chowas detected in all three series, while Cr was absent orreduced to noise level in 12 cases even when the shortestTE (68 ms) was used.
2902
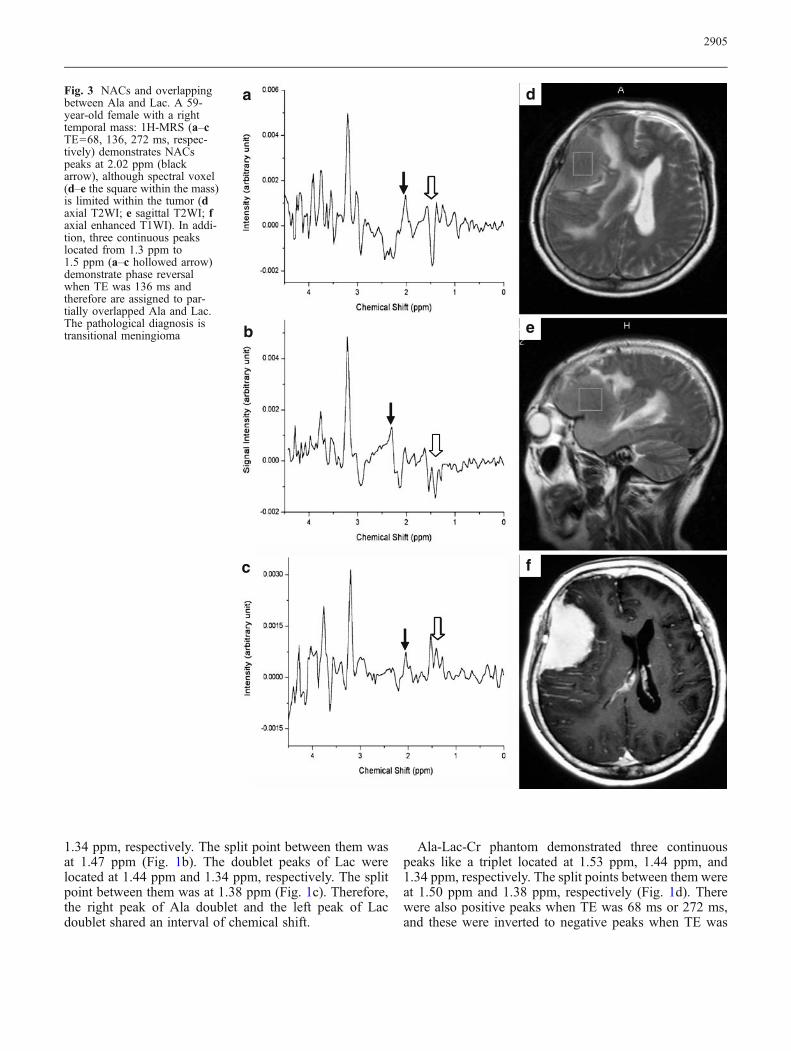
In eight (one atypical and seven benign) cases, threecontinuous peaks located from 1.3 ppm to 1.5 ppm wereobserved. The split points among them were 1.33 ppm and1.47 ppm, respectively. They appeared as positive peakswhen TE was 68 ms or 272 ms, and demonstrated phasereversal when TE was 136 ms. They were assigned topartially overlapped Ala and Lac (Fig. 3).
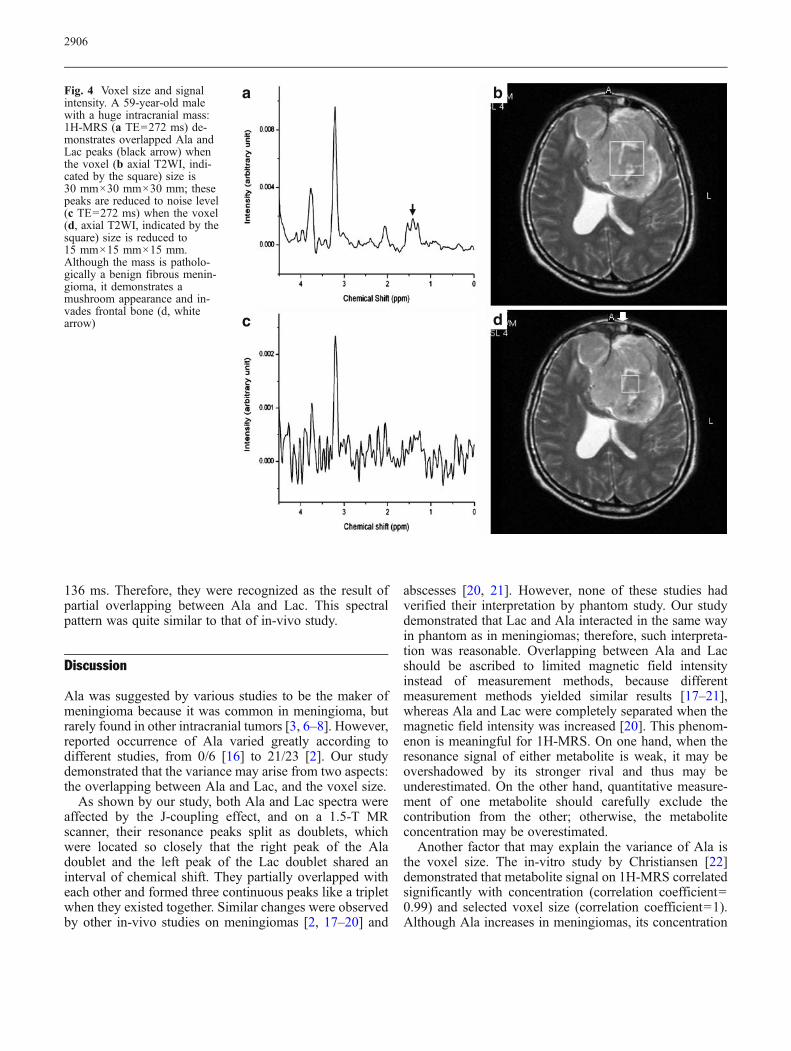
Ala peaks were observed in 10 cases (32%). Two wereisolated peaks, and eight were partially overlapped withLac. In addition, cases displaying Ala had a significantlybigger voxel size (8.52±7.13 cm3) than cases displaying noAla (3.91±5.70 cm3) (Mann-Whitney U Test, P < 0.01). Inone case Ala and Lac were clearly visible when voxel sizewas 30 mm×30 mm×30 mm, whereas they were reducedto noise level and could hardly be recognized when thevoxel size became 15 mm×15 mm×15 mm (Fig. 4).
Lac peaks were observed in ten cases (32%). Twowere isolated peaks, and eight were partially overlapped
with Ala. Among these cases were 7 (7/27) benign and 3(3/4) nonbenign meningiomas. All the seven benigncases demonstrating Lac on 1H-MRS also demonstratedone or more ‘aggressive’ features on MRI, such asmushroom appearance, indistinct margin, and extensiveperi-tumoral edema [14, 15] (Fig. 4). These features wererarely observed in benign meningiomas demonstrating noLac.
Glx was observed in 14 cases (45%). It was confirmedby Glx-α, which appeared as a narrow peak around3.75 ppm, and its signal intensity decreased rapidly withthe prolongation of TE. Glx-β and γ were difficult torecognize because they always demonstrated a broad andflat spectral pattern like baseline distortion (Fig. 5).
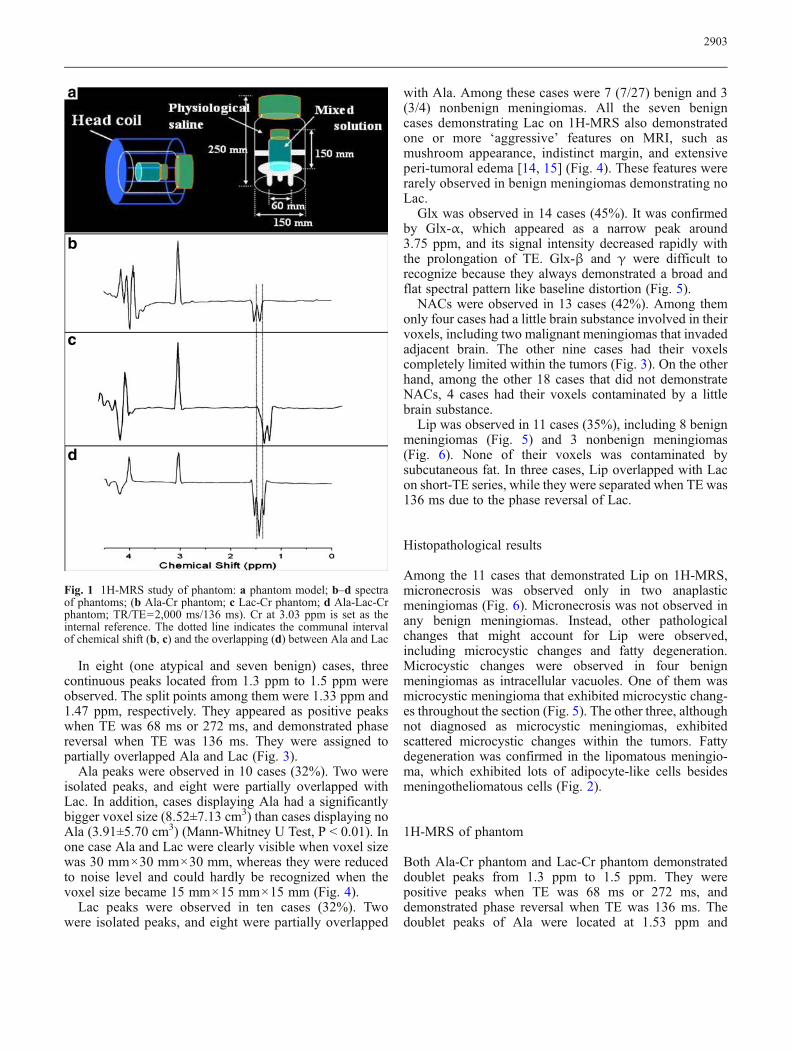
NACs were observed in 13 cases (42%). Among themonly four cases had a little brain substance involved in theirvoxels, including two malignant meningiomas that invadedadjacent brain. The other nine cases had their voxelscompletely limited within the tumors (Fig. 3). On the otherhand, among the other 18 cases that did not demonstrateNACs, 4 cases had their voxels contaminated by a littlebrain substance.
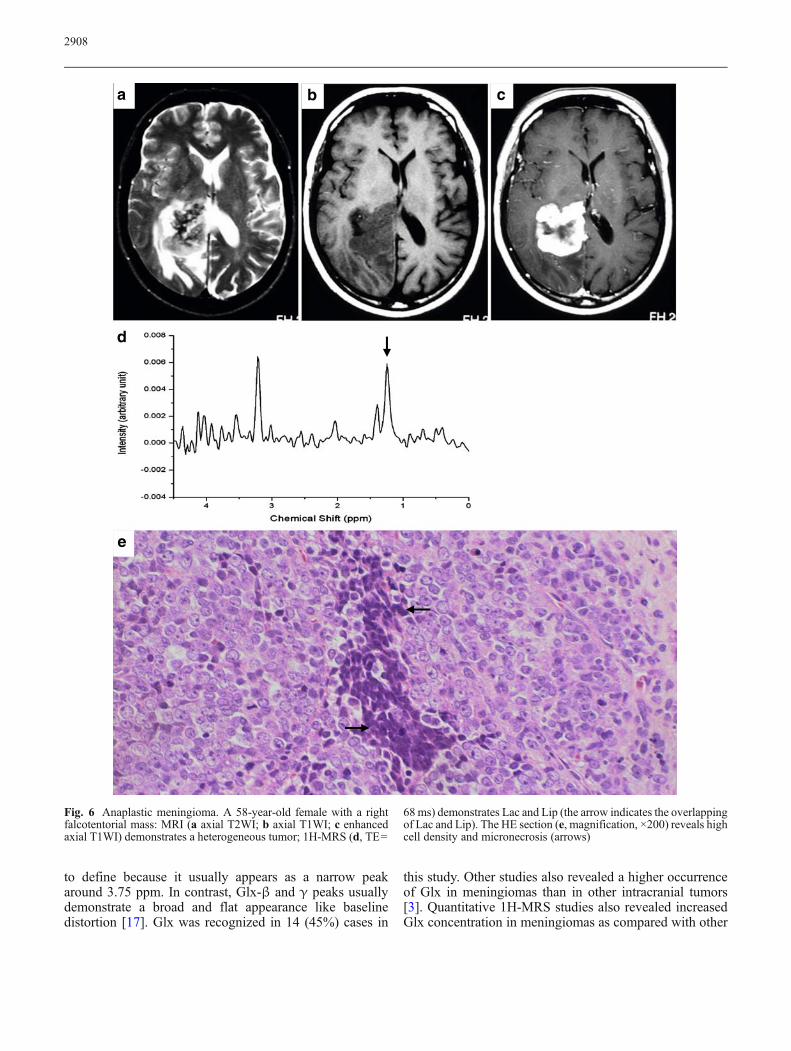
Lip was observed in 11 cases (35%), including 8 benignmeningiomas (Fig. 5) and 3 nonbenign meningiomas(Fig. 6). None of their voxels was contaminated bysubcutaneous fat. In three cases, Lip overlapped with Lacon short-TE series, while they were separated when TE was136 ms due to the phase reversal of Lac.
Histopathological results
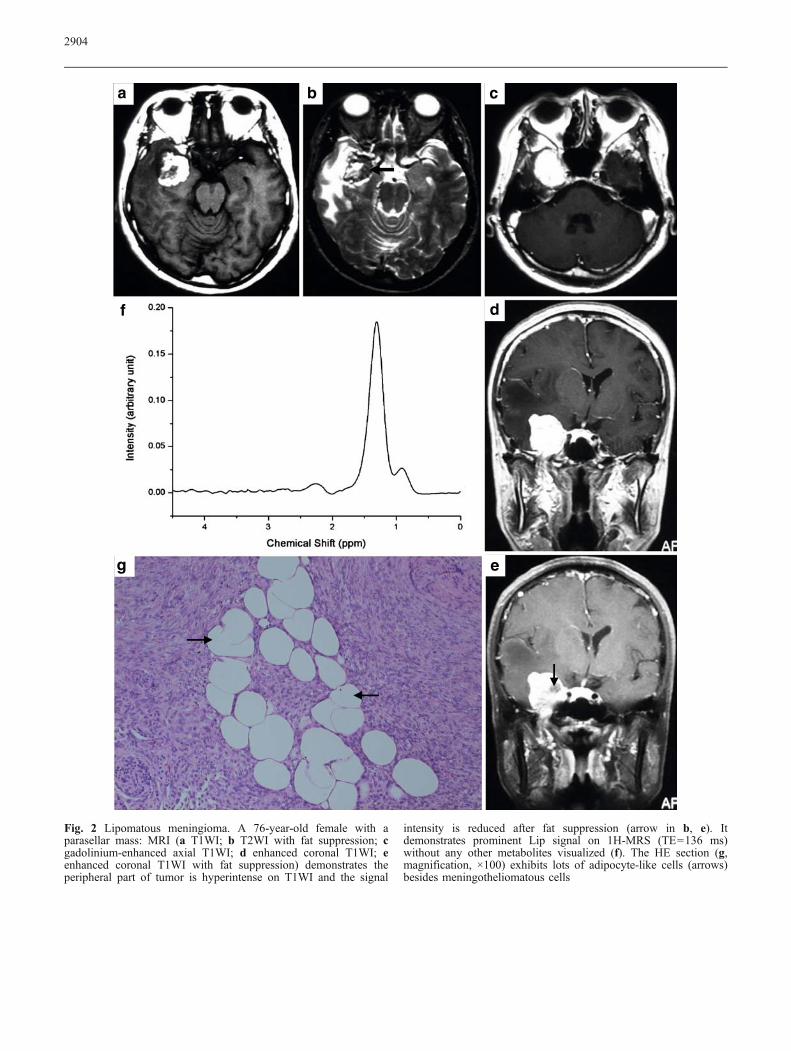
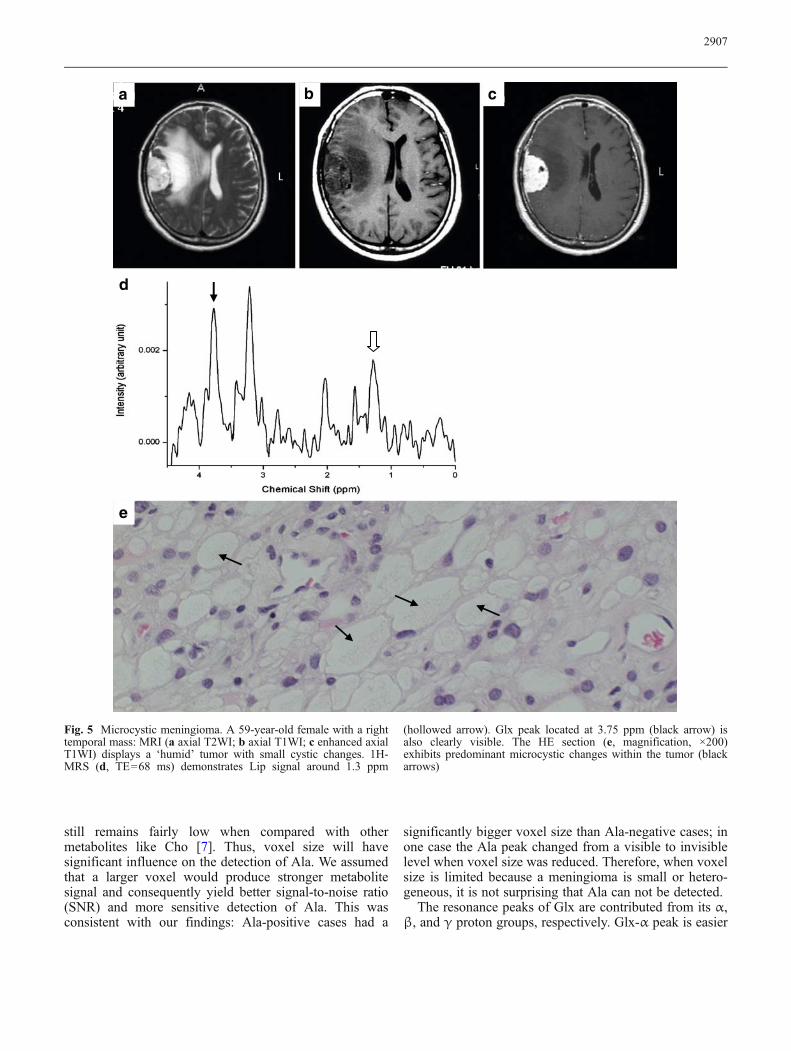
Among the 11 cases that demonstrated Lip on 1H-MRS,micronecrosis was observed only in two anaplasticmeningiomas (Fig. 6). Micronecrosis was not observed inany benign meningiomas. Instead, other pathologicalchanges that might account for Lip were observed,including microcystic changes and fatty degeneration.Microcystic changes were observed in four benignmeningiomas as intracellular vacuoles. One of them wasmicrocystic meningioma that exhibited microcystic chang-es throughout the section (Fig. 5). The other three, althoughnot diagnosed as microcystic meningiomas, exhibitedscattered microcystic changes within the tumors. Fattydegeneration was confirmed in the lipomatous meningio-ma, which exhibited lots of adipocyte-like cells besidesmeningotheliomatous cells (Fig. 2).
1H-MRS of phantom
Both Ala-Cr phantom and Lac-Cr phantom demonstrateddoublet peaks from 1.3 ppm to 1.5 ppm. They werepositive peaks when TE was 68 ms or 272 ms, anddemonstrated phase reversal when TE was 136 ms. Thedoublet peaks of Ala were located at 1.53 ppm and
a
b
c
d
Fig. 1 1H-MRS study of phantom: a phantom model; b–d spectraof phantoms; (b Ala-Cr phantom; c Lac-Cr phantom; d Ala-Lac-Crphantom; TR/TE=2,000 ms/136 ms). Cr at 3.03 ppm is set as theinternal reference. The dotted line indicates the communal intervalof chemical shift (b, c) and the overlapping (d) between Ala and Lac
2903
a c
df
eg
b
Fig. 2 Lipomatous meningioma. A 76-year-old female with aparasellar mass: MRI (a T1WI; b T2WI with fat suppression; cgadolinium-enhanced axial T1WI; d enhanced coronal T1WI; eenhanced coronal T1WI with fat suppression) demonstrates theperipheral part of tumor is hyperintense on T1WI and the signal
intensity is reduced after fat suppression (arrow in b, e). Itdemonstrates prominent Lip signal on 1H-MRS (TE=136 ms)without any other metabolites visualized (f). The HE section (g,magnification, ×100) exhibits lots of adipocyte-like cells (arrows)besides meningotheliomatous cells
2904
1.34 ppm, respectively. The split point between them wasat 1.47 ppm (Fig. 1b). The doublet peaks of Lac werelocated at 1.44 ppm and 1.34 ppm, respectively. The splitpoint between them was at 1.38 ppm (Fig. 1c). Therefore,the right peak of Ala doublet and the left peak of Lacdoublet shared an interval of chemical shift.
Ala-Lac-Cr phantom demonstrated three continuouspeaks like a triplet located at 1.53 ppm, 1.44 ppm, and1.34 ppm, respectively. The split points between them wereat 1.50 ppm and 1.38 ppm, respectively (Fig. 1d). Therewere also positive peaks when TE was 68 ms or 272 ms,and these were inverted to negative peaks when TE was
d
e
f
a
b
c
Fig. 3 NACs and overlappingbetween Ala and Lac. A 59-year-old female with a righttemporal mass: 1H-MRS (a–cTE=68, 136, 272 ms, respec-tively) demonstrates NACspeaks at 2.02 ppm (blackarrow), although spectral voxel(d–e the square within the mass)is limited within the tumor (daxial T2WI; e sagittal T2WI; faxial enhanced T1WI). In addi-tion, three continuous peakslocated from 1.3 ppm to1.5 ppm (a–c hollowed arrow)demonstrate phase reversalwhen TE was 136 ms andtherefore are assigned to par-tially overlapped Ala and Lac.The pathological diagnosis istransitional meningioma
2905
136 ms. Therefore, they were recognized as the result ofpartial overlapping between Ala and Lac. This spectralpattern was quite similar to that of in-vivo study.
Discussion
Ala was suggested by various studies to be the maker ofmeningioma because it was common in meningioma, butrarely found in other intracranial tumors [3, 6–8]. However,reported occurrence of Ala varied greatly according todifferent studies, from 0/6 [16] to 21/23 [2]. Our studydemonstrated that the variance may arise from two aspects:the overlapping between Ala and Lac, and the voxel size.
As shown by our study, both Ala and Lac spectra wereaffected by the J-coupling effect, and on a 1.5-T MRscanner, their resonance peaks split as doublets, whichwere located so closely that the right peak of the Aladoublet and the left peak of the Lac doublet shared aninterval of chemical shift. They partially overlapped witheach other and formed three continuous peaks like a tripletwhen they existed together. Similar changes were observedby other in-vivo studies on meningiomas [2, 17–20] and
abscesses [20, 21]. However, none of these studies hadverified their interpretation by phantom study. Our studydemonstrated that Lac and Ala interacted in the same wayin phantom as in meningiomas; therefore, such interpreta-tion was reasonable. Overlapping between Ala and Lacshould be ascribed to limited magnetic field intensityinstead of measurement methods, because differentmeasurement methods yielded similar results [17–21],whereas Ala and Lac were completely separated when themagnetic field intensity was increased [20]. This phenom-enon is meaningful for 1H-MRS. On one hand, when theresonance signal of either metabolite is weak, it may beovershadowed by its stronger rival and thus may beunderestimated. On the other hand, quantitative measure-ment of one metabolite should carefully exclude thecontribution from the other; otherwise, the metaboliteconcentration may be overestimated.
Another factor that may explain the variance of Ala isthe voxel size. The in-vitro study by Christiansen [22]demonstrated that metabolite signal on 1H-MRS correlatedsignificantly with concentration (correlation coefficient=0.99) and selected voxel size (correlation coefficient=1).Although Ala increases in meningiomas, its concentration
a b
c d
Fig. 4 Voxel size and signalintensity. A 59-year-old malewith a huge intracranial mass:1H-MRS (a TE=272 ms) de-monstrates overlapped Ala andLac peaks (black arrow) whenthe voxel (b axial T2WI, indi-cated by the square) size is30 mm×30 mm×30 mm; thesepeaks are reduced to noise level(c TE=272 ms) when the voxel(d, axial T2WI, indicated by thesquare) size is reduced to15 mm×15 mm×15 mm.Although the mass is patholo-gically a benign fibrous menin-gioma, it demonstrates amushroom appearance and in-vades frontal bone (d, whitearrow)
2906
still remains fairly low when compared with othermetabolites like Cho [7]. Thus, voxel size will havesignificant influence on the detection of Ala. We assumedthat a larger voxel would produce stronger metabolitesignal and consequently yield better signal-to-noise ratio(SNR) and more sensitive detection of Ala. This wasconsistent with our findings: Ala-positive cases had a
significantly bigger voxel size than Ala-negative cases; inone case the Ala peak changed from a visible to invisiblelevel when voxel size was reduced. Therefore, when voxelsize is limited because a meningioma is small or hetero-geneous, it is not surprising that Ala can not be detected.
The resonance peaks of Glx are contributed from its α,β, and γ proton groups, respectively. Glx-α peak is easier
d
a b c
e
Fig. 5 Microcystic meningioma. A 59-year-old female with a righttemporal mass: MRI (a axial T2WI; b axial T1WI; c enhanced axialT1WI) displays a ‘humid’ tumor with small cystic changes. 1H-MRS (d, TE=68 ms) demonstrates Lip signal around 1.3 ppm
(hollowed arrow). Glx peak located at 3.75 ppm (black arrow) isalso clearly visible. The HE section (e, magnification, ×200)exhibits predominant microcystic changes within the tumor (blackarrows)
2907
to define because it usually appears as a narrow peakaround 3.75 ppm. In contrast, Glx-β and γ peaks usuallydemonstrate a broad and flat appearance like baselinedistortion [17]. Glx was recognized in 14 (45%) cases in
this study. Other studies also revealed a higher occurrenceof Glx in meningiomas than in other intracranial tumors[3]. Quantitative 1H-MRS studies also revealed increasedGlx concentration in meningiomas as compared with other
d
a b c
e
Fig. 6 Anaplastic meningioma. A 58-year-old female with a rightfalcotentorial mass: MRI (a axial T2WI; b axial T1WI; c enhancedaxial T1WI) demonstrates a heterogeneous tumor; 1H-MRS (d, TE=
68ms) demonstrates Lac and Lip (the arrow indicates the overlappingof Lac and Lip). The HE section (e, magnification, ×200) reveals highcell density and micronecrosis (arrows)
2908
intracranial tumors [6, 23]. Therefore, although Glx is not aunique metabolite of meningiomas, it may play asupplementary role for the recognition of meningiomaswhen Ala is absent or ambiguous.
NAA is the major contributor of the peak at 2.02 ppm innormal brain. It is present within neurons and usually takenas the maker of neurons [12, 24]. Theoretically, tumorsarising outside the central nervous system contain no NAA[10, 25]. This is consistent with previous in-vitro analysisof meningioma extracts that did not detect NAA [7, 26, 27].However, in-vivo 1H-MRS did demonstrate a small peakaround 2.02 ppm in some meningiomas according to thisstudy and others [2, 6, 28]. It was usually assigned to NAAand ascribed to the partial volume effect of brain. This mayaccount for some of our cases whose voxels enclosed alittle brain substance. However, this is not able to explainother cases whose voxels were completely located withinthe tumor. On the other hand, although some cases hadtheir voxels contaminated by brain substance, they did notdemonstrate NAA peaks. This indicated that partial volumeeffect was too weak to produce sufficient NAA signals.Therefore, there should be some other metabolites thatcontributed to the peak around 2.02 ppm. They should notbe short-TE metabolites because the small peak stillremained at long-TE series. They should also be NACs.Possible candidates include N-acetylaspartylglutamate, N-acetylneuraminic acid, N-acetylgalactosamine, or someother unknown NACs that contribute to the peak around2.02 ppm on in-vivo spectra, but decrease to anundetectable level on in-vitro spectra [29–31]. In sum, apeak around 2.02 ppm on meningioma spectra collectedusing long TE not only represents NAA produced by thepartial volume effect of brain, but also represents otherendogenous NACs of meningioma.
Evaluation of tumor malignancy by 1H-MRS usuallyinvolves the analysis of Lac and Lip. Lac is the product ofanaerobic glycolysis, and Lip indicates intra-tumoralnecrosis. Both metabolites were reported to correlate withtumor grade [9–11, 32]. Our study demonstrated that thismethod is sometimes, but not always, applicable formeningioma.
In our study Lac was more frequently visualized innonbenign meningiomas (3 of 4 cases) than in benignmeningiomas (7 of 27 cases), and benign cases demon-strating Lac behaved more ‘aggressively’ than benign casesdemonstrating no Lac. These findings indicate that Lac isindicative of an aggressive meningioma, but not always anonbenign one. This is consistent with Shino’s study [4],but disputes Demir’s [2]. The controversy may arise fromthe interpretation of the production of Lac. Based on ourfinding that Lac was always accompanied by Ala in benignmeningiomas, we hypothesize that transamination betweenAla and α- ketoglutarate, instead of glycolysis, mayaccount for Lac in benign meningiomas. This pathwayproduces pyruvate and glutamate. Pyruvate is converted toLac by Lac dehydrogenase, and glutamate may act as an
alternative energy source in meningioma by partial oxida-tion [3, 33–35]. This alternative pathway may meet themildly increased energy demands in benign, but somewhat‘aggressive’ meningiomas. After malignant transforma-tion, however, Ala may be quickly exhausted, andglycolysis may play a major role for vast energy supply.Recent study provided proof that there was genetic andmetabolic difference between clinically aggressive grade Imeningiomas and clinically benign grade I meningiomas;in particular, Ala was decreased in aggressive meningio-mas [36]. These findings are in favor of our hypothesis.
Previous study demonstrated the correlation betweenLip and micronecrosis and concluded that micronecrosiswas highly indicative of nonbenign meningiomas [4]. Inour study, however, Lip represented micronecrosis only innonbenign meningiomas. Micronecrosis was not observedin any benign meningioma demonstrating Lip. Consis-tently, other studies also found that Lip was not uncommonamong benign meningiomas, whereas micronecrosis wasvery rare [3, 37]. So there should be some other patholog-ical changes responsible for Lip in benign meningiomas.Our study demonstrated that they might be microcysticchanges or fatty degeneration. Lipid accumulation has beenobserved in microcystic meningiomas that exhibit pre-dominant microcystic changes [38]. Although microcysticmeningioma is a rare subtype, scattered microcysticchanges are not uncommon in meningiomas [3]. Therefore,Lip detected in these cases should be ascribed tomicrocystic changes instead of micronecrosis. On theother hand, Lip detected in the lipomatous meningiomashould be attributed to fatty degeneration. It is called ‘fattydegeneration’ because intratumoral adipocyte-like cells arenot real adipocytes, but ‘lipidized’ meningioma cells [39].To our knowledge, it is the first 1H-MRS report of alipomatous meningioma. In sum, Lip does not onlyrepresent micronecrosis, and therefore it cannot alwaysbe taken as proof of a nonbenign meningioma.
There are several limitations to our study. First, from atechnical perspective, the TEs we used were not shortenough for the detection of short-TE metabolites, such asGlx and Lip, and the strong filtration we used might affectthe identification of Ala doublet, so these metabolitesmight be underestimated. A prospective study using shorterTE (e.g., 30 ms) and different filtration should be carriedout to evaluate their influence. Secondly, we did notquantify metabolites because overlapping between Ala andLac at 1.3–1.5 ppm, or between Glx and other metabolites(gamma-aminobutyric acid, N-acetylaspartylglutamate,glutathione, etc.) at 2.1–2.5 ppm, could not be avoided at1.5 T. So we focused on the qualitative analysis ofmeningioma spectra. We expect a study at higher fieldcould provide better resolution and thus more reliablequantification of these metabolites. In addition, we werenot able to prove the existence of Lip in meningiomas byspecial stain, because Lip was mostly decomposed inparaffin-embedded specimen. We expect a prospective
2909
pathological study on fresh specimens would providedirect evidence for the existence of Lip.
Conclusions
To avoid misinterpretation of meningioma spectra, thedistinctive biochemical and pathological changes of men-ingioma should be recognized, including:
(1) Ala may be underestimated due to overshadowing fromLac or due to small voxel size. A triplet-like spectralpattern at 1.3–1.5 ppm representing overlapping of Alaand Lac is not uncommon in meningiomas and shouldbe brought to notice. Glx, especially Glx-α, may play a
supplementary role in the recognition of meningiomawhen Ala is absent or ambiguous.
(2) Meningioma may have endogenous NACs except forNAA, and therefore may produce a resonance peakaround 2.02 ppm even when the spectral voxel is notcontaminated by brain.
(3) Lac is indicative of an aggressive meningioma,although not always a nonbenign one. Lip representsnot only micronecrosis in nonbenign meningioma, butalso microcystic changes or fatty degeneration inbenign meningioma.
Acknowledgements We acknowledge Ms. Tsukada for herassistance in the pathological studies.
References
1. Claus EB, Bondy ML, Schildkraut JMet al (2005) Epidemiology of intracra-nial meningioma. Neurosurgery57:1088–1095
2. Demir MK, Iplikcioglu AC, Dincer Aet al (2006) Single voxel proton MRspectroscopy findings of typical andatypical intracranial meningiomas. EurJ Radiol 60:48–55
3. Cho YD, Choi GH, Lee SP et al (2003)(1)H-MRS metabolic patterns for dis-tinguishing between meningiomas andother brain tumors. Magn Reson Im-aging 21:663–672
4. Shino A, Nakasu S, Matsuda M et al(1999) Noninvasive evaluation of themalignant potential of intracranial me-ningiomas performed using protonmagnetic resonance spectroscopy. JNeurosurg 91:928–934
5. Buhl R, Nabavi A, Wolff S et al (2007)MR spectroscopy in patients with in-tracranial meningiomas. Neurol Res29:43–46
6. Majós C, Alonso J, Aguilera C et al(2003) Utility of proton MR spectros-copy in the diagnosis of radiologicallyatypical intracranial meningiomas.Neuroradiology 45:129–136
7. Kinoshita Y, Yokota A (1997) Absoluteconcentrations of metabolites in humanbrain tumors using in vitro protonmagnetic resonance spectroscopy.NMR Biomed 10:2–12
8. Lehnhardt FG, Rohn G, Ernestus RI etal (2001) 1H- and (31)P-MR spectros-copy of primary and recurrent humanbrain tumors in vitro: malignancy-characteristic profiles of water solubleand lipophilic spectral components.NMR Biomed 14:307–317
9. Howe FA, Barton SJ, Cudlip SA et al(2003) Metabolic profiles of humanbrain tumors using quantitative in vivo1H magnetic resonance spectroscopy.Magn Reson Med 49:223–232
10. Castillo M, Kwock L, Mukherji SK(1996) Clinical applications of protonMR spectroscopy. AJNR Am J Neu-roradiol 17:1–15
11. Negendank WG, Sauter R, Brown TRet al (1996) Proton magnetic resonancespectroscopy in patients with glialtumors: a multicenter study. J Neuro-surg 84:449–458
12. Lehnhardt FG, Bock C, Rohn G et al(2005) Metabolic differences betweenprimary and recurrent human braintumors: a 1H NMR spectroscopicinvestigation. NMR Biomed 18:371–382
13. Ryner LN, Sorenson JA, Thomas MA(1995) Localized 2D J-resolved 1H MRspectroscopy: strong coupling effects invitro and in vivo. Magn Reson Imaging13:853–869
14. Alvarez F, Roda JM, Perez Romero Met al (1987) Malignant and atypicalmeningiomas: a reappraisal of clinical,histological, and computed tomo-graphic features. Neurosurgery 20:688–694
15. New PF, Hesselink JR, O’Carroll CP etal (1982) Malignant meningiomas: CTand histologic criteria, including a newCT sign. AJNR Am J Neuroradiol3:267–276
16. Falini A, Calabrese G, Origgi D et al(1996) Proton magnetic resonancespectroscopy and intracranial tumours:clinical perspectives. J Neurol243:706–714
17. Hazany S, Hesselink JR, Healy JF et al(2007) Utilization of glutamate/creatineratios for proton spectroscopic diagno-sis of meningiomas. Neuroradiology49:121–127
18. Manton DJ, Lowry M, Blackband SJ etal (1994) Quantitative proton MRS ofbrain tumors reveals increased choli-neT2 in meningiomas. MAGMA2:361–363
19. Harting I, Jost G, Hacke N et al (2005)Magnetic resonance spectroscopy ofbrain tumours. Nervenarzt 76:403–417
20. Poptani H, Gupta RK, Jain VK et al(1995) Cystic intracranial mass lesions:possible role of in vivo MR spectros-copy in its differential diagnosis. MagnReson Imaging 13:1019–1029
21. Akutsu H, Matsumura A, Isobe T et al(2002) Chronological change of brainabscess in (1)H magnetic resonancespectroscopy. Neuroradiology 44:574–578
22. Christiansen P, Henriksen O, StubgaardM et al (1993) In vivo quantification ofbrain metabolites by 1H-MRS usingwater as an internal standard. MagnReson Imaging 11:107–118
23. Majós C, Alonso J, Aguilera C et al(2003) Proton magnetic resonancespectroscopy ((1)H MRS) of humanbrain tumours: assessment of differ-ences between tumour types and itsapplicability in brain tumour categor-ization. Eur Radiol 13:582–591
24. Miller BL (1991) A review of chemicalissues in 1H NMR spectroscopy: N-acetyl-L-aspartate, creatine and choline.NMR Biomed 4:47–52
25. Bruhn H, Frahm J, Gyngell ML et al(1989) Noninvasive differentiation oftumors with use of localized H-1 MRspectroscopy in vivo: initial experiencein patients with cerebral tumors. Radi-ology 172:541–548
2910
26. Barba I, Moreno A, Martinez-Perez I etal (2001) Magnetic resonance spec-troscopy of brain hemangiopericyto-mas: high myoinositol concentrationsand discrimination from meningiomas.J Neurosurg 94:55–60
27. Kinoshita Y, Kajiwara H, Yokota A etal (1994) Proton magnetic resonancespectroscopy of brain tumors: an invitro study. Neurosurgery 35:606–613
28. Kugel H, Heindel W, Ernestus RI et al(1992) Human brain tumors: spectralpatterns detected with localized H-1MR spectroscopy. Radiology 183:701–709
29. Holowenko D, Peeling J, Sutherland G(1992) 1H NMR properties of N-acetylaspartylglutamate in extracts ofnervous tissue of the rat. NMR Biomed5:43–47
30. Gadian DG, Bates TE, Williams SR etal (1991) Approaches to editing, as-signment and interpretation of protonspectra. NMR Biomed 4:85–89
31. Usenius JP, Kauppinen RA, Vainio PAet al (1994) Quantitative metabolitepatterns of human brain tumors: detec-tion by 1H NMR spectroscopy in vivoand in vitro. J Comput Assist Tomogr18:705–713
32. Ott D, Hennig J, Ernst T (1993) Humanbrain tumors: assessment with in vivoproton MR spectroscopy. Radiology186:745–752
33. Opstad KS, Provencher SW, Bell BA etal (2003) Detection of elevated gluta-thione in meningiomas by quantitativein vivo 1H MRS. Magn Reson Med49:632–637
34. Roda JM, Pascual JM, Carceller F et al(2000) Nonhistological diagnosis ofhuman cerebral tumors by 1H magneticresonance spectroscopy and amino acidanalysis. Clin Cancer Res 6:3983–3993
35. Cheng LL, Ma MJ, Becerra L et al(1997) Quantitative neuropathology byhigh resolution magic angle spinningproton magnetic resonance spectrosco-py. Proc Natl Acad Sci USA 94:6408–6413
36. Pfisterer WK, Hendricks WP, ScheckAC et al (2007) Fluorescent in situhybridization and ex vivo 1H magneticresonance spectroscopic examinationsof meningioma tumor tissue: is itpossible to identify a clinically-aggres-sive subset of benign meningiomas?Neurosurgery 61:1048–1059
37. Cerda-Nicolas M, Lopez-Gines C,Perez-Bacete M et al (2000) Histo-pathological and cytogenetic findingsin benign, atypical and anaplastichuman meningiomas: a study of 60tumors. J Neurooncol 47:99–108
38. Schober R, Himuro H, Wechsler W(1988) Cystic changes and vascularpermeability in meningiomas. ClinNeuropathol 7:16–21
39. Roncaroli F, Scheithauer BW, LaengRH et al (2001) Lipomatous meningi-oma: a clinicopathologic study of 18cases with special reference to the issueof metaplasia. Am J Surg Pathol25:769–775
2911
Related Documents