HAL Id: hal-02157488 https://hal.archives-ouvertes.fr/hal-02157488 Submitted on 17 Jun 2019 HAL is a multi-disciplinary open access archive for the deposit and dissemination of sci- entific research documents, whether they are pub- lished or not. The documents may come from teaching and research institutions in France or abroad, or from public or private research centers. L’archive ouverte pluridisciplinaire HAL, est destinée au dépôt et à la diffusion de documents scientifiques de niveau recherche, publiés ou non, émanant des établissements d’enseignement et de recherche français ou étrangers, des laboratoires publics ou privés. New model-based insights for strategic nitrogen recommendations adapted to given soil and climate Morteza Mesbah, Elizabeth Pattey, Guillaume Jégo, Anne Didier, Xiaoyuan Geng, Nicolas Tremblay, Fasheng Zhang To cite this version: Morteza Mesbah, Elizabeth Pattey, Guillaume Jégo, Anne Didier, Xiaoyuan Geng, et al.. New model- based insights for strategic nitrogen recommendations adapted to given soil and climate. Agronomy for Sustainable Development, Springer Verlag/EDP Sciences/INRA, 2018, 38 (4), pp.36. 10.1007/s13593- 018-0505-7. hal-02157488

Welcome message from author
This document is posted to help you gain knowledge. Please leave a comment to let me know what you think about it! Share it to your friends and learn new things together.
Transcript

HAL Id: hal-02157488https://hal.archives-ouvertes.fr/hal-02157488
Submitted on 17 Jun 2019
HAL is a multi-disciplinary open accessarchive for the deposit and dissemination of sci-entific research documents, whether they are pub-lished or not. The documents may come fromteaching and research institutions in France orabroad, or from public or private research centers.
L’archive ouverte pluridisciplinaire HAL, estdestinée au dépôt et à la diffusion de documentsscientifiques de niveau recherche, publiés ou non,émanant des établissements d’enseignement et derecherche français ou étrangers, des laboratoirespublics ou privés.
New model-based insights for strategic nitrogenrecommendations adapted to given soil and climate
Morteza Mesbah, Elizabeth Pattey, Guillaume Jégo, Anne Didier, XiaoyuanGeng, Nicolas Tremblay, Fasheng Zhang
To cite this version:Morteza Mesbah, Elizabeth Pattey, Guillaume Jégo, Anne Didier, Xiaoyuan Geng, et al.. New model-based insights for strategic nitrogen recommendations adapted to given soil and climate. Agronomy forSustainable Development, Springer Verlag/EDP Sciences/INRA, 2018, 38 (4), pp.36. �10.1007/s13593-018-0505-7�. �hal-02157488�

RESEARCH ARTICLE
New model-based insights for strategic nitrogen recommendationsadapted to given soil and climate
Morteza Mesbah1,2& Elizabeth Pattey1 & Guillaume Jégo3
& Anne Didier4 & Xiaoyuan Geng1& Nicolas Tremblay5 &
Fasheng Zhang1
Accepted: 30 April 2018 /Published online: 15 June 2018# INRA and Springer-Verlag France SAS, part of Springer Nature 2018
AbstractManaging nitrogen (N) fertilizer applied in agricultural fields is important for increasing crop productivity while limiting theenvironmental contamination caused by release of reactive N, especially for crops with high N demand (e.g., corn, Zea mays L.).However, for given soil properties, the optimum amount of N applied depends on climatic conditions. The central question to Nmanagement is then what should be the recommended N rate for given soil and climate that would minimize the release ofreactive N while maintaining the crop productivity. To address this central challenge of N management, we used a recentlydeveloped model-based methodology (called “Identifying NEMO”), which was proved to be effective in identifying ecophys-iological optimumN rate and optimum nitrogen use efficiency (NUEopt). We performed modeling for dominant soils and variousagroclimatic conditions in five regions along theMixedwood Plains ecozone, where more than 90% of Canadian corn productiontakes place. Here, we analyzed for the first time the effect of soil and climate on ecophysiological optimum N rate in an ecozonewhere there exists a significant agroclimatic gradient. Our results indicated that there were some commonalities among all soilsand regions, which we could classify them into two groups with NUEopt ranging from 10 to 17 kg dry yield kg−1 N. For caseswith low NUEopt, the recommended N for an expected dry yield of 8 t ha−1 varied from 115 to 199 kg ha−1, whereas they weremuch lower (79–154 kg ha−1) for cases with high NUEopt. These recommendations were 20–40 kg ha−1 lower than provincialrecommendations. Moreover, we found that the different behavior of the two groups was due to soil textures and soils availablewater holding capacity. For most locations, soils with intermediate available water holding capacity (i.e., 12–15%v) had relativelyhigher expected yield and lower recommended N.
Keywords Ecophysiological optimumN rate . Identifying NEMO . Rainfed corn . Nitrogen fertilization . STICS cropmodel .
Soil texture .Mixedwood Plains ecozone . Canada . Climate variations
1 Introduction
The use of N fertilizer in agricultural systems has been rapidlyincreasing in the last few decades to supply globally the in-creasing food demand (Foley et al. 2011; Zhang et al. 2015;Sela et al. 2016). The amount of N not taken up by plants maycontribute to off-site deposition and contamination of otherecosystems. It creates a sequence of effects referred to as “ni-trogen cascade.” These effects could be local such as off-siteammonia deposition, regional such as particulate matter for-mation and their long range transportation, or global such asan increase in N2O greenhouse gas emissions (Galloway et al.2003; Erisman et al. 2007). The effects could be partly miti-gated by application of optimum N rate on cultivated crops.However, the identification of optimum N rate is challengingas it varies by climatic conditions and soil properties. In a
* Elizabeth [email protected]
1 Ottawa Research and Development Centre, Agriculture andAgri-Food Canada, 960 Carling Avenue, Ottawa, Ontario K1A 0C6,Canada
2 Present address: Charlottetown Research and Development Centre,Agriculture and Agri-Food Canada, 440 University Avenue,Charlottetown, Prince Edward Island C1A 4N6, Canada
3 Quebec Research and Development Centre, Agriculture andAgri-Food Canada, 2560 Hochelaga Boulevard, QuebecCity, Quebec G1V 2J3, Canada
4 Reims, France5 Saint-Jean-sur-Richelieu Research and Development Centre,
Agriculture and Agri-Food Canada, 430 Gouin Boulevard,Saint-Jean-sur-Richelieu, Quebec J3B 3E6, Canada
Agronomy for Sustainable Development (2018) 38: 36https://doi.org/10.1007/s13593-018-0505-7
region with given soil properties, the climate is the dominantfactor for deriving optimum N rate especially for high N de-mand crops such as corn (Zea mays L.) (Hyytiäinen et al.2011; Tremblay et al. 2012; N’Dayegamiye et al. 2015).
Corn is the most produced cereal crop worldwide with 885.3million t produced in 2011 (FAOSTAT 2011). In Canada, cornis the third largest grain crop produced after wheat and canola,and the most important crop in Eastern Canada, particularly inthe Mixedwood Plains ecozone where more than 90% of cornproduction takes place (Statistics Canada 2015). Rainfed cornrequires high N fertilization and thus identifying optimum Nfertilizer rate is highly important to optimize corn productivityand limit N loss. However, the optimum amount of N fertilizeris highly variable as it is influenced by the interaction betweensoil and climate conditions. Seasonal temperature, precipitation,and soil texture are keys to availability of water which directlyaffects plant growth, N uptake, and optimum N. Moreover,climate conditions can affect optimum N through various pro-cesses in soil such as nitrification, denitrification, leaching, andmineralization, which modulate N availability to the crops.(Melkonian et al. 2007; van Es et al. 2007; Zhu et al. 2009;Tremblay et al. 2012; Moebius-Clune et al. 2013).Nevertheless, these effects have been neglected in many Nmanagement decisions (Raun et al. 2005; Melkonian et al.2007; Shanahan et al. 2008). Tremblay et al. (2012) performeda meta-analysis combining studies on 51 corn production fieldsin North America and found that early-season precipitation isthe most dominant factor affecting corn response to N rates.
A common practice to identify a recommended N rate is toperform an analysis of variance on data collected from facto-rial plot experiments under which yield response is often mea-sured to large incremental N, e.g., 50 kg N ha −1. This analysisdetermines an N rate beyond which there is no more statisti-cally meaningful increase in yield and yield is maximized.This approach does not account for the costs associated withN fertilizer and thus does not recommend an economicallyoptimized N rate. The economic optimum N rate is definedas an N application rate, at which the net return of N is max-imized and the ratio of unit cost of N application to the price ofyield is equal to the ratio of change in yield to change in N rate(Mamo et al. 2003). The ratio is highly important in determi-nation of optimum rate, and is referred to as nitrogen useefficiency (NUE) or incremental physiological efficiency(Bock et al. 1984; Doberman 2005). The economic approachto optimize N rate is based on external economic factors onlyand thus is not optimized to reduce any adverse environmentalimpact. The magnitudes of these adverse impacts are highlydependent on climatic conditions, and thus it is important tostudy such impacts over a long time period to identify anenvironmentally friendly optimum N rate. While experimen-tations over a long time period is highly costly, modeling isenvisioned as an effective tool to address the impact of climatevariations on identifying N recommended rates.
Crop models have been used within multi-criteria ap-proaches under which a combination of net economic returnand environmental impacts is optimized (Dumont et al. 2016;Basso et al. 2011). However, these approaches often considerN leaching as the only adverse environmental impact of Napplication. To account for a global estimate of reactive Nlosses, Mesbah et al. (2017) proposed a methodology to iden-tify an optimum N rate (Nopt) based on crop ecophysiology,called Identifying NEMO (N Ecophysiologically ModelledOptimum). At this ecophysiological optimum N rate, there isno N excess with little reduction in yield compared to maxi-mum achievable yield. This approach uses a process-basedcrop model, the Mitscherlich-Baule Plateau (MB-P) yieldfunction, and long time series of climate data, and providesselection criteria to identify optimumNUE (NUEopt), and cor-responding climate-dependent Nopt values. The MB-P func-tion was selected as it outperformed two commonly used yieldfunctions (the linear-plateau and MB) in mimicking modeledyield response to N rate. The performance evaluation wasshown via a case study for 48 to 61 years of daily climate dataand soils with contrasting properties in five regions along theMixedwood Plains ecozone in Canada (42.3o N 83o W–46.8o
N 71o W) with significant agroclimatic gradient. The methodwas then examined for one soil only (i.e., sandy loam), as anexample to better elaborate the steps of Identifying NEMO.While the example elaborated how the method could be im-plemented, it did not provide any insight on how N recom-mendations vary by the existing agroclimatic gradient inMixedwood Plain ecozone and by dominant soils in each re-gion. This is addressed in the current study, which aims (1) tofurther investigate how N recommendations vary by soil andclimate along the Mixedwood Plains ecozone with significantagroclimatic gradient, (2) to investigate whether there is anycommonality in N recommendation results for different soilsand regions, and (3) to identify the most fertile conditions forcultivating rainfed corn in the predominant Canadian cornproduction ecozone. The results could be used for further en-vironmental assessment of reducing reactive N caused by theadoption of recommended N based on Identifying NEMO.
2 Material and methods
2.1 Proposed steps to identify recommended N rateusing Identifying NEMO
In this study, a slope-based method proposed byMesbah et al.(2017) is used to identify NUEopt, which is then used to de-termine climate-dependentNopt values, i.e., oneNopt per grow-ing season. This NUEopt is identified by evaluating the linear-ity of the relationship between dry yield and Nopt, and thereduction in yield compared to maximum achievable yieldfor a given soil and various growing seasons. Note that the
36 Page 2 of 11 Agron. Sustain. Dev. (2018) 38: 36
dry yield can be converted to yield at 15.5% moisture (Y15.5%)when multiplied by 1.15. In this paper, the results are based ondry yield at 0% grain moisture (referred to yield from now onfor simplicity purpose). The steps taken to determine the rec-ommended N rate are:
1. Select a process-based crop model adapted for the regionof interest to simulate the response of dry yield to N ratewith a good precision.
2. Simulate the yield response to various N application ratesusing increments of 10 kg N ha−1 for a long time series ofclimatic data (e.g., 40 to 60 years).
3. Individually fit an MB-P function (Eq. 1) to the year-specific data of N rates and corresponding dry yields pre-dicted by the crop model.
MB−P : Y
¼Ymax 1−e−bN NþN inð Þ
� �N < NP
Ymax 1−e−bN NPþN inð Þ� �
N > NP
8<: ð1Þ
where Y represents the dry yield in t ha−1; Ymax is a coef-ficient representing the maximum achievable yield undertheMB-P function if there was no constraint onmaximumyield imposed by the plateau function; bN is a coefficientdirectly affecting the slope of MB-P function; NP is theminimum N rate value (kg N ha−1) resulting in maximumyield achieved at plateau; Nin is the initial amount of ni-trogen in the soil (kg N ha−1).
4. Select an NUE from a predefined NUE range (e.g., 10–20 kg yield kg−1 N) and extract YNopt–Nopt data using thefitted functions in step 3. For each NUE (slope of yieldfunction), the number of Nopt values are equal to the num-ber of climatic years. Repeat the process to generateYNopt–Nopt datasets for all NUE values in the predefinedrange.
a. Perform a linear regression using NUE-specificYNopt–Nopt data and report R2 and RMSE values,which are used as criteria for selection of NUEopt.
b. Calculate YNopt/Ymax and Ymax–YNopt values for eachgrowing season. Then, calculate the mean values ofthe two criteria for high and low yield years (e.g.,Ymax < 8 t dry yield ha−1) separately, which are alsocriteria for selection of NUEopt.
c. Repeat steps 4.a and 4.b for all NUEs from thepredefined range. Note that the YNopt–Nopt data arefor a given soil and region, or for one soil mergedover multiple regions only if they have similaragroclimatic conditions.
5. Construct a tradeoff plot showing the change in meanvalues of YNopt/Ymax and Ymax–YNopt as well as R2 and
RMSE of linear fit with change in NUE. This tradeoff plotis used to identify NUEopt which leads to a fairly good R
2
and RMSE and little reduction in yield compared to Ymax.6. Select an expected yield, and use the derived linear func-
tion fitted to YNopt–Nopt for the NUEopt, and calculate an Napplication rate, whichwe refer to recommended N for theexpected yield. Furthermore, calculate the probability ofachieving the expected yield using the time series of pre-dicted yields.
2.2 Climate variation in the Mixedwood Plainsecozone
The proposed methodology was implemented in five re-gions along the Mixedwood Plains ecozone, which extendsover 4.5o of latitude and 12o of longitude (Fig. 1). Thisecozone is the major corn production ecozone in Canadaand extends from southern Ontario to southwesternQuebec (42.3o N 83o W–46.8o N 71o W). The growingseason starts in early May/June and ends in October. Cropheat units (CHU) in the growing season are often used forrating corn cultivars (Brown and Bootsma 1993).Cumulative CHU is calculated by summation of dailyvalues from May 1st to the date when temperature dropsbelow − 2 °C for the first time. Calculation of this valuefor 48 to 68 years in the ecozone shows a large variationfrom 2200 to 4350. The CHU is in the range of 3330–4350for Windsor, 2750–3690 for London, 2510–3720 forOttawa, 2640–3580 for Saint-Hubert, and 2180–3230 forQuebec. This variation in CHU requires the use of multiplecultivars to accurately predict biomass, leaf area index, andyield across the ecozone. The lowest CHU belongs toQuebec (2200 to 3200), which is located at the margin ofthe ecozone where CHU is a major limitation on corngrowth. Cumulative precipitation is relatively high in theecozone, which allows for rainfed cropping. Nonetheless,uneven distribution of precipitation and its inter-annual var-iability might lead to days with water stress during somegrowing seasons. The cumulative precipitation fromMay toAugust is in the range of 110–450 mm for Windsor, 106–409 mm for London, 143–445 mm for Ottawa, 160–459 mm for Saint-Hubert, and 149–496 mm for Quebec.Regions in eastern part of the ecozone (Quebec and Saint-Hubert) tend to have more frequent water excess, whereasregions in the middle and western part of the ecozone(Ottawa, Windsor, and London) tend to have more episodesof water deficit. The variations in CHU and cumulativeprecipitation highlight the importance of using of a longtime series of climate data to evaluate the performance ofcrop models in simulating crop growth in response to cli-mate variation.
Agron. Sustain. Dev. (2018) 38: 36 Page 3 of 11 36

2.3 Soil selection for simulationsalong the Mixedwood Plains ecozone
For each region along the ecozone identified in Fig. 1, a 40 ×40-km area was selected to overlay soil data with corn culti-vated lands extracted from the 2013 space-based crop inven-tory (Fig. 1), and identify the most dominant soil textures. Theproperties of three contrasting soil types in each region arepresented in Table 1.
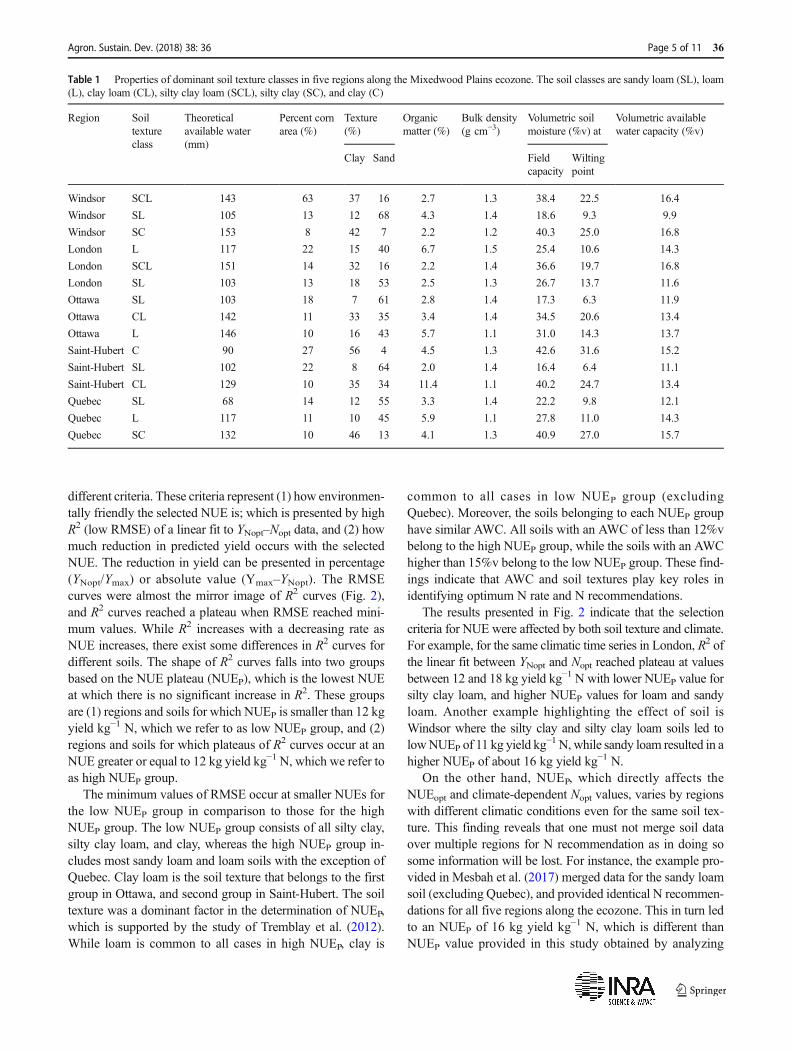
The dominant soils were identified in two steps. First, thesoils were identified within soil polygons using site-specificdata and conventional soil survey data (e.g., Canadian SoilInformation Service; CanSIS). There existed more than onesoil texture within each soil polygon, and the soil textureswere identified based on the highest (acreage) percentage ofthe soil(s) mapped within a polygon. Second, the soil withhighest areas covered by corn fields (based on 2013 data)within the selected 40 × 40-km area was selected as the mostdominant soil in each region. The percentage of areas coveredwith corn fields varied from 8 to 63% in the 5 regions(Table 1). The Saxton pedotransfer function was used to cal-culate the soil moistures at field capacity and wilting point aswell as their difference representing the available water capac-ity (AWC) (Saxton et al. 1986). These soil textures cover awide range from 7 to 56% in clay content and 4 to 68% in sandcontent, as well as a relatively wide range of AWC from 10 to17%. Three dominant soils with contrasting textures were
selected from each region and used as inputs for simulations.In total, there were 819 soil-region-years for simulation,which was performed using the STICS soil-crop model(Brisson et al. 2003; Brisson et al. 2008). The STICS modelwas previously adapted for corn cultivars properties for theMixedwood Pains ecozone (Jégo et al. 2011), and proven tobe effective in simulating yield response to N rate. For Nfertilization rates ranging from 118 to 188 kg N ha−1, themodel performed well in predicting shoot biomass and dryyield with normalized root mean square errors (NRMSE) of17.5 and 10.1% for biomass and yield respectively. The
NRMSE was defined as: 100�Offiffiffiffiffiffiffiffiffiffiffiffiffiffiffiffiffiffiffiffiffiffiffiffiffiffiffiffiffiffiffi1=n∑n
i¼1 Oi−Pið Þp2, where n is
the total number of observations, Oi is the observed value, Pi isthe simulated value, and �O is the mean observed value.Further details on modeling inputs can be found in Mesbahet al. (2017).
3 Results and discussion
3.1 NUE selection for contrasting soils in MixedwoodPlains ecozone
To help identifying NUEopt, which is used for the determina-tion of climate-dependent Nopt, the region and soil-specifictradeoff plots can be used to represent how NUE values affect
Fig. 1 Cultivated corn lands in the predominant corn production ecozoneof Canada are shown in dotted green. The cultivated lands are extractedfrom the Annual Space-Based Crop Inventory for Canada, 2013, Centre
for Agroclimate, Geomatics and Earth Observation, Science andTechnology Branch, Agriculture and Agri-Food Canada
36 Page 4 of 11 Agron. Sustain. Dev. (2018) 38: 36
different criteria. These criteria represent (1) how environmen-tally friendly the selected NUE is; which is presented by highR2 (low RMSE) of a linear fit to YNopt–Nopt data, and (2) howmuch reduction in predicted yield occurs with the selectedNUE. The reduction in yield can be presented in percentage(YNopt/Ymax) or absolute value (Ymax–YNopt). The RMSEcurves were almost the mirror image of R2 curves (Fig. 2),and R2 curves reached a plateau when RMSE reached mini-mum values. While R2 increases with a decreasing rate asNUE increases, there exist some differences in R2 curves fordifferent soils. The shape of R2 curves falls into two groupsbased on the NUE plateau (NUEP), which is the lowest NUEat which there is no significant increase in R2. These groupsare (1) regions and soils for which NUEP is smaller than 12 kgyield kg−1 N, which we refer to as low NUEP group, and (2)regions and soils for which plateaus of R2 curves occur at anNUE greater or equal to 12 kg yield kg−1 N, which we refer toas high NUEP group.
The minimum values of RMSE occur at smaller NUEs forthe low NUEP group in comparison to those for the highNUEP group. The low NUEP group consists of all silty clay,silty clay loam, and clay, whereas the high NUEP group in-cludes most sandy loam and loam soils with the exception ofQuebec. Clay loam is the soil texture that belongs to the firstgroup in Ottawa, and second group in Saint-Hubert. The soiltexture was a dominant factor in the determination of NUEP,which is supported by the study of Tremblay et al. (2012).While loam is common to all cases in high NUEP, clay is
common to all cases in low NUEP group (excludingQuebec). Moreover, the soils belonging to each NUEP grouphave similar AWC. All soils with an AWC of less than 12%vbelong to the high NUEP group, while the soils with an AWChigher than 15%v belong to the low NUEP group. These find-ings indicate that AWC and soil textures play key roles inidentifying optimum N rate and N recommendations.
The results presented in Fig. 2 indicate that the selectioncriteria for NUE were affected by both soil texture and climate.For example, for the same climatic time series in London, R2 ofthe linear fit between YNopt and Nopt reached plateau at valuesbetween 12 and 18 kg yield kg−1 N with lower NUEP value forsilty clay loam, and higher NUEP values for loam and sandyloam. Another example highlighting the effect of soil isWindsor where the silty clay and silty clay loam soils led tolowNUEP of 11 kg yield kg
−1 N, while sandy loam resulted in ahigher NUEP of about 16 kg yield kg−1 N.
On the other hand, NUEP, which directly affects theNUEopt and climate-dependent Nopt values, varies by regionswith different climatic conditions even for the same soil tex-ture. This finding reveals that one must not merge soil dataover multiple regions for N recommendation as in doing sosome information will be lost. For instance, the example pro-vided in Mesbah et al. (2017) merged data for the sandy loamsoil (excluding Quebec), and provided identical N recommen-dations for all five regions along the ecozone. This in turn ledto an NUEP of 16 kg yield kg−1 N, which is different thanNUEP value provided in this study obtained by analyzing
Table 1 Properties of dominant soil texture classes in five regions along the Mixedwood Plains ecozone. The soil classes are sandy loam (SL), loam(L), clay loam (CL), silty clay loam (SCL), silty clay (SC), and clay (C)
Region Soiltextureclass
Theoreticalavailable water(mm)
Percent cornarea (%)
Texture(%)
Organicmatter (%)
Bulk density(g cm−3)
Volumetric soilmoisture (%v) at
Volumetric availablewater capacity (%v)
Clay Sand Fieldcapacity
Wiltingpoint
Windsor SCL 143 63 37 16 2.7 1.3 38.4 22.5 16.4
Windsor SL 105 13 12 68 4.3 1.4 18.6 9.3 9.9
Windsor SC 153 8 42 7 2.2 1.2 40.3 25.0 16.8
London L 117 22 15 40 6.7 1.5 25.4 10.6 14.3
London SCL 151 14 32 16 2.2 1.4 36.6 19.7 16.8
London SL 103 13 18 53 2.5 1.3 26.7 13.7 11.6
Ottawa SL 103 18 7 61 2.8 1.4 17.3 6.3 11.9
Ottawa CL 142 11 33 35 3.4 1.4 34.5 20.6 13.4
Ottawa L 146 10 16 43 5.7 1.1 31.0 14.3 13.7
Saint-Hubert C 90 27 56 4 4.5 1.3 42.6 31.6 15.2
Saint-Hubert SL 102 22 8 64 2.0 1.4 16.4 6.4 11.1
Saint-Hubert CL 129 10 35 34 11.4 1.1 40.2 24.7 13.4
Quebec SL 68 14 12 55 3.3 1.4 22.2 9.8 12.1
Quebec L 117 11 10 45 5.9 1.1 27.8 11.0 14.3
Quebec SC 132 10 46 13 4.1 1.3 40.9 27.0 15.7
Agron. Sustain. Dev. (2018) 38: 36 Page 5 of 11 36
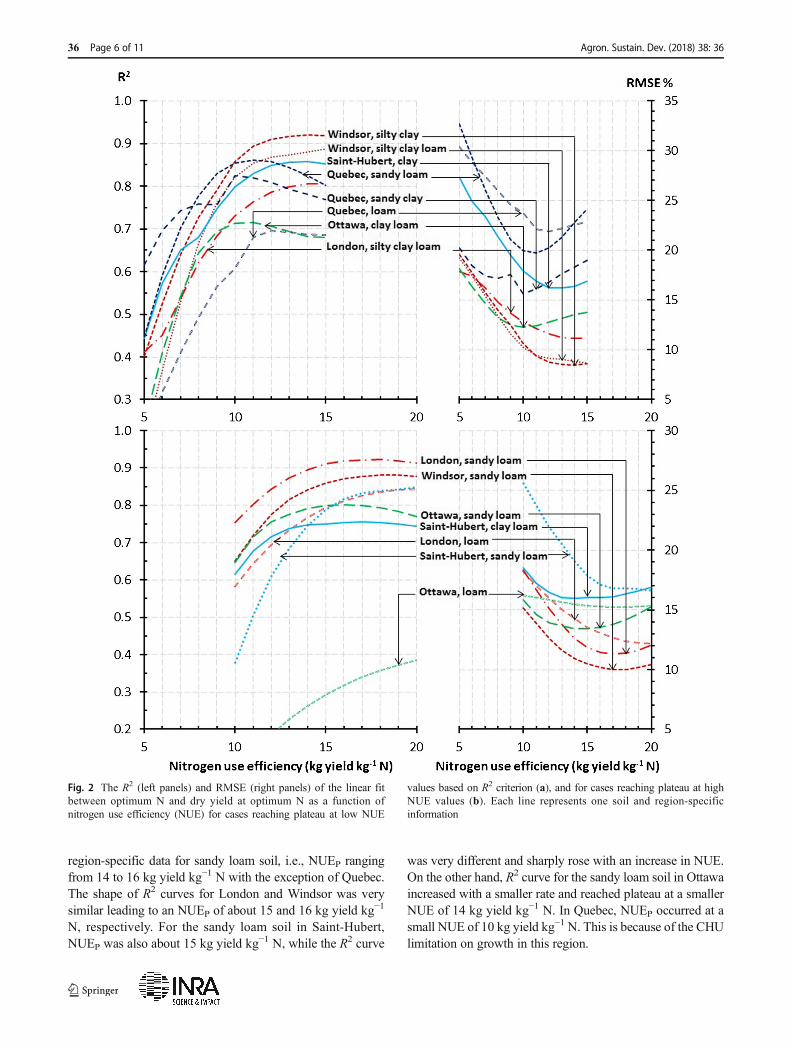
region-specific data for sandy loam soil, i.e., NUEP rangingfrom 14 to 16 kg yield kg−1 N with the exception of Quebec.The shape of R2 curves for London and Windsor was verysimilar leading to an NUEP of about 15 and 16 kg yield kg−1
N, respectively. For the sandy loam soil in Saint-Hubert,NUEP was also about 15 kg yield kg−1 N, while the R2 curve
was very different and sharply rose with an increase in NUE.On the other hand, R2 curve for the sandy loam soil in Ottawaincreased with a smaller rate and reached plateau at a smallerNUE of 14 kg yield kg−1 N. In Quebec, NUEP occurred at asmall NUE of 10 kg yield kg−1 N. This is because of the CHUlimitation on growth in this region.
Fig. 2 The R2 (left panels) and RMSE (right panels) of the linear fitbetween optimum N and dry yield at optimum N as a function ofnitrogen use efficiency (NUE) for cases reaching plateau at low NUE
values based on R2 criterion (a), and for cases reaching plateau at highNUE values (b). Each line represents one soil and region-specificinformation
36 Page 6 of 11 Agron. Sustain. Dev. (2018) 38: 36
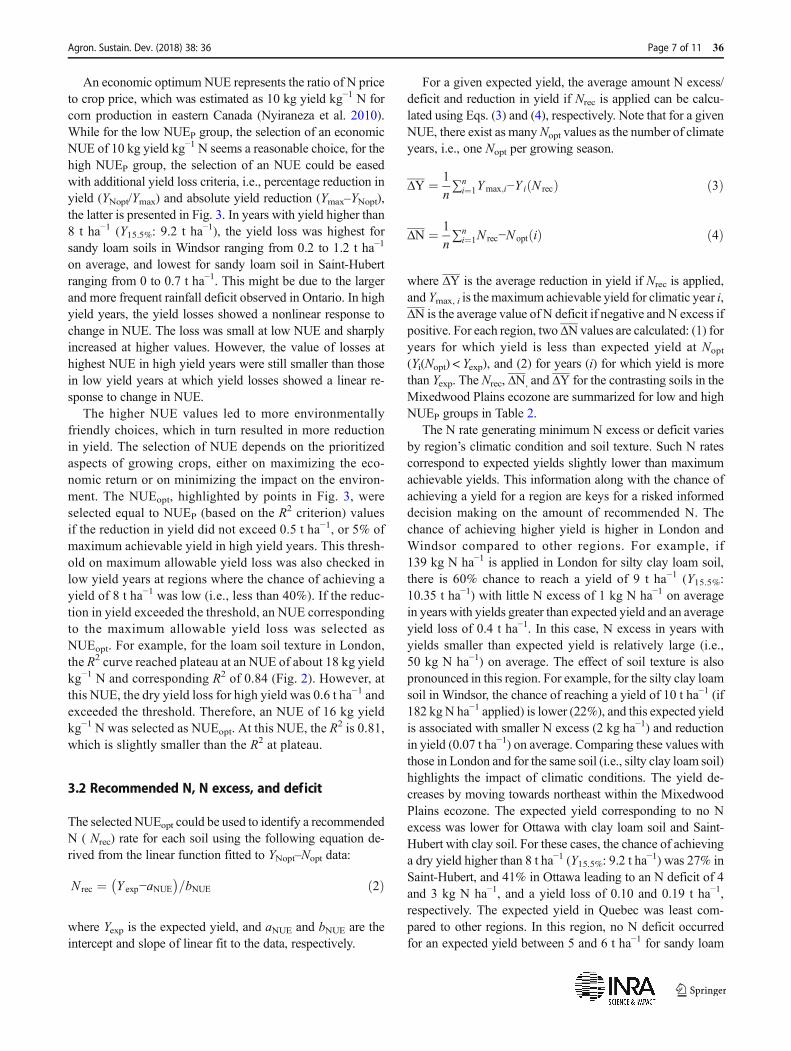
An economic optimum NUE represents the ratio of N priceto crop price, which was estimated as 10 kg yield kg−1 N forcorn production in eastern Canada (Nyiraneza et al. 2010).While for the low NUEP group, the selection of an economicNUE of 10 kg yield kg−1 N seems a reasonable choice, for thehigh NUEP group, the selection of an NUE could be easedwith additional yield loss criteria, i.e., percentage reduction inyield (YNopt/Ymax) and absolute yield reduction (Ymax–YNopt),the latter is presented in Fig. 3. In years with yield higher than8 t ha−1 (Y15.5%: 9.2 t ha−1), the yield loss was highest forsandy loam soils in Windsor ranging from 0.2 to 1.2 t ha−1
on average, and lowest for sandy loam soil in Saint-Hubertranging from 0 to 0.7 t ha−1. This might be due to the largerand more frequent rainfall deficit observed in Ontario. In highyield years, the yield losses showed a nonlinear response tochange in NUE. The loss was small at low NUE and sharplyincreased at higher values. However, the value of losses athighest NUE in high yield years were still smaller than thosein low yield years at which yield losses showed a linear re-sponse to change in NUE.
The higher NUE values led to more environmentallyfriendly choices, which in turn resulted in more reductionin yield. The selection of NUE depends on the prioritizedaspects of growing crops, either on maximizing the eco-nomic return or on minimizing the impact on the environ-ment. The NUEopt, highlighted by points in Fig. 3, wereselected equal to NUEP (based on the R2 criterion) valuesif the reduction in yield did not exceed 0.5 t ha−1, or 5% ofmaximum achievable yield in high yield years. This thresh-old on maximum allowable yield loss was also checked inlow yield years at regions where the chance of achieving ayield of 8 t ha−1 was low (i.e., less than 40%). If the reduc-tion in yield exceeded the threshold, an NUE correspondingto the maximum allowable yield loss was selected asNUEopt. For example, for the loam soil texture in London,the R2 curve reached plateau at an NUE of about 18 kg yieldkg−1 N and corresponding R2 of 0.84 (Fig. 2). However, atthis NUE, the dry yield loss for high yield was 0.6 t ha−1 andexceeded the threshold. Therefore, an NUE of 16 kg yieldkg−1 N was selected as NUEopt. At this NUE, the R
2 is 0.81,which is slightly smaller than the R2 at plateau.
3.2 Recommended N, N excess, and deficit
The selected NUEopt could be used to identify a recommendedN ( Nrec) rate for each soil using the following equation de-rived from the linear function fitted to YNopt–Nopt data:
N rec ¼ Y exp−aNUE� �
=bNUE ð2Þ
where Yexp is the expected yield, and aNUE and bNUE are theintercept and slope of linear fit to the data, respectively.
For a given expected yield, the average amount N excess/deficit and reduction in yield if Nrec is applied can be calcu-lated using Eqs. (3) and (4), respectively. Note that for a givenNUE, there exist as manyNopt values as the number of climateyears, i.e., one Nopt per growing season.
ΔY ¼ 1
n∑n
i¼1Ymax;i−Y i N recð Þ ð3Þ
ΔN ¼ 1
n∑n
i¼1N rec−N opt ið Þ ð4Þ
where ΔY is the average reduction in yield if Nrec is applied,and Ymax, i is themaximum achievable yield for climatic year i,ΔN is the average value of N deficit if negative and N excess ifpositive. For each region, two ΔN values are calculated: (1) foryears for which yield is less than expected yield at Nopt
(Yi(Nopt) < Yexp), and (2) for years (i) for which yield is morethan Yexp. The Nrec, ΔN, and ΔY for the contrasting soils in theMixedwood Plains ecozone are summarized for low and highNUEP groups in Table 2.
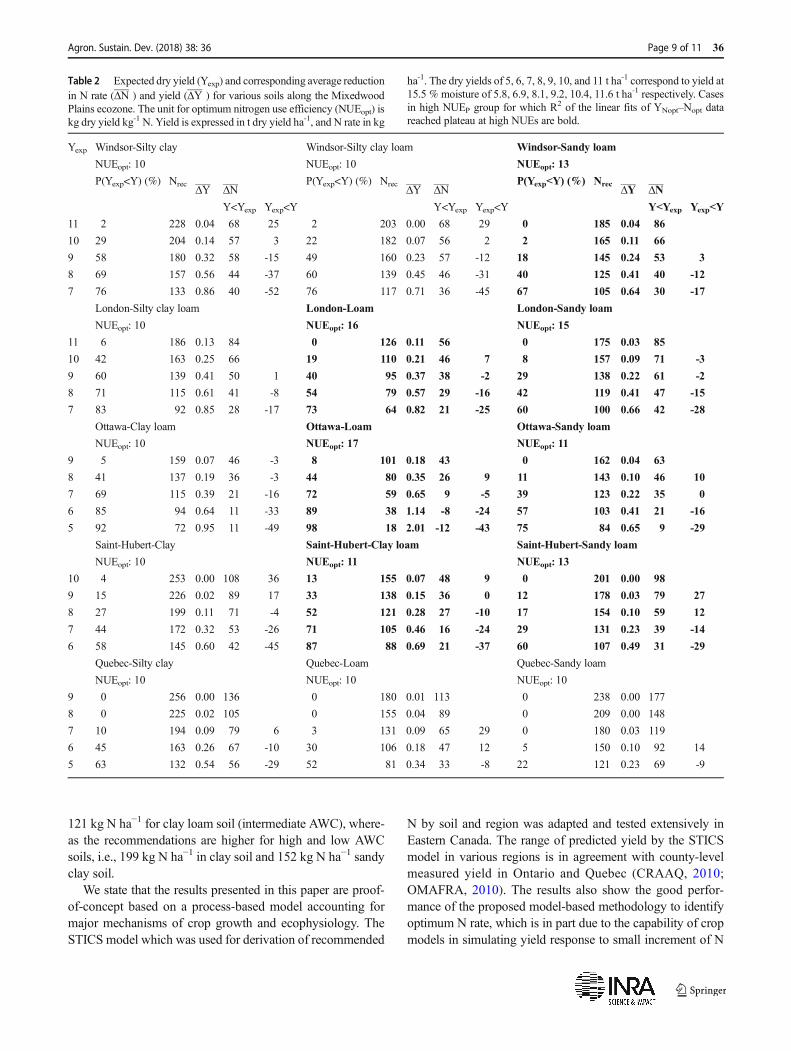
The N rate generating minimum N excess or deficit variesby region’s climatic condition and soil texture. Such N ratescorrespond to expected yields slightly lower than maximumachievable yields. This information along with the chance ofachieving a yield for a region are keys for a risked informeddecision making on the amount of recommended N. Thechance of achieving higher yield is higher in London andWindsor compared to other regions. For example, if139 kg N ha−1 is applied in London for silty clay loam soil,there is 60% chance to reach a yield of 9 t ha−1 (Y15.5%:10.35 t ha−1) with little N excess of 1 kg N ha−1 on averagein years with yields greater than expected yield and an averageyield loss of 0.4 t ha−1. In this case, N excess in years withyields smaller than expected yield is relatively large (i.e.,50 kg N ha−1) on average. The effect of soil texture is alsopronounced in this region. For example, for the silty clay loamsoil in Windsor, the chance of reaching a yield of 10 t ha−1 (if182 kgN ha−1 applied) is lower (22%), and this expected yieldis associated with smaller N excess (2 kg ha−1) and reductionin yield (0.07 t ha−1) on average. Comparing these values withthose in London and for the same soil (i.e., silty clay loam soil)highlights the impact of climatic conditions. The yield de-creases by moving towards northeast within the MixedwoodPlains ecozone. The expected yield corresponding to no Nexcess was lower for Ottawa with clay loam soil and Saint-Hubert with clay soil. For these cases, the chance of achievinga dry yield higher than 8 t ha−1 (Y15.5%: 9.2 t ha
−1) was 27% inSaint-Hubert, and 41% in Ottawa leading to an N deficit of 4and 3 kg N ha−1, and a yield loss of 0.10 and 0.19 t ha−1,respectively. The expected yield in Quebec was least com-pared to other regions. In this region, no N deficit occurredfor an expected yield between 5 and 6 t ha−1 for sandy loam
Agron. Sustain. Dev. (2018) 38: 36 Page 7 of 11 36

and loam soils, and between 6 and 7 t ha−1 for silty clay soil.To achieve such low yield in this region, relatively highamount of N was required. For example, 163 kg N ha−1 wasrequired to reach a yield of 6 t ha−1 in Quebec, which confirmsthat this is a marginal region for grain corn production.
While the NUEopt for all cases in low NUEP group wasselected as 10 kg dry yield kg−1 N, the selection of NUEoptfor high NUEP group was based on an additional constraintlimiting the reduction in yield to 0.5 t ha−1 or 5% of maximumachievable yield. Out of 7 cases in this group, 3 cases wereevaluated by setting a yield loss threshold on low yield years(i.e., Ottawa-sandy loam, Saint-Hubert-clay loam, and Saint-Hubert-sandy loam) as they had low chance of achieving ayield of 8 t ha−1. For London-sandy loam, the average yieldloss in high yield years at NUEP was below the threshold andthus NUEP was selected as NUEopt (Fig. 3). For the othercases, the NUEopt was slightly reduced from NUEP to meetthe second criteria. For these cases, an expected yield of9 t ha−1 led to least N deficit/excess in Windsor and London,while a lower expected yield of 7 t ha−1 led to least N excess/deficit in Ottawa (Table 2). In Saint-Hubert, while the least Nexcess/deficit belonged to an expected yield of 9 t ha−1 forclay loam, and 7.5 t ha−1 for sandy loam soil, the amount of
recommended N for both soil was similar (e.g., about140 kg N ha−1). The recommended N values for loam soilswere significantly smaller as compared to sandy loam soils.For instance, a yield of 9 t ha−1 could be achieved in Londonby applying a recommended N of 138 kg N ha−1 in sandyloam soil, or by a significantly lower N rate of 95 kg N ha−1
in loam soil. In London, while the chance of achieving a yieldof 9 t ha−1 yield in loam was 40%, which is higher than that insandy loam soil (29%), the fact that sandy loam soil neededabout 60 kg N ha−1 more N fertilizer for the same yield sug-gested that loam soil might be a more environmentally friend-ly option for corn cultivation. This is due to the fact that loamis a soil with intermediate AWC (i.e., between 12 and 15%v).Our results show that for all locations, except Quebec, soilswith intermediate AWC are better for corn cultivation becausein these soils the chance of achieving a given yield is highestwhile the N recommendations are lowest compared to soilswith high or low AWC (i.e., AWC higher than 15%v or lowerthan 12%v). For example in Saint-Hubert, the likelihood ofachieving an expected yield of 8 t ha−1 is 52% for clay loamsoil (intermediate AWC), whereas this likelihood is lower inclay soil (27%) with high AWC, and sandy loam soil (17%)with low AWC. Moreover, the recommendation is
Fig. 3 Average difference in maximum dry yield (Ymax) and dry yield atNopt (YNopt) for various soils along the Mixedwood Plains ecozonecalculated for low yield years (left panels) and high yield years (right
panels) for the high NUEP group. Each line represents one soil andregion specific information. The highlighted point on each linecorresponds to the optimum nitrogen use efficiency
36 Page 8 of 11 Agron. Sustain. Dev. (2018) 38: 36
121 kg N ha−1 for clay loam soil (intermediate AWC), where-as the recommendations are higher for high and low AWCsoils, i.e., 199 kg N ha−1 in clay soil and 152 kg N ha−1 sandyclay soil.
We state that the results presented in this paper are proof-of-concept based on a process-based model accounting formajor mechanisms of crop growth and ecophysiology. TheSTICS model which was used for derivation of recommended
N by soil and region was adapted and tested extensively inEastern Canada. The range of predicted yield by the STICSmodel in various regions is in agreement with county-levelmeasured yield in Ontario and Quebec (CRAAQ, 2010;OMAFRA, 2010). The results also show the good perfor-mance of the proposed model-based methodology to identifyoptimum N rate, which is in part due to the capability of cropmodels in simulating yield response to small increment of N
Table 2 Expected dry yield (Yexp) and corresponding average reductionin N rate (ΔN ) and yield (ΔY ) for various soils along the MixedwoodPlains ecozone. The unit for optimum nitrogen use efficiency (NUEopt) iskg dry yield kg-1 N. Yield is expressed in t dry yield ha-1, and N rate in kg
ha-1. The dry yields of 5, 6, 7, 8, 9, 10, and 11 t ha-1 correspond to yield at15.5 % moisture of 5.8, 6.9, 8.1, 9.2, 10.4, 11.6 t ha-1 respectively. Casesin high NUEP group for which R2 of the linear fits of YNopt–Nopt datareached plateau at high NUEs are bold.
Yexp Windsor-Silty clay Windsor-Silty clay loam Windsor-Sandy loam
NUEopt: 10 NUEopt: 10 NUEopt: 13
P(Yexp<Y) (%) Nrec ΔY ΔNP(Yexp<Y) (%) Nrec ΔY ΔN
P(Yexp<Y) (%) Nrec ΔY ΔNY<Yexp Yexp<Y Y<Yexp Yexp<Y Y<Yexp Yexp<Y
11 2 228 0.04 68 25 2 203 0.00 68 29 0 185 0.04 86
10 29 204 0.14 57 3 22 182 0.07 56 2 2 165 0.11 66
9 58 180 0.32 58 -15 49 160 0.23 57 -12 18 145 0.24 53 3
8 69 157 0.56 44 -37 60 139 0.45 46 -31 40 125 0.41 40 -12
7 76 133 0.86 40 -52 76 117 0.71 36 -45 67 105 0.64 30 -17
London-Silty clay loam London-Loam London-Sandy loam
NUEopt: 10 NUEopt: 16 NUEopt: 15
11 6 186 0.13 84 0 126 0.11 56 0 175 0.03 85
10 42 163 0.25 66 19 110 0.21 46 7 8 157 0.09 71 -3
9 60 139 0.41 50 1 40 95 0.37 38 -2 29 138 0.22 61 -2
8 71 115 0.61 41 -8 54 79 0.57 29 -16 42 119 0.41 47 -15
7 83 92 0.85 28 -17 73 64 0.82 21 -25 60 100 0.66 42 -28
Ottawa-Clay loam Ottawa-Loam Ottawa-Sandy loam
NUEopt: 10 NUEopt: 17 NUEopt: 11
9 5 159 0.07 46 -3 8 101 0.18 43 0 162 0.04 63
8 41 137 0.19 36 -3 44 80 0.35 26 9 11 143 0.10 46 10
7 69 115 0.39 21 -16 72 59 0.65 9 -5 39 123 0.22 35 0
6 85 94 0.64 11 -33 89 38 1.14 -8 -24 57 103 0.41 21 -16
5 92 72 0.95 11 -49 98 18 2.01 -12 -43 75 84 0.65 9 -29
Saint-Hubert-Clay Saint-Hubert-Clay loam Saint-Hubert-Sandy loam
NUEopt: 10 NUEopt: 11 NUEopt: 13
10 4 253 0.00 108 36 13 155 0.07 48 9 0 201 0.00 98
9 15 226 0.02 89 17 33 138 0.15 36 0 12 178 0.03 79 27
8 27 199 0.11 71 -4 52 121 0.28 27 -10 17 154 0.10 59 12
7 44 172 0.32 53 -26 71 105 0.46 16 -24 29 131 0.23 39 -14
6 58 145 0.60 42 -45 87 88 0.69 21 -37 60 107 0.49 31 -29
Quebec-Silty clay Quebec-Loam Quebec-Sandy loam
NUEopt: 10 NUEopt: 10 NUEopt: 10
9 0 256 0.00 136 0 180 0.01 113 0 238 0.00 177
8 0 225 0.02 105 0 155 0.04 89 0 209 0.00 148
7 10 194 0.09 79 6 3 131 0.09 65 29 0 180 0.03 119
6 45 163 0.26 67 -10 30 106 0.18 47 12 5 150 0.10 92 14
5 63 132 0.54 56 -29 52 81 0.34 33 -8 22 121 0.23 69 -9
Agron. Sustain. Dev. (2018) 38: 36 Page 9 of 11 36

with high accuracy. Future research should design factorialexperiments with small incremental N application rates, andverify the model-based N recommendations. The next stepwould be to predict the potential reduction of nitrous oxideand ammonia emissions, and nitrate leaching brought byadopting those N recommendations, using verified process-based models. It should be noted that the proposed methoddid not account for split N application; however, our simula-tions (not shown) indicated that split application had minoreffect on the results presented in this paper. It is worth men-tioning that N recommendations presented in this paper aredifferent than tactical approaches such as Adapt-N (Moebius-Clune et al. 2013; Sela et al. 2016) under which N is recom-mended within season, based on the time and location of Ndeficit occurrence. Identifying NEMO is rather a strategic ap-proach, which looks at the historical variations in daily climat-ic data; predicts the probability of achieving any expectedyield; and provides general guidelines for N recommendationsfor the region of interest, given soil and expected yield. Itshould be noted that these strategic N recommendations arefor the beginning of the season when the upcoming weathercondition is uncertain. While this uncertainty could make thedecision-making process very challenging, our approachcould partly reduce such uncertainty by looking at the generaltrends in weather conditions for a given region. The proposedmethodology could be implemented in other regions and forother rainfed crops provided that a crop model is adapted andcould predict the yield response to N with good accuracy.
4 Conclusion
The ecophysiological optimum N rates vary by soil textureand along the agroclimatic gradient. The inter-annual climatevariations dominate the amount of N application rates neededby the crop for each growing season. An important question isthen at what N rate the ecophysiological optima occur.Because the growing season weather is not known for a givenseason, a recently developed model-based methodology wasused for an in-depth analysis on the impact of soils and climateon optimum N rate along the Mixedwood Plains ecozone ofEastern Canada where there exists a gradient of agroclimaticconditions.
Application of Identifying NEMO in predominantCanadian corn production ecozone revealed some new in-sights on sustainable N recommendations. It was found thatN recommendationmust be region and soil specific as soil andclimate have interactive impacts on the optimum N rate. Ourresults indicated that the NUEopt was often higher for soilscontaining loam, and lower for soil containing clay. Anotherimportant factor was the AWC of soils. NUEopt was higher forsoils with AWC of less than 12%v, and lower for soils withAWC higher than 15%v. The predictions also indicated that N
rate leading to minimum N excess or deficit vary by regionand soil, which highlights that the expected yield must beselected based on region and soil. The soils showing interme-diate AWC needed the lowest recommended N while havinghigh expected yields. This study is a first step using model-based N rate recommendations accounting for climate varia-tions, and the conclusions need to be further verified withexperimental studies to confirm the trends.
Acknowledgements The authors thank René Morissette for his assis-tance in processing of simulation results.
Funding information The study was funded by Agriculture and Agri-Food Canada Sustainable Science and Technology Advancement initia-tive project J-001318 - Improve N sustainability of field crops and J-000106 Development of decision-support components for optimal N fer-tilizer applications at the field scale.
Compliance with ethical standards
Conflict of interest The authors declare that they have no conflict ofinterest.
References
Basso B, Ritchie JT, Cammarano D, Sartori L (2011) A strategic andtactical management approach to select optimal N fertilizer ratesfor wheat in a spatially variable field. Eur J Agron 35(4):215–222.https://doi.org/10.1016/j.eja.2011.06.004
Bock BR (1984) Efficient use of nitrogen in cropping systems. In: HauckRD (ed), Nitrogen in crop production. Am Soc Agron, MadisonWI,pp 273–294
Brisson N, Gary C, Justes E, Roche R (2003) An overview of the cropmodel STICS. Eur J Agron 18:309–332. https://doi.org/10.1016/S1161-0301(02)00110-7
Brisson N, Launay M, Mary B, Beaudoin N (2008) Conceptual basis,formalisations and parameterization of the STICS crop model.Editions Quae, Versailles
Brown D, Bootsma A (1993) Crop heat units for corn and other warmseason crops in Ontario. Publ. 111/31, Ontario Ministry ofAgriculture, Food and Rural Affairs, Ottawa ON
CRAAQ (2010) Guide de référence en fertilisation. 2nd ed. (In French.)Centre de référence en Agriculture et Agroalimentaire du Québec,Québec QC
Dobermann A (2005) Nitrogen use efficiency—state of the art. IFA in-ternational workshop on enhanced-efficiency fertilizers, FrankfurtGermany
Dumont B, Basso B, Bodson B, Destain JP, DestainMF (2016) Assessingand modeling economic and environmental impact of wheat nitro-gen management in Belgium. Environ Model Softw 79:184–196.https://doi.org/10.1016/j.envsoft.2016.02.015
Erisman JW, Bleeker A, Galloway J, SuttonMS (2007) Reduced nitrogenin ecology and the environment. Environ Pollut 150:140–149.https://doi.org/10.1016/j.envpol.2007.06.033
Van Es HM, Kay BD, Melkonian JJ, Sogbedji JM (2007) Nitrogen man-agement for maize in humid regions: Case for a dynamic modelingapproach. In: Bruulsema TW (ed) Managing Crop Nitrogen forWeather: Proceedings of the Symposium “Integrating WeatherVariability into Nitrogen Recommendations,.” Int. Plant Nutr. Inst.,Norcross, GA., N. 15 Nov. 2006, pp 6–13
36 Page 10 of 11 Agron. Sustain. Dev. (2018) 38: 36

FAOSTAT (2011) Food and Agriculture Organization of the United NationsFoley JA, Ramankutty N, BraumanKA, Cassidy ES, Gerber JS, Johnston
M et al (2011) Solutions for a cultivated planet. Nature 478:337–342. https://doi.org/10.1038/nature10452
Galloway JN, Aber JD, Erisman JW, Seitzinger SP, Howarth RW,Cowling EB, Cosby BJ (2003) The nitrogen cascade. Bioscience53:341–356. https://doi.org/10.1017/CBO9781107415324.004
Hyytiäinen K, Niemi JK, Koikkalainen K, Palosuo T, Salo T (2011)Adaptive optimization of crop production and nitrogen leachingabatement under yield uncertainty. Agric Syst 104:634–644.https://doi.org/10.1016/j.agsy.2011.06.006
Jégo G, Pattey E, Bourgeois G, Drury CF, Tremblay N (2011) Evaluationof the STICS crop growth model with maize cultivar parameterscalibrated for Eastern Canada. Agron Sustain Dev 31:557–570.https://doi.org/10.1007/s13593-011-0014-4
MamoM, Malzer GL, Mulla DJ, Huggins DR, Strock J (2003) Spatial andtemporal variation in economically optimum nitrogen rate for corn.Agron J 95:958–964. https://doi.org/10.2134/agronj2003.9580
Melkonian J, van Es HM , DeGaetano AT, Sogbedji JM, Joseph L,Bruulsema T (2007) Application of dynamic simulation modelingfor nitrogen management in maize. In: Bruulsema TW (ed)Managing crop nitrogen for weather: proceedings of the symposium“integrating weather variability into nitrogen recommendations,.”Int. Plant Nutr. Inst., Indianapolis IN.5 Nov. 2006, pp 14–22
Mesbah M, Pattey E, Jégo G (2017) A model-based methodology toderive optimum nitrogen rates for rainfed crops—a case study forcorn using STICS in Canada. Comput Electron Agric 142:572–584.https://doi.org/10.1016/j.compag.2017.11.011
Moebius-Clune BN, Van Es HM, Melkonian J (2013) Adapt-N usesmodels and weather data to improve nitrogen management for corn.Better Crops 97:7–9
N’Dayegamiye A, Whalen JK, Tremblay G, Nyiraneza J, Grenier M,Drapeau A, Bipfubusa M (2015) The benefits of legume crops oncorn and wheat yield, nitrogen nutrition, and soil properties im-provement. Agron J 107:1653–1665. https://doi.org/10.2134/agronj14.0416
Nyiraneza J, N’Dayegamiye A, Gasser MO, Giroux M, Grenier M,Landry C, Guertin S (2010) Soil and crop parameters related to cornnitrogen response in eastern Canada. Agron J 102:1478–1490.https://doi.org/10.2134/agronj2009.0458
OMAFRA (2010) Corn nitrogen rate worksheet: general recommendednitrogen rates for corn. Ontario Ministry of Agriculture, Food, andRural Aff airs, Guelph, ON. http://www.gocorn.net/v2006/Ncalc/General%20Recommended%20Nitrogen%20Rates%20for%20Corn%202010.pdf (accessed 24 Nov. 2017)
Raun WR, Solie JB, Stone ML, Martin KL, Freeman KW, Mullen RWetal (2005) Optical sensor-based algorithm for crop nitrogen fertiliza-tion. Commun Soil Sci Plant Anal 36:2759–2781. https://doi.org/10.1080/00103620500303988
Saxton KE, Rawls WJ, Romberger JS, Papendick RI (1986) Estimatinggeneralized soil-water characteristics from texture. Soil Sci Soc AmJ 50:1031–1036 . h t tps : / /do i .o rg /10 .2136/s ssa j1986 .03615995005000040054x
Sela S, Van Es HM, Moebius-Clune BN et al (2016) Adapt-N outper-forms grower-selected nitrogen rates in Northeast and MidwestUSA strip trials. Agron J 108:1726–1734. https://doi.org/10.2134/agronj2015.0606
Shanahan JF, Kitchen NR, RaunWR, Schepers JS (2008) Responsive in-season nitrogen management for cereals. 61:51–62. doi: https://doi.org/10.1016/j.compag.2007.06.006
Statistics Canada (2015) Corn: Canada’s third most valuable crop.Canadian agriculture at a glance. In: Report 96–325-X
Tremblay N, Bouroubi YM, Bélec C, Mullen RW, Kitchen NR,Thomason WE (2012) Corn response to nitrogen is influenced bysoil texture andweather. Agron J 104:1658–1671. https://doi.org/10.2134/agronj2012.0184
Zhang X, Davidson EA, Mauzerall DL, Searchinger TD, Dumas P, ShenY (2015) Managing nitrogen for sustainable development. Nature528:51–59. https://doi.org/10.1038/nature15743
Zhu Q, Schmidt JP, Lin HS, Sripada RP (2009) Hydropedological pro-cesses and their implications for nitrogen availability to corn.Geoderma 154:111–122. https://doi.org/10.1016/j.geoderma.2009.10.004
Agron. Sustain. Dev. (2018) 38: 36 Page 11 of 11 36
Related Documents