NAICS CLAIMS DESCRIPTION Percentage of Weekly Claims Percent of Industry Total Employment 561 1,717 Administrative and support services 6.1% 0.6% 611 1,511 Educational services 5.4% 0.6% 921 1,510 State Government 5.4% 1.1% 722 1,047 Food service and drinking places 3.7% 0.4% 621 680 Ambulatory health care services (Dr. and Dentist offices) 2.4% 0.3% 541 665 Professional, sci., and tech.services (lawyers, accts., engineers, archt, sci.research) 2.4% 0.2% 238 572 Specialty trade contractors 2.0% 0.5% 624 458 Social assistance 1.6% 0.4% 623 342 Nursing and residential care facilities 1.2% 0.3% 445 315 Food and beverage stores 1.1% 0.3% 485 314 Transit and ground passenger transportation 1.1% 1.2% 423 301 Merchant Wholesalers, Durable Goods 1.1% 0.3% 493 291 Warehousing and storage 1.0% 0.5% 452 284 General Merchandise Stores 1.0% 0.4% 622 245 Hospitals 0.9% 0.1% 424 237 Merchant Wholesalers, Nondurable Goods 0.8% 0.3% 448 222 Clothing and clothing accessory stores 0.8% 0.5% 237 198 Heavy and civil engineering construction 0.7% 0.8% 551 195 Management of companies 0.7% 0.2% 812 192 Personal and laundry services (Hair, nail salons, barbers, dry cleaners) 0.7% 0.3% Prepared by: NJDOL, Office of Research and Information, Division of Economic & Demographic Research 8/24/20 NAICS CLAIMS DESCRIPTION Percentage of Total Claims Percent of Industry Total Employment 722 126,117 Food service and drinking places 8.5% 45.0% 561 101,457 Administrative and support services 6.8% 36.5% 621 91,479 Ambulatory health care services (Dr. and Dentist offices) 6.1% 37.7% 611 54,186 Educational services 3.6% 19.8% 812 43,203 Personal and laundry services (Hair, nail salons, barbers, dry cleaners) 2.9% 66.6% 541 42,442 Professional, sci., and tech.services (lawyers, accts., engineers, archt, sci.research) 2.8% 13.9% 238 40,290 Specialty trade contractors 2.7% 37.6% 624 36,524 Social assistance 2.5% 33.4% 721 34,863 Accommodations 2.3% 61.0% 921 33,505 State Government 2.2% 24.8% 448 30,025 Clothing and clothing accessory stores 2.0% 64.3% 441 28,538 Motor vehicle and parts dealers 1.9% 57.2% 423 25,735 Merchant Wholesalers, Durable Goods 1.7% 23.4% 452 25,529 General Merchandise Stores 1.7% 36.7% 713 24,218 Amusement, gambling, recreation 1.6% 33.9% 485 21,485 Transit and ground passenger transportation 1.4% 81.4% 424 19,995 Merchant Wholesalers, Nondurable Goods 1.3% 21.8% 445 17,635 Food and beverage stores 1.2% 15.6% 622 15,679 Hospitals 1.1% 9.5% 493 14,275 Warehousing and storage 1.0% 23.3% New Jersey Initial Unemployment Claims by Industry - week ending 8/22/20 Prepared by: NJDOL, Office of Research and Information, Division of Economic & Demographic Research 8/24/20 New Jersey Initial Unemployment Claims by Industry - 3/15 - 8/22/20

Welcome message from author
This document is posted to help you gain knowledge. Please leave a comment to let me know what you think about it! Share it to your friends and learn new things together.
Transcript
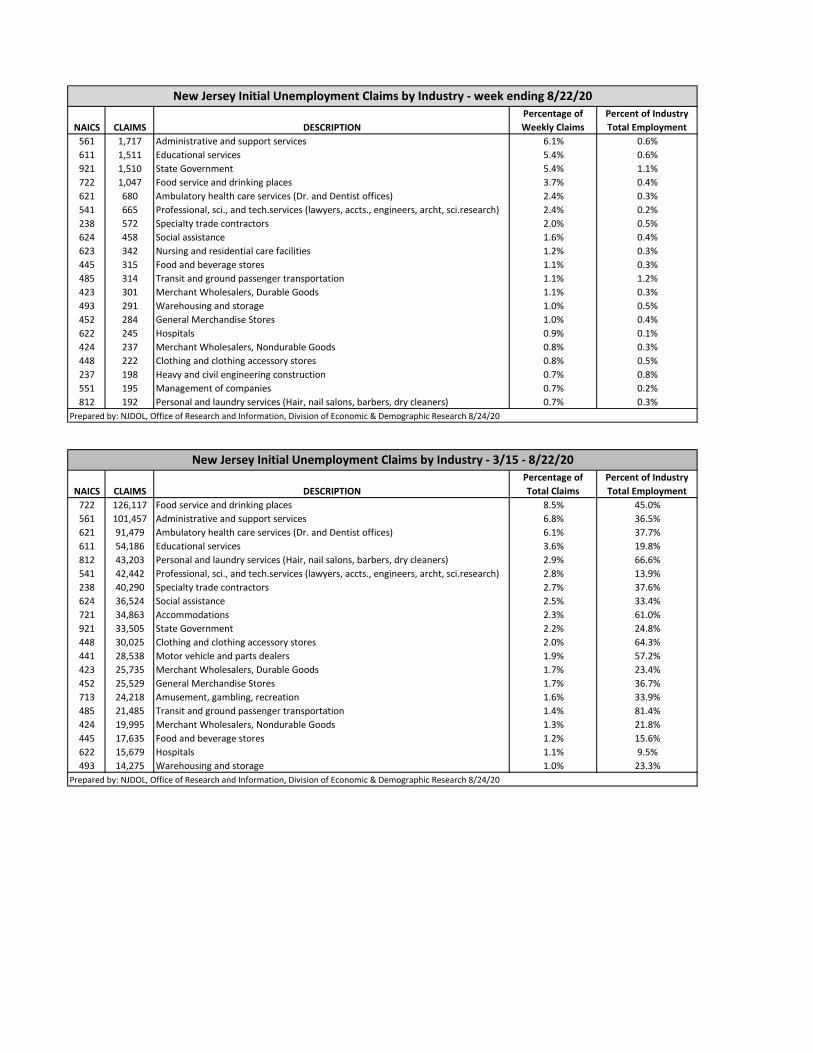
NAICS CLAIMS DESCRIPTION
Percentage of
Weekly Claims
Percent of Industry
Total Employment
561 1,717 Administrative and support services 6.1% 0.6%
611 1,511 Educational services 5.4% 0.6%
921 1,510 State Government 5.4% 1.1%
722 1,047 Food service and drinking places 3.7% 0.4%
621 680 Ambulatory health care services (Dr. and Dentist offices) 2.4% 0.3%
541 665 Professional, sci., and tech.services (lawyers, accts., engineers, archt, sci.research) 2.4% 0.2%
238 572 Specialty trade contractors 2.0% 0.5%
624 458 Social assistance 1.6% 0.4%
623 342 Nursing and residential care facilities 1.2% 0.3%
445 315 Food and beverage stores 1.1% 0.3%
485 314 Transit and ground passenger transportation 1.1% 1.2%
423 301 Merchant Wholesalers, Durable Goods 1.1% 0.3%
493 291 Warehousing and storage 1.0% 0.5%
452 284 General Merchandise Stores 1.0% 0.4%
622 245 Hospitals 0.9% 0.1%
424 237 Merchant Wholesalers, Nondurable Goods 0.8% 0.3%
448 222 Clothing and clothing accessory stores 0.8% 0.5%
237 198 Heavy and civil engineering construction 0.7% 0.8%
551 195 Management of companies 0.7% 0.2%
812 192 Personal and laundry services (Hair, nail salons, barbers, dry cleaners) 0.7% 0.3%
Prepared by: NJDOL, Office of Research and Information, Division of Economic & Demographic Research 8/24/20
NAICS CLAIMS DESCRIPTION
Percentage of
Total Claims
Percent of Industry
Total Employment
722 126,117 Food service and drinking places 8.5% 45.0%
561 101,457 Administrative and support services 6.8% 36.5%
621 91,479 Ambulatory health care services (Dr. and Dentist offices) 6.1% 37.7%
611 54,186 Educational services 3.6% 19.8%
812 43,203 Personal and laundry services (Hair, nail salons, barbers, dry cleaners) 2.9% 66.6%
541 42,442 Professional, sci., and tech.services (lawyers, accts., engineers, archt, sci.research) 2.8% 13.9%
238 40,290 Specialty trade contractors 2.7% 37.6%
624 36,524 Social assistance 2.5% 33.4%
721 34,863 Accommodations 2.3% 61.0%
921 33,505 State Government 2.2% 24.8%
448 30,025 Clothing and clothing accessory stores 2.0% 64.3%
441 28,538 Motor vehicle and parts dealers 1.9% 57.2%
423 25,735 Merchant Wholesalers, Durable Goods 1.7% 23.4%
452 25,529 General Merchandise Stores 1.7% 36.7%
713 24,218 Amusement, gambling, recreation 1.6% 33.9%
485 21,485 Transit and ground passenger transportation 1.4% 81.4%
424 19,995 Merchant Wholesalers, Nondurable Goods 1.3% 21.8%
445 17,635 Food and beverage stores 1.2% 15.6%
622 15,679 Hospitals 1.1% 9.5%
493 14,275 Warehousing and storage 1.0% 23.3%
New Jersey Initial Unemployment Claims by Industry - week ending 8/22/20
Prepared by: NJDOL, Office of Research and Information, Division of Economic & Demographic Research 8/24/20
New Jersey Initial Unemployment Claims by Industry - 3/15 - 8/22/20

SIZE CLASS CLAIMS % of Total CLAIMS % of Total
Unknown 13,017 46.56% 381,093 25.57%
5 or less 1,067 3.82% 134,900 9.05%
6 to 10 624 2.23% 75,905 5.09%
11 to 25 1,289 4.61% 129,480 8.69%
26 to 50 1,198 4.29% 110,198 7.39%
51 to 100 1,313 4.70% 102,804 6.90%
101 to 500 3,425 12.25% 229,343 15.39%
Over 500 6,024 21.55% 326,562 21.91%
Week Ending 8/22/20
Claimants by Company Size Class 3Q2019
3/15/20 - 8/22/20
Prepared by: NJDOL, Office of Research and Information, Division of Economic & Demographic Research
8/24/20

County of Residence Claims Percent of Total County of Residence Claims Percent of Total
Atlantic 818 2.9% Atlantic 69,923 4.7%
Bergen 2,116 7.6% Bergen 140,433 9.4%
Burlington 1,393 5.0% Burlington 65,933 4.4%
Camden 1,817 6.5% Camden 83,620 5.6%
Cape May 210 0.8% Cape May 15,168 1.0%
Cumberland 482 1.7% Cumberland 22,206 1.5%
Essex 2,964 10.6% Essex 128,140 8.6%
Gloucester 887 3.2% Gloucester 45,796 3.1%
Hudson 1,882 6.7% Hudson 100,031 6.7%
Hunterdon 265 0.9% Hunterdon 15,105 1.0%
Mercer 1,414 5.1% Mercer 51,701 3.5%
Middlesex 2,282 8.2% Middlesex 126,856 8.5%
Monmouth 1,493 5.3% Monmouth 99,708 6.7%
Morris 1,010 3.6% Morris 67,452 4.5%
Ocean 1,418 5.1% Ocean 96,771 6.5%
Passaic 1,948 7.0% Passaic 104,391 7.0%
Salem 210 0.8% Salem 8,481 0.6%
Somerset 848 3.0% Somerset 43,584 2.9%
Sussex 345 1.2% Sussex 23,508 1.6%
Union 1,708 6.1% Union 86,708 5.8%
Warren 289 1.0% Warren 15,138 1.0%
New Jersey Total 25,799 92.3% New Jersey Total 1,410,653 94.7%
Out-of-State Filers 2,158 7.7% Out-of-State Filers 79,659 5.3%
Grand Total 27,957 100.0% Grand Total 1,490,312 100.0%
N. J. Initial Unemployment Claims by County
week ending 8/22/20
N. J. Initial Unemployment Claims by County
3/15 - 8/22/2020
Prepared by: Office of Research and Information, Division of
Economic & Demographic Research 8/24/20
Prepared by: Office of Research and Information, Division of Economic
& Demographic Research 8/24/20


Initial Claims PercentTotal Claimants 27,957 100%
Initial Claims PercentGender 27,957 100% Age of Claimant 27,957 100%Male 13,159 47.1% Under 25 6,137 22.0%Female 14,798 52.9% 25-34 7,007 25.1%
35-44 4,944 17.7%Race 27,957 100% 45-54 4,382 15.7%White 14,334 51.3% 55-64 3,853 13.8%Black 6,894 24.7% 65 and over 1,634 5.8%Asian 1,496 5.4%Other 339 1.2%Chose Not To Answer 4,894 17.5% Occupation 27,957 100%
Management 1,916 6.9%Ethnicity 27,957 100% Business and financial 961 3.4%Hispanic 6,302 22.5% Professional and related 5,768 20.6%Non-Hispanic 18,585 66.5% Services 6,120 21.9%Chose Not To Answer 3,070 11.0% Sales and related 2,624 9.4%
Office and admin support 3,804 13.6%Educational Attainment 27,957 100% Farming, fishing and forestry 50 0.2%Less Than High School 4,269 15.3% Construction and extraction 1,410 5.0%High School Graduate 9,331 33.4% Installation, maint. and repair 607 2.2%Some College Incld Assoc Deg 6,614 23.7% Production 1,643 5.9%Bachelors Degree and More 7,743 27.7% Transp and material moving 3,008 10.8%
Military 46 0.2%Prepared by: Office of Research and Information, Division of Economic & Demographic Research, 8/24/2020
Initial Claims Percent
Total Claimants 1,490,312 100%
Initial Claims Percent
Gender 1,490,312 100% Age of Claimant 1,490,312 100%
Male 691,022 46.4% Under 25 226,098 15.2%Female 799,290 53.6% 25-34 333,663 22.4%
35-44 270,792 18.2%Race 1,490,312 100% 45-54 270,996 18.2%White 875,170 58.7% 55-64 264,346 17.7%Black 232,417 15.6% 65 and over 124,417 8.3%Asian 116,719 7.8%Other 14,610 1.0%Chose Not To Answer 251,396 16.9% Occupation 1,490,312 100%
Management 106,955 7.2%Ethnicity 1,490,312 100% Business and financial 40,227 2.7%Hispanic 336,056 22.5% Professional and related 245,844 16.5%Non-Hispanic 1,008,925 67.7% Services 377,849 25.4%Chose Not To Answer 145,331 9.8% Sales and related 173,612 11.6%
Office and admin support 189,443 12.7%Educational Attainment 1,490,312 100% Farming, fishing and forestry 1,769 0.1%Less Than High School 220,260 14.8% Construction and extraction 71,680 4.8%High School Graduate 508,217 34.1% Installation, maint. and repair 46,955 3.2%Some College Incld Assoc Deg 375,547 25.2% Production 84,083 5.6%Bachelors Degree and More 386,288 25.9% Transp and material moving 150,861 10.1%
Military 1,034 0.1%Prepared by: Office of Research and Information, Division of Economic & Demographic Research, 8/24/2020
Characteristics of UI Initial Claimants
Characteristics of UI Initial Claimants
3/15 - 8/22/2020
Week ending August 22, 2020

37,477
39,064
31,746
29,674
26,472
29,36126,552
24,083 23,574
22,279
22,966
22,021
21,99221,287
19,817
19,933
19,381
15,000
20,000
25,000
30,000
35,000
40,000
45,000
5/2 5/9 5/16 5/23 5/30 6/6 6/13 6/20 6/27 7/4 7/11 7/18 7/25 8/1 8/8 8/15 8/22
Construction Continued Claims
29,570
31,559
26,002 24,150
22,256
24,85323,090
21,806
21,687
21,130
21,377
21,003
21,03720,549
19,393
18,979
18,443
0
5,000
10,000
15,000
20,000
25,000
30,000
35,000
5/2 5/9 5/16 5/23 5/30 6/6 6/13 6/20 6/27 7/4 7/11 7/18 7/25 8/1 8/8 8/15 8/22
Manufacturing Continued Claims
27,841
29,748
25,21024,18623,346
25,80924,471
23,790 23,641
22,668
22,748
21,805
21,821
21,329
20,06219,475
19,007
15,000
17,000
19,000
21,000
23,000
25,000
27,000
29,000
31,000
5/2 5/9 5/16 5/23 5/30 6/6 6/13 6/20 6/27 7/4 7/11 7/18 7/25 8/1 8/8 8/15 8/22
Wholesale Trade Continued Claims
103,203
109,045
80,426 77,62772,566
78,45374,261
69,700
65,529
60,532
58,350
54,965
55,21452,988
48,959
48,825
47,005
15,000
25,000
35,000
45,000
55,000
65,000
75,000
85,000
95,000
105,000
115,000
5/2 5/9 5/16 5/23 5/30 6/6 6/13 6/20 6/27 7/4 7/11 7/18 7/25 8/1 8/8 8/15 8/22
Retail Trade Continued Claims
35,886
39,089
32,494
32,108
31,146
34,942
34,362
34,232
34,359
33,629
34,149
33,100
33,99633,234
31,807 31,777
32,105
15,000
20,000
25,000
30,000
35,000
40,000
45,000
5/2 5/9 5/16 5/23 5/30 6/6 6/13 6/20 6/27 7/4 7/11 7/18 7/25 8/1 8/8 8/15 8/22
Transportation/Warehousing Continued Claims
5,252
5,665
4,608
4,896
4,765
5,471
5,2175,018
5,396
5,151 5,056
5,0695,401
5,139
4,702
4,762
4,488
0
1,000
2,000
3,000
4,000
5,000
6,000
7,000
8,000
5/2 5/9 5/16 5/23 5/30 6/6 6/13 6/20 6/27 7/4 7/11 7/18 7/25 8/1 8/8 8/15 8/22
Information Continued Claims
655,344
691,857
540,118
530,180
500,644
553,335
527,891505,143 498,334
471,914 468,145
450,156
453,670441,334
413,772
413,172
405,439
300,000
350,000
400,000
450,000
500,000
550,000
600,000
650,000
700,000
750,000
5/2 5/9 5/16 5/23 5/30 6/6 6/13 6/20 6/27 7/4 7/11 7/18 7/25 8/1 8/8 8/15 8/22
Total Continued Claims

93,045
99,333
78,860
77,401
74,589
86,619
82,883
78,213
79,120
77,193
77,862
76,154
76,560 75,460
72,116
72,526
72,372
40,000
50,000
60,000
70,000
80,000
90,000
100,000
110,000
5/2 5/9 5/16 5/23 5/30 6/6 6/13 6/20 6/27 7/4 7/11 7/18 7/25 8/1 8/8 8/15 8/22
Professional & Business Services Continued Claims
15,585
17,042
14,564
14,627
14,311
16,469
15,915
15,211
15,324
14,85514,823
14,193
14,59414,380
13,632
13,916
13,383
12,000
13,000
14,000
15,000
16,000
17,000
18,000
5/2 5/9 5/16 5/23 5/30 6/6 6/13 6/20 6/27 7/4 7/11 7/18 7/25 8/1 8/8 8/15 8/22
Financial Activities Continued Claims
114,830
120,347
95,079
93,207
86,546
93,290
87,36482,752
82,242
79,819
79,792
77,044
77,69076,077
69,861
69,966
68,591
40,000
50,000
60,000
70,000
80,000
90,000
100,000
110,000
120,000
130,000
5/2 5/9 5/16 5/23 5/30 6/6 6/13 6/20 6/27 7/4 7/11 7/18 7/25 8/1 8/8 8/15 8/22
Education & Health Services Continued Claims
21,710
22,149
15,371
15,431
14,316
15,44715,00214,706 14,333
13,71413,533
12,841
13,06112,713
12,045
12,095
11,776
0
5,000
10,000
15,000
20,000
25,000
5/2 5/9 5/16 5/23 5/30 6/6 6/13 6/20 6/27 7/4 7/11 7/18 7/25 8/1 8/8 8/15 8/22
Arts, Entertainment, Recreation Continued Claims
113,637
120,985
92,502
93,230
88,831
97,941 95,09792,482 90,629
86,637
84,994
81,149
81,20278,127
73,329
73,266
71,493
0
20,000
40,000
60,000
80,000
100,000
120,000
140,000
5/2 5/9 5/16 5/23 5/30 6/6 6/13 6/20 6/27 7/4 7/11 7/18 7/25 8/1 8/8 8/15 8/22
Accommodations & Food Services Continued Claims
50,60650,999
38,019
38,294
36,368
38,72637,846 37,453
36,565
28,44126,262
24,812
24,79923,922
22,275
21,812
20,869
0
10,000
20,000
30,000
40,000
50,000
60,000
5/2 5/9 5/16 5/23 5/30 6/6 6/13 6/20 6/27 7/4 7/11 7/18 7/25 8/1 8/8 8/15 8/22
Other Services Continued Claims
6,386
6,536
4,9485,055
4,857
5,524 5,503
5,412
5,652
5,571
5,912
5,737
6,048 5,879
5,558 5,600
6,290
0
1,000
2,000
3,000
4,000
5,000
6,000
7,000
8,000
9,000
10,000
5/2 5/9 5/16 5/23 5/30 6/6 6/13 6/20 6/27 7/4 7/11 7/18 7/25 8/1 8/8 8/15 8/22
Public Administration Continued Claims
Related Documents