1 23 Journal of Sol-Gel Science and Technology ISSN 0928-0707 Volume 67 Number 1 J Sol-Gel Sci Technol (2013) 67:208-219 DOI 10.1007/s10971-011-2453-4 New insights into the bioactivity of SiO 2 – CaO and SiO 2 –CaO–P 2 O 5 sol–gel glasses by molecular dynamics simulations G. Malavasi, L. Menabue, M. C. Menziani, A. Pedone, A. J. Salinas & M. Vallet-Regí

Welcome message from author
This document is posted to help you gain knowledge. Please leave a comment to let me know what you think about it! Share it to your friends and learn new things together.
Transcript

1 23
Journal of Sol-Gel Science andTechnology ISSN 0928-0707Volume 67Number 1 J Sol-Gel Sci Technol (2013) 67:208-219DOI 10.1007/s10971-011-2453-4
New insights into the bioactivity of SiO2–CaO and SiO2–CaO–P2O5 sol–gel glassesby molecular dynamics simulations
G. Malavasi, L. Menabue,M. C. Menziani, A. Pedone, A. J. Salinas& M. Vallet-Regí

1 23
Your article is protected by copyright and
all rights are held exclusively by Springer
Science+Business Media, LLC. This e-offprint
is for personal use only and shall not be self-
archived in electronic repositories. If you wish
to self-archive your article, please use the
accepted manuscript version for posting on
your own website. You may further deposit
the accepted manuscript version in any
repository, provided it is only made publicly
available 12 months after official publication
or later and provided acknowledgement is
given to the original source of publication
and a link is inserted to the published article
on Springer's website. The link must be
accompanied by the following text: "The final
publication is available at link.springer.com”.
ORIGINAL PAPER
New insights into the bioactivity of SiO2–CaO and SiO2–CaO–P2O5 sol–gel glasses by molecular dynamics simulations
G. Malavasi • L. Menabue • M. C. Menziani •
A. Pedone • A. J. Salinas • M. Vallet-Regı
Received: 12 November 2010 / Accepted: 22 March 2011 / Published online: 1 April 2011
� Springer Science+Business Media, LLC 2011
Abstract The structures of binary xCaO � (100 - x)SiO2
glasses with x = 10, 20 and 30 mol-% and ternary
(20 - x)CaO � xP2O5 � 80SiO2 glasses with x = 3, 10, 15,
17 and 20 mol-% have been studied by means of classical
molecular dynamics simulations using both the melt-
quenched and the sol–gel protocols. The structural picture
derived correlates the bioactive behaviour to the combined
effects of the connectivity of the extended silicate network
and to the tendency to form (or not to form) non-homo-
geneous domains. In this context, a mathematical rela-
tionship that relates the Ca/P ratio in the Ca phosphate
micro-segregation zones to the P2O5 content in ternary
glasses has been developed and this has been used to fine-
tuning the optimum amount of P in a glass for its highest in
vitro bioactivity. The composition with optimal Ca/P ratio,
80Si–14.8Ca–5.2P, has been synthesized and the results of
bioactivity tests have confirmed the prediction.
Keywords Molecular dynamic � Sol–gel processes �Bioactive glasses � In vitro bioactivity tests
1 Introduction
Sol–gel glasses in the CaO–SiO2 and CaO–SiO2–P2O5
systems were widely investigated as biomaterials because
some compositions bond with the living tissues, i.e. are
bioactive [1–4].
These investigations extensively explored the SiO2–
CaO–P2O5 phase diagram modifying the proportions of the
chemical components, the bioactivity window was then
determined [5] by means of in vitro studies in a Simulated
Body Fluid (SBF) [6]. The results reported differences in
the mechanism of formation of the hydroxycarbonate
apatite (HCA) layer, indicative of bioactivity, depending
on the glass components.
Thus, for binary CaO–SiO2 glasses, the bioactive
response increased with the CaO content [3]. This was
explained by considering that the increase in the network
disorder produced by calcium favors a quick leaching of
Ca2? from glass to solution and an increasing of the silanol
(Si–OH) concentration on the glass surface [7]. Both facts
yielded a very quick formation of an amorphous calcium
phosphate (a-CaP) layer, precursor of HCA, after soaking
binary glasses in SBF. Then, the HCA nanocrystals layer
was formed after maintaining glasses few days more in
SBF. Although a complete characterization by using sev-
eral experimental techniques is required to clearly distin-
guish between a-CaP and HCA, perhaps the most
convenient way to do that is by using FTIR spectroscopy
[7]: for a-CaP one band at 563 cm-1 appears in the spec-
trum, but for nanocrystalline HCA two bands at 563 cm-1
and 602 cm-1 are present. For CaO–SiO2 glasses it was
concluded that the bioactive response was quick enough for
CaO higher than 10 mol-%. However, CaO contents higher
than 30 mol-% provoked the formation of calcite (CaCO3)
in the layer together with HCA [3].
G. Malavasi � L. Menabue (&) � M. C. Menziani � A. Pedone
Department of Chemistry, University of Modena and Reggio
Emilia, Via Campi 183, 41125 Modena, Italy
e-mail: [email protected]
A. J. Salinas � M. Vallet-Regı
Departamento de Quimica Inorganica y Bioinorganica, Facultad
de Farmacia Universidad Complutense, 28040 Madrid, Spain
A. J. Salinas � M. Vallet-Regı
Network Center of Biomedical Research on Bioengineering,
Biomaterials and Nanomedicine (CIBER-BBN), Madrid, Spain
123
J Sol-Gel Sci Technol (2013) 67:208–219
DOI 10.1007/s10971-011-2453-4
Author's personal copy

Regarding ternary CaO–SiO2–P2O5 glasses, it was
reported that small amounts of P2O5 modified the forma-
tion mechanism of HCA described for CaO–SiO2 glasses
[4, 8]. This was attributed to the formation of calcium
phosphate nanocrystals during the ternary glasses synthesis
that were visualized by high resolution transmission elec-
tron microscopy [9]. That way, a substantial decrease of the
calcium in the glass network compared with the nominal
one took place decreasing the amount of Ca2? able to be
leached to SBF. Thus, few new Si–OH groups were formed
and the obtaining of a-CaP was significantly retarded
compared to analogous P-free gel glasses. However, cal-
cium phosphate nanocrystals in ternary glasses behave as
crystallization nuclei accelerating the HCA formation. In
summary, small amounts of P2O5 in the glasses of 3 mol-%
accelerated their bioactive response compared to analogous
P-free glasses, since shorter times were required for the
HCA formation although longer times had been necessary
for the formation of the initial a-CaP [7].
With the aim of obtaining further details on the struc-
ture-bioactivity relationships of this class of glasses, the
structures of binary xCaO � (100 - x)SiO2 glasses with
x = 10, 20 and 30 mol-% and the ternary (20 - x)CaO �xP2O5 � 80SiO2 glasses with x = 3, 10, 15, 17 and 20 mol-%
will be studied in this paper by computational simulations
and experimental techniques.
The availability of increasingly powerful computational
methods and resources nowadays makes computer simu-
lations an attractive complementary tool to experimental
techniques, to obtain an atomistic view into the bioactive
behaviour of bioglasses and fill the gap in fundamental
knowledge. In particular, molecular dynamics (MD) sim-
ulations have now shown to be able to tackle effectively
complex multicomponent amorphous systems and provide
an unprecedented high resolution view into their atomistic
bulk and surface structure and properties [10–17]. Whereas
the computational simulation of glasses by quenching a
melt from high to room temperature with different com-
putational protocols [18–23] is a well-established exercise,
several issues arise when the structure of a sol–gel prepared
glass has to be simulated. In fact, the time-scales charac-
teristic of the full sol–gel processes are yet not accessible
by MD simulations, moreover the hydrolysis and conden-
sation reactions involved are not described in purely clas-
sical methodologies.
Therefore, previous computer simulations studies of
sol–gel derived materials have focused mainly on the
modeling of some specific aspects of the process [24–30]
or have assumed such materials to be the same as melt-
quenched glasses [25, 26].
Interesting are the results obtained by Mead et al.
[27] who have simulated a sol–gel calcium-silicate glass
by using a modified melt-quench approach in which
under-density and hydroxylation, the two most important
differences of sol–gel glasses with respect to melt-derived
glasses, were added.
Very recently Bhattacharya et al. [26] reported on the
modelling of the sol–gel synthesis process of nano-porous
silica gel in an aqueous environment by means of MD
simulations making use of a reactive three body inter-
atomic potential. This approach allows for charge transfer
upon the rupture or formation of chemical bonds making it
possible to simulate the elementary reaction processes for
sufficiently large size- and time-scales, generating more
accurate gel structures.
Unfortunately, the extension of reactive force-fields to
complex binary or ternary amorphous systems containing
chemical bonds ranging a large part of the Pauling scale is
not obvious and requires further substantial refinement of
the whole methodology and parameters. Moreover, further
insights into mechanism of the reactions occurring during
the sol–gel process of Si(OCH3)4 units could be gained by
exploiting ab initio molecular dynamics (AIMD) simula-
tions [31]. However, at present, the size and time scales
which can be probed by ab initio molecular dynamics are
limited to few hundreds of atoms and tens of picoseconds.
The computational approach followed in this paper
ignores the particulars of the sol–gel synthesis route
focusing instead on grasping some important peculiarities
of the final sol–gel product obtained with respect to the
melt-quenched one. In fact, the classical melt-quenched
protocol [18] and the one modified according to Mead et al.
[2, 27] to account for sol–gel characteristics will be
exploited for the elaboration of structure-bioactivity rela-
tionships useful in the fine-tuning of the optimal glass
composition with optimized bioactivity. In particular the
main goal of the present work is to define one or more
structural descriptors able to predict HCA formation as a
consequence of SBF soaking during in vitro tests. More-
over, confirmation or confutation of the computational
results will be provided by experimental tests.
2 MD simulations
2.1 Melt-quenched computational procedure
The structures of binary calcium-silicate glasses of compo-
sition xCaO � (100 - x)SiO2 with x = 10, 20 and 30 mol-%
and the ternary calcium-phospho-silicate glass with com-
position (20 - x)CaO � xP2O5 � 80SiO2 with x = 3, 10, 15,
17 and 20 mol-% have been generated through the compu-
tational protocol described in Refs. [18, 19].
The initial configurations were generated by placing
randomly 2,000–2,800 atoms in a cubic box whose
dimensions and atomic compositions in Table 1. The glass
J Sol-Gel Sci Technol (2013) 67:208–219 209
123
Author's personal copy

densities have been calculated according to the Priven’s
empirical method [32] implemented in the SciGlass�
software [33].
In order to asses the effects of box size on the medium
range order of ternary glasses the ternary system with
x = 3 was simulated by using 5,200 atoms (sample called
80Si–17Ca–3P-big hereafter).
The DLPOLY [34] package has been employed for
NVT MD simulations by using an empirical partial charge
rigid ionic model [18], which has been shown to reproduce
well the structure, transport and mechanical properties of
oxides, silicates and silica based glasses [18]. Integration of
the equations of motion has been performed using the
Verlet Leap-frog algorithm with a time step of 2 fs. Cou-
lombic interactions have been calculated by the Ewald
summation method with a cut-off of 12 A and an accuracy
of 10-4. The short range interaction cut-off was set to
5.5 A. The structural parameters reported for each glass are
averages over 3 independent simulations.
2.2 Sol–gel computational procedure
One of the main differences between a melt-quench and a
sol–gel glass is due to the smaller density caused by the
introduction of OH groups in the latter case. In NVT MD
simulations the density of the system must be known
a priori. The determination of the experimental density for
sol gel glasses is hampered by the hygroscopic nature of
the glass and the variation of its value as consequence of
different thermal treatments. In this work we have deter-
mined the experimental density of the sol gel glass with
composition 80SiO2 � 15CaO � 5P2O5 after thermal treat-
ment at 700 �C for 3 h. The density of 2.360 g/cm3 is only
1.0% less than that determined by using the Priven
empirical method (see Table 1) and several calculations by
using the two densities did not provide appreciable dif-
ferences on the structure of the simulated glasses. For these
reasons, the densities calculated by the empirical method
were used for the other compositions.
The other important characteristic of sol–gel glasses is
that they contain a certain concentration of hydroxyl
groups. Because of the thermal treatment usually employed
to dehydrate the glass, the content of H atoms is only due to
hydroxyl groups. As reported in previous papers [35–37]
the experimental concentration of hydroxyl groups in sil-
ica-based gel glasses is around 5 groups/nm2. This value is
reported in a recent study on the surface properties of sol–
gel 80SiO2 � 15CaO � 5P2O5 glass [36]. In this work, some
of us employed thermogravimetic techniques to follow the
de-hydroxylation process. This process, which causes a
drastic reduction of the glass surface area takes place from
around 550� to 850 �C and the concentration of hydroxyl
groups on the surface changes from 18 groups/nm2 at
600 �C to 0.050 groups/nm2 at 900 �C, passing to 5 groups/
nm2 at 700 �C. [36] Therefore, starting configurations
containing 5 OH groups per nm2 were generated by con-
sidering the OH group as a single site with bond length of
1 A. The short range O–H and the hydrogen bonds
O–H���O potential parameters used are reported in Table 2
[38]. The final structural models were generated by using
the simulation procedure described above in the previous
section.
3 Synthesis of the sol–gel-glasses
The glass compositions modeled by MD and the one that
will be predicted (see the following) to be the most
Table 1 Gel glass compositions, in vitro activity, number of atoms, cell size and density used in the MD simulations of the glasses studied
Formulation % SiO2 % CaO % P2O5 In vitro activitya nSi nO/nH nCa nP Density (g/cm3) Cell size (A)
90Si–10Ca 90 10 0 B 868 1,832 96 0 2.318 34.54
80Si–20Ca 80 20 0 B 800 1,800 200 0 2.445 34.27
70Si–30Ca 70 30 0 B 726 1,762 310 0 2.580 33.98
80Si–17Ca–3P 80 17 3 B 560 1,344 119 42 2.409 31.02
80Si–17Ca–3P-big 80 17 3 B 1,416 3,386 294 104 2.409 42.18
80Si–15Ca–5P 80 15 5 NS 560 1,400 105 70 2.389 31.39
80Si–15Ca–5P–OH 80 15 5 NS 560 1,432/64 105 70 2.360b 31.65
80Si–14.8Ca–5.2P 80 14.8 5.2 NS Not modeled
80Si–10Ca–10P 80 10 10 NS 560 1,540 70 140 2.351 32.25
80Si–5Ca–15P 80 5 15 NS 560 1,680 35 210 2.340 32.97
80Si–3Ca–17P 80 3 17 NS 560 1,736 21 238 2.337 33.24
80Si–20P 80 0 20 NS 560 1,820 0 280 2.333 33.65
a B bioactive, NS not studied beforeb Experimental value determined in the present work
210 J Sol-Gel Sci Technol (2013) 67:208–219
123
Author's personal copy
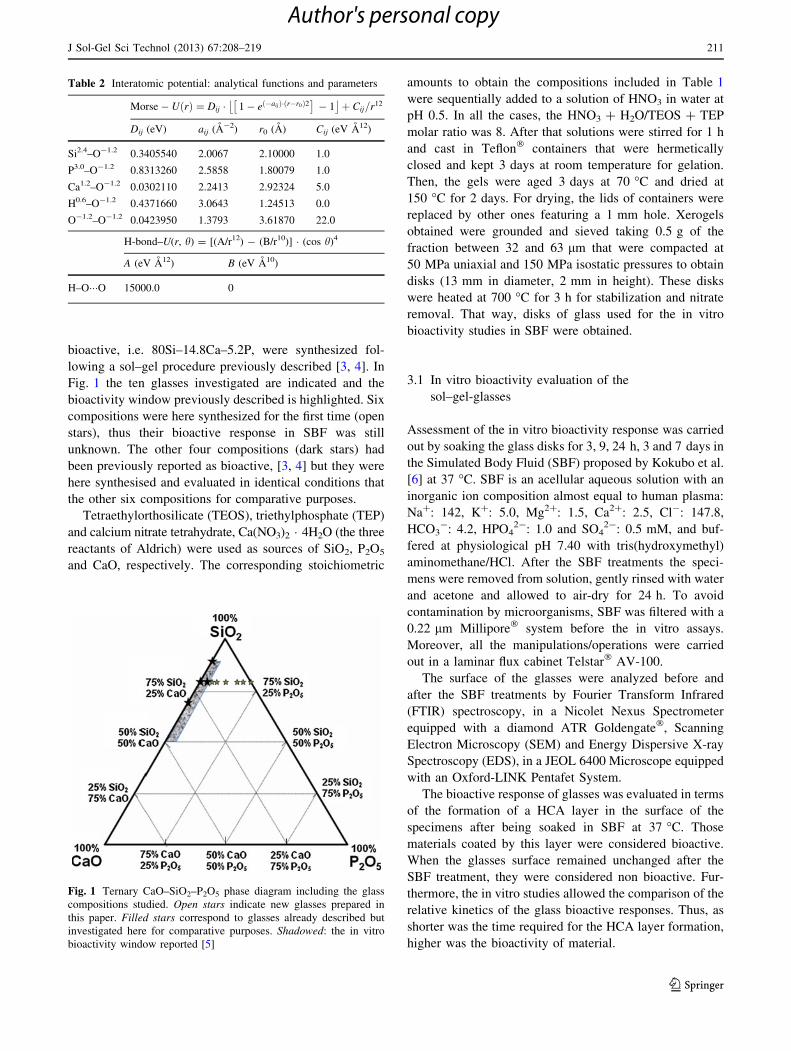
bioactive, i.e. 80Si–14.8Ca–5.2P, were synthesized fol-
lowing a sol–gel procedure previously described [3, 4]. In
Fig. 1 the ten glasses investigated are indicated and the
bioactivity window previously described is highlighted. Six
compositions were here synthesized for the first time (open
stars), thus their bioactive response in SBF was still
unknown. The other four compositions (dark stars) had
been previously reported as bioactive, [3, 4] but they were
here synthesised and evaluated in identical conditions that
the other six compositions for comparative purposes.
Tetraethylorthosilicate (TEOS), triethylphosphate (TEP)
and calcium nitrate tetrahydrate, Ca(NO3)2 � 4H2O (the three
reactants of Aldrich) were used as sources of SiO2, P2O5
and CaO, respectively. The corresponding stoichiometric
amounts to obtain the compositions included in Table 1
were sequentially added to a solution of HNO3 in water at
pH 0.5. In all the cases, the HNO3 ? H2O/TEOS ? TEP
molar ratio was 8. After that solutions were stirred for 1 h
and cast in Teflon� containers that were hermetically
closed and kept 3 days at room temperature for gelation.
Then, the gels were aged 3 days at 70 �C and dried at
150 �C for 2 days. For drying, the lids of containers were
replaced by other ones featuring a 1 mm hole. Xerogels
obtained were grounded and sieved taking 0.5 g of the
fraction between 32 and 63 lm that were compacted at
50 MPa uniaxial and 150 MPa isostatic pressures to obtain
disks (13 mm in diameter, 2 mm in height). These disks
were heated at 700 �C for 3 h for stabilization and nitrate
removal. That way, disks of glass used for the in vitro
bioactivity studies in SBF were obtained.
3.1 In vitro bioactivity evaluation of the
sol–gel-glasses
Assessment of the in vitro bioactivity response was carried
out by soaking the glass disks for 3, 9, 24 h, 3 and 7 days in
the Simulated Body Fluid (SBF) proposed by Kokubo et al.
[6] at 37 �C. SBF is an acellular aqueous solution with an
inorganic ion composition almost equal to human plasma:
Na?: 142, K?: 5.0, Mg2?: 1.5, Ca2?: 2.5, Cl-: 147.8,
HCO3-: 4.2, HPO4
2-: 1.0 and SO42-: 0.5 mM, and buf-
fered at physiological pH 7.40 with tris(hydroxymethyl)
aminomethane/HCl. After the SBF treatments the speci-
mens were removed from solution, gently rinsed with water
and acetone and allowed to air-dry for 24 h. To avoid
contamination by microorganisms, SBF was filtered with a
0.22 lm Millipore� system before the in vitro assays.
Moreover, all the manipulations/operations were carried
out in a laminar flux cabinet Telstar� AV-100.
The surface of the glasses were analyzed before and
after the SBF treatments by Fourier Transform Infrared
(FTIR) spectroscopy, in a Nicolet Nexus Spectrometer
equipped with a diamond ATR Goldengate�, Scanning
Electron Microscopy (SEM) and Energy Dispersive X-ray
Spectroscopy (EDS), in a JEOL 6400 Microscope equipped
with an Oxford-LINK Pentafet System.
The bioactive response of glasses was evaluated in terms
of the formation of a HCA layer in the surface of the
specimens after being soaked in SBF at 37 �C. Those
materials coated by this layer were considered bioactive.
When the glasses surface remained unchanged after the
SBF treatment, they were considered non bioactive. Fur-
thermore, the in vitro studies allowed the comparison of the
relative kinetics of the glass bioactive responses. Thus, as
shorter was the time required for the HCA layer formation,
higher was the bioactivity of material.
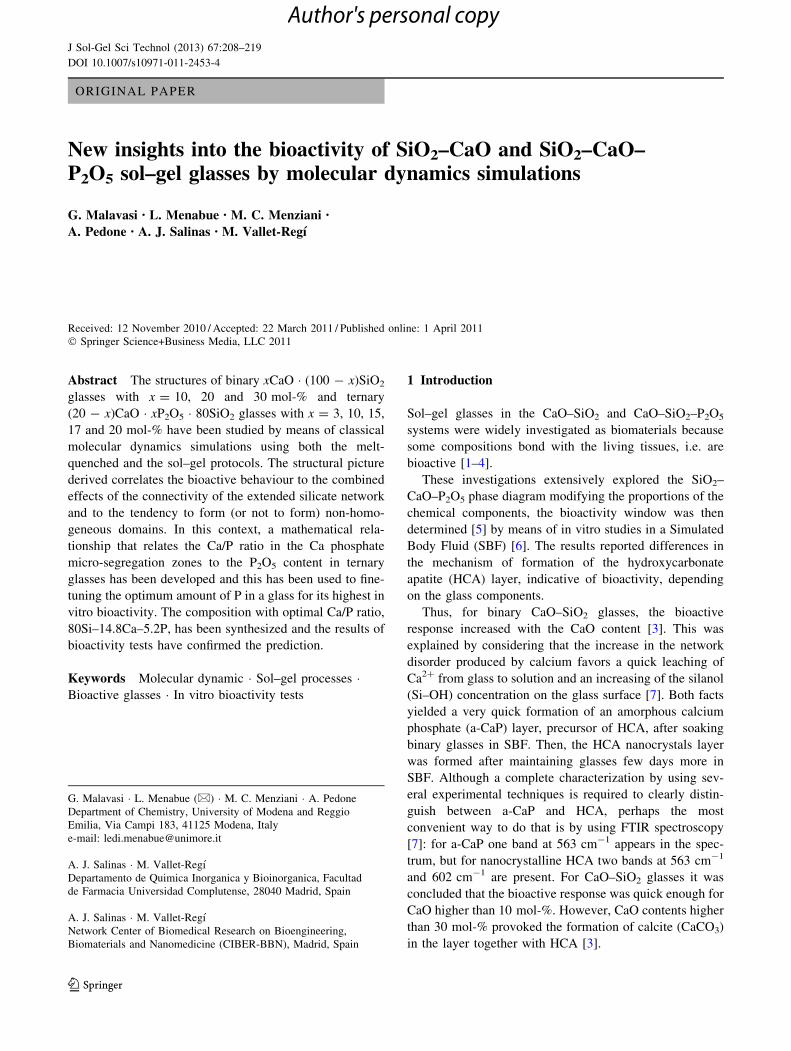
Table 2 Interatomic potential: analytical functions and parameters
Morse� U rð Þ ¼ Dij � 1� eð�aijÞ�ðr�r0Þ2� �
� 1� �
þ Cij=r12
Dij (eV) aij (A-2) r0 (A) Cij (eV A12)
Si2.4–O-1.2 0.3405540 2.0067 2.10000 1.0
P3.0–O-1.2 0.8313260 2.5858 1.80079 1.0
Ca1.2–O-1.2 0.0302110 2.2413 2.92324 5.0
H0.6–O-1.2 0.4371660 3.0643 1.24513 0.0
O-1.2–O-1.2 0.0423950 1.3793 3.61870 22.0
H-bond–U(r, h) = [(A/r12) - (B/r10)] � (cos h)4
A (eV A12) B (eV A10)
H–O���O 15000.0 0
Fig. 1 Ternary CaO–SiO2–P2O5 phase diagram including the glass
compositions studied. Open stars indicate new glasses prepared in
this paper. Filled stars correspond to glasses already described but
investigated here for comparative purposes. Shadowed: the in vitro
bioactivity window reported [5]
J Sol-Gel Sci Technol (2013) 67:208–219 211
123
Author's personal copy

Practically from their beginnings, in vitro bioactivity
tests were controversial with respect to the validity of
extrapolating their results to the in vivo conditions. In that
sense a recent article of Bohner and Lemaitre [39] argues
that in spite of the very extended which they are, mainly
using Kokubo’s SBF solution [6] in many occasions these
tests produced false positives and false negatives and that
this method needs to be improved. Nevertheless, the in
vitro evaluation of glasses in SBF is perfectly valid to
evaluate their bioactivity in a comparative way as it was
carried out in this study.
4 Results and discussion
4.1 MD simulations
The simulation of sol–gel glasses requires the a priori
knowledge of the OH content in the structure and a time-
consuming manual procedure for the preparation of the input
structure. Therefore, in this work a standard melt-quench
protocol [18, 19] has been applied to the complete series of
glasses considered and the modified sol–gel procedure
recently described by Mead et al. [27] has been carried out to
simulate the 80SiO2 � 15CaO � 5P2O5 glass. The comparison
between the structural features of this last glass simulated
using a standard melt-quench procedure (80Si–15Ca–5P)
and modified sol–gel procedure (80Si–15Ca–5P–OH)
highlights the similarities and the differences between the
adopted procedures. The structural model of the sol–gel
glass at room temperature has an internal pressure very close
to 0 kbar suggesting that the introduction of the OH groups
do not lead to stresses in the glass.
The similarities in the total distribution functions (TDF),
that represent the relative probability of finding any atom at a
distance r from an atom placed at the origin, of 80Si–15Ca–
5P and 80Si–15Ca–5P–OH, reported in Fig. 2, indicate that,
overall, comparable structures are obtained, the main dif-
ference being a peak detected around 1 A in the 80Si–15Ca–
5P–OH distribution due to the presence of O–H bonds. A
small difference between the curves, due to modifications of
the Si–Si interatomic distance [27] and the introduction of
the Ca–H pairs which lie in the range 2.8–3.4 A, in agree-
ment with previous experimental works (Ca–H = 3.0–3.1 A
in Ref. [27] and Ca–H = 2.95 A in Ref. [40]).
A more detailed description of the structure of the glass
studied is summarized in the following.
The local structure around cations is characterized by
the cations-oxygens bond lengths, coordination number
(CN) and oxygens-cations-oxygens bond angle distribu-
tions (BAD). Whereas, information on the medium range
order can be obtained from the distribution of non-bridging
(NBO), bridging (BO) and three-bridging oxygens (TBO),
cations-cations pair distribution functions (PDF), distribu-
tion of Qn species (where n is the number of bridging
oxygens bonded to the network former cations Si or P),
self- and cross-connectivity between TO4 tetrahedra
(T = Si and P) and ring size distribution.
4.1.1 Bond length and bond angle distributions
The X–O bond length (where X = Si, P, H and Ca),
obtained from the first peak of the corresponding PDFs and
the bond angle distributions for the different atom groups
in the studied glasses are summarized in Table 3. The O–H
bond distance found for the modeled sol–gel glass is
1.07 A (Fig. 3, Table 3) in good agreement with the find-
ing of Mead and Mountjoy (1.05 A) [27].
The second maximum at 1.9–2.1 A can be attributed to
the H-bond between the H and O atoms in a different
hydroxyl group. The short range order of Si and P ions is
rather rigid and hardly affected by the composition, con-
versely, the Ca–O bond length increases from 2.30 A for
90Si–10Ca glass to 2.37 A for Ca-rich glasses (70Si–
30Ca). These values fit very well with neutron diffraction
data of iso-compositional gel glasses [40] confirming the
goodness of computational procedure to reproduce the
local environment of modifier cations. A similar trend is
observed in ternary glasses where Ca–O bond length
increases from 2.32 A for 80Si–3Ca–17P to 2.37 A for
80Si–17Ca–3P.
The O–Ca–O bond angle distribution (Fig. 4) shows a
peak close to 90� which results from the Ca ions in octa-
hedral geometry connecting two NBOs belonging to dif-
ferent Si/P-tetrahedra, and a second peak centered at 60�(less pronounced with respect to the previous one) derived
from the Ca coordination with two NBOs (or one NBO and
one BO) belonging to the same Si/P-tetrahedron [11].
0 2 4 6 80
2
4
6
8
10
12 80Si-15Ca-5P 80Si-15Ca-5P-OH
TD
F (
r)
r [Å]
Fig. 2 Total distribution function (TDF) for the 80Si–15Ca–5P (solid
line) and 80Si–15Ca–5P–OH (dotted line) glasses
212 J Sol-Gel Sci Technol (2013) 67:208–219
123
Author's personal copy

The decreasing of the Si–O–Si bond angle with CaO
content is the consequence of the higher CaO/SiO2 ratio:
when the BO of a Si–O–Si linkage also interacts with Ca,
the Si–O–Si angle will decrease to accommodate it.
4.1.2 Coordination number (CN) distribution
and clustering effects
Table 4 reports the coordination number of Si, P and Ca to
Oxygens as well as the number of Ca ions coordinated to Si
and P. Each CN has been obtained by integration to the first
minimum in the corresponding pair distribution function
curves with cutoffs of 2.0, 2.0, 3.0, 4.2 and 4.2 A for Si–O,
P–O, Ca–O, Si–Ca and P–Ca, respectively. Si and P display
the classical tetrahedral coordination characteristic of net-
work former ions. Ca exhibits the typical behaviour of
network modifier ions or of charge compensator: it prefers
to occupy coordination sites with a highly distorted
geometry. In the binary SiO2–CaO systems the mean
coordination number of Ca increases as a function of Ca
content, consistently with the increasing of the Ca–O dis-
tance (Table 3). The mean Ca CNs slightly differ from that
reported in Ref. [27] (4.5–5.3), this is due to the different
potential utilized in the present work and more probably by
the cut-off used in the coordination number computation.
The introduction of hydroxyl groups changes signifi-
cantly the oxygen type contribution to the Ca coordination:
in fact, the CN of Ca in the OH free system (80Si–15Ca–
5P) is due to 3.3 BO, 1.7 NBO and 0 TBO, whereas in the
80Si–15Ca–5P–OH glass system this distribution shows an
increment of BO (3.5), a reduction of NBO (1.1), and the
appearance of 0.3 hydroxyl groups (OH). These results are
consistent with that reported in Ref. [27], where segrega-
tion of hydroxyl groups at the Ca sites with consequent
reduction of NBO near the Ca ions is highlighted.
The coordination numbers of Si–Ca and P–Ca found
in the simulated structure can be compared with those
Table 3 Mean bond distances and mean bond angles of the modelled glasses
Distances [A] Bond angles [degrees]
Si–O P–O Ca–O (O–H) O–Si–O O–P–O Si–O–Si (P–O–Si)
90Si–10Ca 1.616 – 2.304 108 – 154
80Si–20Ca 1.616 – 2.352 109 – 150
70Si–30Ca 1.616 – 2.368 108 – 148
80Si–17Ca–3P 1.616 1.520 2.368 108 109 149 (160)
80Si–17Ca–3P-big 1.616 1.536 2.336 108 108 150 (159)
80Si–15Ca–5P 1.616 1.536 2.336 108 108 157 (157)
80Si–15Ca–5P–OH 1.616 1.536 2.320 (1.070) 108 109 156 (158)
80Si–10Ca–10P 1.616 1.536 2.336 108 109 156 (160)
80Si–5Ca–15P 1.616 1.536 2.320 108 109 156 (161)
80Si–3Ca–17P 1.616 1.536 2.320 108 108 157 (160)
80Si–20P 1.616 1.536 – 108 109 158 (162)
0 1 2 3 4 50
1
2
3
4
5
6
7
8
PD
F g
O-H
(r)
r [Å]
O-H
Fig. 3 Pair Distribution Function of O–H pair for the 80Si–15Ca–
5P–OH glass
0 20 40 60 80 100 120 140 160 1800,0
0,5
1,0
1,5
2,0
2,5 90Si-10Ca 80Si-20Ca 80Si-15Ca-5P 80Si-15Ca-5P-OH 80Si-3Ca-17P
BA
D ρ
(θ)
Bond Angle θ [degrees]
Fig. 4 O–Ca–O Bond Angle Distribution (BAD) of modeled glasses
J Sol-Gel Sci Technol (2013) 67:208–219 213
123
Author's personal copy

expected for a homogeneous distribution of ions given by
the formula CNT–Ca = 4/3 p Rc3 qCa, where Rc is the cut-off
distance (Si–Ca = P–Ca = 4.2 A) to the first minimum in
the T-Ca pair distribution function and qCa is the density
number of Ca ions in the system [10]. The analysis of these
data shows (Table 4) that in the binary systems Ca cations
are homogeneously distributed around the Si, while, in the
ternary systems, the Ca2? cations prefer to surround P
with respect to Si ones; this leads to the formation of Ca
phosphate rich regions. This clustering effect can be
quantified by the ratio fP–Ca between the P–Ca coordination
number found in the simulated model and the P–Ca2?
coordination number calculated for a homogenous distri-
bution also reported in Table 4. In particular, the clustering
effect is remarkable in the ternary system in the range
17–10% CaO, with a mean ratio value of 1.6. The very
similar ratio fP–Ca obtained for the glass systems 80Si–
17Ca–3P-big and 80Si–17Ca–3P seems to indicate that the
rich P–Ca domains found in these glasses is not an artificial
result due to the finite size of the box.
It is worth noting that in the 80Si–15Ca–5P glass 1.70 Ca
ions around each P ion are found, therefore, the composition
of the phosphate environment in this glass is similar to that
of HA for which the Ca/P atomic ratio is 1.6667. The
coordination numbers and the clustering effect determined
for the modeled glass using the melt-quenched and sol–gel
procedure are very similar and the presence of –OH groups
does not affect the preference of Ca ions to surround pref-
erentially the PO4 tetrahedra with respect to SiO4 ones.
4.1.3 Qn species distributions
The distributions of Qn species of the glasses studied
are reported in Table 5, together with the connectivity of
the silicate and phosphate networks, denoted NC(Si) and
NC(P), computed as weighted average of the correspond-
ing Qn(Si) and Qn(P) distributions.
This index highlights the major difference between the
structural model obtained by melt-quenched and sol–gel
procedure. In fact, the –OH groups destroy the silicate and
phosphate network connectivity leading to a lower value of
NC (Si) and (P) for the 80Si–15Ca–5P–OH with respect to
80Si–15Ca–5P (Table 5). This is also confirmed by the
lower percentage of BO showed in Fig. 5 for the 80Si–
15Ca–5P–OH with respect to the 80Si–15Ca–5P glass.
Thus, as expected, the sol–gel glass presents a network
connectivity lower with respect to that determined using
the melt-quenched model and this has to be taken into
account in the subsequent comparative analysis of the
series of glasses considered. No significant differences
were observed in the Qn distribution of the various chem-
ical species in the 80Si–17Ca–3P-big glass.
Table 5 shows that Si is predominantly Q4 for the 90Si–
10Ca and 80Si–20Ca glasses and Q3 for the 70Si–30Ca
glass with an overall decrement of the network connec-
tivity from 3.78 to 3.16. In Table 5 are reported the con-
tributions of Si–O–Si, Si–O–P and P–O–P units to the glass
network connectivity. It is interesting to note that in all
cases the number of P–O–P units are very low as confirmed
by the results of 31P MAS NMR study on similar glasses
[41]. Nevertheless, the Qn distribution obtained in Ref. [41]
showed only Q0 and Q1 species for P and this discrepancy
with MD results showed above (Table 5). This is a well
known drawback of structural models obtained by classical
MD simulations which overestimate the concentration of
Si–O–P units in the glass because of the force field, the
high cooling rates and the small simulation box size
employed [42].
In the ternary glasses Si is predominantly Q4 for all the
compositions although the network connectivity slightly
Table 4 Coordination numbers and clustering ratio (fT–Ca) of the modelled glasses
Coordination number (CN) Number of Ca atoms around Si and P atoms
Si–O P–O Ca–O O–Si O–P O–Ca Si–Caa fSi–Ca P–Caa fP–Ca
90Si–10Ca 4.0 – 5.0 1.90 – 0.26 0.73 (0.72) 1.01 –
80Si–20Ca 4.0 – 5.3 1.78 – 0.59 1.59 (1.54) 1.03 –
70Si–30Ca 4.0 – 5.5 1.65 – 0.97 2.67 (2.45) 1.09 –
80Si–17Ca–3P 4.0 4.0 5.2 1.67 0.13 0.46 1.19 (1.24) 0.96 1.99 (1.24) 1.61
80Si–17Ca–3P–big 4.0 4.0 5.2 1.68 0.12 0.47 1.19 (1.24) 0.96 2.02 (1.24) 1.63
80Si–15Ca–5P 4.0 4.0 5.0 1.60 0.20 0.40 0.97 (1.05) 0.92 1.70 (1.05) 1.62
80Si–15Ca–5P–OH 4.0 4.0 4.9 1.48 0.18 0.39 0.93 (1.03) 0.90 1.65 (1.03) 1.60
80Si–10Ca–10P 4.0 4.0 5.3 1.46 0.37 0.34 0.56 (0.65) 0.86 1.04 (0.65) 1.60
80Si–5Ca–15P 4.0 4.0 4.8 1.34 0.50 0.24 0.25 (0.30) 0.83 0.41 (0.30) 1.37
80Si–3Ca–17P 4.0 4.0 5.0 1.30 0.56 0.06 0.13 (0.18) 0.72 0.25 (0.18) 1.39
80Si–20P 4.0 4.0 – 1.24 0.62 – – –
a The corresponding values estimated for a homogeneous distribution are reported in parentheses
214 J Sol-Gel Sci Technol (2013) 67:208–219
123
Author's personal copy

decreases from 3.94 to 3.61 when P2O5 is substituted by
CaO (Table 5). Phosphorous is predominantly Q3 for all
the compositions except for the 80Si–17Ca–3P for which it
is predominantly Q2. As for silicon, the network connec-
tivity of P decreases with CaO content. The overall parti-
tioning of the T–BO–T (T = Si and P) bridges in the
glasses is quantitatively examined in Fig. 5, which shows
that while the Si connectivity is dominated by ‘self’ Si–O–
Si linkages the situation is reversed for P, which does not
form P–O–P bridges, but prefers to cross-link with silicon.
This trend is very similar to that report by Tilocca et al.
[43] for phospho-silicate glasses obtained by a melt-
quenched computational procedure where the authors
investigated the effect of substitution of P2O5 for SiO2: at
lower % of P2O5 the PO4 tetrahedra are mainly Q0, whereas
at high % of P2O5 the PO4 units are linked with SiO4
tetrahedra with formation of Si–O–P bridges. In that paper,
the increment of glass network connectivity is correlated to
a decrement of the glass bioactivity. On the basis of this
consideration, among the glasses studied in the present
work higher bioactivity should be expected for the 80Si–
17Ca–3P composition, however other considerations have
to be done for the determination of Structure-Bioactivity
relationships, as reported in the following paragraph.
4.1.4 Structure-bioactivity relationships
Previous works showed that the 80Si–20Ca glass, presents
higher initial reactivity in SBF with respect to the ternary
Table 5 Qn species distributions and corresponding connectivity
Si P Si–O–Si %a Si–O–P %a P–O–P %a NC(Si) NC(P)
Q0 Q1 Q2 Q3 Q4 Q0 Q1 Q2 Q3 Q4
90Si–10Ca 0 0 2.1 18.1 79.8 89.6 3.78
80Si–20Ca 0 0.3 6.3 36.3 57.1 77.9 3.51
70Si–30Ca 0 3.5 15.8 42.8 39.9 65.1 3.16
80Si–17Ca–3P 0 0 4.3 30.3 65.4 0 9.6 42.8 32.8 14.8 71.4 7.7 0.1 3.61 2.53
80Si–17Ca–3P–big 0 0 4.0 30.9 65.1 0 9.4 42.7 33.3 14.6 71.6 7.7 0.0 3.61 2.53
80Si–15Ca–5P 0 0.2 2.9 26.0 70.9 0 5.7 38.9 44.6 10.8 67.2 12.7 0.1 3.68 2.60
80Si–15Ca–5P–OH 0 0.1 6.5 30.4 63.0 0 5.8 41.9 44.0 8.3 63.3 12.3 0.3 3.56 2.55
80Si–10Ca–10P 0 0 0.9 17.7 81.4 0 5.5 30.2 44.7 19.6 57.5 23.3 1.0 3.80 2.79
80Si–5Ca–15P 0 0 0.3 11.8 87.9 0 2.4 22.6 47.3 26.7 47.4 37.7 1.6 3.88 3.00
80Si–3Ca–17P 0 0 0 8.7 91.3 0 1.4 1.5 52.3 27.8 44.2 37.8 2.5 3.92 3.06
80Si–20P 0 0 0 6.4 93.6 0 1.6 15.5 50.5 32.4 39.8 41.8 3.4 3.94 3.14
a %Y–O–X = (no. of Y–O–X/no. of O) 9 100, where X,Y = Si and P
Fig. 5 Percentage of BOs linking any pair of tetrahedra (dark blue
diamond), linking two Si (magenta square), Si and P (light blue upper
triangle) and two P (green square) tetrahedra. The corresponding data
for the sol–gel modelled glass (80Si–15Ca–5P–OH) and bigger box
glass (80Si–17Ca–3P-big) are reported with filled circle and filled
triangle symbols, respectively (Color figure online)
Fig. 6 Ca/P ratio in the clustered zone, as computed from MD
simulations, versus molar % P2O5. The corresponding data for the
sol–gel modelled glass (80Si–15Ca–5P–OH) and bigger box glass
(80Si–17Ca–3P-big) are reported with filled circle and filled triangle
symbols, respectively
J Sol-Gel Sci Technol (2013) 67:208–219 215
123
Author's personal copy

system 80Si–17Ca–3P: in few hours the glass is coated by
amorphous calcium phosphate (aCaP), whereas the con-
version of aCaP to crystalline carbonate hydroxyapatite
(HCA) nanocrystals similar to the biological ones needs
2 days. Whereas, the formation of aCaP on the surface of
the 80Si–17Ca–3P glass needs 2 days because of its higher
network connectivity, but the HCA crystallization is faster
because of the micro-segregation of Ca phosphate rich
regions with Ca/P ratio similar to that of hydroxyapatite.
Therefore, it might be asserted that the bioactive
response of binary glasses (80Si–20Ca) is controlled by a
quick Ca2?/H? interchange yielding to the formation of
new silanol groups (Si–OH) able to attract calcium and
phosphate ions in solution accelerating the formation of an
aCaP layer, while in the ternary glasses the higher con-
nectivity and lower Ca leaching cause a slower formation
of new silanol groups (Si–OH) able to promote the for-
mation of an aCaP.
From the results of the computational simulation study a
structural model of binary and ternary silicate glasses
emerges that correlates the bioactive behaviour to the
combined effects of the connectivity of the extended sili-
cate network and to the tendency to form (or not to form)
non-homogeneous domains. This offers the opportunity to
find a mathematical relationship (equation reported in
Fig. 6) between the Ca/P ratio in the Ca phosphate micro-
segregation zones and the P2O5 content in ternary glasses
(see Fig. 6); it can be used to predict the bioactive response
of new compositions of glasses still not synthesized or the
fine-tune of the optimum amount of P in a glass for its
highest in vitro bioactivity, by assuming that the glasses for
which the Ca/P ratio in the Ca phosphate micro-segregation
zones is closer to that of HA (Ca/P = 1.667) will promote
the fastest crystallization of aCaP to HCA. Therefore, the
composition with optimal Ca/P ratio of 1.6667, 80Si–
14.8Ca–5.2P, has been synthesized and bioactivity tests
have been carried out to confirm or confute the structural
models derived from computational simulations.
4.2 Bioactivity tests and model validation
Figure 7 reports the FTIR spectra of four glasses previ-
ously described [3, 4] as bioactive after different soaking
times in SBF. After 7 days, the spectra of all samples show
bands of phosphate and carbonate characteristic of a
positive in vitro bioactive response.
The FTIR spectra of the six glasses prepared for the first
time in this paper are shown in Fig. 8. As it can be
observed for the samples containing 5 and 5.2 mol-% of
P2O5 respectively, the characteristic bands of crystalline
phosphate at 563 and 602 cm-1 are present after 1 day of
soaking, indicative of a quicker bioactive response of these
samples. It must be considered that at t = 0 low intensity
bands are also observed in this region. This was explained
for the presence of some calcium phosphate nanocrystals in
the initial glasses that were detected by Transmission
Electron Microscopy [9] for a glass containing 3 mol-%
of P2O5. In addition, the glass with 10 mol-% P2O5, i.e.
Fig. 7 FTIR spectra of
previously studied glasses [3, 4]
before and after being soaked
for different times in SBF. As
observed, after 7 days of
soaking in all cases are visible
bands of phosphate and
carbonate groups indicative of a
positive (?) in vitro bioactive
response
216 J Sol-Gel Sci Technol (2013) 67:208–219
123
Author's personal copy

80Si–10Ca–10P, seems to present the phosphate bands
after 7 days of soaking.
To confirm the bioactive response of glasses, they were
studied by SEM and EDS. In Fig. 9 the SEM micrographs of
80Si–14.8Ca–5.2P, 80Si–15Ca–5P and 80Si–10Ca–10P
before and after being soaked 7 days in SBF are presented.
The corresponding EDS spectra are also included. As it can
be observed at 7 days, only the surface of 80Si–14.8Ca–5.2P
Fig. 8 FTIR spectra of glasses prepared here for the first time before
and after being soaked for different times in SBF. As observed, the
first two glasses exhibit a very positive (??) in vitro bioactive
response, whereas for the last three glasses is negative (-). For 80Si–
10Ca–10P glass the situation is not conclusive by using this
characterization technique
Fig. 9 SEM micrographs and the corresponding EDS spectra of three
glasses with possible in vitro bioactive response after the studies
by FTIR spectroscopy. As observed these techniques confirm that
80Si–10Ca–10P glass is not bioactive because no new material was
formed on the glass surface
J Sol-Gel Sci Technol (2013) 67:208–219 217
123
Author's personal copy

and 80Si–15Ca–5P appears covered by a layer of newly
formed material. In addition, the EDS analysis confirms
that the newly formed layer is mainly composed of cal-
cium and phosphorous. On the other hand, the 80Si–
10Ca–10P glass surface was not covered by new material
and the EDS spectrum indicated the same chemical
composition as in the initial glass. Any glass of this series
with P2O5 content higher than 10 mol-% did not pro-
duce a bioactive response. As an example in Fig. 10 the
unchanged surfaces of 80Si–5Ca–15P and 80Si–20P
before and after 7 days of soaking in SBF are presented.
In summary, the in vitro bioactivity tests confirm that the
glasses with P2O5 content of 5.2 and 5 mol % are the ones
presenting the quickest bioactive response as it was pre-
dicted by the molecular dynamics simulations.
5 Conclusions
The efficacy of molecular dynamics simulations to predict
the chemical composition of a sol–gel glass optimal for the
quickest positive bio-response in osseous tissue regenera-
tion has been demonstrated. In fact, the mathematical
relationship derived by means of a MD-derived structural
descriptor (Ca/P ratio in the calcium-phosphate rich
regions) determined that the appropriate glass composition
is 80% SiO2–14.8% CaO–5.2% P2O5 (80Si–14.8Ca–5.2P)
and the experiments have confirmed this prediction.
Acknowledgments Financial support from the Italian Ministry
MIUR (Project COFIN2006, Prot. 2006032335_005 and Project
COFIN2006, Prot. 2006033728 is gratefully acknowledged as well as
the research project MAT2007-61927 MAT2008-736 of CICYT
Spain. A.P. would like to thank the ‘Fondazione Cassa di Risparmio
di Modena’ for financial support.
References
1. Li R, Clark AE, Hench LL (1991) J Appl Biomat 2:231–239
2. Pereira MM, Clark AE, Hench LL (1994) J Biomed Mater Res
28:693–698
3. Martinez A, Izquierdo-Barba I, Vallet-Regi M (2000) Chem
Mater 12:3080–3088
4. Vallet-Regi M, Izquierdo-Barba I, Salinas AJ (1999) J Biomed
Mater Res 46:560–565
5. Vallet-Regi M, Ragel CV, Salinas AJ (2003) Eur J Inorg Chem
103:1029–1043
6. Kokubo T, Kushitani H, Sakka S, Kitsugi T, Yamamuro T (1990)
J Biomed Mater Res 24:721–734
7. Salinas AJ, Vallet-Regı M, Izquierdo-Barba I (2001) J Sol-Gel
Sci Technol 21:13–25
8. Salinas AJ, Martin AI, Vallet-Regi M (2002) J Biomed Mater Res
61:524–532
9. Vallet-Regi M, Salinas AJ, Ramirez-Castellanos J, Gonzalez-
Calbet JM (2005) Chem Mater 17:1874–1879
10. Tilocca A (2009) Proc R Soc A 465:1003–1027
11. Tilocca A, Cormack AN, de Leeuw NH (2007) Chem Mater
19:95–103
12. Mead RN, Mountjoy G (2006) J Phys Chem B 110:14273–14278
13. Pedone A, Malavasi G, Cormack AN, Segre U, Menziani MC
(2007) Chem Mater 19:3144–3154
14. Pedone A, Malavasi G, Menziani MC, Segre U, Cormack AN
(2008) J Phys Chem C 112:11034–11041
Fig. 10 SEM micrographs of
the glasses with high P2O5
contents before and after being
soaked 7 days in SBF. Any new
material is observed in the glass
surface confirming that both
glasses are non bioactive
218 J Sol-Gel Sci Technol (2013) 67:208–219
123
Author's personal copy

15. Lusvardi G, Malavasi G, Cortada M, Menabue L, Menziani MC,
Pedone A, Segre U (2008) J Phys Chem B 112:12730–12739
16. Tilocca A, Cormack AN (2010) Langmuir 26:545–551
17. Garofalini SH (2001) Molecular modelling theory: application in
the geosciences. In: Cygan RT, Kubiki JD (eds) Reviews in
mineralogy geochemistry. Geochemical Society, Mineralogical
Society of America, Washington, DC
18. Pedone A, Malavasi G, Menziani MC, Cormack AN, Segre U
(2006) J Phys Chem B 110:11780–11795
19. Pedone A, Malavasi G, Menziani MC, Segre U, Cormack AN
(2008) Chem Mater 20:4356–4366
20. Huff NT, Demiralp E, Cagin T, Goddard WA III (1999) J Non-
Cryst Solids 253:133–142
21. Vollmayr K, Kob W, Binder K (1996) Phys Rev B 54:15808–
15827
22. Pota M, Pedone A, Malavasi G, Durante C, Cocchi M, Menziani
MC (2010) Comput Mater Sci 47:739–751
23. Lee BM, Baik HK, Seong BS, Munetoh S, Motooka T (2006)
Comput Mater Sci 37:203–208
24. Hanneman A, Schon JC, Jansen M (2005) J Mater Chem 15:
1167–1178
25. Petkov V, Holzhuter G, Troge U, Gerber T, Himmel B (1998)
J Non-Cryst Solids 231:17–30
26. Bhattacharya S, Kieffer J (2008) J Phys Chem C 112:1764–1771
27. Mead RN, Mountjoy G (2006) Chem Mater 18:3956–3964
28. Kolb M, Herrmann J (1985) J Phys A 18:L435–L441
29. Jullien R, Hasmy A (1995) Phys Rev Lett 74:4003–4006
30. Pereira JCG, Catlow CRA, Price GD (2001) J Phys Chem A
106:130–148
31. Elanany M, Selvam P, Yokosuka T, Takami S, Kubo M, Imamura
A, Miyamoto A (2003) J Phys Chem B 107:1518–1524
32. Priven A (2004) Glass Technol 45:244–254
33. SciGlass 3.5 (1997) SciVision, Burlington
34. Smith W, Forrester TR (1996) J Mol Graph 14:136–141
35. Zhravlev LT (1987) Langmuir 3:316–318
36. Lusvardi G, Malavasi G, Menabue L, Aina V, Bertinetti L,
Cerrato G, Morterra C (2010) Langmuir 26:10303–10314
37. Saravanapavan P, Hench LL (2003) J Non Cryst Solids 318:1–13
38. Pedone A (2009) J Phys Chem C 113:20773–20784
39. Bohner M, Lemaitre J (2009) Biomaterials 30:2175–2179
40. Skipper LJ, Sowrey FE, Pickup DM, Drake KO, Smith ME,
Saravanapavan P, Hench LL, Newport RJ (2005) J Mater Chem
15:2369–2374
41. Lenova E, Izquierdo-Barba I, Arcos D, Lopez-Noriega A, Hedin
N, Vallet-Regı M, Eden M (2008) J Phys Chem C 112:5552–
5562
42. Pedone A, Charpentier T, Malavasi G, Menziani MC (2010)
Chem Mater 22:5644–5652
43. Tilocca A, Cormack AN (2008) Il Nuovo Cimento B 123:1415–
1423
J Sol-Gel Sci Technol (2013) 67:208–219 219
123
Author's personal copy
Related Documents