UDC 622.276 NEW INFLOW PERFORMANCE RELATIONSHIP FOR SOLUTION-GAS DRIVE OIL RESERVOIRS K.A. Fattah 1,* , Mohamed Elias 2 , H. Ahmed El-Banbi 3 , El-Sayed A. El-Tayeb 3 1 King Saud University, Faculty of Engineering,Petroleum and Natural Gas Department Riyadh, Kingdom of Saudi Arabia, * e-mail: [email protected] 2 Weatherford, Mina Abdullah, Kuwait e-mail: [email protected] 3 Cairo University, Faculty of Eng., Petroleum Department, Giza, Egypt Abstract. The Inflow Performance Relationship (IPR) describes the behavior of the well’s flowing pressure and production rate, which is an important tool in understanding the reservoir/well behavior and quantifying the production rate. The IPR is often required for designing well completion, optimizing well production, nodal analysis calculations, and design- ing artificial lift. Different IPR correlations exist today in the petroleum industry with the most commonly used models are that of Vogel’s and Fetkovitch’s. In addition to few analytical cor- relations, that usually suffers from limited applicability. In this work, a new model to predict the IPR curve was developed, using a new correla- tion that accurately describes the behavior the oil mobility as a function of the average reser- voir pressure. This new correlation was obtained using 47 actual field cases in addition to sev- eral simulated tests. After the development of the new model, its validity was tested by comparing its accur- acy with that of the most common IPR models such as Vogel, Fetkovitch, Wiggins, and Sukarno models. Twelve field cases were used for this comparison. The results of this comparison showed that: the new developed model gave the best accuracy with an average absolute error of 6.6 %, while the other common models are ranked, according to their accuracy in the follow- ing order to be Fetkovich, Sukarno, Vogel, and Wiggins, with average absolute errors of 7 %, 12.1 %, 13.7 %, and 15.7 respectively. The new developed IPR model is simple in application, covers wide range of reservoir parameters, and requires only one test point. Therefore, it provides a considerable advantage compared to the multipoint test method of Fetkovich. Moreover, due to its accuracy and simpli- city, the new IPR provides a considerable advantage compared to the widely used method of Vogel. Finally, the application of the new model is illustrated with field examples for current and future IPR computations. Keywords: Inflow Performance Relationship, oil mobility, solution- gas drive oil reser- voir, empirically IPR correlations, analytically IPR correlations Introduction For slightly compressible fluids, the productivity index is given by: J = 0.00708 ⋅ kh ln ( r e / r w )−0.75+ S [ k ro μ o B o ] . (1) _____________________________________________________________________________ Electronic scientific journal “Oil and Gas Business”, 2012, № 5 http://www.ogbus.ru/eng/ 343

Welcome message from author
This document is posted to help you gain knowledge. Please leave a comment to let me know what you think about it! Share it to your friends and learn new things together.
Transcript
UDC 622.276
NEW INFLOW PERFORMANCE RELATIONSHIPFOR SOLUTION-GAS DRIVE OIL RESERVOIRS
K.A. Fattah1,*, Mohamed Elias2, H. Ahmed El-Banbi3, El-Sayed A. El-Tayeb3
1 King Saud University, Faculty of Engineering,Petroleum and Natural Gas DepartmentRiyadh, Kingdom of Saudi Arabia, *e-mail: [email protected]
2 Weatherford, Mina Abdullah, Kuwaite-mail: [email protected]
3 Cairo University, Faculty of Eng., Petroleum Department, Giza, Egypt
Abstract. The Inflow Performance Relationship (IPR) describes the behavior of the well’s flowing pressure and production rate, which is an important tool in understanding the reservoir/well behavior and quantifying the production rate. The IPR is often required for designing well completion, optimizing well production, nodal analysis calculations, and design-ing artificial lift. Different IPR correlations exist today in the petroleum industry with the most commonly used models are that of Vogel’s and Fetkovitch’s. In addition to few analytical cor-relations, that usually suffers from limited applicability.
In this work, a new model to predict the IPR curve was developed, using a new correla-tion that accurately describes the behavior the oil mobility as a function of the average reser-voir pressure. This new correlation was obtained using 47 actual field cases in addition to sev-eral simulated tests.
After the development of the new model, its validity was tested by comparing its accur-acy with that of the most common IPR models such as Vogel, Fetkovitch, Wiggins, and Sukarno models. Twelve field cases were used for this comparison. The results of this comparison showed that: the new developed model gave the best accuracy with an average absolute error of 6.6 %, while the other common models are ranked, according to their accuracy in the follow-ing order to be Fetkovich, Sukarno, Vogel, and Wiggins, with average absolute errors of 7 %, 12.1 %, 13.7 %, and 15.7 respectively.
The new developed IPR model is simple in application, covers wide range of reservoir parameters, and requires only one test point. Therefore, it provides a considerable advantage compared to the multipoint test method of Fetkovich. Moreover, due to its accuracy and simpli -city, the new IPR provides a considerable advantage compared to the widely used method of Vogel.
Finally, the application of the new model is illustrated with field examples for current and future IPR computations.
Keywords: Inflow Performance Relationship, oil mobility, solution- gas drive oil reser-voir, empirically IPR correlations, analytically IPR correlations
Introduction
For slightly compressible fluids, the productivity index is given by:
J = 0.00708⋅khln(re /r w)−0.75+S [ kro
μ o Bo ] . (1)
_____________________________________________________________________________ Electronic scientific journal “Oil and Gas Business”, 2012, № 5 http://www.ogbus.ru/eng/
343
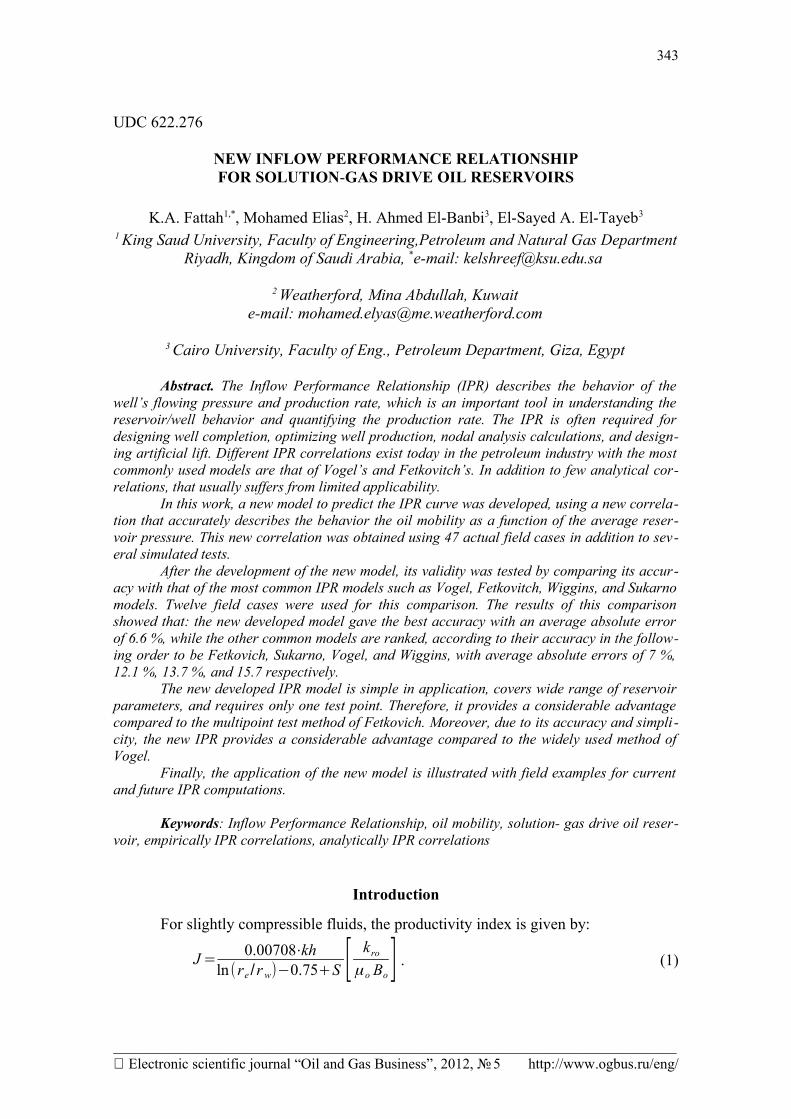
Therefore, the variables that affecting the productivity index and in turn the inflow performance are the pressure dependent parameters (µo, Bo, and kro). Fig. 1 schematically illustrates the behavior of those variables as a function of average reser-voir pressure (pr). Above the bubble-point pressure (pb), kr0 equals unity and the term (kro/µoBo) is almost constant. As the pressure declines below pb, the gas is released from solution which can cause a large decrease in both kro and (kro/µoBo).
Fig. 1. Effect of pr on Bo, µo, and kro (After Ahmed,T.1)
Assuming that the well’s productivity index (PI) is constant, the oil flow rate can be calculated as:
qo=J ( pr−pwf ) . (2)Eq. 2 suggests that the inflow into a well is directly proportional to the pressure
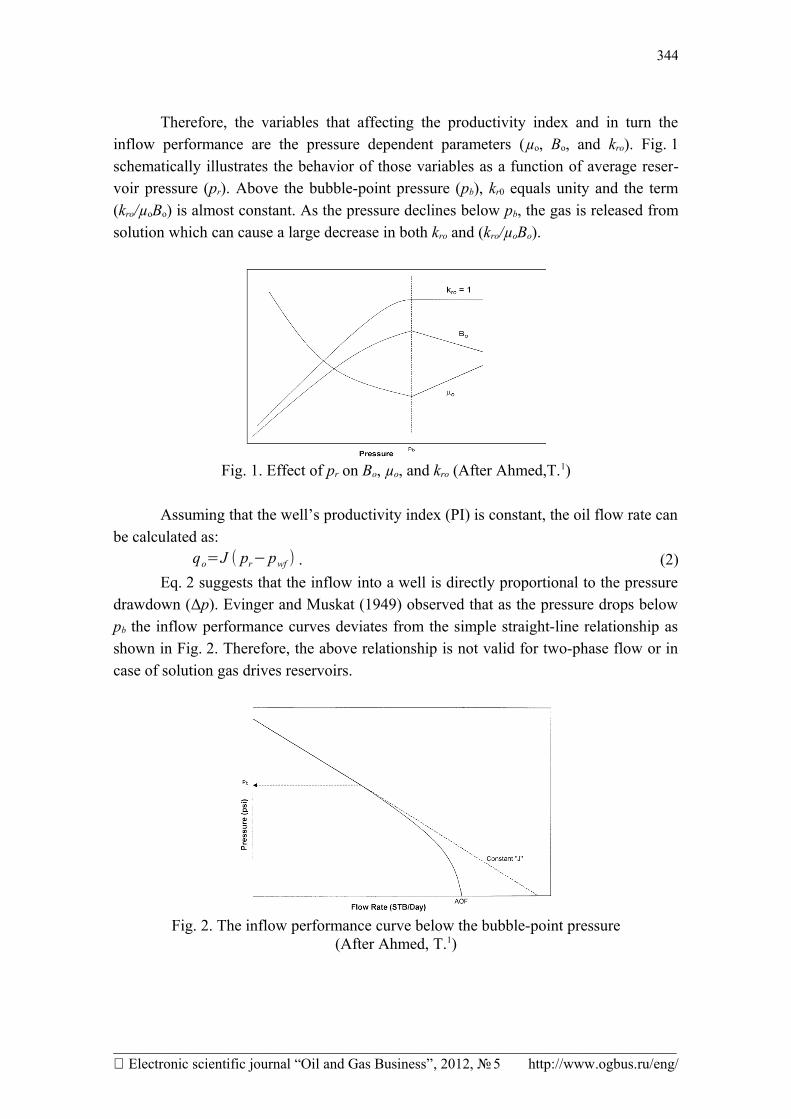
drawdown (Δp). Evinger and Muskat (1949) observed that as the pressure drops below pb the inflow performance curves deviates from the simple straight-line relationship as shown in Fig. 2. Therefore, the above relationship is not valid for two-phase flow or in case of solution gas drives reservoirs.
Fig. 2. The inflow performance curve below the bubble-point pressure(After Ahmed, T.1)
_____________________________________________________________________________ Electronic scientific journal “Oil and Gas Business”, 2012, № 5 http://www.ogbus.ru/eng/
344
Many IPR correlations addressed the curvature in Fig. 2 of the inflow perform-ance curves in case of solution gas drive oil reservoirs in which pb is the initial reservoir pressure. Based on the literature survey, the most known IPR correlations can be sub-divided into empirically and analytically derived correlations. Some of the most known empirical correlations are Vogel (1968), Fetkovich (1973), Kilns and Majcher (1992), Wiggins (1993), and Sukarno et al. (1995). Some of the most known analytical correla-tions are Wiggins et al. (1991, 1992), and Del Castillo, et al. (2003).
The empirical derived correlationsVogel's method
Vogel (1968) used a computer program based on Weller’s (1966) assumptions and twenty-one reservoir data sets to develop an IPR as:
qo
qo , max=1−0.2[ pwf
pr ]−0.8[ pwf
pr ]2
. (3)
Vogel’s correlation gave a good match with the actual well inflow performance at early stages of production but deviates at later stages of the reservoir life. Therefore, this will affect the prediction of inflow performance curves in case of solution gas drive reservoirs, because at later stages of production the amount of the free gas that comes out of the oil will be greater than the amount at the early stages of production.
Fetkovich's method
Fetkovich (1973) developed an IPR based on multi-rate tests “40 different oil wells from six fields” and the general treatment of the inflow performance provided by Raghavan (1993) under pseudo-steady state conditions. Eq. 4 gives the oil flow rate as introduced by Raghavan (1993):
qo= J̄ ∫pwf
pr k ro(So)μ o Bo
dp , (4)
where J̄ is defined by:
J̄ = 11.142
khln(r e/r w)−0.75+S . (5)
Eq. 4 is not useful in a practical sense, therefore, Fetkovich proposed the follow-ing relationship between the oil mobility function and pr:
rpx
oBo
oSrok⋅=
µ
)(
, (6)where x is constant. Finally, the "Fetkovich form" of the IPR equation is given as the "backpressure" modification form, which is written as:
_____________________________________________________________________________ Electronic scientific journal “Oil and Gas Business”, 2012, № 5 http://www.ogbus.ru/eng/
345
qo
qo , max=[1− pwf
2
pr2 ]
n
. (7)
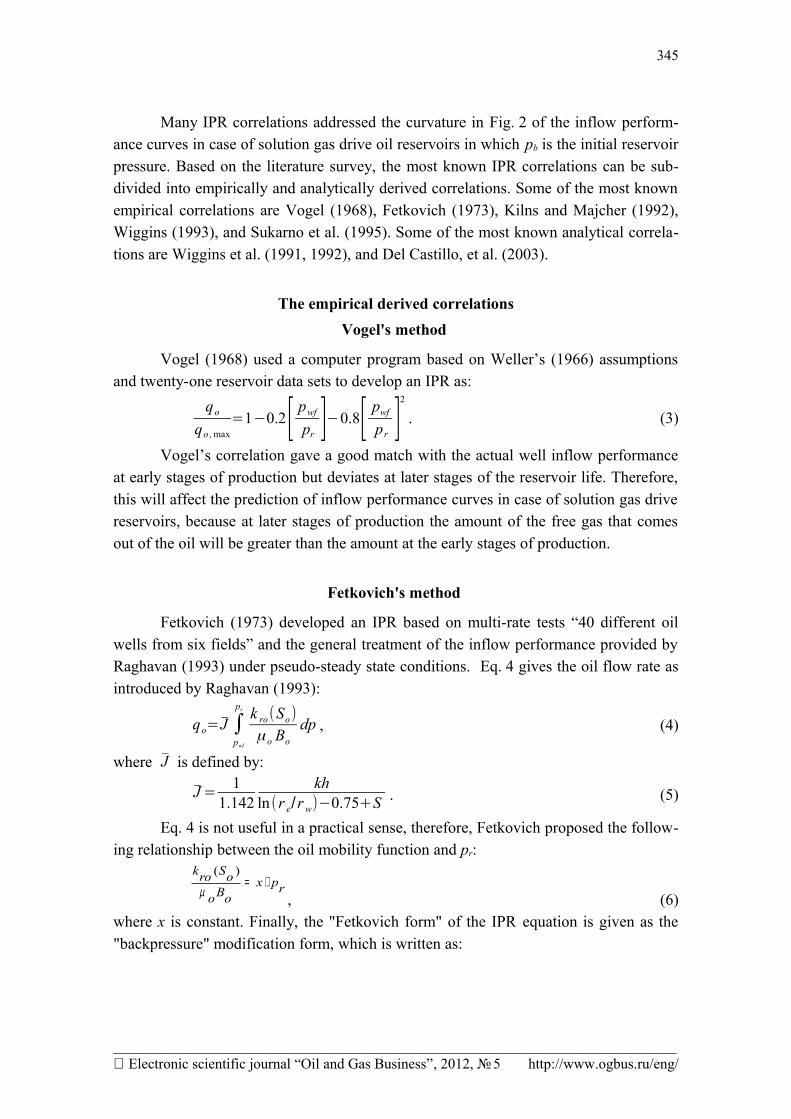
Eq. 7 requires a multi-rate test to determine the value of n. As indicated, the main parameter that affect on the Fetkovich's model is the oil mobility as a function of pr, which assumed to be linear relationship as illustrated in Fig. 3.
Fig. 3. Mobility-pressure behavior for a solution gas drive reservoir (After Fetkovich4)
Klins and Majcher's method
Based on Vogel’s work, Klins and Majcher (1992) developed the following IPR that takes into account the change in bubble-point pressure and reservoir pressure.
qo
qo , max∣S=0=[1−0.295( pwf
pr )−0.705( pwf
pr )N1] , (8)
where N 1=(0.28+0.72pr
pb)⋅(1.235+0.001 pb) . (9)
Wiggins's method
Wiggins (1993) developed the following generalized empirical three phase IPR similar to Vogel’s correlation based on his developed analytical model in 1991:
qo
qo , max=1−0.519167( pwf
pr )−0.481092( pwf
pr )2
. (10)
Sukarno and Wisnogroho's method
Sukarno and Wisnogroho (1995) developed an IPR (Eq. 11) based on simulation results that attempts to account for the flow-efficiency variation caused by rate-depend-ent skin:
qo
qo , max∣S=0=FE [1−0.1489( pwf
pr )−0.4416( pwf
pr )2
−0.4093( pwf
pr )3] , (11)
_____________________________________________________________________________ Electronic scientific journal “Oil and Gas Business”, 2012, № 5 http://www.ogbus.ru/eng/
346
where:
FE=ao+a1( pwf
pr )+a2( pwf
pr )2
+a3( pwf
pr )3
; (12)
a i=boi+b1i⋅S+b2i⋅S2+b3i⋅S3 . (13)In Eq. 13, ai, boi, b1i, b2i, and b3i are the fitting coefficients.
The analytical derived correlationsWiggins's method
Wiggins (1991) and Wiggins, et al. (1992) studied the three-phase (oil, water, and gas) inflow performance for oil wells in a homogeneous, bounded reservoir. They started from the basic principle of mass balance with the pseudo-steady state solution to develop the following analytically IPR:
qo
qo , max=1+
C1
D ( pwf
pr )+C2
D ( pwf
pr )2
+C3
D ( pwf
pr )3
+C 4
D ( pwf
pr )4
. (14)
Where, C1, C2, C3…Cn, and D coefficients are determined based on the oil mobi-lity function and its derivatives taken at pr.
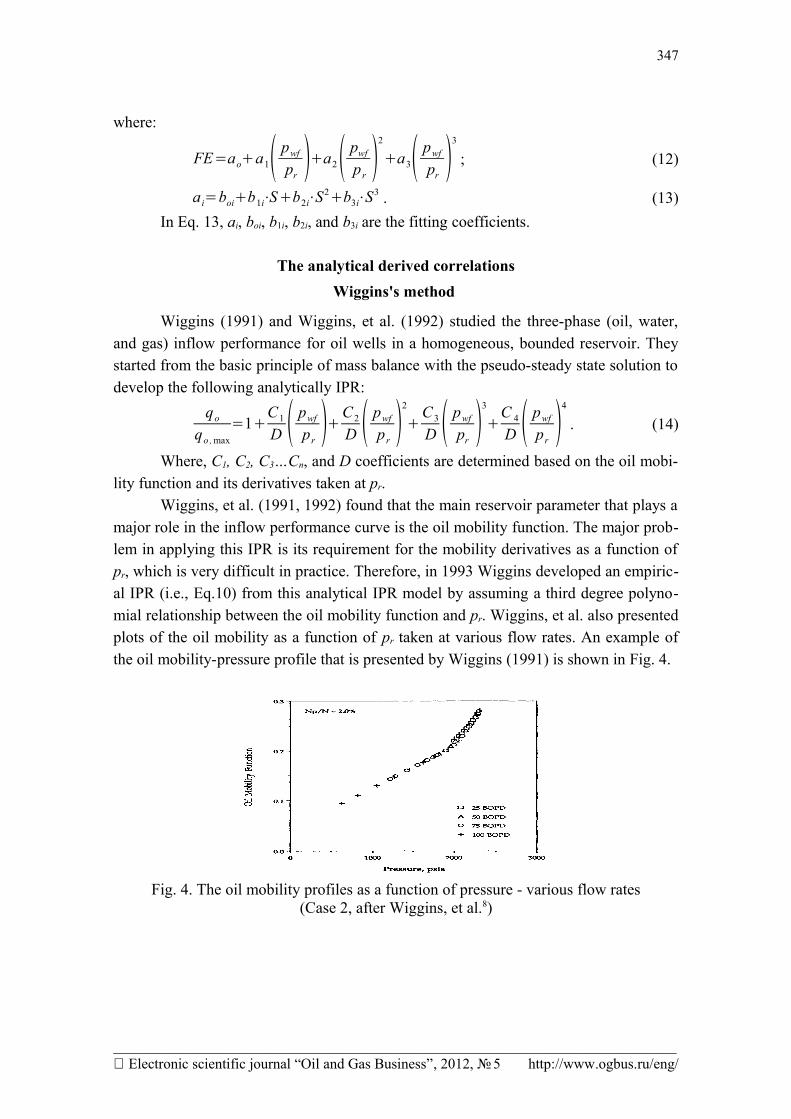
Wiggins, et al. (1991, 1992) found that the main reservoir parameter that plays a major role in the inflow performance curve is the oil mobility function. The major prob-lem in applying this IPR is its requirement for the mobility derivatives as a function of pr, which is very difficult in practice. Therefore, in 1993 Wiggins developed an empiric-al IPR (i.e., Eq.10) from this analytical IPR model by assuming a third degree polyno-mial relationship between the oil mobility function and pr. Wiggins, et al. also presented plots of the oil mobility as a function of pr taken at various flow rates. An example of the oil mobility-pressure profile that is presented by Wiggins (1991) is shown in Fig. 4.
Fig. 4. The oil mobility profiles as a function of pressure - various flow rates(Case 2, after Wiggins, et al.8)
_____________________________________________________________________________ Electronic scientific journal “Oil and Gas Business”, 2012, № 5 http://www.ogbus.ru/eng/
347
Del Castillo's method
Del Castillo (2003), Del Castillo et al. (2003) developed theoretical attempt to relate the IPR with the fundamental flow theories. In this model, a second-degree poly-nomial IPR is obtained with a variable coefficient (v), or the oil IPR parameter that in fact be a strong function of pressure and saturation. The starting point for this develop-ment is the pseudo-pressure formulation for the oil phase, which is given as:
p po( p)=[μ o Bo
k ro ]pn
⋅∫pbase
p k ro
μo Bodp . (15)
In that work, the authors presumed that the oil mobility function has a linear relationship with the average reservoir pressure as given below:
k ro
μ o Bo∣pr
= f ( pr)=e+2 d⋅pr . (16)
Where e, and d are constants established from the presumed behavior of the oil mobility profile. Fig. 3 refers to the physical interpretation of Eq. 16. Substituting with Eq. 16 in Eq. 15 and manipulating, the following equation could be presented:
qo
qo , max=1−ν[ pwf
pr ]−(1−ν)[ pwf
pr ]2
. (17)
Specifically, the ν-parameter is given as:
ν= 1
(1+de
pr) . (18)
Wiggins (1991) and Del Castillo (2003) relationships can only be applied indir-ectly or inferred, by estimating the oil mobility as a function of pr to construct the IPR curve.
Summary of literature survey
As indicated, the empirical IPRs suffer from the limitation of their application range as they depend on the data used in their generation, and lack of accuracy. In addi-tion, they aren’t explicitly functioning of reservoir rock and fluid data, which are differ-ent from one reservoir to another. On the other hand, the analytical IPRs suffer from their difficulty to be applied due to its requirement to the oil mobility profiles with its derivatives, and the assumptions used in their development. As discussed, the main parameter that affects PI and in turns the IPR curves is the oil mobility as a function of pr. Therefore, the relationship between the oil mobility and pr should be accurately determined. In addition, the most common equation that represents a basic start point for the development of any IPR in case of solution gas drive reservoirs is Eq. 15, which mainly a function of the oil mobility (kro/µoBo).
Most of the empirical IPRs did not take into their consideration the whole effect of the oil mobility function, this in turn largely reduce the accuracy and utility of these
_____________________________________________________________________________ Electronic scientific journal “Oil and Gas Business”, 2012, № 5 http://www.ogbus.ru/eng/
348
IPRs. Even though the models that considered this effect, such as the models of Fetkovich (1973) and Wiggins (1993), assumed the relationships between this function and pr, as a linear form and a third polynomial form for Fetkovich and Wiggins, respectively. In fact, these linear and polynomial forms don’t accurately describe the behavior of the oil mobility as a function of pr with an accurate manner. On the other hand, some of analytical IPRs didn’t considered the effect of oil mobility, except the models of Wiggins, et al. (1991, 1992) Del Castillo, et al. (2003). Wiggins’s model is so complicated because it requires the oil mobility represented in its derivates as a function of pr, this is greatly difficult in application. Del Castillo’s model is not accurate; this is because Del Castillo assumed a liner relationship between the oil mobility function and pr, which in turn reduce the accuracy of this model.
Another parameter should be considered in the selecting of the IPR method, is the aspect of conducting the flow tests. It is evident that test costs have to be taken into consideration. Finally, the range of applicability will also affect the selecting of the IPRs to predict the well performance.
Accordingly based on the literature survey in this work, it is necessary to:– Develop a new, more general, simple, and consistent method to correlate
inflow performance trends for solution gas drive oil reservoirs. This new method takes into consideration the behavior of the oil mobility function with the average reservoir pressure without the direct knowledge of this behavior.
– Determine the applicability and accuracy of the proposed new model by apply-ing it on different field cases with a comparison with some of the most known and used IPR equations, considering a wide range of fluid, rock, and reservoir characteristics.
– Test some of the available IPR methods on field data.– Address the prediction of future performance from current test information.
The new developed IPR model
In this work, a single well 3D radial reservoir model using MORE (2006) reser-voir simulator was built. The reservoir simulation was used to investigate the shape and in turn the relationship between the oil mobility function and pr. Then, a new IPR was derived based on the resulted oil mobility-pressure profile; this new IPR is mainly a function of the relationship between the oil mobility and pr. Then, forty-seven field cases (published cases) were used to develop an empirical relationship between the oil mobility and pr. Thus, obtaining a new IPR model that is explicitly functioning of the oil mobility that is highly affecting the IPR model.
Mobility-reservoir pressure relationship
Production rate and pressure results from six simulation cases were used to develop the inflow performance curves. Table 1 presents the ranges of reservoir, rock,
_____________________________________________________________________________ Electronic scientific journal “Oil and Gas Business”, 2012, № 5 http://www.ogbus.ru/eng/
349
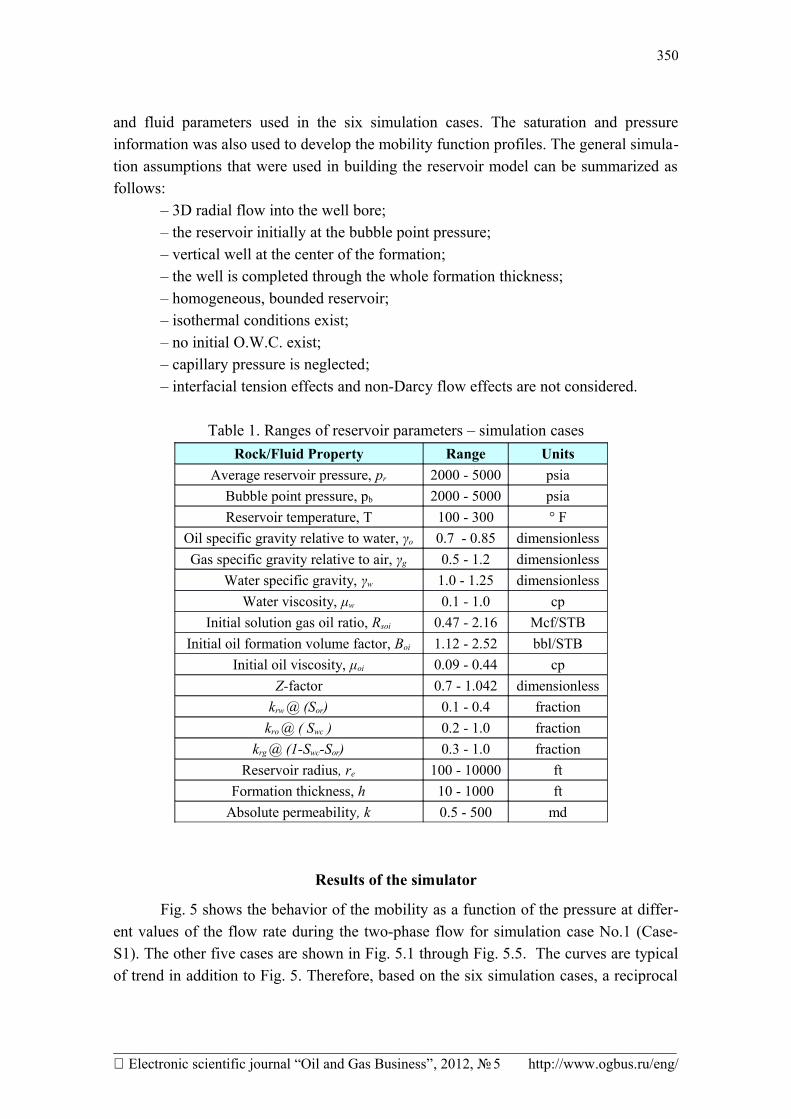
and fluid parameters used in the six simulation cases. The saturation and pressure information was also used to develop the mobility function profiles. The general simula-tion assumptions that were used in building the reservoir model can be summarized as follows:
– 3D radial flow into the well bore; – the reservoir initially at the bubble point pressure;– vertical well at the center of the formation;– the well is completed through the whole formation thickness;– homogeneous, bounded reservoir;– isothermal conditions exist;– no initial O.W.C. exist;– capillary pressure is neglected;– interfacial tension effects and non-Darcy flow effects are not considered.
Table 1. Ranges of reservoir parameters – simulation casesRock/Fluid Property Range Units
Average reservoir pressure, pr 2000 - 5000 psiaBubble point pressure, pb 2000 - 5000 psiaReservoir temperature, T 100 - 300 ° F
Oil specific gravity relative to water, γo 0.7 - 0.85 dimensionlessGas specific gravity relative to air, γg 0.5 - 1.2 dimensionless
Water specific gravity, γw 1.0 - 1.25 dimensionlessWater viscosity, μw 0.1 - 1.0 cp
Initial solution gas oil ratio, Rsoi 0.47 - 2.16 Mcf/STBInitial oil formation volume factor, Boi 1.12 - 2.52 bbl/STB
Initial oil viscosity, μoi 0.09 - 0.44 cpZ-factor 0.7 - 1.042 dimensionless
krw @ (Sor) 0.1 - 0.4 fractionkro @ ( Swc ) 0.2 - 1.0 fraction
krg @ (1-Swc-Sor) 0.3 - 1.0 fractionReservoir radius, re 100 - 10000 ft
Formation thickness, h 10 - 1000 ftAbsolute permeability, k 0.5 - 500 md
Results of the simulator
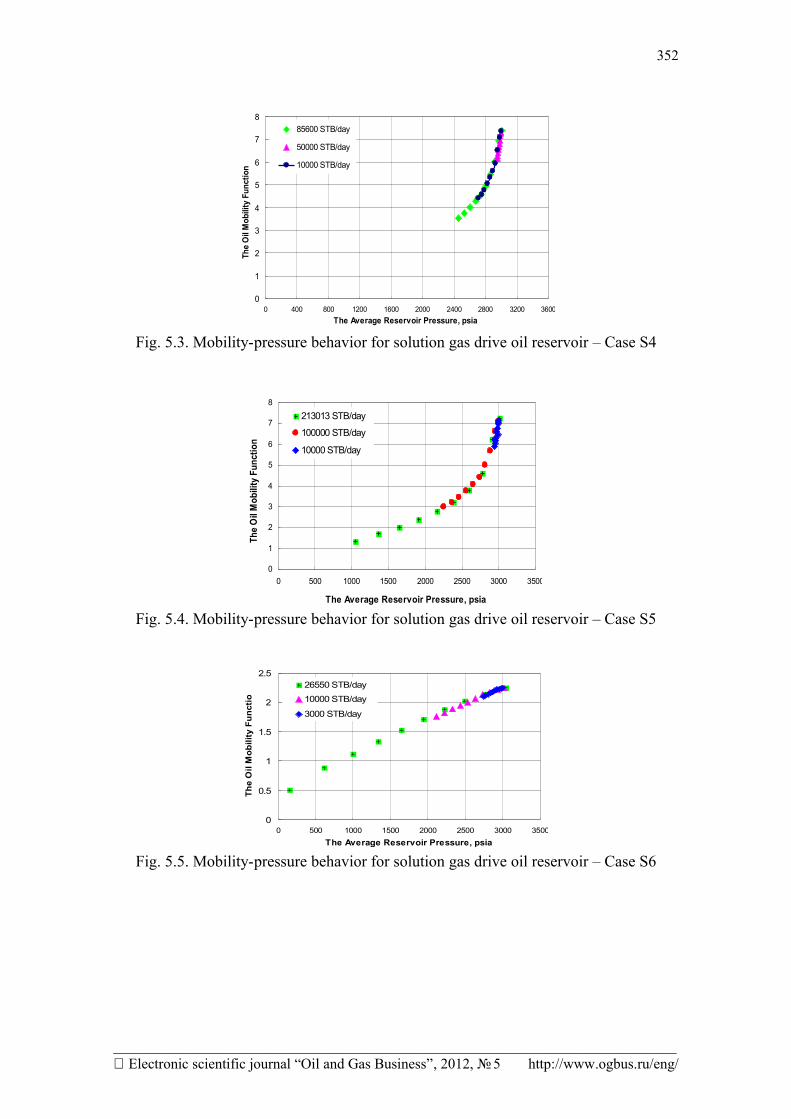
Fig. 5 shows the behavior of the mobility as a function of the pressure at differ-ent values of the flow rate during the two-phase flow for simulation case No.1 (Case-S1). The other five cases are shown in Fig. 5.1 through Fig. 5.5. The curves are typical of trend in addition to Fig. 5. Therefore, based on the six simulation cases, a reciprocal
_____________________________________________________________________________ Electronic scientific journal “Oil and Gas Business”, 2012, № 5 http://www.ogbus.ru/eng/
350
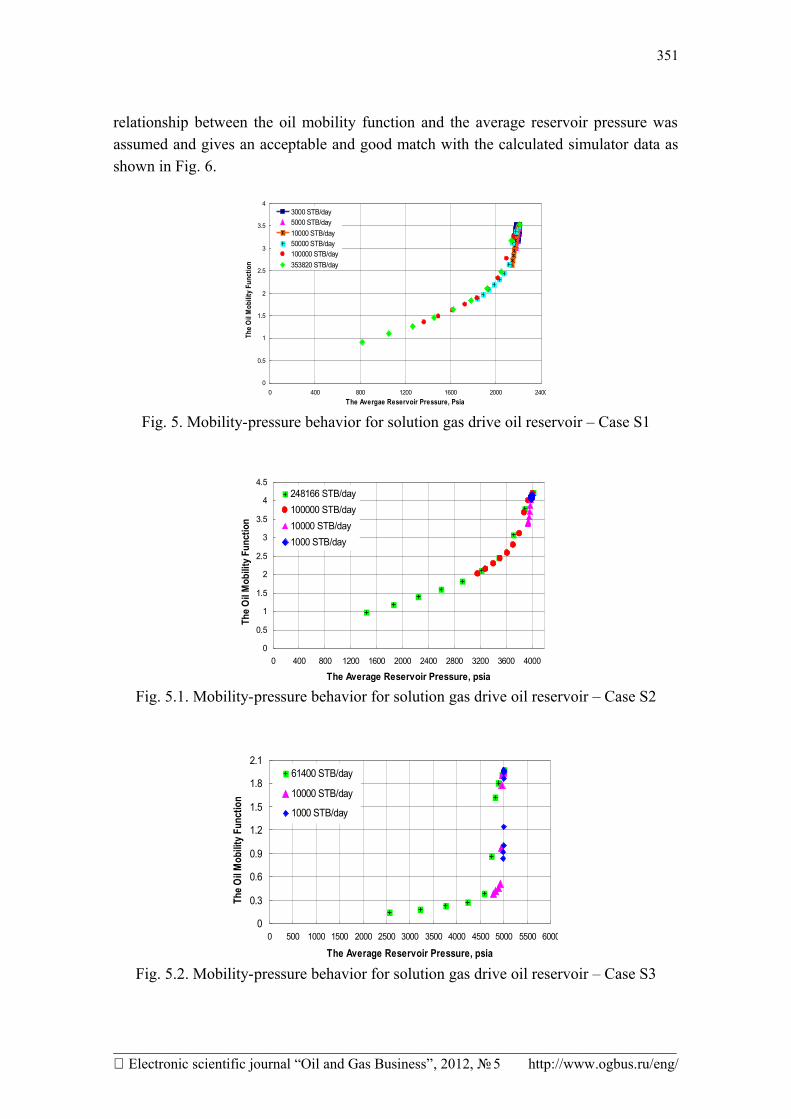
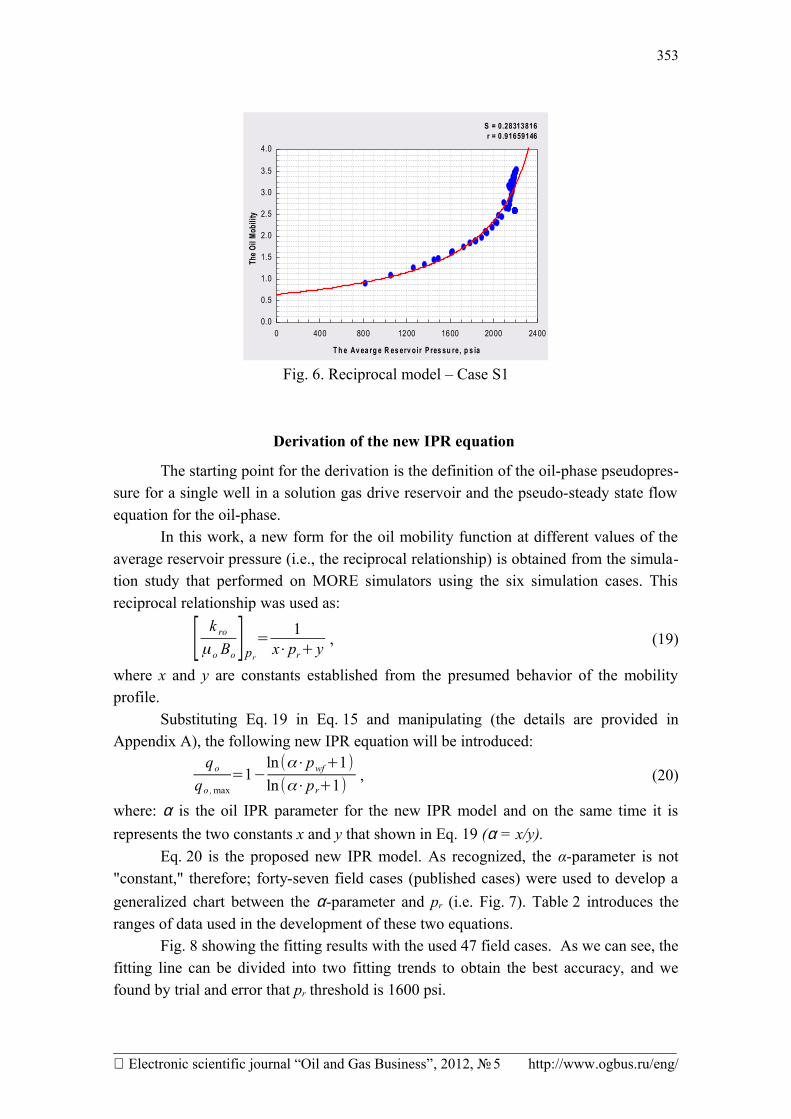
relationship between the oil mobility function and the average reservoir pressure was assumed and gives an acceptable and good match with the calculated simulator data as shown in Fig. 6.
0
0.5
1
1.5
2
2.5
3
3.5
4
0 400 800 1200 1600 2000 2400The Avergae Reservoir Pressure, Psia
The O
il Mob
ility F
unct
ion
3000 STB/day5000 STB/day10000 STB/day50000 STB/day100000 STB/day353820 STB/day
Fig. 5. Mobility-pressure behavior for solution gas drive oil reservoir – Case S1
0
0.5
1
1.5
2
2.5
3
3.5
4
4.5
0 400 800 1200 1600 2000 2400 2800 3200 3600 4000
The Average Reservoir Pressure, psia
The
Oil
Mob
ility
Fun
ctio
n
248166 STB/day100000 STB/day10000 STB/day1000 STB/day
Fig. 5.1. Mobility-pressure behavior for solution gas drive oil reservoir – Case S2
0
0.3
0.6
0.9
1.2
1.5
1.8
2.1
0 500 1000 1500 2000 2500 3000 3500 4000 4500 5000 5500 6000
The Average Reservoir Pressure, psia
The O
il Mob
ility F
unct
ion
61400 STB/day
10000 STB/day
1000 STB/day
Fig. 5.2. Mobility-pressure behavior for solution gas drive oil reservoir – Case S3
_____________________________________________________________________________ Electronic scientific journal “Oil and Gas Business”, 2012, № 5 http://www.ogbus.ru/eng/
351
0
1
2
3
4
5
6
7
8
0 400 800 1200 1600 2000 2400 2800 3200 3600The Average Reservoir Pressure, psia
The
Oil
Mob
ility
Fun
ctio
n
85600 STB/day
50000 STB/day
10000 STB/day
Fig. 5.3. Mobility-pressure behavior for solution gas drive oil reservoir – Case S4
0
1
2
3
4
5
6
7
8
0 500 1000 1500 2000 2500 3000 3500
The Average Reservoir Pressure, psia
The
Oil
Mob
ility
Fun
ctio
n
213013 STB/day
100000 STB/day
10000 STB/day
Fig. 5.4. Mobility-pressure behavior for solution gas drive oil reservoir – Case S5
0
0.5
1
1.5
2
2.5
0 500 1000 1500 2000 2500 3000 3500
The Average Reservoir Pressure, psia
The
Oil
Mob
ility
Fun
ctio
n
26550 STB/day
10000 STB/day
3000 STB/day
Fig. 5.5. Mobility-pressure behavior for solution gas drive oil reservoir – Case S6
_____________________________________________________________________________ Electronic scientific journal “Oil and Gas Business”, 2012, № 5 http://www.ogbus.ru/eng/
352
S = 0.28313816r = 0.91659146
T h e Av ea rg e R es erv oi r P res su re, p s ia
The O
il Mo
bilit
y
0 400 800 1200 1600 2000 24000.0
0.5
1.0
1.5
2.0
2.5
3.0
3.5
4.0
Fig. 6. Reciprocal model – Case S1
Derivation of the new IPR equation
The starting point for the derivation is the definition of the oil-phase pseudopres-sure for a single well in a solution gas drive reservoir and the pseudo-steady state flow equation for the oil-phase.
In this work, a new form for the oil mobility function at different values of the average reservoir pressure (i.e., the reciprocal relationship) is obtained from the simula-tion study that performed on MORE simulators using the six simulation cases. This reciprocal relationship was used as:
[ k ro
μ o Bo ]pr
= 1x⋅pr+ y , (19)
where x and y are constants established from the presumed behavior of the mobility profile.
Substituting Eq. 19 in Eq. 15 and manipulating (the details are provided in Appendix A), the following new IPR equation will be introduced:
qo
qo , max=1−
ln(α⋅pwf+1)ln(α⋅pr+1)
, (20)
where: α is the oil IPR parameter for the new IPR model and on the same time it is represents the two constants x and y that shown in Eq. 19 (α = x/y).
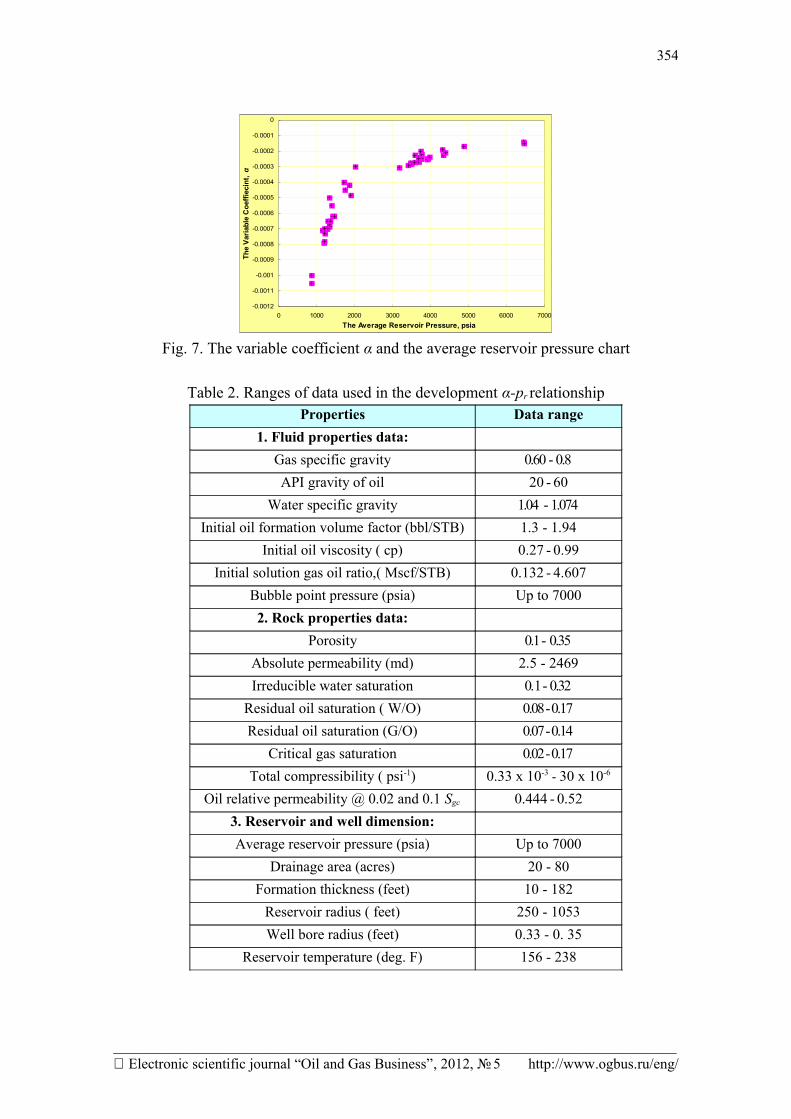
Eq. 20 is the proposed new IPR model. As recognized, the α-parameter is not "constant," therefore; forty-seven field cases (published cases) were used to develop a generalized chart between the α-parameter and pr (i.e. Fig. 7). Table 2 introduces the ranges of data used in the development of these two equations.
Fig. 8 showing the fitting results with the used 47 field cases. As we can see, the fitting line can be divided into two fitting trends to obtain the best accuracy, and we found by trial and error that pr threshold is 1600 psi.
_____________________________________________________________________________ Electronic scientific journal “Oil and Gas Business”, 2012, № 5 http://www.ogbus.ru/eng/
353
-0.0012
-0.0011
-0.001
-0.0009
-0.0008
-0.0007
-0.0006
-0.0005
-0.0004
-0.0003
-0.0002
-0.0001
0
0 1000 2000 3000 4000 5000 6000 7000The Average Reservoir Pressure, psia
The
Varia
ble
Coe
ffiec
int, α
Fig. 7. The variable coefficient α and the average reservoir pressure chart
Table 2. Ranges of data used in the development α-pr relationshipProperties Data range
1. Fluid properties data:Gas specific gravity 0.60 - 0.8API gravity of oil 20 - 60
Water specific gravity 1.04 - 1.074Initial oil formation volume factor (bbl/STB) 1.3 - 1.94
Initial oil viscosity ( cp) 0.27 - 0.99Initial solution gas oil ratio,( Mscf/STB) 0.132 - 4.607
Bubble point pressure (psia) Up to 70002. Rock properties data:
Porosity 0.1 - 0.35Absolute permeability (md) 2.5 - 2469Irreducible water saturation 0.1 - 0.32
Residual oil saturation ( W/O) 0.08 - 0.17Residual oil saturation (G/O) 0.07 - 0.14
Critical gas saturation 0.02 - 0.17Total compressibility ( psi-1) 0.33 x 10⁻³ - 30 x 10-6
Oil relative permeability @ 0.02 and 0.1 Sgc 0.444 - 0.523. Reservoir and well dimension:Average reservoir pressure (psia) Up to 7000
Drainage area (acres) 20 - 80Formation thickness (feet) 10 - 182
Reservoir radius ( feet) 250 - 1053Well bore radius (feet) 0.33 - 0. 35
Reservoir temperature (deg. F) 156 - 238
_____________________________________________________________________________ Electronic scientific journal “Oil and Gas Business”, 2012, № 5 http://www.ogbus.ru/eng/
354
-0.002
-0.0018
-0.0016
-0.0014
-0.0012
-0.001
-0.0008
-0.0006
-0.0004
-0.0002
0
0 1000 2000 3000 4000 5000 6000 7000
The Average Reservoir Pressure, psia
The V
aria
ble C
oeffi
ecin
t, α
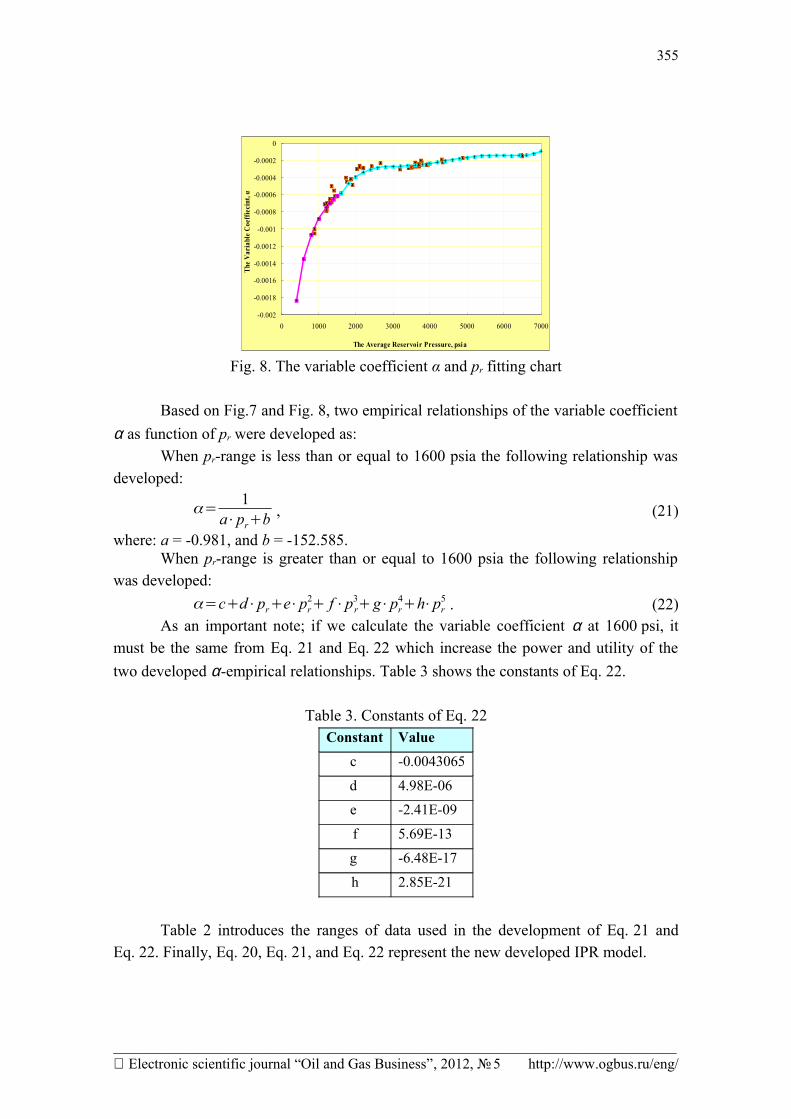
Fig. 8. The variable coefficient α and pr fitting chart
Based on Fig.7 and Fig. 8, two empirical relationships of the variable coefficient α as function of pr were developed as:
When pr-range is less than or equal to 1600 psia the following relationship was developed:
α= 1a⋅pr+b , (21)
where: a = -0.981, and b = -152.585.When pr-range is greater than or equal to 1600 psia the following relationship
was developed:α=c+d⋅pr+e⋅pr
2+ f⋅pr3+g⋅pr
4+h⋅pr5 . (22)
As an important note; if we calculate the variable coefficient α at 1600 psi, it must be the same from Eq. 21 and Eq. 22 which increase the power and utility of the two developed α-empirical relationships. Table 3 shows the constants of Eq. 22.
Table 3. Constants of Eq. 22Constant Value
c -0.0043065
d 4.98E-06
e -2.41E-09
f 5.69E-13
g -6.48E-17
h 2.85E-21
Table 2 introduces the ranges of data used in the development of Eq. 21 and Eq. 22. Finally, Eq. 20, Eq. 21, and Eq. 22 represent the new developed IPR model.
_____________________________________________________________________________ Electronic scientific journal “Oil and Gas Business”, 2012, № 5 http://www.ogbus.ru/eng/
355
Methodology to use the new IPR model
Step 1. If pr is less than or equal to 1600 psia, therefore, the oil IPR parameter (α) is calculated using Eq. 21 as follows:
α= 1−0.981⋅pr−152.585 .
If pr is greater than or equal to 1600 psia, therefore, the oil IPR parameter (α) is calculated using Eq. 22 as follows:α=−0.0043065+4.98E -06⋅pr−2.41E -09⋅pr
2+5.69E -13⋅pr3−6.48E -17⋅pr
4+2.85E -21⋅pr5
Step 2. Calculate qo, max using Eq. 20 at any given test point:
qo , max=qo(test ) /[1−ln (−α⋅pwf (test)+1)ln (−α⋅pr+1) ] STB/day.
Step 3 . Assume several values for pwf and calculate the corresponding qo using Eq. 20:
qo=qo ,max⋅[1−ln (α⋅pwf +1)ln (−α⋅pr+1) ] STB/day.
Step 4. For future IPR, calculate αf using the future value of pr) f using Eq. 21 or Eq. 22 according to the value of pr) f:
Step 5. Solve for qo, max, at future conditions using Fetkovich’s equation as fol-lows:
qo , max ) f =qo , max ) p⋅[ pr ) f
pr ) p ]3.0
STB/day.
Step 6. Generate the future inflow performance-curve by applying Eq. 20 as fol-lows:
qo=qo ,max ) f⋅[1−ln(α f⋅pwf+1)ln(α f⋅pr ) f +1) ] STB/day.
Validation of the new IPR model
To verify and validate the new developed IPR model, information from 12 field cases were collected and analyzed to get the present inflow performance, and two field cases were collected and used to predict the future IPR curve. The field cases and reser-voir data of these cases are included in Table 4. Each field case uses actual field data which representing different producing conditions. In order to test the accuracy and reli-ability of the new developed IPR model, which is single point method, it will be com-pared to some of the other two-phase IPR methods currently available in the industry. These methods are those of Vogel (single point method), Fetkovich (multi-point meth-
_____________________________________________________________________________ Electronic scientific journal “Oil and Gas Business”, 2012, № 5 http://www.ogbus.ru/eng/
356
od), Wiggins (single point method), and Sukarno (single point method) for the present inflow performance. And, Vogel, Fetkovich, Wiggins for the future inflow performance
Elias (2009) presents the complete details of the comparison analysis while the cases analyzed for present and future performances are summarized in Table 4 and Table 5, respectively.
Table 4. Validation field cases analyzed for the present performanceCase Case Name Case Type pr, psia
1 Carry City Well Vertical Well 16002 Well M110-1979 Vertical Well 23203 Well M200 Vertical Well 32634 Case X1B Horizontal Well 25805 Well 1, Gulf of Suez, Egypt Vertical Well 20206 Well 3-Field C Vertical Well 3926
7 Well 4 Vertical Well,Layered Reservoir 5801
8 Well E, Keokuk Field Vertical Well 17109 Well A, Keokuk Field Vertical Well 173410 Well TMT-27 Vertical Well 86811 Well A Vertical Well 178512 Well 8, West Texas Vertical Well 640
Table 5. Validation field cases analyzed for the future performanceCase Test Chronology Case Name pr, psia
1 Present Well M110-1979 23211 Future Well M110-1987 20672 Present Well A, Keokuk Field-1934 17342 Future Well A, Keokuk Field-1935 1609
Field case No. 1: Carry City well
Gallice et al. (1999) presented multirate-test data for a well producing from the Hunton Lime in the Carry City Field, Oklahoma. The test was conducted in approxi-mately 2 weeks during the well, which was producing at random rates, rather than in an increasing or decreasing rate sequence. The average reservoir pressure was 1600 psia, with an estimated bubble-point pressure of 2530 psia and an assumed skin value of zero. The multi-rate test of this well is summarized in Table 6.
Table 7 presents the predictions of the well’s performance for the test informa-tion at a flowing bottomhole pressure of 1194 psia, which representing a 25 % of the pressure drawdown. As can be observed, the maximum well deliverability varies from
_____________________________________________________________________________ Electronic scientific journal “Oil and Gas Business”, 2012, № 5 http://www.ogbus.ru/eng/
357
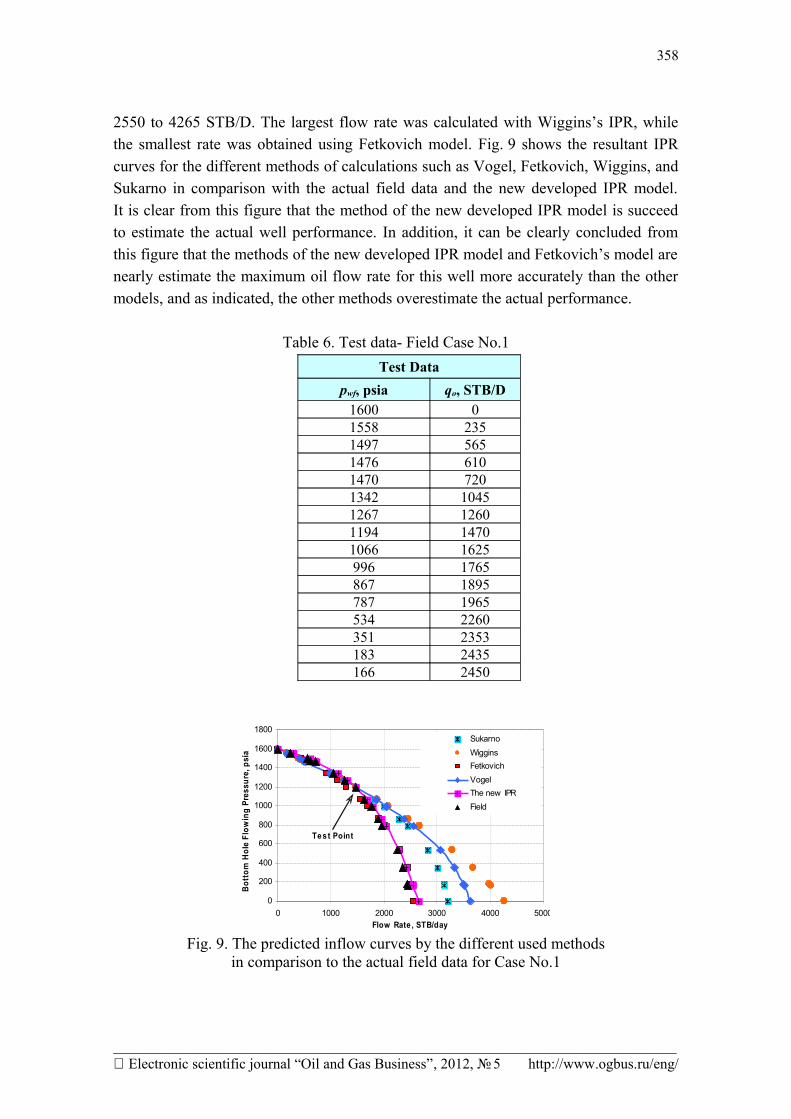
2550 to 4265 STB/D. The largest flow rate was calculated with Wiggins’s IPR, while the smallest rate was obtained using Fetkovich model. Fig. 9 shows the resultant IPR curves for the different methods of calculations such as Vogel, Fetkovich, Wiggins, and Sukarno in comparison with the actual field data and the new developed IPR model.It is clear from this figure that the method of the new developed IPR model is succeed to estimate the actual well performance. In addition, it can be clearly concluded from this figure that the methods of the new developed IPR model and Fetkovich’s model are nearly estimate the maximum oil flow rate for this well more accurately than the other models, and as indicated, the other methods overestimate the actual performance.
Table 6. Test data- Field Case No.1Test Data
pwf, psia qo, STB/D1600 01558 2351497 5651476 6101470 7201342 10451267 12601194 14701066 1625996 1765867 1895787 1965534 2260351 2353183 2435166 2450
0
200
400
600
800
1000
1200
1400
1600
1800
0 1000 2000 3000 4000 5000Flow Rate , STB/day
Bott
om H
ole
Flow
ing
Pres
sure
, psi
a
SukarnoWigginsFetkovichVogelThe new IPRField
Tes t Point
Fig. 9. The predicted inflow curves by the different used methodsin comparison to the actual field data for Case No.1
_____________________________________________________________________________ Electronic scientific journal “Oil and Gas Business”, 2012, № 5 http://www.ogbus.ru/eng/
358
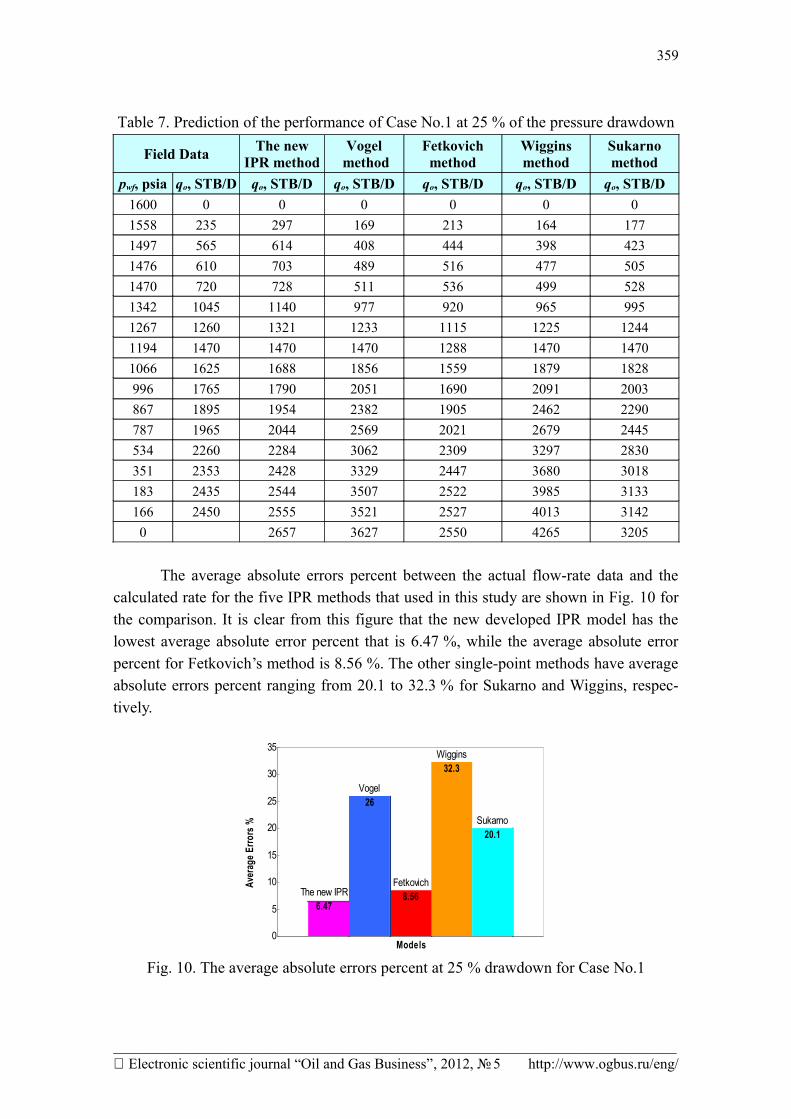
Table 7. Prediction of the performance of Case No.1 at 25 % of the pressure drawdown
Field Data The newIPR method
Vogel method
Fetkovichmethod
Wigginsmethod
Sukarnomethod
pwf, psia qo, STB/D qo, STB/D qo, STB/D qo, STB/D qo, STB/D qo, STB/D1600 0 0 0 0 0 01558 235 297 169 213 164 1771497 565 614 408 444 398 4231476 610 703 489 516 477 5051470 720 728 511 536 499 5281342 1045 1140 977 920 965 9951267 1260 1321 1233 1115 1225 12441194 1470 1470 1470 1288 1470 14701066 1625 1688 1856 1559 1879 1828996 1765 1790 2051 1690 2091 2003867 1895 1954 2382 1905 2462 2290787 1965 2044 2569 2021 2679 2445534 2260 2284 3062 2309 3297 2830351 2353 2428 3329 2447 3680 3018183 2435 2544 3507 2522 3985 3133166 2450 2555 3521 2527 4013 31420 2657 3627 2550 4265 3205
The average absolute errors percent between the actual flow-rate data and the calculated rate for the five IPR methods that used in this study are shown in Fig. 10 for the comparison. It is clear from this figure that the new developed IPR model has the lowest average absolute error percent that is 6.47 %, while the average absolute error percent for Fetkovich’s method is 8.56 %. The other single-point methods have average absolute errors percent ranging from 20.1 to 32.3 % for Sukarno and Wiggins, respec-tively.
The new IPR 6.47
Vogel 26
Fetkovich 8.56
Wiggins 32.3
Sukarno 20.1
0
5
10
15
20
25
30
35
Aver
age E
rrors
%
Models
Fig. 10. The average absolute errors percent at 25 % drawdown for Case No.1
_____________________________________________________________________________ Electronic scientific journal “Oil and Gas Business”, 2012, № 5 http://www.ogbus.ru/eng/
359
In summary, the new model provided the best estimates of well performance for this case’s entire range of interest. The multipoint method of Fetkovich tends to do a bet-ter job of predicting well performance than the other three single-point methods. Overall, the single-point methods of Vogel, Wiggins, and Sukarno provided similar great average differences in this case. As indicated in this work, the more important relationship to eval-uate well performance is the relationship between the oil mobility function and the aver-age reservoir pressure, and this was clearly demonstrated from the value of the average absolute error percent that resulted from using the new developed IPR model.
Field cases summary for the present inflow performance
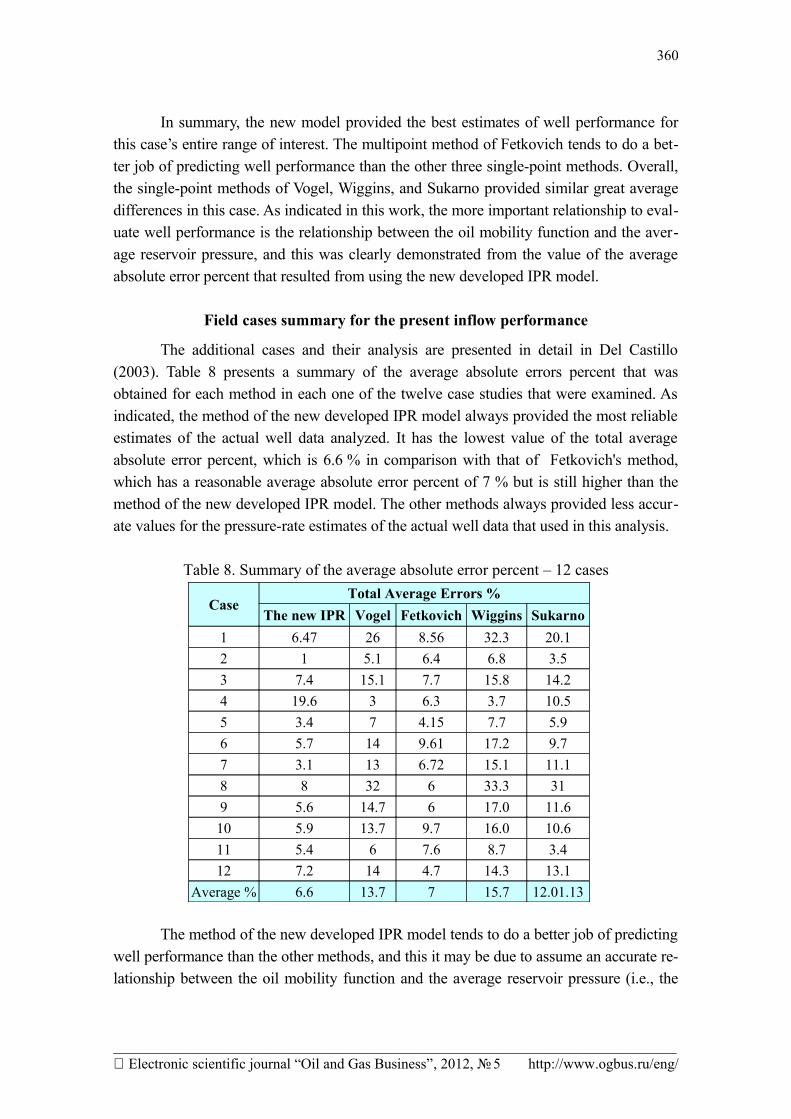
The additional cases and their analysis are presented in detail in Del Castillo (2003). Table 8 presents a summary of the average absolute errors percent that was obtained for each method in each one of the twelve case studies that were examined. As indicated, the method of the new developed IPR model always provided the most reliable estimates of the actual well data analyzed. It has the lowest value of the total average absolute error percent, which is 6.6 % in comparison with that of Fetkovich's method, which has a reasonable average absolute error percent of 7 % but is still higher than the method of the new developed IPR model. The other methods always provided less accur-ate values for the pressure-rate estimates of the actual well data that used in this analysis.
Table 8. Summary of the average absolute error percent – 12 cases
CaseTotal Average Errors %
The new IPR Vogel Fetkovich Wiggins Sukarno1 6.47 26 8.56 32.3 20.12 1 5.1 6.4 6.8 3.53 7.4 15.1 7.7 15.8 14.24 19.6 3 6.3 3.7 10.55 3.4 7 4.15 7.7 5.96 5.7 14 9.61 17.2 9.77 3.1 13 6.72 15.1 11.18 8 32 6 33.3 319 5.6 14.7 6 17.0 11.610 5.9 13.7 9.7 16.0 10.611 5.4 6 7.6 8.7 3.412 7.2 14 4.7 14.3 13.1
Average % 6.6 13.7 7 15.7 12.01.13
The method of the new developed IPR model tends to do a better job of predicting well performance than the other methods, and this it may be due to assume an accurate re-lationship between the oil mobility function and the average reservoir pressure (i.e., the
_____________________________________________________________________________ Electronic scientific journal “Oil and Gas Business”, 2012, № 5 http://www.ogbus.ru/eng/
360
Reciprocal Relationship). Overall, the single-point methods of Vogel, Wiggins, and Su-karno provided great average absolute errors percent in the cases examined – 12.1 to 15.7 %.
However, the following comment should be introduced based on the above table Case No.4, the Vogel's model provided the best estimates of well performance for this case. The single point method of Wiggins tends to do a good job of predicting well per-formance in this case. Finally, it can be concluded from this case that the new IPR mod-el has some limitations in case of low-pressure reservoirs, which have a reservoir pres-sure less than 1000 psia. This is because there were no sufficient data below 1000 psia in case of development the new IPR model, therefore it is recommended in this case to use Vogel’s model.
Field case summary for the future performance
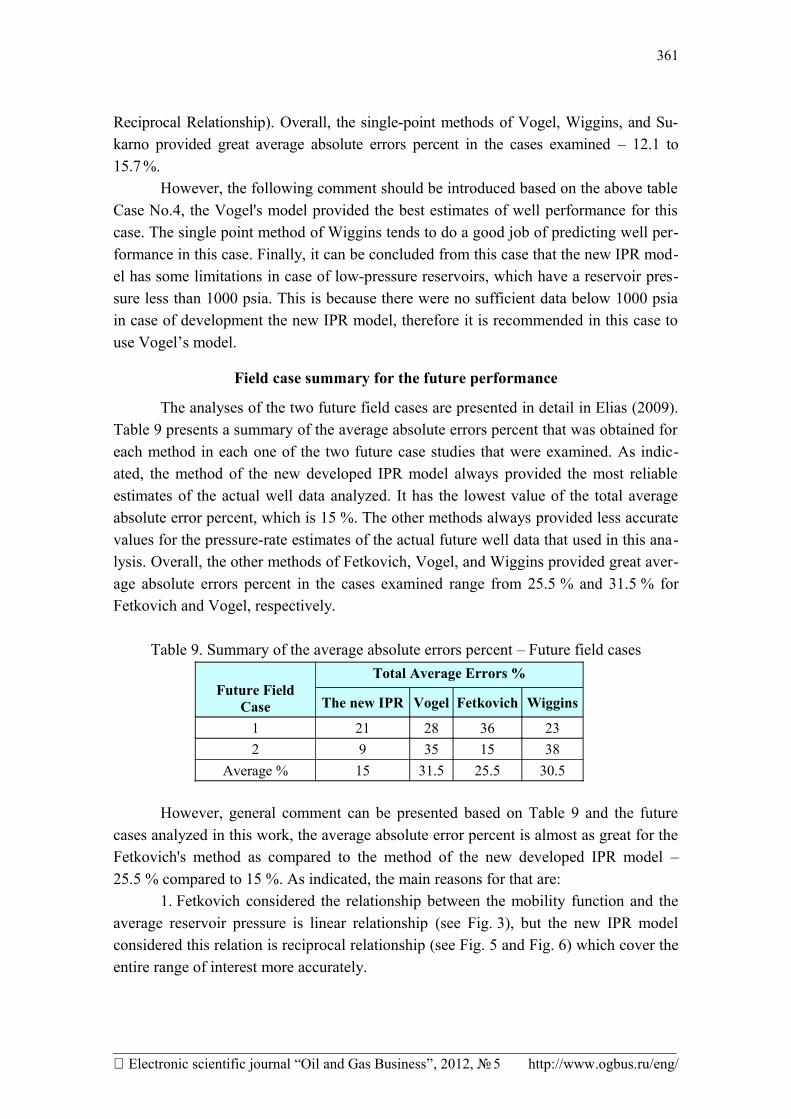
The analyses of the two future field cases are presented in detail in Elias (2009). Table 9 presents a summary of the average absolute errors percent that was obtained for each method in each one of the two future case studies that were examined. As indic-ated, the method of the new developed IPR model always provided the most reliable estimates of the actual well data analyzed. It has the lowest value of the total average absolute error percent, which is 15 %. The other methods always provided less accurate values for the pressure-rate estimates of the actual future well data that used in this ana-lysis. Overall, the other methods of Fetkovich, Vogel, and Wiggins provided great aver-age absolute errors percent in the cases examined range from 25.5 % and 31.5 % for Fetkovich and Vogel, respectively.
Table 9. Summary of the average absolute errors percent – Future field cases
Future FieldCase
Total Average Errors %
The new IPR Vogel Fetkovich Wiggins
1 21 28 36 232 9 35 15 38
Average % 15 31.5 25.5 30.5
However, general comment can be presented based on Table 9 and the future cases analyzed in this work, the average absolute error percent is almost as great for the Fetkovich's method as compared to the method of the new developed IPR model – 25.5 % compared to 15 %. As indicated, the main reasons for that are:
1. Fetkovich considered the relationship between the mobility function and the average reservoir pressure is linear relationship (see Fig. 3), but the new IPR model considered this relation is reciprocal relationship (see Fig. 5 and Fig. 6) which cover the entire range of interest more accurately.
_____________________________________________________________________________ Electronic scientific journal “Oil and Gas Business”, 2012, № 5 http://www.ogbus.ru/eng/
361
2. The backpressure equation parameter (n) of Fetkovich IPR equation does not take into consideration the change in the average reservoir pressure.
3. The new model IPR parameter (α) of Eq. 20 takes into consideration the change in the average reservoir pressure (see Eq. 21 and Eq. 22).
Conclusions
In this work, we reviewed the most commonly used IPR models, also, we developed new IPR model. The new IPR was compared to the most commonly used models using field data (12 field cases). Based on this work, we can conclude the fol-lowing:
1. A general correlation for α-parameter that represent the oil mobility as a func-tion of pr was developed by using 47 field cases. A new method to construct and predict the IPR curve for solution gas drive reservoirs was developed by using this general cor-relation of α- parameter
2. The validity of the new IPR model was tested through its application on 12 field cases in comparison with the behavior of the most common methods that are used in the industry. The results of this validation showed that the new IPR model ranked the first model that succeeded to predict the behavior of the IPR curve for the 12 examined field cases, while the other models of Fetkovich, Sukarno, Vogel, and Wiggins ranked the second, the third, the forth, and the fifth, respectively
3. The new IPR model requires one test point and is as accurate or more than Fetkovich’s model which requires three test points
4. The new developed IPR outperformed all available IPR models except at low pressures (Less than 1000 psia). At these low pressures Vogel’s correlation was found to be the most accurate model.
5. The range of applicability of Alpha- pressure relationships Eq. 21 and Eq. 22 is 860 to 7000 psi.
Nomenclature
A Drainage area of well, sq fta0,a1,a2,a3 Constants for Sukarno and Wisnogroho, dimensionless
API stock tank oil liquid gravity in ,O APIb0,b1,b2,b3 Constants for Sukarno and Wisnogroho, dimensionless
Bo Oil formation volume factor, bbl/STBBg Gas formation volume factor, bbl/SCFCA Shape constant or factor, dimensionless
C1,C2,C3,C4, D Wiggins's constants, dimensionlessd, e Del Castillo, Yanil's constants, dimensionlessh Formation thickness, ftJ Productivity index of the reservoir (PI), STB/psin deliverability exponent for Fetkovich, dimensionless
_____________________________________________________________________________ Electronic scientific journal “Oil and Gas Business”, 2012, № 5 http://www.ogbus.ru/eng/
362
N1 Oil IPR parameter for Klins's equation, dimensionlesspb Bubble Point Pressure, psiapD Dimensionless pressurepe Pressure at the outer boundary, psiaPIα Productivity index from the new IPR model, STB/psipr Average reservoir pressure, psiapwf Bottom hole flowing pressure, psiaqo Oil flow rate, STB/D
qo, max Maximum oil flow rate, STB/Dre Drainage Radius, ftRs Solution gas-oil ratio, scf/STBrw Well Radius, ftS Radial flow skin factor, dimensionlessSo Oil saturation, fractionT Reservoir temperature, οFx Reciprocal model constant, dimensionlessy Reciprocal model constant, dimensionless
( k ro
μ o Bo)pD=0Mobility ratio at zero dimensionless pressure
( k ro
μ o Bo)pD=0
/
Mobility ratio first derivative at zero dimensionless pressure
( k ro
μ o Bo)pD=0
//
Mobility ratio second derivative at zero dimensionless pressure
( k ro
μ o Bo)pD=0
///
Mobility ratio third derivative at zero dimensionless pressure
α Oil IPR parameter for the new IPR model, dimensionlessγ Euler's constant (0.577216 )γg Gas gravity, fractionγo Oil gravity, fractionμo Oil Viscosity, cpΔp Pressure drawdown, psi
References
1. Tarek Ahmed, Paul McKinney. Advanced reservoir engineering. Elsevier Inc., Gulf Professional Publishing, 2005. PP. 342-361.
2. Archer R.A., Castillo Y. Del, Blasingame T.A. New perspectives on vogel type ipr models for gas condensate and solution-gas drive systems, SPE paper 80907 presented at the SPE Production operations symposium, Oklahoma, OK, 23- 25 March 2003. DOI: 10.2118/80907-MS
3. Y. Del Castillo. New inflow performance relationships for gas condensate reservoirs. M.S. Thesis. Texas A& M University, May 2003, College Station.
_____________________________________________________________________________ Electronic scientific journal “Oil and Gas Business”, 2012, № 5 http://www.ogbus.ru/eng/
363
4. Elias Mohamed. New inflow performance relationship for solution gas drive reservoirs. MS thesis, U. of Cairo, Giza, Egypt (2009).
5. Evinger H.H., Muskat J. Calculation of theoretical productivity factors, Transactions AIME, 1942, Vol. 146, pp. 126 - 139.
6. Fetkovich M.J. The isochronal testing of oil wells. SPE Paper 4529 presented at the Fall Meeting of the Society of Petroleum Engineers of AIME, Las Vegas, NV, Sep. 30-Oct. 3, 1973. DOI: 10.2118/4529-MS
7. Gallice F. A comparison of two-phase inflow performance relationships. MS thesis, U. of Oklahoma, Norman, Oklahoma (1997).
8. Frederic Gallice, Michael L. Wiggins. A comparison of two-phase inflow per-formance relationships. SPE Paper 88445 presented at SPE Mid-Continent Operations Symposium, 28-31 March 1999, Oklahoma City, Oklahoma. DOI: 10.2118/52171-MS
9. Klins M.A., Majher M.W. Inflow Performance relationships for damaged or improved wells producing under solution-gas drive. SPE paper 19852, Journal of Pet-roleum Technology, 1992, Vol. 44, Num. 12, pp. 1357 - 1363. DOI: 10.2118/19852-PA
10. MORE Manual, Version 6.3, ROXAR (2006).11. Rajagopal Raghavan. Well test analysis. PTR Prentice Hall, 1993.
PP. 513 - 514.12. Sukarno P., Wisnogroho A. Generalized two-phase IPR curve equation un-
der influence of non-linear flow efficiency, Proc., Soc of Indonesian Petroleum Engin-eers Production Optimization Intl. Symposium, 1995, Bandung, Indonesia, pp. 31 - 3.
13. Vogel J.V. Inflow performance relationships for solution gas drive wells, Journal of Petroleum Technology, 1968, Vol. 20, Num. 1, pp. 83 - 92. (SPE Paper 1476). DOI: 10.2118/1476-PA
14. Weller W.T. Reservoir performance during two-phase flow, Journal of Pet-roleum Technology, 1966, Vol. 18, Num. 2, pp. 240 - 246. (SPE Paper 1334). DOI: 10.2118/1334-PA
15. Wiggins M.L, Russel J.L., Jennings J.W. Analytical inflow performance relationships for three phase flow, SPE Paper 24055 presented at SPE Western Regional Meeting, 30 March-1 April 1992, Bakersfield, California. DOI: 10.2118/24055-MS
16. Wiggins M.L., Generalized inflow performance relationships for three-phase flow, SPE Paper 25458 presented at the SPE Production Operations Symposium, Oklahoma City, OK, March 21-23 1993. DOI: 10.2118/25458-MS
17. Wiggins M.L., Wang H.-S. A two-phase IPR for horizontal oil wells, SPE Paper 94302 presented at SPE Production Operations Symposium, 16-19 April 2005, Oklahoma City, Oklahoma. DOI: 10.2118/94302-MS
18. Wiggins M.L. Inflow Performance of Oil Wells Producing Water, PhD dis-sertation, Texas A&M University, TX (1991).
_____________________________________________________________________________ Electronic scientific journal “Oil and Gas Business”, 2012, № 5 http://www.ogbus.ru/eng/
364
Appendix A
In this Appendix, the derivation of the new IPR equation is based on the pseudo-steady state flow equation for a single well in a solution gas drive reservoir systems (pseudopressure formulation). In addition the relation between the mobility of the oil phase and pr (i.e., Reciprocal relationship – Mo = 1.0 / (a∙ pr+ b) is used. Where a and b are the two equation variables. The definition of the oil-phase pseudopressure for a single well in a solution gas drive reservoir is given as:
p po( p)=[μ o Bo
k ro ]pn
⋅∫pbase
p k ro
μo Bodp . (A.1)
The pseudo-steady state flow equation for the oil-phase in a solution gas drive reservoir is given by:
p po( pr)= p p o
( pwf )+qo⋅bSS , (A.2)where:
bSS=141.2μ o Bo
kro∣pn[ 1
h (ln( re
rw−3
4+S))] . (A.3)
In this work, a new form for the oil mobility function at different values of the average reservoir pressure (i.e., the reciprocal relationship) is obtained from the result of the simulation study that performed on MORE simulators using the six simulation cases as follows:
[ k ro
μ o Bo ]pr
= 1x⋅pr+ y
. (A.4)
Where, x and y are two variables established from the presumed behavior of the mobility profile.
Solving Eq. A.2 for the oil rate, qo, the following equation for the oil flow rate can be presented:
qo=1
bSS[ p po
( pr)−p po( pwf )] . (A.5)
Solving Eq. A.5 for the maximum oil rate, qo, max (i.e., at pwf = zero or ppo (pwf) = 0):
qo , max=1
bSS[ p po
( pr)−p po( pwf =0)] . (A.6)
Dividing Eq. A.5 by Eq. A.6 gives the "IPR" form (i.e., qo/qo, max) in terms of the pseudopressure functions, which yields:
qo
qo , max=
p po( pr)− p po
( pwf )
p po( pr)− p po
( pwf=0) . (A.7)
At this point, it should be noted that, it is not the goal to proceed with the devel-opment of an IPR model in terms of the pseudopressure functions, ppo (p)-rather, the goal is to develop a simplified IPR model using Eq. A.4 and Eq. A.7 as the base rela-tions. Substituting Eq. A.4 into Eq. A.1, this yields:
_____________________________________________________________________________ Electronic scientific journal “Oil and Gas Business”, 2012, № 5 http://www.ogbus.ru/eng/
365
p po( p)=[μ o Bo
k ro ]pn
⋅∫pbase
p
[ 1x⋅p+ y ]dp=[μ o Bo
k ro ]pn
1a[ ln( x⋅p+ y)] pbase
p .
Or,
p po( p)=[μ o Bo
k ro ]pn
1a[ ln( x⋅p+ y)−ln( x⋅pbase+ y)] . (A.8)
Substituting Eq .A.8 into Eq. A.7, this gives:qo
qo , max=
[ln (x⋅pr+ y )−ln( x⋅pbase+ y )]−[ln (x⋅pwf + y )−ln( x⋅pbase+ y )][ ln(x⋅pr+ y )−ln (x⋅pbase+ y )]−[ ln( y)−ln( x⋅pbase+ y)]
Or,qo
qo , max=
ln (x⋅pr+ y )−ln (x⋅pwf + y )ln (x⋅pr+ y )−ln( y) . (A.9)
Rearranging Eq. A.9 gives the following form:qo
qo , max=
ln( x⋅pr+ y)ln (x⋅pr+ y)−ln( y )
−ln (x⋅pwf+ y )
ln(x⋅pr+ y )−ln( y) . (A.10)
Or,qo
qo , max=
ln( x⋅pr+ y)
ln( x⋅pr+ yy )
−ln( x⋅pwf + y)
ln( x⋅pr+ yy ) . (A.11)
Dividing the right term through Eq. A.11 by the term y gives the following form:
qo
qo , max=
ln( xy
pr+1)ln( x
ypr+1)
−ln( x
ypwf +1)
ln( xy
pr+1). (A.12)
And then, replace x/y by α and substituting this definition into Eq. A.12, this yields the following IPR form:
qo
qo , max=1−
ln (α pwf +1)ln (α pr+1)
. (A.13)
Where: α is the oil IPR parameter for the new IPR model.It is suggested that Eq. A.13 serves as an equation of the proposed new IPR
model.
_____________________________________________________________________________ Electronic scientific journal “Oil and Gas Business”, 2012, № 5 http://www.ogbus.ru/eng/
366
Related Documents