Eos,Vol. 81, No. 24june 13,2000 Uenzelmann-Neben and Ulrike Windhovel for improving the style of this presentation.This is contribution No. 1786 of the Alfred Wegener Institute for Polar and Marine Research. Authors Christian Miiller and Wilfried Jokat Alfred Wegener Institute for Polar and Marine Research, Columbusstrasse, D-27568 Bremerhaven, Germany; E-mail: cmueller@ awibremerhaven.de or [email protected] References Bergman, E. A., and S. C. Solomon, Earthquake swarms on the Mid-Atlantic Ridge: Products of New Eyes in the Glaciers and Ice PAGES 265,270-271 The mapping and measurement of glaciers and their changes are useful in predicting sea- level and regional water supply, studying haz- ards and climate change [Haeberli et al, 1998],and in the hydropower industry Exist- ing inventories cover only about 67,000 of the world's estimated 160,000 glaciers and are based on data collected over 50 years or more [e.g.,Haeberli et al, 1998].The data available have proven that small ice bodies are disappearing at an accelerating rate and that the Antarctic ice sheet and its fringing ice shelves are undergoing unexpected, rapid change. According to many glaciologists, much larger fluctuations in land ice—with vast implications for society—are possible in the coming decades and centuries due to natural and anthropogenic climate change [Oppenheimer, 1998]. Before glacier data can be used to address crit- ical problems pertinent to the world's economic and environmental health, the data need to become more comprehensive, more homogenous in detail and quality, and managed within Geographic Information Systems (GIS). A synchronous, GIS-based, uniform baseline inven- tory needs to be established to track global gla- cier changes; ground-validated satellite measurements are crucial to extend coverage to a representative sample of the world's land ice [Dyurgerov and Meier, 1997Haeberli, 1998]. The launch by NASA of two new environmen- tal satellites (Landsat-7 and Terra) in 1999 marks a leap in capabilities for global mapping and measurements of glaciers and ice sheets. An international glaciological consortium,Global Land Ice Measurements from Space (GLIMS), has been funded by NASA as a "Pathfinder" pro- ject to assess the status and vigor of the world's glaciers using remote sensing and field data (http://wwwflag.wr.usgs.gov/GLIMS/). GLIMS and similar projects are using satellite imaging to provide our first comprehensive and uniform look at the world's land ice. magmatism or extensional tectonics?,./. Geophys. Res., 95,4943-4965,1990. Coakley, B.I, and J. R. Cochran,Gravity evidence of very thin crust at the Gakkel Ridge (Arctic Ocean), Earth Planet. Sci. Lett., 162,81-95,1998. Dziewonski, A. M., G. Ekstrom, and N. N. Maternovskaya, Centroid-moment tensor solutions for January-March 1999, Phys. Earth Planet. Int., 118,1-2,1-11,2000. Fujita, K., D. B. Cook, H. Hasegawa, D. Forsyth, and R.Wetmiller, Seismicity and focal mechanisms of the Arctic region and the North American plate boundary in Asia, in The Arctic Ocean Region, The Geology of North America, Vol. L, Geological Soci- ety of America, Boulder, Colo., 79-100,1990. Jokat, W, E. Weigelt,Y. Kristoffersen.T. Rasmussen, and T. Schone, Eurasian Basin: Geophysical and bathy- metric results from the Morris Jesup Rise,Yermak Plateau and Gakkel Ridge, Geophys.J. Int., 123, 601-610,1995. Sky Measure Sheets New Imaging Platforms The Landsat-7 global glacier observation project is already quickly developing. This satellite's Enhanced Thematic Mapper Plus (ETM+, http://landsat.gsfc.nasa.gov/) is fully operational and delivers a veritable flood of images of glaciers and ice sheets (Figure 1). The L-7 data acquisition plan calls for three Kristoffersen,Y, E. S. Husebye, H. Bungum, and S. Gregersen, Seismic investigations of the Nansen Ridge during the Fram Experiment, Tectonophysics, 82,57-68,1982. LayT., and T. C.Wallace, Modern Global Seismology, Academic Press, New York, 521 pp., 1995. Muhe, R., H. Bohrmann, D. Garbe-Schonberg, and H. Kassens, E-MORB glasses from the Gakkel Ridge (Arctic Ocean) at 87°N: Evidence for the Earth's most northerly volcanic activity, Earth Planet. Sci. Lett., 152,1-9,1997. Nettles, M., and G. Ekstrom, Faulting mechanism of anomalous earthquakes near Bardarbunga Volcano, Iceland, J. Geophys. Res., 103, 17,973-17,983,1998. Vogt,PR., PT.Taylor,L.C. Kovacs,and G. L. Johnson, Detailed aeromagnetic investigations of the Arctic Basins, J. Geophys. Res., 84, 1071-1089,1979. image acquisition attempts each summer toward the end of the melt season (spaced every 16-day ground-track repeat cycle) for all temperate glaciers, four acquisitions per year (once every three months) of Andean and equatorial glaciers, and one acquisition in mid-summer of Greenland and Antarctica. Already, L-7 coverage exists for most of Antarc- tica and Greenland and many alpine glacier regions.The L-7 plan also has many spatial- temporal blocks of sea-ice collections. A Japanese instrument, the Advanced Space- borne Thermal Emission and Reflection Radiometer (ASTER), (http://asterweb.jpl.nasa. gov/aster.pdf),was launched by NASA aboard Fig. 1. Landsat-7 image of Storstrommen glacier, northeast Greenland, in 1999 showing many icebergs at the calving front. The front of Storstrommen surged by more than 10 km [Higgins, 1994] between 1978 and 1984. During this period, its average surface velocity increased from a normal several hundred meters per year to as much as 4000 m/yr. Transfer of ice from the upper to the lower part of the ablation area during this surge resulted in an 80-m lowering of the glacier surface in the upper part of the ablation area and a rise of similar magnitude in the lower part. Landsat-7 and ASTER images will be used to continue the study of this and other glaciers of Greenland. Original color image appears at the back of this volume.

Welcome message from author
This document is posted to help you gain knowledge. Please leave a comment to let me know what you think about it! Share it to your friends and learn new things together.
Transcript

Eos,Vol. 81, No. 24june 13,2000
Uenzelmann-Neben and Ulrike Windhovel for improving the style of this presentation.This is contribution No. 1786 of the Alfred Wegener Institute for Polar and Marine Research.
Authors
Christian Miiller and Wilfried Jokat Alfred Wegener Institute for Polar and Marine Research, Columbusstrasse, D-27568 Bremerhaven, Germany; E-mail: cmueller@ awibremerhaven.de or [email protected]
References
Bergman, E. A., and S. C. Solomon, Earthquake swarms on the Mid-Atlantic Ridge: Products of
New Eyes in the Glaciers and Ice PAGES 265,270-271
The mapping and measurement of glaciers and their changes are useful in predicting sea-level and regional water supply, studying hazards and climate change [Haeberli et al, 1998],and in the hydropower industry Existing inventories cover only about 67,000 of the world's estimated 160,000 glaciers and are based on data collected over 50 years or more [e.g.,Haeberli et al, 1998].The data available have proven that small ice bodies are disappearing at an accelerating rate and that the Antarctic ice sheet and its fringing ice shelves are undergoing unexpected, rapid change. According to many glaciologists, much larger fluctuations in land ice—with vast implications for society—are possible in the coming decades and centuries due to natural and anthropogenic climate change [Oppenheimer, 1998].
Before glacier data can be used to address critical problems pertinent to the world's economic and environmental health, the data need to become more comprehensive, more homogenous in detail and quality, and managed within Geographic Information Systems (GIS). A synchronous, GIS-based, uniform baseline inventory needs to be established to track global glacier changes; ground-validated satellite measurements are crucial to extend coverage to a representative sample of the world's land ice [Dyurgerov and Meier, 1997Haeberli, 1998].
The launch by NASA of two new environmental satellites (Landsat-7 and Terra) in 1999 marks a leap in capabilities for global mapping and measurements of glaciers and ice sheets. An international glaciological consortium,Global Land Ice Measurements from Space (GLIMS), has been funded by NASA as a "Pathfinder" project to assess the status and vigor of the world's glaciers using remote sensing and field data (http://wwwflag.wr.usgs.gov/GLIMS/). GLIMS and similar projects are using satellite imaging to provide our first comprehensive and uniform look at the world's land ice.
magmatism or extensional tectonics?,./. Geophys. Res., 95,4943-4965,1990.
Coakley, B . I , and J. R. Cochran,Gravity evidence of very thin crust at the Gakkel Ridge (Arctic Ocean),Earth Planet. Sci. Lett., 162,81-95,1998.
Dziewonski, A. M., G. Ekstrom, and N. N. Maternovskaya, Centroid-moment tensor solutions for January-March 1999, Phys. Earth Planet. Int., 118,1-2,1-11,2000.
Fujita, K., D. B. Cook, H. Hasegawa, D. Forsyth, and R.Wetmiller, Seismicity and focal mechanisms of the Arctic region and the North American plate boundary in Asia, in The Arctic Ocean Region, The Geology of North America, Vol. L, Geological Society of America, Boulder, Colo., 79-100,1990.
Jokat, W , E. Weigelt,Y. Kristoffersen.T. Rasmussen, and T. Schone, Eurasian Basin: Geophysical and bathymetric results from the Morris Jesup Rise,Yermak Plateau and Gakkel Ridge, Geophys.J. Int., 123, 601-610,1995.
Sky Measure Sheets
N e w Imaging Platforms
The Landsat-7 global glacier observation project is already quickly developing. This satellite's Enhanced Thematic Mapper Plus (ETM+, http://landsat.gsfc.nasa.gov/) is fully operational and delivers a veritable flood of images of glaciers and ice sheets (Figure 1). The L-7 data acquisition plan calls for three
Kristoffersen,Y, E. S. Husebye, H. Bungum, and S. Gregersen, Seismic investigations of the Nansen Ridge during the Fram Experiment, Tectonophysics, 82,57-68,1982.
LayT., and T. C.Wallace,Modern Global Seismology, Academic Press, New York, 521 pp., 1995.
Muhe, R., H. Bohrmann, D. Garbe-Schonberg, and H. Kassens, E-MORB glasses from the Gakkel Ridge (Arctic Ocean) at 87°N: Evidence for the Earth's most northerly volcanic activity, Earth Planet. Sci. Lett., 152,1-9,1997.
Nettles, M., and G. Ekstrom, Faulting mechanism of anomalous earthquakes near Bardarbunga Volcano, Iceland, J. Geophys. Res., 103, 17,973-17,983,1998.
Vogt,PR., PT.Taylor,L.C. Kovacs,and G. L. Johnson, Detailed aeromagnetic investigations
of the Arctic Basins, J. Geophys. Res., 84, 1071-1089,1979.
image acquisition attempts each summer toward the end of the melt season (spaced every 16-day ground-track repeat cycle) for all temperate glaciers, four acquisitions per year (once every three months) of Andean and equatorial glaciers, and one acquisition in mid-summer of Greenland and Antarctica. Already, L-7 coverage exists for most of Antarctica and Greenland and many alpine glacier regions.The L-7 plan also has many spatial-temporal blocks of sea-ice collections.
A Japanese instrument, the Advanced Space-borne Thermal Emission and Reflection Radiometer (ASTER), (http://asterweb.jpl.nasa. gov/aster.pdf),was launched by NASA aboard
Fig. 1. Landsat-7 image of Storstrommen glacier, northeast Greenland, in 1999 showing many icebergs at the calving front. The front of Storstrommen surged by more than 10 km [Higgins, 1994] between 1978 and 1984. During this period, its average surface velocity increased from a normal several hundred meters per year to as much as 4000 m/yr. Transfer of ice from the upper to the lower part of the ablation area during this surge resulted in an 80-m lowering of the glacier surface in the upper part of the ablation area and a rise of similar magnitude in the lower part. Landsat-7 and ASTER images will be used to continue the study of this and other glaciers of Greenland. Original color image appears at the back of this volume.

Eos,Vol. 81, No. 24,June 13, 2000
ASTER Operations
Other Data Source. <e.g. Landsat7)
EOSDIS L a n d D A A C (EDC)
Planning Coordination
GLIMS Coordination Center
& RC (USGS, Flagstaff)
Image Data
GLIMS WorldData Archive
(NSIDC)
GLIMS Processing Center
(e.g. UNO)
.S
Regional Center
Glacier Data
General Science
Community
Regional Center Regional Center
Steward Steward
1. A Regional Center (RC) would cover an area such as Europe.
2, A Steward would cover an area such as the Italian Alps, or possibly down to a singje gjacier.
Fig. 2. GUMS institutional "flow diagram" showing the organization of the project. Abbreviations: ASTER, Advanced Spaceborne Thermal Emission and reflection Radiometer; EDC, EROS Data Center; NSIDC, National Snow and Ice Data Center; RC, Regional Center; UNO, University of Nebraska at Omaha; USGS, US. Geological Survey.
Terra on December 18,1999, and is expected to begin delivering an equivalent flood of multispectral,stereo imaging of glaciers starting in the Northern Hemisphere in June 2000, and in the Southern Hemisphere in December 2000.Test images received to date are of high quality. GLIMS has an approach to ASTER imaging that, somewhat similar to the plan for Landsat 7, involves repeated imaging attempts late in the melt season. A system for making semi-automated glacier image data acquisition requests for ASTER was recently described by Raup et al .(2000).
Terra is orbiting in formation with Landsat-7, so illumination geometry of ASTER and ETM+ images is virtually the same. ASTER and ETM+ have complementary capabilities. ETM+ has a wide swath width (185 km) and is thus better suited than ASTER to cover the large expanses of polar ice sheets. ASTER, with a 60-km swath width and stereo-imaging capability, is better
suited to cover alpine glaciers, which tend to be debris-covered at their termini and are best mapped using stereo images. ASTER and ETM+ are similar in terms of wavelength coverage, except that ASTER has more thermal imaging bands. With 15-m spatial resolution in three VNIR bands (including one band in stereo),30-m resolution in six SWIR bands, and 90-m resolution in fiveTIR bands, ASTER is well-equipped to study the fine structural details of small alpine glaciers and to map snow, ice, and debris-covered glacier facies and moraines.
Following an initial check-out phase, which began with launch and is almost completed, ASTER will soon be into full routine operations. ASTER alone will generate over 1200 relatively cloud-free, nonpolar glacier scenes annually, plus up to thousands more of polar ice sheets if the instrument and ground data system operate as expected. The best news is that the
data are supposed to be available free of charge (plus possible marginal costs of reproduction) through the EOS Data Gateway (http://edcimswww.cr.usgs.gov/pub/ imswelcome/plain.html). Plans are to develop a system at EDC that will notify GLIMS users that requested images have been received or, if necessary need to be rescheduled.
Global Glacier Measurement and a N e w Glacier Database
To handle the impending data load from these instruments, the international GLIMS consortium has been established with regional centers and stewards at 38 institutions in 17 countries.The international structure of GLIMS and major links between institutions are shown in Figure 2. Coordination of GLIMS is taking place at the U.S. Geological Survey (USGS) in Flagstaff,Arizona. The National Snow and Ice Data Center in Boulder, Colorado, is designing a new, publicly accessible digital glacier database that will incorporate data to be submitted by GLIMS regional centers.The regional centers will conduct image analysis and other tasks that could not be done by just one institution. In addition, working groups have been established to examine the requirements and architecture of the glacier database; to examine requirements for and write algorithms needed for glacier analysis; to improve the use of stereo image data in glacier measurements; to investigate techniques by which ice volume and mass balance might be estimated from measurements made from images; and to look toward the integration in GLIMS of radar and future remote sensing data sets.
The current global searchable inventory at NSIDC, which compiles several smaller inventories, contains about 40% of the world total of approximately 160,000 glaciers [Colbeck, 1996],a number estimated from statistical extrapolations. Existing inventories (which also include those at the Institute of Geography of the Russian Academy of Sciences; the Central Asian Research Hydro-meteorological Institute, Tashkent, Uzbekistan; the Institute of Glaciology and Cryology of the China Academy of Sciences; and elsewhere) generally give the glacier name, location, area, length, orientation, and topographic classification.Temporal data showing trends or fluctuations exist for only 1,533 glaciers worldwide, and only 736 of these have been measured in the 1990s for frontal position and change of length. Detailed monitoring of hydrologic mass balance and precise tracking of glacier margins exists for only about 50 glaciers worldwide. Planned development at NSIDC of an expanded suite of measured parameters for an enlarged and globally representative set of glaciers will thus represent a marked improvement over the current state. The NSIDC database will have links to other sources of information on glaciers, such as data from field study pro-grams, film archives, and previous remote sensing studies.
The first year of GUMS analysis of ASTER images will focus on mapping the worlds non-

polar land ice using multi-spectral terrain classification and topographic analysis.The goal is to measure glacier margins to better than one VNIR pixel (15 m) where ice is relatively clean,and to severalVNIR pixels (-100 m) where the margin is laden with debris. A novel approach to topographic mapping of debris-covered glaciers is being developed at USGS in Flagstaff.
Eos,Vol. 81, No. 24,June 13,2000
Examples of Glacier Image Analysis
An example of this type of glacier image analysis is shown in Figure 3.The region shown, Nanga Parbat (Himalaya), is especially difficult to deal with using multispectral remote sensing methods because of the extreme relief and heavy debris cover of
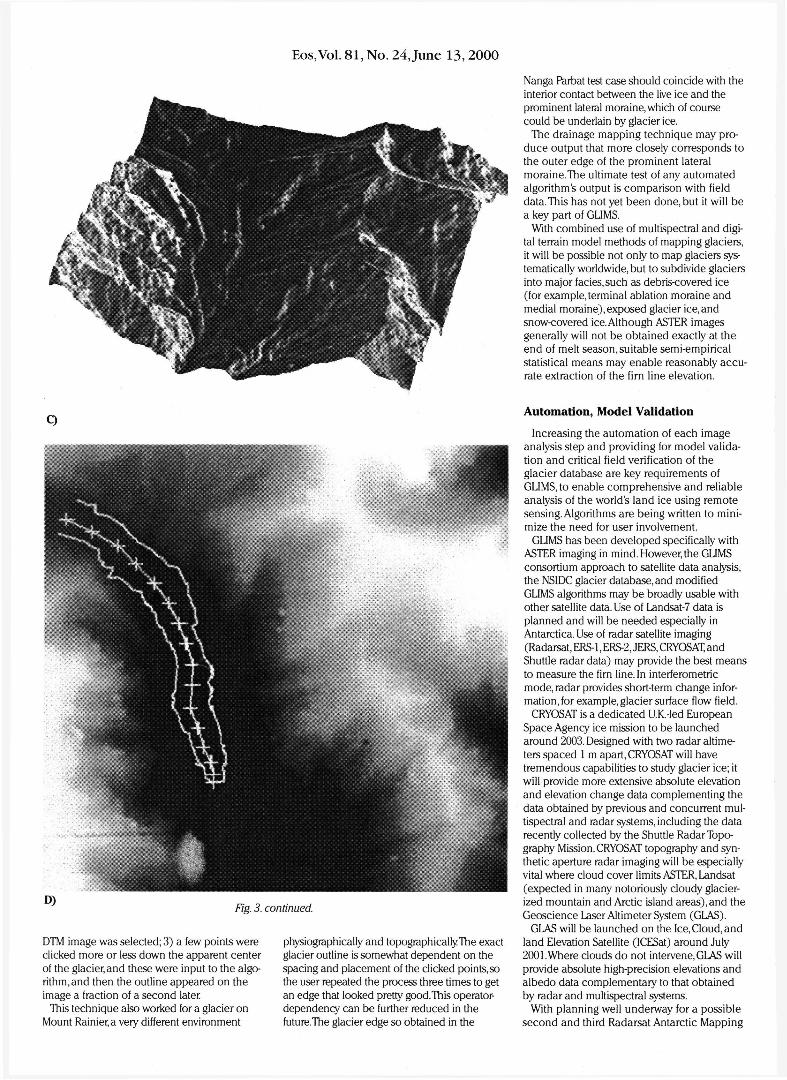
Fig. 3. Glaciers in Nanga Parbat Range, Karakoram Himalaya. (a) Left SPOT image of a stereo pair of a 10 x 10 km portion of the Nanga Parbat Range, Himalaya. The long valley glacier is Raikot Glacier. (b) Shaded relief portrayal of a commercial DEM from the SPOT Corporation. (c) Shaded relief applied to a DTM produced at USGS, Flagstaff, using the SPOT image pair. Lateral moraines are very clearly visible. Total relief ranges from 2800 m elevation to 5600 m in this area. The moraines and shape of the glacial valley fill provide information on the glacier edge that, because of partial debris cover, probably would not be obtainable in this instance with multispectral classification. Multispectral data, however, can provide information about glacier facies (for example, snow, ice, and moraine). The perspective viewing geometry differs slightly between (b) and (c). For (c), no attempt has been made to filter or remove high-frequency artifacts that appear as small conical hills and subtle waves. The SPOT stereo pair and the commercial DEM were purchased from the SPOT Corporation and provided for this work courtesy of Jack Shroder and Michael Bishop of the Nanga Parbat project (NSF grant EAR 9418839) for purposes of GLIMS algorithm development and demonstrations. (d) Edge of Raikot Glacier determined by application of the slope-change algorithm (described in article) to the USGS DTM.
glaciers [Bishop et al., 1998].The chosen method of glacier mapping requires development of a relative topographic Digital Terrain Model (DTM) , which in principle could be produced from existing topographic maps or from stereo images. DTM algorithms were written at USGS so as to provide an inexpensive and reliable alternative to existing maps and commercial DTM software. Since DTMs are rarely available at the resolution needed,and since the maps are often old and glaciers are changing,ASTER stereo imaging is expected to provide the primary data source for stereophotogrammetric DTMs. Existing topographic maps covering selected glaciers will provide a check on topography extracted from satellite data. Older topographic maps will provide information on glacier retreat; this information will be updated annually as new images are obtained. In the Himalayan test case shown in Figure 3, commercial stereo imaging from SPOT was used to produce a DTM, and the results were then compared with a DTM generated with the USGS algorithm.
Different approaches can be used with a DTM to map the edges of glaciers in debris-covered areas. One approach developed at USGS involves automated drainage mapping. Another tool starts with a crude glacier centerline input by a person, and then the computer looks at a second derivative of the topography (slope changes) along transverse and longitudinal profiles starting from the centerline (Figure 3d). Satisfactory results were obtained in our test case with very little human involvement: I) the command to run the program was typed; 2) a
Eos,Vol. 81, No. 24,June 13,2000
DTM image was selected; 3) a few points were clicked more or less down the apparent center of the glacier, and these were input to the algorithm, and then the outline appeared on the image a fraction of a second later.
This technique also worked for a glacier on Mount Rainier, a very different environment
physiographically and topographically The exact glacier outline is somewhat dependent on the spacing and placement of the clicked points, so the user repeated the process three times to get an edge that looked pretty good.This operator-dependency can be further reduced in the future.The glacier edge so obtained in the
Nanga Parbat test case should coincide with the interior contact between the live ice and the prominent lateral moraine, which of course could be underlain by glacier ice.
The drainage mapping technique may produce output that more closely corresponds to the outer edge of the prominent lateral moraine.The ultimate test of any automated algorithm's output is comparison with field data.This has not yet been done, but it will be a key part of GLIMS.
With combined use of multispectral and digital terrain model methods of mapping glaciers, it will be possible not only to map glaciers systematically worldwide, but to subdivide glaciers into major fades,such as debris-covered ice (for example, terminal ablation moraine and medial moraine),exposed glacier ice,and snow-covered ice.Although ASTER images generally will not be obtained exactly at the end of melt season, suitable semi-empirical statistical means may enable reasonably accurate extraction of the firn line elevation.
Automation, Model Validation
Increasing the automation of each image analysis step and providing for model validation and critical field verification of the glacier database are key requirements of GLIMS, to enable comprehensive and reliable analysis of the world's land ice using remote sensing. Algorithms are being written to minimize the need for user involvement.
GLIMS has been developed specifically with ASTER imaging in mind. However, the GLIMS consortium approach to satellite data analysis, the NSIDC glacier database, and modified GLIMS algorithms may be broadly usable with other satellite data. Use of Landsat-7 data is planned and will be needed especially in Antarctica. Use of radar satellite imaging (Radarsat, ERS-1, ERS-2, JERS, CRYOSAT, and Shuttle radar data) may provide the best means to measure the firn line. In interferometric mode, radar provides short-term change information, for example, glacier surface flow field.
CRYOSAT is a dedicated U.K.-led European Space Agency ice mission to be launched around 2003. Designed with two radar altimeters spaced 1 m apart, CRYOSAT will have tremendous capabilities to study glacier ice; it will provide more extensive absolute elevation and elevation change data complementing the data obtained by previous and concurrent multispectral and radar systems, including the data recently collected by the Shuttle Radar Topography Mission. CRYOSAT topography and synthetic aperture radar imaging will be especially vital where cloud cover limits ASTER, Landsat (expected in many notoriously cloudy glacier-ized mountain and Arctic island areas), and the Geoscience Laser Altimeter System (GLAS).
GLAS will be launched on the Ice, Cloud, and land Elevation Satellite (ICESat) around July 2001. Where clouds do not intervene, GLAS will provide absolute high-precision elevations and albedo data complementary to that obtained by radar and multispectral systems.
With planning well underway for a possible second and third Radarsat Antarctic Mapping

Eos,Vol. 81, No. 24,June 13, 2000
Mission (AMM-2 and -3), tentatively scheduled for late 2000 and 2001 to acquire a highly accurate snapshot of ice motion for all Antarctic regions north of 80°S, a new NSIDC-led consortium is being launched, called VELMAP This project will gather ice velocity data from all well-documented and accurate sources—current and historic, dating back to the early expeditions. NSIDC will build on its existing compilation of velocity data, viewable and downloadable at http://nsidc.colorado. edu/NSIDC/ANTARCT_VELOC/. The new database will include latitude, longitude, speed, bearing, elevation,slope, and date range.
T w o to Tango
Are glaciologists prepared to deal with the large volumes of data that have already begun to arrive on their desks? It has been common practice for a single pair of glacier scenes to consume an entire year's effort by a small team of glaciologists.The only way to take full advantage of new satellite capabilities and thousands of glacier images is to adopt a semi-automated approach to image analysis, such as that planned by GLIMS. But will measurements made by semiautomated image analysis be reliable? The only way to ensure that they are is to validate them with field glaciology data; this requires remote sensing and field glaciologists to interact heavily It is just this sort of interaction and the systematic global approach to glacier measurements that the Terrestrial Observations Panel on Climate (TOPC) has in mind.TOPC,a UN.-affiliated advisory panel, recently recommended that global glacier observation programs such as
PAGE 267
The Committee on Hydrologic Science (COHS), jointly organized by the National Research Council's (NRC) Water Science and Technology Board and Board on Atmospheric Sciences and Climate, is aiming to engage the Earth science community to provide hydro-logic science input to U.S. and international programs.The timing is opportune in that there are emergent new demands for applications and scientific partnerships, and enhancements in technical capability that can rapidly transform the discipline.
There have been similar decision points in the past, most notably as recently as just a decade ago.The 1991 NRC report,"Opportuni-ties in the Hydrologic Sciences," marked a major shift in the discipline toward framing its role as an Earth science. Expanded horizons in hydrologic science led to intensive cultivation of new research ideas dealing with couplings across the Earth sciences, with the application of new mathematical frameworks for dealing with wide-scale disparities characteristic of hydrologic processes, and with the
GLIMS and the Landsat-7 glacier program be adopted as demonstration projects for 21st-century global change monitoring.
It is not only technology and the scope of observations needed that challenge us. At a recent glaciology meeting, one glaciologist used a high-school dance analogy to describe the working relationship between field and remote sensing glaciologists. Boys and girls sit separately and gaze at each other with interest at the dance, but it takes some boldness and a new way of thinking to go beyond staring across the dance floor.
Data Inventory
For an inventory of existing glacier data, see http://wwwnsidc.colorado.edu/NSIDC/ CATALOG/ENTRIES/GO 1130.html.
Authors
Hugh Kieffer, Jeffrey S. Kargel, Roger Barry, Robert Bindschadler, Michael Bishop, David MacKinnon, Atsumu Ohmura, Bruce Raup, Massimo Antoninetti, Jonathan Bamber, Matthias Braun, Ian Brown, Denis Cohen, Luke Copland, Jon DueHagen, Rune V Engeset, Blair Fitzharris, Koji Fujita, Wilfried Haeberli, Jon Oue Hagen, Dorothy Hall, Martin Hoelzle, Maria Johansson, Andi Kaab, Max Koenig, Vladimir Konovalov, Max Maisch, Frank Paul, Frank Rau, Niels Reeh, Eric Rignot, Andres Rivera, Martiyn de Ruyter de Wildt, Ted Scambos, Jesko Schaper, Greg Scharfen, Jack Shroder, Olga Solomina, David Thompson, Kees van der Veen, Trudy Wohlleben, and Neal Young
use of new data types,such as those resulting from remote sensing.
Ten years later, the discipline has advanced to a new level, where it is now ready to take on new, major challenges. During the formative decade of the 1990s, research excitement was fueled mainly by the enthusiasm in the community With the scientific potential demonstrated and firmly established, the great challenge of implementing a coordinated research program with the participation of multiple government agencies may now be tackled.
An example of the emergent challenge is evident in the changes in the U.S. Global Change Research Program's (USGCRP) plans for its annual program report,"Our Changing Planet," for fiscal years 1999 and 2000.The USGCRP has a proposed $1.787-billion budget for FY 2000 and is organized around six program elements. In the FY 2000 plan, a new multiagency initiative on the global water cycle is introduced as one of the elements. It focuses on the understanding of the movement of water through land, atmosphere, and ocean, and on the understanding of change and variability in regional hydrologic systems.
For more information, contact Jeff Kargel, U.S.Geological Survey,2255 N.Gemini Dr., Flagstaff, Ariz., USA; E-mail: [email protected]
References
Bishop, M. P, J. Kargel, H. Kieffer, D. J. MacKinnon, B. Raup, J. FShroder, Analysis of Glacier Processes in High Asia, Annals of Glaciology (in press).
Bishop, M. P, J. FShroder Jr.,V. FSloan, L. Copland, and J. D. Colby Remote sensing and GIS technology for studying lithospheric processes in a mountain environment, Geocarto International, 13,75-87,1998.
Colbeck, S. C , ed., Glaciers, Ice Sheets and Volcanoes. A Tribute to Mark F Meier, U.S. Army CRREL Spec. Rep. 96-27, pp. 89-94,1996.
Dyurgerov, M. B. and M. FMeier, Mass balance of mountain and subpolar glaciers: A new global assessment for \m-\990,Arctic Alpine Res., 29,379-391,1997a.
Dyurgerov, M. B. and M. FMeier,Year-to-year fluctuations of global mass balance of small glaciers and their contribution to sea-level changes, Arctic Alpine Res., 29,392-402,1997b.
Haeberli, W,M. Hoelzle, and S.Suter,eds.,Mo the second century of worldwide glacier monitoring: Prospects and strategies, Studies and reports in hydrology,VNESCO publishing, Paris, Vol. 56,227 pp.
Higgins, A. K , ed., Geology ofNorth-East Greenland, Rapp. Gronlands Geol.Unders., 162, Copenhagen, pp. 201-209,1994.
Meier, M.F, Contribution of small glaciers to global sea level, Saeno? 226 (4681), 1418-1421,1084.
Oppenheimer,M., Global warming and the stability of the West Antarctic Ice Sheet, Nature, 393, 325-332,1998.
Raup, B. H., H. H. KiefferJ. M. Hare, and J. S. Kargel, Generation of Data Acquisition Requests for the ASTER Satellite Instrument for Monitoring a Globally Distributed Target: Glaciers, IEEE Trans. Geoscience and Remote Sensing, v. 38, p. 1105-1112,2000.
A similar initiative was introduced a few years ago in the case of the carbon cycle. That initiative is now endowed with a coherent science plan, with definitive milestones, and with bases for a large, new increment in research funding.
The NRC Committee on Hydrologic Science addressed the hydrologic science content of the USGCRP plan as its first task. Starting with its inaugural meeting in February 1999, COHS worked on the report "Hydrologic Science Priorities for the U.S. Global Change Research Program: An Initial Assessment." This report was published and briefed to the sponsoring agencies in September 1999.
In summary, the report identifies two key research priorities that could significantly contribute to the USGCRP plan: (1) predictability and variability of regional and global water cycles, and (2) coupling of hydrologic systems and ecosystems through chemical cycles.The first priority concerns understanding sources of variability and limits to prediction.The second focuses on the integrative nature of terrestrial hydrology and the substantive role of ecosystems in exchanges between land and the atmosphere.
The task of developing the full science plan for the USGCRP element is with the 16-member Water Cycle Study Group, organized by the federal government and chaired by George
Implementing a Coordinated Research Program in the Hydrologic Sciences

Page 270
Eos,Vol. 81, No. 24,June 13,2000
Fig. }. Landsat·? image of Storstrommen glacier, northeast Greenland, in J 999 showing many icebergs at the calving front. The front of Storstrommen surged by more than 10 km [Higgins, 1994J between 1978 and 1984. Dunng this pen'od, its average surface velocity increased from a normal several hundred meters per year to as much as 4000 mlyr.Transferofice from the upper to the lower part of the ablation area during this surge resulted in an 80-m lowering of the glacier surface in the upper part of the ablation area and a nOse of similar magnitude in the lower part. Landsat·? and ASTER images will be used to continue the study of this and other glaciers of Greenland.
Related Documents