96 © Turkish Society of Radiology 2009 New elastographic classification of breast lesions during and after compression Eduardo de Faria Castro Fleury, Jose Carlos Vendramini Fleury, Sebastiao Piato, Decio Roveda Jr. B reast ultrasonography has evolved considerably over the last few decades. From the limited diagnostic method that allowed only the discrimination of solid and cystic lesions, it has become a so- phisticated tool for evaluating and classifying masses and cysts (1, 2). Ul- trasonographic criteria that help differentiate benign from malignant le- sions include shape, margin, orientation, echo pattern, posterior acoustic features, lesion boundary, and vascularization, as proposed in the latest edition of Breast Imaging Reporting and Data System (BI-RADS TM ) (3). In this context, new research is being conducted on methods that may improve the diagnostic specificity and accuracy of ultrasonography without compromising its sensitivity. In 1991, Ophir et al. (4) intro- duced a new technique called elastography, which allowed the evalu- ation of soft tissue by elastic deformation, through the application of compression to the area of interest, bearing in mind that the mechanical properties of the tissue are important indicators for the diagnosis of ma- lignant lesions, given that most breast carcinomas are harder than the adjacent tissue (5). Currently there are two main lines of research to determine the clini- cal applicability of ultrasound elastography. The first line of research is based on the assessment of the mass size before and after compressing the target areas. This assessment uses software with which soft lesions appear lighter and firm lesions appear darker, and malignant lesions tend to be more evident than benign lesions (6–8). The other line of research is based on the use of a software that applies a different color spectrum to tissues according to their hardness, ranging from red to soft tissues, green to intermediate tissues and dark blue to hard tissues (9–11). There is no consensus as to which is the best technique or classifica- tion defining its clinical application. The main limitations are the in- terobserver variability described in previous studies and the lack of a standard for how compression should be performed during the study. This study proposes an elastographic classification system using not only the image of the lesion before and during compression, but also after parenchymal decompression and its correlation with the respec- tive histological result. The introduction of the time point (decompres- sion) into the study shows that the patient’s breast tissue type has less influence on the results, allowing evaluation criteria to be adopted with scores ranging from 1 to 4, based on the color variation observed in the areas of interest. Materials and methods Patients This is a prospective trial. Images from 207 patients, with a mean age of 44 years (range, 17–83), were evaluated. They presented with 247 ORIGINAL ARTICLE Diagn Interv Radiol 2009; 15:96–103 BREAST IMAGING From the Department of Radiology (E.F.C.F. edufleury@ hotmail.com, S.P., D.R.J.), Santa Casa de São Paulo, Brazil; and the Department of Radiology (J.C.V.F.), Centro de Tomografia Computadorizada, São Paulo, Brazil. Received 18 September 2008; revision requested 17 October 2008; revision received 26 October 2008; accepted 14 November 2008. PURPOSE Proposal for the classification of breast masses through ultrasound elastography in order to differentiate be- nign and malignant lesions with histological correla- tion. MATERIALS AND METHODS 188 patients enrolled for percutaneous biopsy of 228 breast lesions. Elastography was performed and inter- preted according to criteria created by the authors, with scores varying from 1 to 4 based on elasticity of images obtained upon release of compression. These results were compared with the histological results; elasticity scores of 1 and 2 were considered benign, a score of 3 as probably benign, and 4 as suspicious for malignancy. Positive predictive value, specificity, and diagnostic accuracy have been calculated. The results were evaluated using Fisher’s exact test and the analysis of the receiver operating characteristic (ROC) curve to determine the association with the histologi- cal results, and diagnostic accuracy of the proposed classification. RESULTS The positive predictive value, specificity, and diagnos- tic accuracy of the scores were 76.5%, 95.9%, and 94.7%, respectively. Of 228 lesions tested, 26 tests yielded true positive results; 8 yielded false positive results; 190 true negative results; and 4 false negative results. There was association with the histological re- sults by the Fisher method (P < 0.05) and an excellent area below the ROC curve of 0.954 (confidence range of 95%, 0.925–0.982). CONCLUSION The classification by elastography proposed by the au- thors can be used as an important tool combined with ultrasonographic studies for differentiating benign and malignant lesions of the breast. Key words: • breast • ultrasonography • US strain imaging • elastography

Welcome message from author
This document is posted to help you gain knowledge. Please leave a comment to let me know what you think about it! Share it to your friends and learn new things together.
Transcript
96
© Turkish Society of Radiology 2009
New elastographic classification of breast lesions during and after compression
Eduardo de Faria Castro Fleury, Jose Carlos Vendramini Fleury, Sebastiao Piato, Decio Roveda Jr.
B reast ultrasonography has evolved considerably over the last few decades. From the limited diagnostic method that allowed only the discrimination of solid and cystic lesions, it has become a so-
phisticated tool for evaluating and classifying masses and cysts (1, 2). Ul-trasonographic criteria that help differentiate benign from malignant le-sions include shape, margin, orientation, echo pattern, posterior acoustic features, lesion boundary, and vascularization, as proposed in the latest edition of Breast Imaging Reporting and Data System (BI-RADSTM ) (3).
In this context, new research is being conducted on methods that may improve the diagnostic specificity and accuracy of ultrasonography without compromising its sensitivity. In 1991, Ophir et al. (4) intro-duced a new technique called elastography, which allowed the evalu-ation of soft tissue by elastic deformation, through the application of compression to the area of interest, bearing in mind that the mechanical properties of the tissue are important indicators for the diagnosis of ma-lignant lesions, given that most breast carcinomas are harder than the adjacent tissue (5).
Currently there are two main lines of research to determine the clini-cal applicability of ultrasound elastography. The first line of research is based on the assessment of the mass size before and after compressing the target areas. This assessment uses software with which soft lesions appear lighter and firm lesions appear darker, and malignant lesions tend to be more evident than benign lesions (6–8). The other line of research is based on the use of a software that applies a different color spectrum to tissues according to their hardness, ranging from red to soft tissues, green to intermediate tissues and dark blue to hard tissues (9–11).
There is no consensus as to which is the best technique or classifica-tion defining its clinical application. The main limitations are the in-terobserver variability described in previous studies and the lack of a standard for how compression should be performed during the study.
This study proposes an elastographic classification system using not only the image of the lesion before and during compression, but also after parenchymal decompression and its correlation with the respec-tive histological result. The introduction of the time point (decompres-sion) into the study shows that the patient’s breast tissue type has less influence on the results, allowing evaluation criteria to be adopted with scores ranging from 1 to 4, based on the color variation observed in the areas of interest.
Materials and methodsPatients
This is a prospective trial. Images from 207 patients, with a mean age of 44 years (range, 17–83), were evaluated. They presented with 247
ORIGINAL ARTICLE
Diagn Interv Radiol 2009; 15:96–103 BREAST IMAGING
From the Department of Radiology (E.F.C.F. [email protected], S.P., D.R.J.), Santa Casa de São Paulo, Brazil; and the Department of Radiology (J.C.V.F.), Centro de Tomografia Computadorizada, São Paulo, Brazil.
Received 18 September 2008; revision requested 17 October 2008; revision received 26 October 2008; accepted 14 November 2008.
PURPOSEProposal for the classification of breast masses through ultrasound elastography in order to differentiate be-nign and malignant lesions with histological correla-tion.
MATERIALS AND METHODS188 patients enrolled for percutaneous biopsy of 228 breast lesions. Elastography was performed and inter-preted according to criteria created by the authors, with scores varying from 1 to 4 based on elasticity of images obtained upon release of compression. These results were compared with the histological results; elasticity scores of 1 and 2 were considered benign, a score of 3 as probably benign, and 4 as suspicious for malignancy. Positive predictive value, specificity, and diagnostic accuracy have been calculated. The results were evaluated using Fisher’s exact test and the analysis of the receiver operating characteristic (ROC) curve to determine the association with the histologi-cal results, and diagnostic accuracy of the proposed classification.
RESULTSThe positive predictive value, specificity, and diagnos-tic accuracy of the scores were 76.5%, 95.9%, and 94.7%, respectively. Of 228 lesions tested, 26 tests yielded true positive results; 8 yielded false positive results; 190 true negative results; and 4 false negative results. There was association with the histological re-sults by the Fisher method (P < 0.05) and an excellent area below the ROC curve of 0.954 (confidence range of 95%, 0.925–0.982).
CONCLUSIONThe classification by elastography proposed by the au-thors can be used as an important tool combined with ultrasonographic studies for differentiating benign and malignant lesions of the breast.
Key words: • breast • ultrasonography • US strain imaging • elastography
New elastographic classification of breast lesions • 97Volume 15 • Issue 2
lesions during the ultrasonographic study, and were referred for percuta-neous breast biopsy during the period from May 1st to October 30th 2007. The mean diameter of the lesions was 1.5 cm (median of 1.3 cm, ranging from 0.5 cm to 3.2 cm). The first 10 patients were excluded from the trial and were regarded as having contributed to the learning curve for the method. The results of the percutaneous biopsy were benign for these patients. Nine additional patients with nine lesions were excluded due to the presence of non-mass lesions with asymmetry and architectural distortions on the ultra-sound. All mass lesions according to the BI-RADSTM lexicon were included in the study. Two-hundred and eleven (92.5%) core biopsies and 17 (7.5%) preoperative localizations were carried out after performing and documenting the elastographic study; there was his-tological confirmation in all cases.
The trial was approved by the institu-tional review board. Informed consent was obtained from all the participating patients.
EquipmentBoth the conventional and the elas-
tographic studies were performed by two radiologists with 6 and 17 years of experience in breast imaging, respec-tively. Examinations were performed using a Sonix SP (Ultrasonix Medical Corporation, Vancouver, Canada) US system and a 5–14 MHz multifrequen-
cy linear probe. For the elastography study, a special software was used for the Ultrasonix system, version 3.0.2 (Beta 1) updated to the commercial version 2.6.
Elastographic study The elastographic study was per-
formed with the patient lying in the same position used for conventional US examination (B-mode) and with the transducer positioned perpen-dicular to the region of interest (ROI). The target lesion was repeatedly com-pressed before examination to ensure that there was no lateral shift. After the activation of elastography, continuous manual compression was applied to the target region, perpendicular to the pectoral muscle, until tissue resistance was detected. When resistance was felt, manual pressure was interrupted, al-lowing spontaneous decompression of the breast parenchyma. The study area comprised the region from the subcu-taneous tissue to the pectoral muscle and also the margins of the mass up to 0.5 cm.
The elastographic imaging technique used comprises three phases: Step 1: Tissue is imaged with and without light compression, and RF (radiofrequency) data lines are acquired in the ROI. Step 2: A displacement is estimated between every two lines of RF data. Step 3: A strain value for every point in the ROI is estimated based on RF data deforma-tion. Each pixel of the elasticity image
was assigned one of 256 specific colors, depending on the magnitude of strain. The scale ranged from red for compo-nents with greatest strain (i.e., softest components) to blue for those with no strain (i.e., firmest components). Green indicated average strain in the ROI. The images obtained through elastography were superimposed to the B-mode images.
The images acquired were assessed in real time through “cinememory”, which allows retrospective evaluation of the behavior of the mass during compression and after decompression. Overall, study duration did not exceed two minutes per lesion.
Elastographic classificationThe elastographic classification used
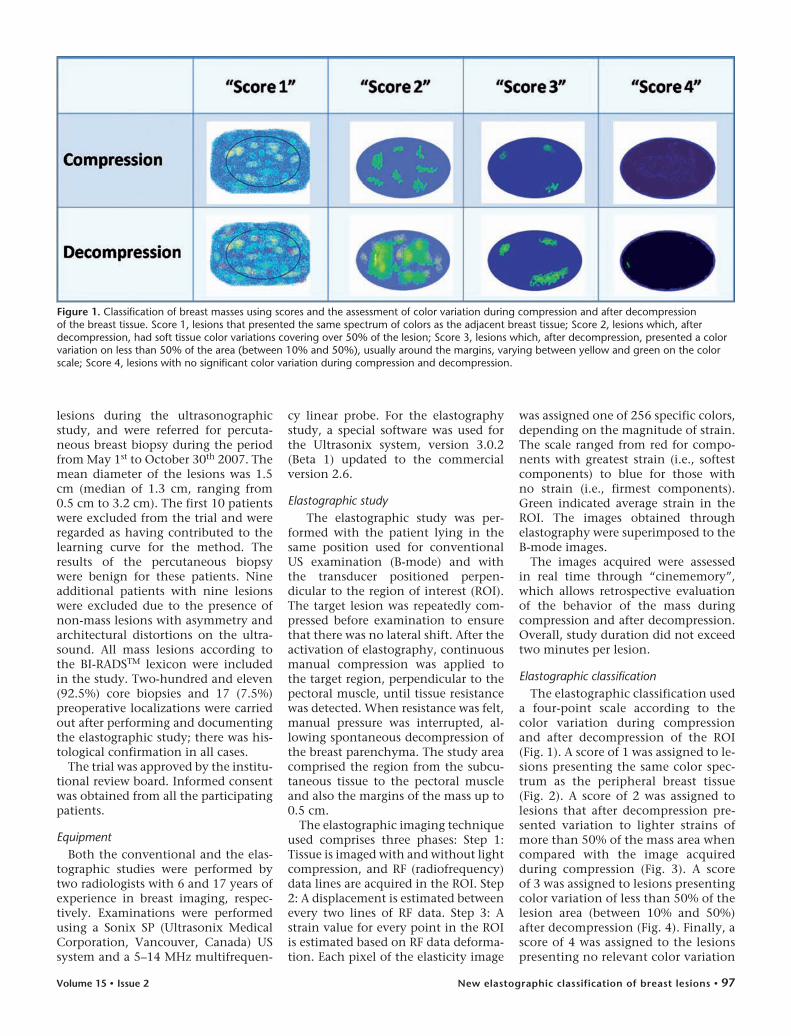
a four-point scale according to the color variation during compression and after decompression of the ROI (Fig. 1). A score of 1 was assigned to le-sions presenting the same color spec-trum as the peripheral breast tissue (Fig. 2). A score of 2 was assigned to lesions that after decompression pre-sented variation to lighter strains of more than 50% of the mass area when compared with the image acquired during compression (Fig. 3). A score of 3 was assigned to lesions presenting color variation of less than 50% of the lesion area (between 10% and 50%) after decompression (Fig. 4). Finally, a score of 4 was assigned to the lesions presenting no relevant color variation
Figure 1. Classification of breast masses using scores and the assessment of color variation during compression and after decompression of the breast tissue. Score 1, lesions that presented the same spectrum of colors as the adjacent breast tissue; Score 2, lesions which, after decompression, had soft tissue color variations covering over 50% of the lesion; Score 3, lesions which, after decompression, presented a color variation on less than 50% of the area (between 10% and 50%), usually around the margins, varying between yellow and green on the color scale; Score 4, lesions with no significant color variation during compression and decompression.

Fleury et al.98 • June 2009 • Diagnostic and Interventional Radiology
Figure 2. a−c. Example of score 1. Mass in B-mode (a), during compression (b) and after decompression (c). There is no definition of the tissue mass when the elastographic study is associated with B-mode, with histology showing fibrocystic change in the breast of a 26-year-old woman. Biopsy samples were obtained by core biopsy.
ba c
Figure 3. a−c. Example of score 2. Mass in B-mode (a), during compression (b) and after decompression (c). The tissue mass presents an intense posterior acoustic shadow, and is poorly characterized in B-mode (a) during compression; the mass is better defined (b) than after decompression (c) and there is a change in color covering more than 50% of its area, which suggests it is benign. The histological study has confirmed that the tissue mass is benign, compatible with a fibroadenoma in involution in a 46-year-old woman. Fragments were obtained by core biopsy.
Figure 4. a−c. Example of score 3. Mass in B-mode (a), during compression (b), and after decompression (c). The ovoid mass limited to B-mode (a). During compression the mass is distinguished from normal tissue, more solid than the tissue (b), and after decompression (c) there is a change in color covering less than 50% of the tissue mass, suggesting that it is benign. The histological study has confirmed that the mass is benign, compatible with fibroadenoma in a 33-year-old woman. Biopsy samples were obtained by core biopsy.
ba c
ba c
New elastographic classification of breast lesions • 99Volume 15 • Issue 2
during compression and after decom-pression of the parenchyma, appear-ing blue on both images (Fig. 5) (12).
The classification system used by the authors is similar to the one proposed by Scaperrotta et al. (11); however, this proposed system relies on the as-sessment of the images during decom-pression periods, where the influence of the manner in which the compres-sion is applied in the region of interest is smaller, thus simplifying the study systematization.
Pathological diagnosisAll samples obtained were sent for
histological study, and were analyzed by a specialized breast pathologist with 17 years of experience. The lesions were divided into two groups: Group 1, be-nign lesions; and Group 2, malignant lesions. Group 1 was divided into three subgroups: Group 1a with fibrocystic alterations, Group 1b with fibroadeno-mas, and Group 1c with low malignant potential, including papillomas, radial scars, myoepitheliomas and sclerosing
lesions, according to the classification proposed by Ellis et al. (13, 14).
Statistical analysis Sensitivity, specificity, positive pre-
dictive value, and negative predictive value by elastography were evaluated in comparison with the histologi-cal results of the samples. Scores 1, 2, and 3 were considered negative, and score 4 was considered positive. For comparison purposes, these values were calculated for conventional ul-trasound (B-Mode), with the lesions classified as BI-RADSTM categories 1, 2, and 3 considered negative, and 4 and 5 positive. The biopsied lesions were from patients with indication for bi-opsy referred from other services, and were classified as follows: 118 (51.8%) BI-RADSTM category 3, 104 (45.6%) BI-RADSTM category 4, and 6 (2.6%) BI-RADSTM category 5.
Before biopsies were performed, these lesions were reclassified in our service as follows: three (1.3%) BI-RADSTM category 1, 20 (8.8%) BI-RAD-STM category 2, 138 (60.5%) BI-RAD-STM category 3, 57 (25%) BI-RADSTM category 4, and 10 (4.4%) BI-RADSTM category 5. The lesions reclassified as BI-RADSTM category 1 were interpret-ed in our service as areas of fibrocystic changes interspersed in the heteroge-neous breast tissue. However, biop-sies were performed to confirm these findings.
Fisher’s exact test was used to test the association between the elasto-gram and the histological result, with
Table 1. Histological results. Distribution of the histological results according to group division
Results Group Lesions Percentage (%)
Fibrocystic changes 1a 65 28.5
Fibroadenoma 1b 112 49.1
Low malignant potential 1c 21 9.2
Malignancy 2 30 13.2
Total 228 100.00
Table 2. Mean, median, and standard deviation of the elastography scores according to histological groups
Histology Group Mean Median Standard deviation
Fibrocystic changes 1a 2.1 2.0 0.61
Fibroadenoma 1b 2.5 2.0 0.57
Low malignant potential 1c 2.8 3.0 0.70
Malignant 2 3.9 4.0 0.35
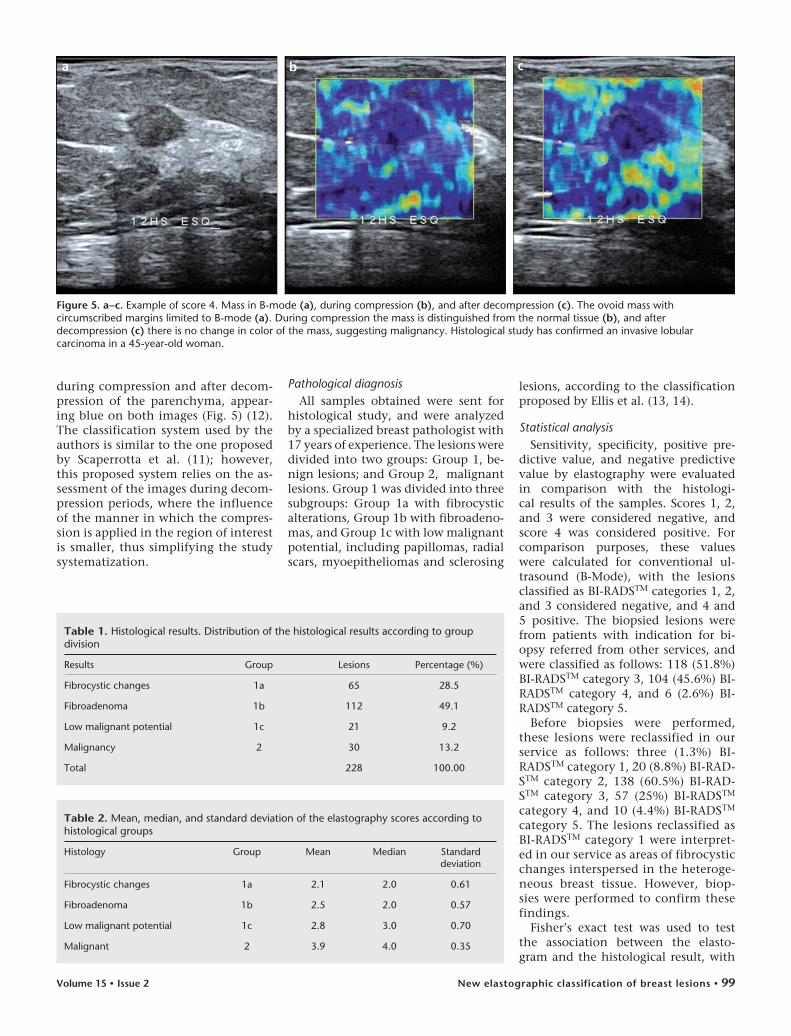
Figure 5. a−c. Example of score 4. Mass in B-mode (a), during compression (b), and after decompression (c). The ovoid mass with circumscribed margins limited to B-mode (a). During compression the mass is distinguished from the normal tissue (b), and after decompression (c) there is no change in color of the mass, suggesting malignancy. Histological study has confirmed an invasive lobular carcinoma in a 45-year-old woman.
ba c

Fleury et al.100 • June 2009 • Diagnostic and Interventional Radiology
significance at P < 0.05, using the com-mercial software SPSS 12.0 (SPSS Inc., Chicago, USA).
The accuracy of the method was also determined using the parametric esti-mate of the area under the receiver op-erating characteristic (ROC) curve, us-ing the commercial Stata 8.0 software (StataCorp, College Park, Texas, USA).
In order to assess the agreement be-tween observers, a kappa test according to the criteria described by Landis and Koch was used (15). All significance probabilities (P values) shown were two-sided. Values <0.05 were consid-ered statistically significant. The soft-ware SAS 9.1.3 (Statistical Analysis System, Cary, North Carolina, USA) was used for the calculations. For this purpose, all lesions were assessed again and reclassified by each of the observ-ers using “cinememory”.
Table 3. Frequency and percentage of histological groups according to elastography scores
Histology Group Score 1 Score 2 Score 3 Score 4 Total
Fibrocystic changes
1a 6 (9.2%) 49 (75.4%) 7 (10.8%) 3 (4.6%) 65 (100%)
Fibroadenomas 1b 2 (1.8%) 56 (50%) 52 (46.4%) 2 (1.8%) 112 (100%)
Low malignant potential
1c 0 8 (38.1%) 10 (47.6%) 3 (14.3%) 21 (100%)
Malignant 2 0 0 4 (13.3%) 26 (86.7%) 10 (100%)
Table 4. True-positive results (TP), true-negative results (TN), false-positive results (FP), and false-negative results (FN) for the elastography scores
Score 1 Score 2 Score 3 Score 4 Total
TP 0 0 0 26 26
TN 8 113 69 0 190
FP 0 0 0 8 8
FN 0 0 4 0 4
Total 8 113 73 34 228
Table 5. True-positive results (TP), true-negative results (TN), false-positive results (FP), and false-negative results (FN) for the B-mode study
BI-RADS 1 BI-RADS 2 BI-RADS 3 BI-RADS 4 BI-RADS 5 Total
TP 0 0 0 17 10 27
TN 3 20 135 0 0 158
FP 0 0 0 40 0 40
FN 0 0 3 0 0 3
Total 3 20 138 57 10 228
In addition, the optimal cut-off point was determined according to the Youden index (J) (16), J = max[SEi + SPi - 1] for the proposed scores, where SEi and SPi are the values for sensibility and specificity for all possible cut-off points.
ResultsPathological diagnosis
Of the 228 lesions evaluated, 65 (28.5%) were included in Group 1a; 112 (49.1%) in Group 1b; 21 (9.2%) in Group 1c; and 30 (13.2%) in Group 2 (Table 1). Of the 30 malignant re-sults (Group 2), 19 (63.4%) were inva-sive ductal carcinomas; nine (30.0%) were invasive lobular carcinomas; one (3.3%) was a papillary carcinoma; and one (3.3%) was a carcinoid tumor.
Of the 21 lesions classified in Group 1c, 13 (61.9%) were obtained during
surgical excisional biopsy. Of the re-maining eight lesions, five (23.8%) un-derwent excisional biopsy after the di-agnosis from the percutaneous biopsy, and were considered benign. Imaging follow-up for one year was performed for the other three lesions (14.3%). Malignancy was not observed in any of these cases.
Elastography scoresThe mean and median scores for the
histological classification of the le-sions were 2.1 and 2.0, respectively, for Group 1a; 2.5 and 2.0 for Group 1; 2.8 and 3.0 for Group 1c; and 3.9 and 4.0 for Group 2 (Table 2).
Table 3 shows the frequency of the histological groups, according to the electrographic scores (Table 3).
The four (1.7%) false-negative results obtained by the elastogram were classi-fied as score 3, with the following find-ings: two lobular carcinomas with diam-eters of 0.9 cm and 0.8 cm, respectively, one papillary carcinoma of 2.3 cm, and one carcinoid tumor of 1.2 cm.
The positive and negative predic-tive values, sensitivity, specificity, and diagnostic accuracy of the elasto-graphic scores were 76.47%, 97.94%, 86.67%, 95.96%, and 94.74%, respec-tively (Table 4). When the scores were analyzed separately, we obtained an NPV of 100% for score 1, an NPV of 100% for score 2, an NPV of 94.52% for score 3, and a PPV of 76.47% for score 4. For the conventional study, we obtained 90% sensitivity, 79.80% specificity, and 81.14% diagnostic ac-curacy (Table 5).
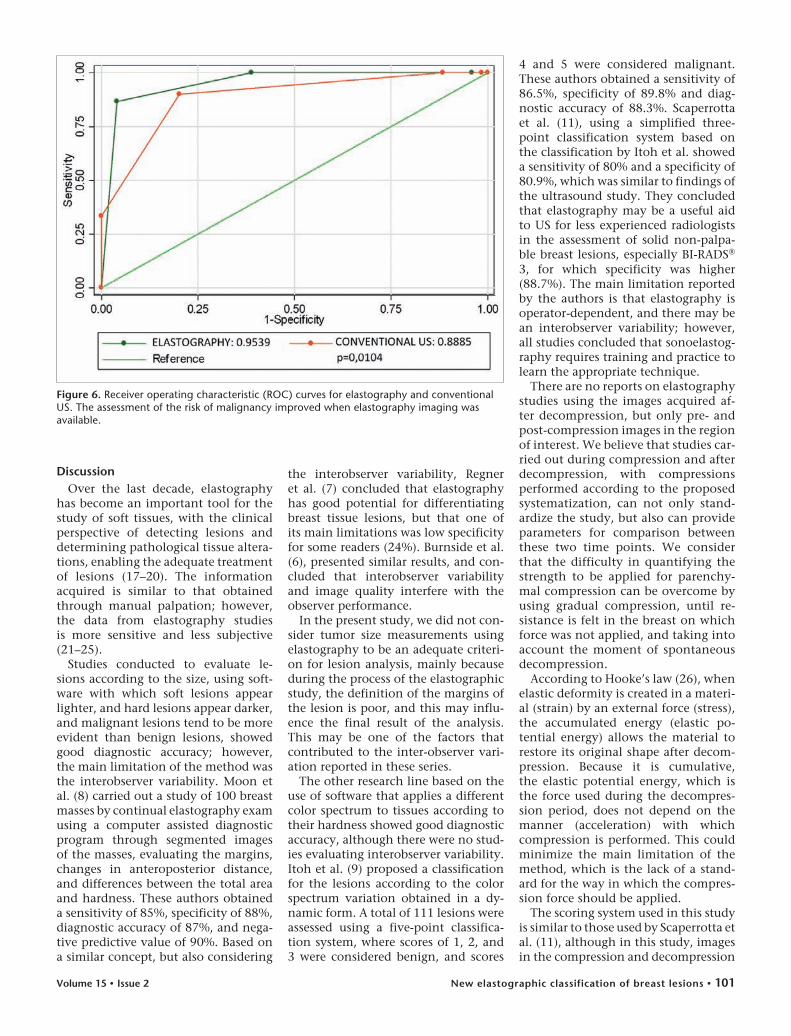
For the elastogram, the ROC curves, revealed an area under the curve of 0.954, a confidence interval between 0.925 and 0.982, and error of 0.0146 (Fig. 6). For the conventional study, ROC curves revealed an area under the curve of 0.888, a confidence interval between 0.830 and 0.946, and error of 0.297 (Fig. 6).
The optimal cut-off point identified for the proposed classification was score 3, which is the cut-off point cor-responding to the maximum value of the Youden index accounting for sen-sitivity, specificity, and diagnostic ac-curacy of 88%, 98.2%, and 96.5%, re-spectively, for observer 1, and 86.2%, 95.5%, and 94.2%, respectively, for ob-server 2. No interobserver statistically significant difference was observed at a significance level of 5%.
New elastographic classification of breast lesions • 101Volume 15 • Issue 2
DiscussionOver the last decade, elastography
has become an important tool for the study of soft tissues, with the clinical perspective of detecting lesions and determining pathological tissue altera-tions, enabling the adequate treatment of lesions (17–20). The information acquired is similar to that obtained through manual palpation; however, the data from elastography studies is more sensitive and less subjective (21–25).
Studies conducted to evaluate le-sions according to the size, using soft-ware with which soft lesions appear lighter, and hard lesions appear darker, and malignant lesions tend to be more evident than benign lesions, showed good diagnostic accuracy; however, the main limitation of the method was the interobserver variability. Moon et al. (8) carried out a study of 100 breast masses by continual elastography exam using a computer assisted diagnostic program through segmented images of the masses, evaluating the margins, changes in anteroposterior distance, and differences between the total area and hardness. These authors obtained a sensitivity of 85%, specificity of 88%, diagnostic accuracy of 87%, and nega-tive predictive value of 90%. Based on a similar concept, but also considering
the interobserver variability, Regner et al. (7) concluded that elastography has good potential for differentiating breast tissue lesions, but that one of its main limitations was low specificity for some readers (24%). Burnside et al. (6), presented similar results, and con-cluded that interobserver variability and image quality interfere with the observer performance.
In the present study, we did not con-sider tumor size measurements using elastography to be an adequate criteri-on for lesion analysis, mainly because during the process of the elastographic study, the definition of the margins of the lesion is poor, and this may influ-ence the final result of the analysis. This may be one of the factors that contributed to the inter-observer vari-ation reported in these series.
The other research line based on the use of software that applies a different color spectrum to tissues according to their hardness showed good diagnostic accuracy, although there were no stud-ies evaluating interobserver variability. Itoh et al. (9) proposed a classification for the lesions according to the color spectrum variation obtained in a dy-namic form. A total of 111 lesions were assessed using a five-point classifica-tion system, where scores of 1, 2, and 3 were considered benign, and scores
4 and 5 were considered malignant. These authors obtained a sensitivity of 86.5%, specificity of 89.8% and diag-nostic accuracy of 88.3%. Scaperrotta et al. (11), using a simplified three-point classification system based on the classification by Itoh et al. showed a sensitivity of 80% and a specificity of 80.9%, which was similar to findings of the ultrasound study. They concluded that elastography may be a useful aid to US for less experienced radiologists in the assessment of solid non-palpa-ble breast lesions, especially BI-RADS® 3, for which specificity was higher (88.7%). The main limitation reported by the authors is that elastography is operator-dependent, and there may be an interobserver variability; however, all studies concluded that sonoelastog-raphy requires training and practice to learn the appropriate technique.
There are no reports on elastography studies using the images acquired af-ter decompression, but only pre- and post-compression images in the region of interest. We believe that studies car-ried out during compression and after decompression, with compressions performed according to the proposed systematization, can not only stand-ardize the study, but also can provide parameters for comparison between these two time points. We consider that the difficulty in quantifying the strength to be applied for parenchy-mal compression can be overcome by using gradual compression, until re-sistance is felt in the breast on which force was not applied, and taking into account the moment of spontaneous decompression.
According to Hooke’s law (26), when elastic deformity is created in a materi-al (strain) by an external force (stress), the accumulated energy (elastic po-tential energy) allows the material to restore its original shape after decom-pression. Because it is cumulative, the elastic potential energy, which is the force used during the decompres-sion period, does not depend on the manner (acceleration) with which compression is performed. This could minimize the main limitation of the method, which is the lack of a stand-ard for the way in which the compres-sion force should be applied.
The scoring system used in this study is similar to those used by Scaperrotta et al. (11), although in this study, images in the compression and decompression
Figure 6. Receiver operating characteristic (ROC) curves for elastography and conventional US. The assessment of the risk of malignancy improved when elastography imaging was available.

Fleury et al.102 • June 2009 • Diagnostic and Interventional Radiology
periods were compared. Scores 1 and 2 were considered benign, score 3 prob-ably benign, and 4 suggestive of malig-nancy. We believe that the simpler the classification, the easier its applicabil-ity and reproducibility.
Analyzing the results obtained in this study, it is clear that there is strong statistical evidence of an as-sociation between the histological diagnosis and the scores proposed by the authors for elastography, whereby scores 1, 2, and 3 were considered neg-ative for malignancy, and score 4 was considered suggestive of malignancy (P < 0.001). The ROC curve showed an area under the curve of 0.9539, dem-onstrating the excellent diagnostic ac-curacy of the method. Comparing this with the area obtained in the conven-tional study, it was found that the in-vestigator was better able to assess the
Figure 7. a−d. Example of breast carcinoma. B-mode study (a), histology (b), elastography during compression (c), and after decompression (d). Large irregular mass (4.2 cm) classified as BI-RADSTM 5. In the elastographic study, this lesion was classified as score 4 with no color variation observed during or after decompression. Histology of the biopsy specimen showed invasive ductal carcinoma.
ba
d
c
risk of malignancy when elastograph-ic imaging was available. We believe that the sensitivity (76.46%), specifi-city (97.49%) and diagnostic accuracy (86.67%) observed in this study were higher than those observed in other studies due to the exclusion of non-mass lesions with asymmetry and dis-tortions. Such lesions are composed of healthy tissue interspersed within pathologic tissue, which may lead to false-negative results.
All of the false-negative results had been classified as score 3. Dimensions of the lesions that were misclassified varied in a great range (between 0.8 and 2.3 cm) which showed the histo-logical type of the lesions influenced the results more than did their di-mensions. In the previous reports the tumors initially classified as benign, particularly the carcinoid tumor and
the papillary carcinoma, are lesions that are generally softer on manual palpation (27, 28). Our results differ from the ones reported in the litera-ture, which showed that elastography has better accuracy for lesions smaller than 2.0 cm.
Our study demonstrated that fibroad-enomas larger than 2.0 cm were classi-fied with malignant scores, and con-versely, that small malignant tumors tended to present benign scores. Figure 7 shows a ductal carcinoma of approxi-mately 4.2 cm classified as score 4 by elastography, showing a better correla-tion with histological type than with size for the diagnosis of malignancy. Further studies are needed to confirm whether there is a higher correlation of elastographic scores with the histology of the lesion or with its size.
One of the limitations of our study was the small sample of malignant le-sions compared to the benign lesions. However, this ratio is similar to the ra-tio observed in clinical practice. There was also a higher prevalence of lobular carcinomas than is described in the lit-erature, and this may have influenced our results.
The classification by elastography proposed here, through the evaluation of tissue after compression and decom-pression of the breast parenchyma, can be an important tool, combined with ultrasonographic studies, for differen-tiating benign and malignant lesions among lesions classified as true masses according to the BI-RADSTM lexicon.
References 1. Kaplan SS. Clinical utility of bilateral
whole-breast US in the evaluation of women with dense breast tissue. Radiology 2001; 221:641–649.
2. Stavros AT, Thickman D, Rapp CL, Dennis MA, Parker SH, Sisney GA. Solid breast nodules: use of sonography to distinguish between benign and malignant lesions. Radiology 1995; 196:123–134.
3. American College of Radiology. Breast im-aging reporting and data system (BI-RADS), ultrasound. 4th ed. Reston, Va: American College of Radiology, 2003.
4. Ophir J, Céspedes I, Ponnekanti H, Yazdi Y, Li X. Elastography: a quantitative method for imaging the elasticity of biological tis-sues. Ultrason Imaging 1991; 13:111–134.
5. Cho N, Moon WK, Park JS, Cha JH, Jang M, Seong MH. Nonpalpable breast masses: evaluation by US elastography. Korean J Radiol 2008; 9:111–118.
6. Burnside ES, Hall TJ, Sommer AM, et al. Differentiating benign from malignant solid breast masses with US strain imaging. Radiology 2007; 245:401–410.

New elastographic classification of breast lesions • 103Volume 15 • Issue 2
7. Regner DM, Hesley GK, Hangiandreou NJ, et al. Breast lesions: evaluation with US strain imaging–clinical experience of mul-tiple observers. Radiology 2006; 238:425–437.
8. Moon WK, Chang RF, Chen CJ, Chen DR, Chen WL. Solid breast masses: classifica-tion with computer-aided analysis of con-tinuous US images obtained with probe compression. Radiology 2005; 236:458–464.
9. Itoh A, Ueno E, Tohno E, et al. Breast disease: clinical application of US elas-tography for diagnosis. Radiology 2006; 239:341–350.
10. Tohno E, Ueno E. Current improvements in breast ultrasound, with a special fo-cus on elastography. Breast Cancer 2008; 15:200–204.
11. Scaperrotta G, Ferranti C, Costa C, et al. Role of sonoelastography in non-palpable breast lesions. Eur Radiol 2008; 18:2381–2389.
12. Fleury EFC, Rinaldi JFR, Piato S, Fleury JCV, Roveda Jr D. Features of cystic breast lesions at ultrasound elastography. Radiol Bras 2008; 41:167–172.
13. Ellis IO, Humphreys S, Michell M, Pinder SE, Wells CA, Zakhour HD; UK National Coordinating Committee for Breast Screening Pathology; European Commission Working Group on Breast Screening Pathology. Best Practice No 179. Guidelines for breast needle core biopsy handling and reporting in breast screening assessment. J Clin Pathol 2004; 57:897–902.
14. Courtillot C, Plu-Bureau G, Binart N, et al. Benign breast diseases. J Mammary Gland Biol Neoplasia 2005; 10:325–335.
15. Landis JR, Koch GG. The measurement of observer agreement for categorical data. Biometrics 1977; 33:159-174.
16. Youden WJ. Index for rating diagnostic tests. Cancer 1950; 3:32–35.
17. Hoyt K, Forsberg F, Ophir J. Analysis of a hybrid spectral strain estimation tech-nique in elastography. Phys Med Biol 2006; 51:197–209.
18. O’Donnell M, Skovoroda AR, Shapo BM, Emelianov SY. Internal displacement and strain imaging using ultrasonic speckle-tracking. IEEE Trans Ultrason Ferroelectr Freq Control 1994; 41:314–325.
19. Emelianov SY, Lubinski MA, Weitzel WF, Wiggins RC, Skovoroda AR, O’Donnell M. Elasticity imaging for early detection of re-nal pathology. Ultrasound Med Biol 1995; 21:871–883.
20. Doyley MM, Bamber JC, Fuechsel F, Bush NL. A freehand elastographic imaging ap-proach for clinical breast imaging: system development and performance evaluation. Ultrasound Med Biol 2001; 27:1347–1357.
21. Krouskop TA, Wheeler F, Kallel F, Garra B, Hall T. Elastic moduli of breast and pros-tate tissues under compression. Ultrason Imaging 1998; 20:260–274.
22. Konofagou EE, Ophir J, Krouskop TA, Garra BS. Elastography: from theory to clinical applications. 2003 Summer Bioengineering Conference, June 25–29, Key Biscayne, Florida, USA.
23. Hall TJ. AAPM/RSNA physics tutorial for residents: topics in US: beyond the basics: elasticity imaging with US. Radiographics 2003; 23:1657–1671.
24. Garra BS, Cespedes EI, Ophir J, et al. Elastography of breast lesions: initial clini-cal results. Radiology 1997; 202:79–86.
25. Hall TJ, Zhu Y, Spalding CS. In vivo real-time freehand palpation imaging. Ultrasound Med Biol 2003; 29:427–435.
26. Hooke´s law. Encyclopedia Britannica Web site. http://www.britannica.com/eb/ar-ticle-9040985. Accessed October 18, 2007.
27. Gupta C, Malani AK, Rangineni S. Breast metastasis of ilial carcinoid tumor: case report and literature review. World J Surg Oncol 2006; 4:15.
28. Soo MS, Willifond ME, Walsh R, Bentley RC, Kornguth PJ. Papillary carcinoma of the breast: imaging findings. AJR Am J Roentgenol 1995; 164:321–326.
Related Documents