New Directions in Welfare Oxford 2009 Conference for Economists in Academia and Policy Oxford, 29 June – 1 July 2009 Willingness to Pay for Income Redistribution: Evidence from a Discrete Choice Experiment presented by Ilja Neustadt University of Zurich, Socioeconomic Institute [email protected]

New Directions in Welfare Oxford 2009 Conference for Economists in Academia and Policy Oxford, 29 June – 1 July 2009 Willingness to Pay for Income Redistribution:
Dec 19, 2015
Welcome message from author
This document is posted to help you gain knowledge. Please leave a comment to let me know what you think about it! Share it to your friends and learn new things together.
Transcript
New Directions in WelfareOxford 2009 Conference for Economists in Academia and Policy
Oxford, 29 June – 1 July 2009
Willingness to Pay for Income Redistribution: Evidence from a Discrete Choice Experiment
presented by
Ilja Neustadt University of Zurich, Socioeconomic Institute
New Directions in Welfare, Oxford 2009 30 June 2009 / 2
Contents
1. Introduction and Motivation
2. Statement of the Hypotheses
3. Discrete Choice Experiments
4. Descriptive Statistics
5. Estimation Results
6. Conclusion and Discussion
New Directions in Welfare, Oxford 2009 30 June 2009 / 3
1. Introduction and Motivation I
• Politicians and interest groups claim to know citizens’ preferences for income redistribution• Right-wing: redistribution excessive• Left-wing: pockets of poverty• In general: Is the welfare state still affordable?• Traditional contribution of economists: analysis of effects of redistributive policies
New Directions in Welfare, Oxford 2009 30 June 2009 / 4
1. Introduction and Motivation II
• The central question should be:
What are the citizens’citizens’ preferences?
• Objectives of this paper:
1) measure citizens’ Willingness To Pay (WTP) for redistribution through a Discrete Choice Experiment (DCE)
2) test several hypotheses concerning the determinants of the WTP
New Directions in Welfare, Oxford 2009 30 June 2009 / 5
1. Introduction and Motivation III
3 strands of research into the demand for redistribution:
1. Relating the amount of public spending to economic, institutional, and behavioural factors [Alesina/Giuliano (2009), Akkoyunlu/Neustadt/Zweifel (2009)]
Problem: The amount of redistribution is an outcome of an interaction between demand and supply. The supply is governed by political institutions.
New Directions in Welfare, Oxford 2009 30 June 2009 / 6
1. Introduction and Motivation IV
2. Measuring attitudes towards redistribution, e.g. “Should the government redistribute more income?” [Alesina/La Ferrara, JPubEc (2005)]
Problem:
No budget constraint is imposed.
Therefore, actual decision making (e.g. voting) cannot be predicted.
New Directions in Welfare, Oxford 2009 30 June 2009 / 7
1. Introduction and Motivation V
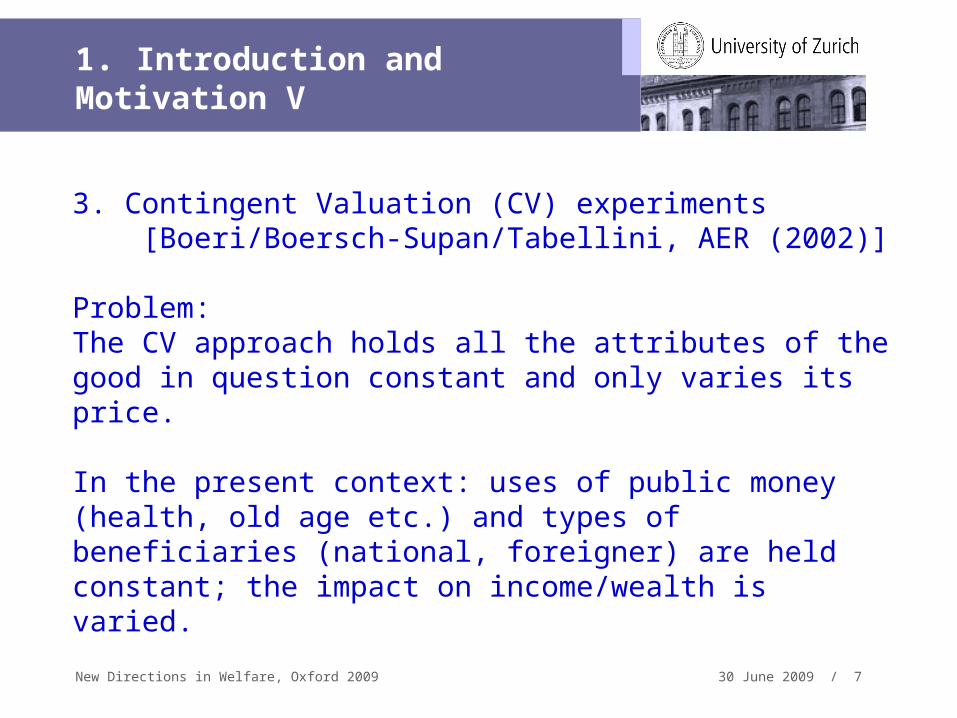
3. Contingent Valuation (CV) experiments [Boeri/Boersch-Supan/Tabellini, AER (2002)]
Problem: The CV approach holds all the attributes of the good in question constant and only varies its price.
In the present context: uses of public money (health, old age etc.) and types of beneficiaries (national, foreigner) are held constant; the impact on income/wealth is varied.
New Directions in Welfare, Oxford 2009 30 June 2009 / 8
1. Introduction and Motivation VI
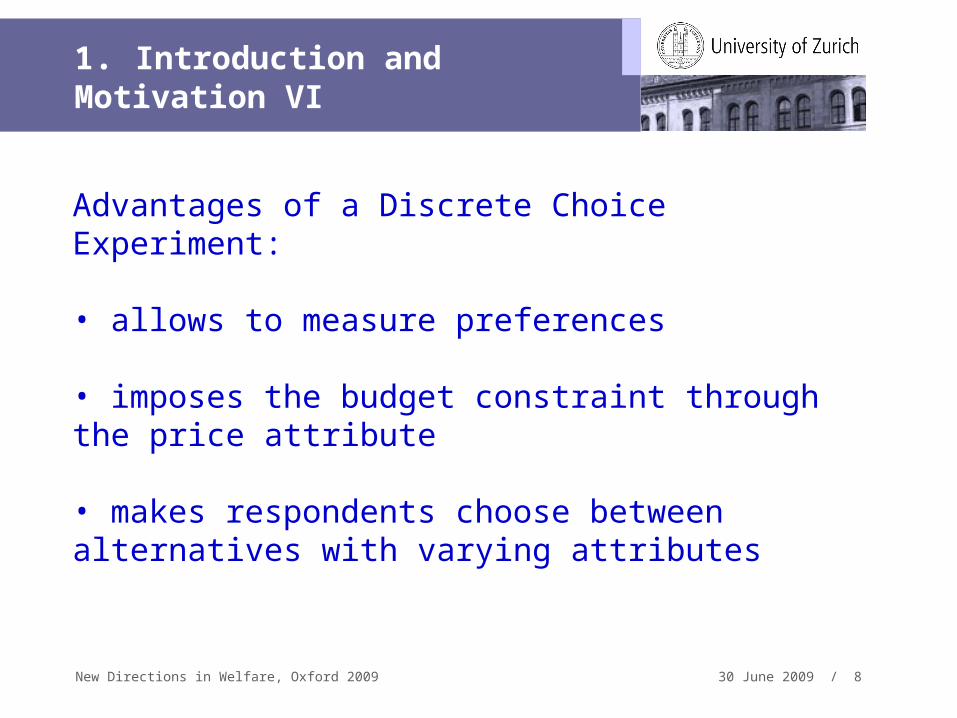
Advantages of a Discrete Choice Experiment:
• allows to measure preferences
• imposes the budget constraint through the price attribute
• makes respondents choose between alternatives with varying attributes
New Directions in Welfare, Oxford 2009 30 June 2009 / 9
2. Statement of the Hypotheses I
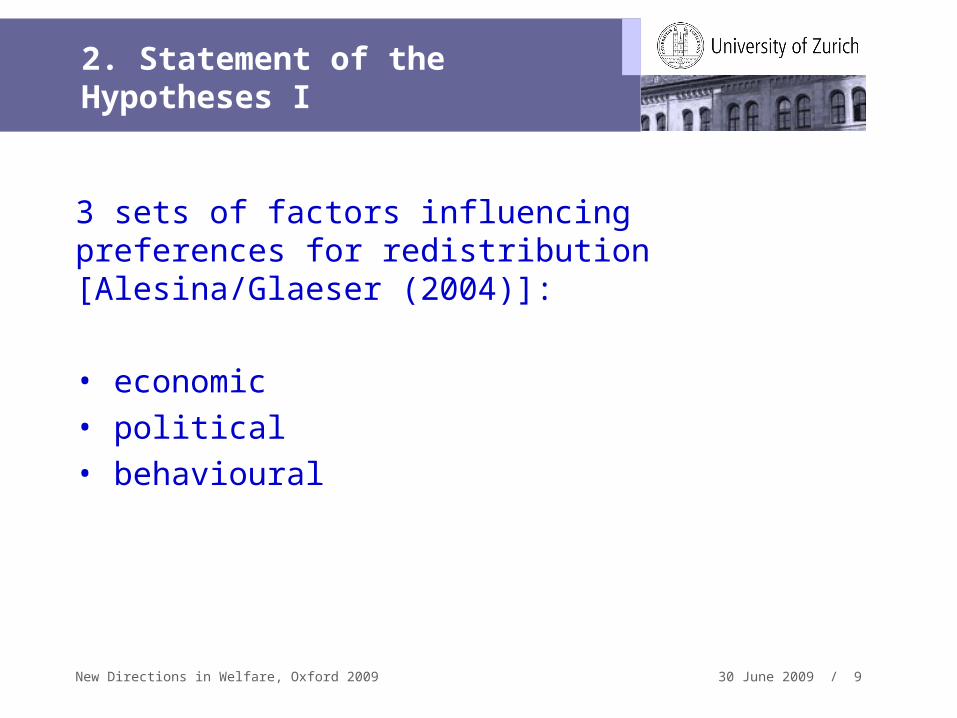
3 sets of factors influencing preferences for redistribution [Alesina/Glaeser (2004)]:
• economic• political• behavioural
New Directions in Welfare, Oxford 2009 30 June 2009 / 10
2. Statement of the Hypotheses II
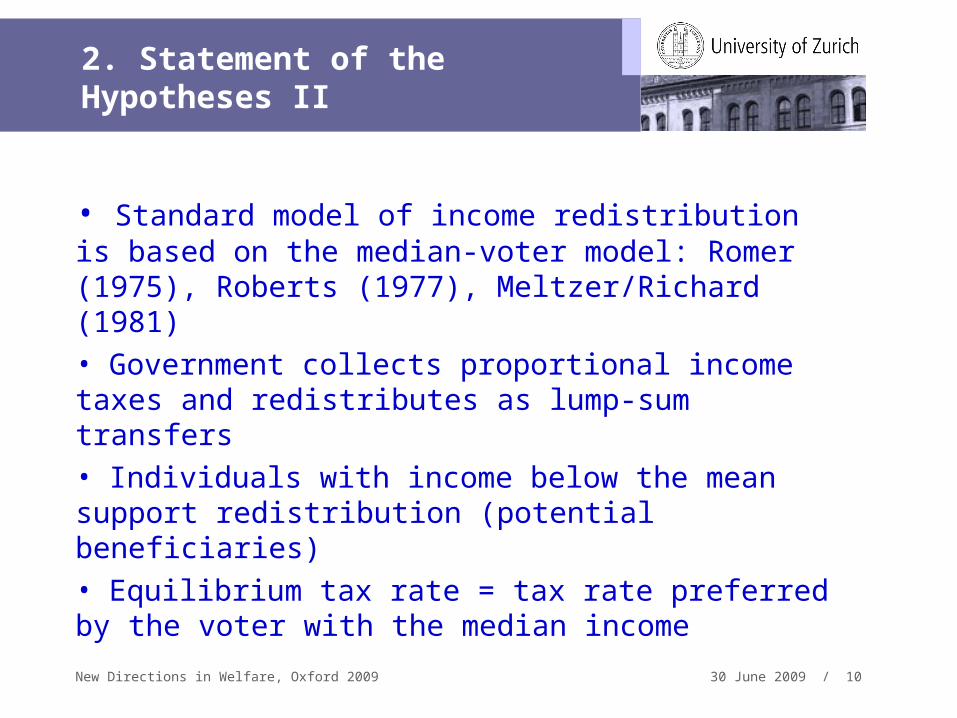
• Standard model of income redistribution is based on the median-voter model: Romer (1975), Roberts (1977), Meltzer/Richard (1981)• Government collects proportional income taxes and redistributes as lump-sum transfers• Individuals with income below the mean support redistribution (potential beneficiaries)• Equilibrium tax rate = tax rate preferred by the voter with the median income
New Directions in Welfare, Oxford 2009 30 June 2009 / 11
2. Statement of the Hypotheses III
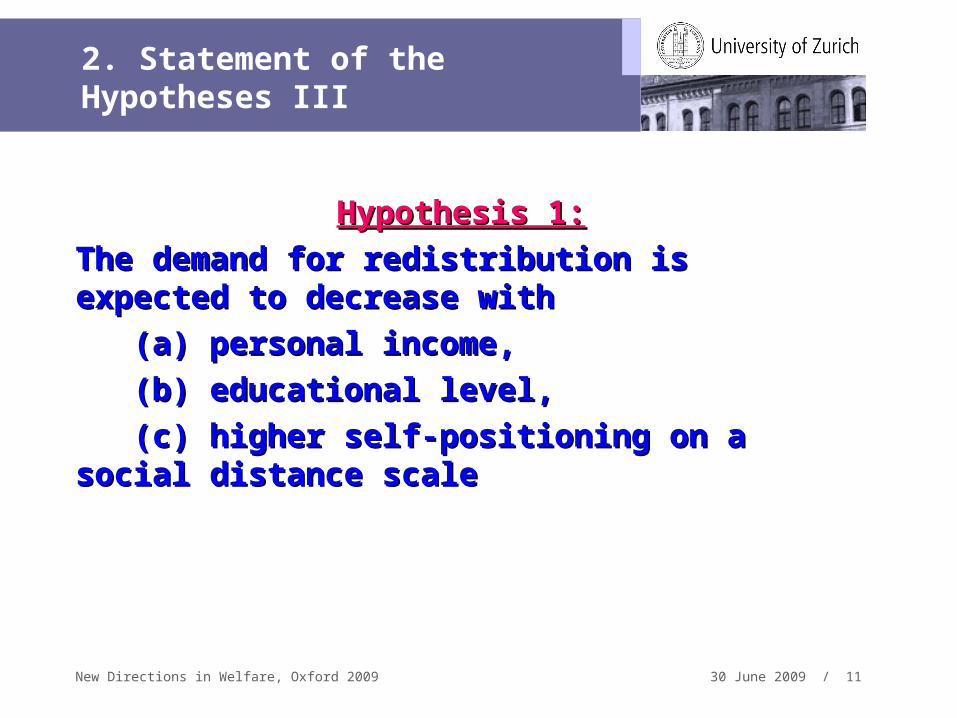
Hypothesis 1:Hypothesis 1:
The demand for redistribution is expected to The demand for redistribution is expected to decrease withdecrease with
(a) personal income,(a) personal income,
(b) educational level,(b) educational level,
(c) higher self-positioning on a social distance (c) higher self-positioning on a social distance scalescale
New Directions in Welfare, Oxford 2009 30 June 2009 / 12
2. Statement of the Hypotheses IV
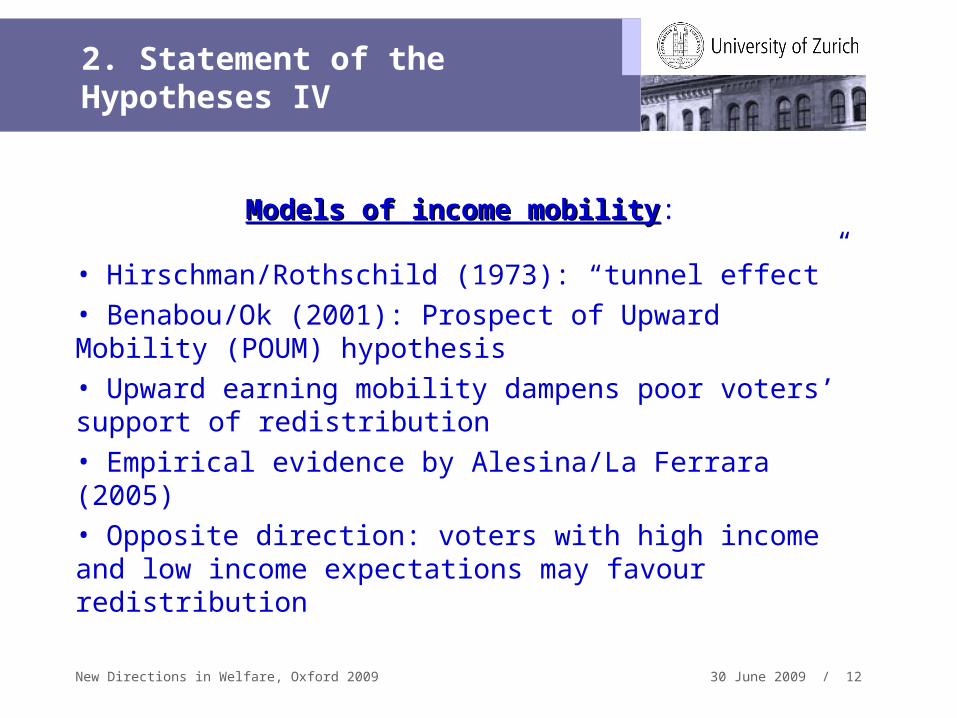
Models of income mobilityModels of income mobility:
• Hirschman/Rothschild (1973): “tunnel effect”• Benabou/Ok (2001): Prospect of Upward Mobility (POUM) hypothesis• Upward earning mobility dampens poor voters’ support of redistribution• Empirical evidence by Alesina/La Ferrara (2005)• Opposite direction: voters with high income and low income expectations may favour redistribution
New Directions in Welfare, Oxford 2009 30 June 2009 / 13
2. Statement of the Hypotheses V
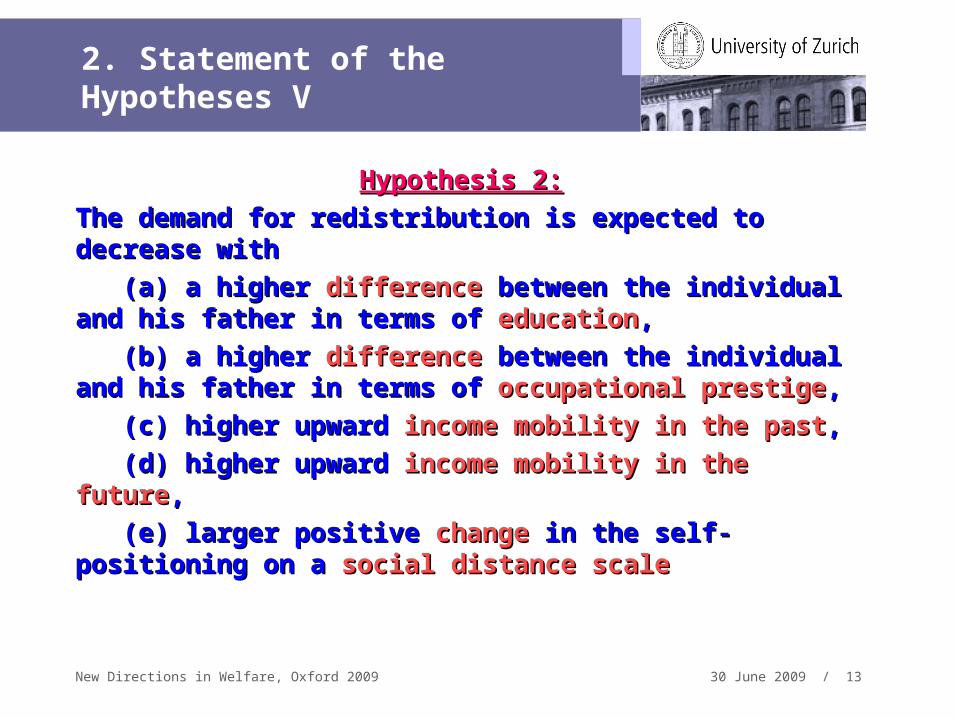
Hypothesis 2:Hypothesis 2:
The demand for redistribution is expected to The demand for redistribution is expected to decrease withdecrease with
(a) a higher (a) a higher differencedifference between the individual between the individual and his father in terms of and his father in terms of educationeducation,,
(b) a higher (b) a higher differencedifference between the individual between the individual and his father in terms of and his father in terms of occupational prestigeoccupational prestige,,
(c) higher upward (c) higher upward income mobility in the pastincome mobility in the past,,
(d) higher upward (d) higher upward income mobility in the futureincome mobility in the future,,
(e) larger positive (e) larger positive changechange in the self-positioning in the self-positioning on a on a social distance scalesocial distance scale
New Directions in Welfare, Oxford 2009 30 June 2009 / 14
3. Discrete Choice Experiments I
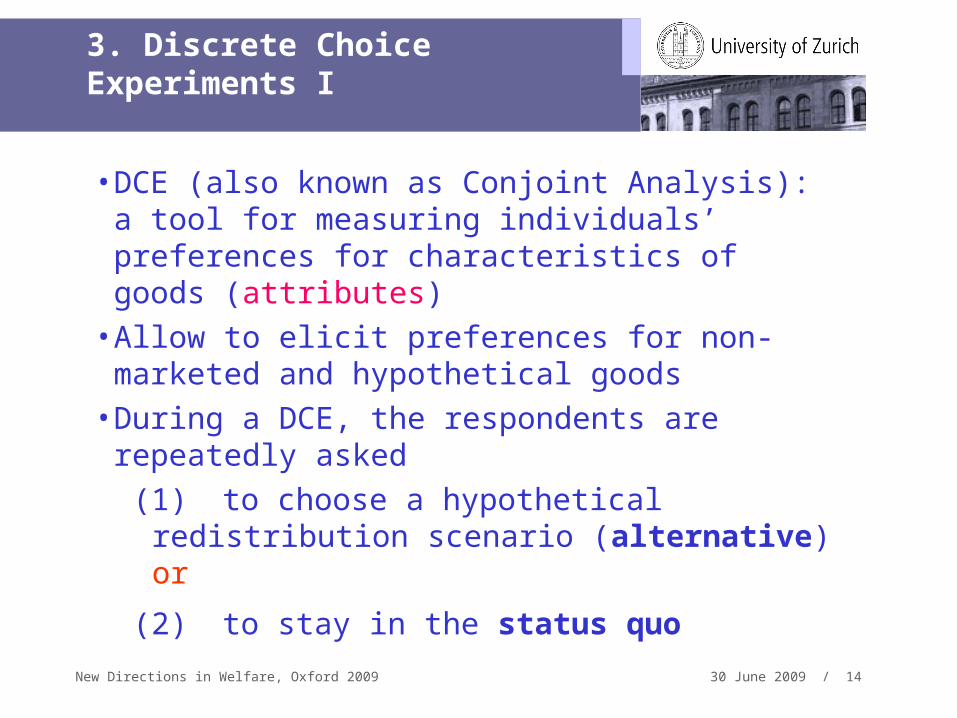
• DCE (also known as Conjoint Analysis): a tool for measuring individuals’ preferences for characteristics of goods (attributes)
• Allow to elicit preferences for non-marketed and hypothetical goods
• During a DCE, the respondents are repeatedly asked
(1) to choose a hypothetical redistribution scenario (alternative) or
(2) to stay in the status quo
New Directions in Welfare, Oxford 2009 30 June 2009 / 15
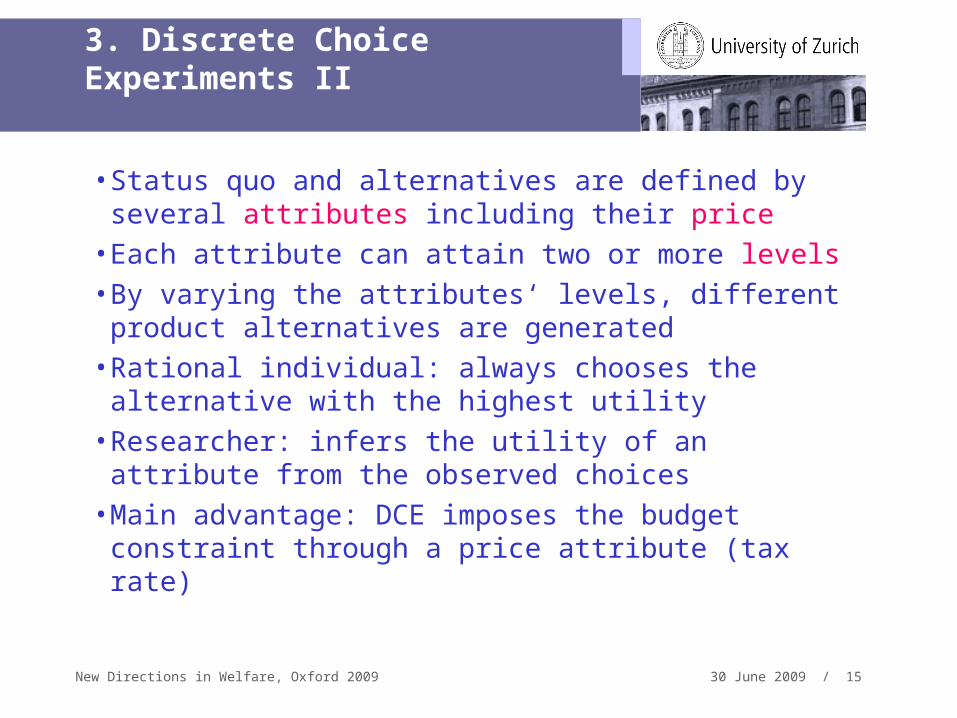
3. Discrete Choice Experiments II
• Status quo and alternatives are defined by several attributes including their price
• Each attribute can attain two or more levels• By varying the attributes‘ levels, different product
alternatives are generated• Rational individual: always chooses the alternative
with the highest utility• Researcher: infers the utility of an attribute from the
observed choices• Main advantage: DCE imposes the budget
constraint through a price attribute (tax rate)
New Directions in Welfare, Oxford 2009 30 June 2009 / 16
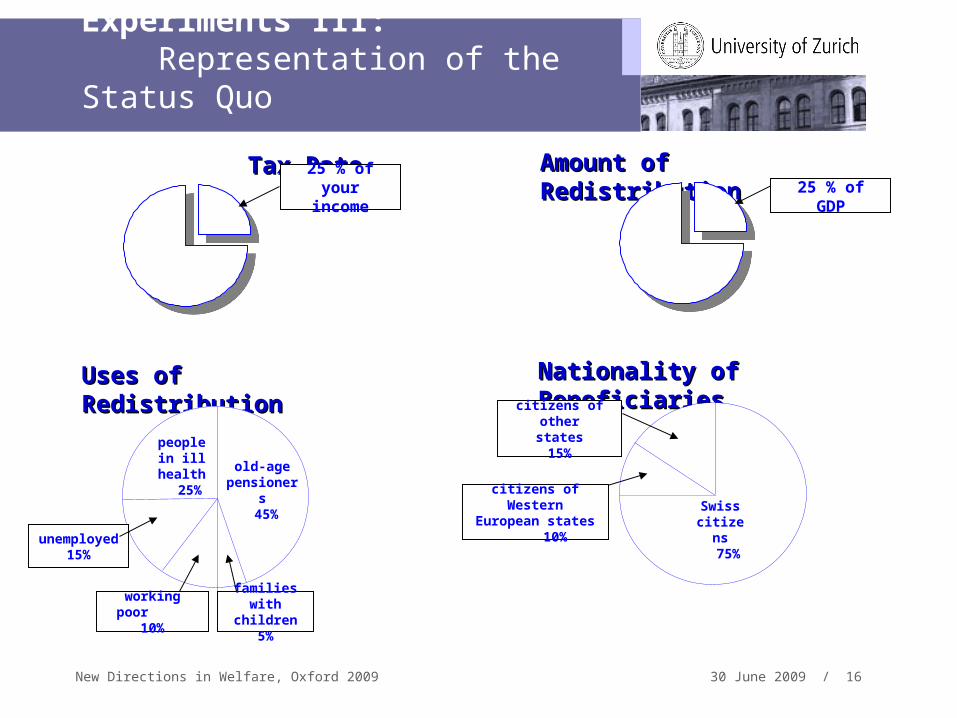
3. Discrete Choice Experiments III: Representation of the Status Quo
Tax RateTax Rate25 % of your
income
Uses of RedistributionUses of Redistribution
old-age pensioners
45%
families with children 5%
people in ill health
25%
unemployed15%
working poor 10%
Nationality of BeneficiariesNationality of Beneficiaries
Swiss citizens
75%
citizens of otherstates15%
citizens of Western European states
10%
Amount of RedistributionAmount of Redistribution25 % of GDP
New Directions in Welfare, Oxford 2009 30 June 2009 / 17
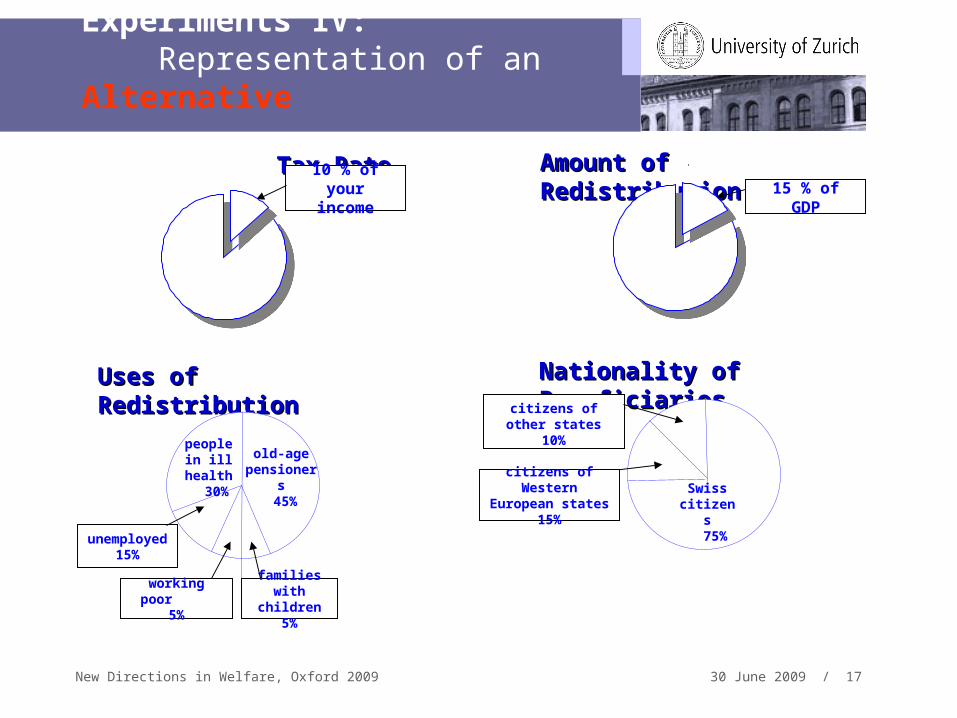
3. Discrete Choice Experiments IV: Representation of an Alternative
Tax RateTax Rate10 % of your
income
Uses of RedistributionUses of Redistribution
old-age pensioners
45%
families with children 5%
people in ill health
30%
unemployed15%
working poor 5%
Nationality of BeneficiariesNationality of Beneficiaries
Swiss citizens
75%
citizens of other states10%
citizens of Western European states
15%
Amount of RedistributionAmount of Redistribution15 % of GDP
New Directions in Welfare, Oxford 2009 30 June 2009 / 18
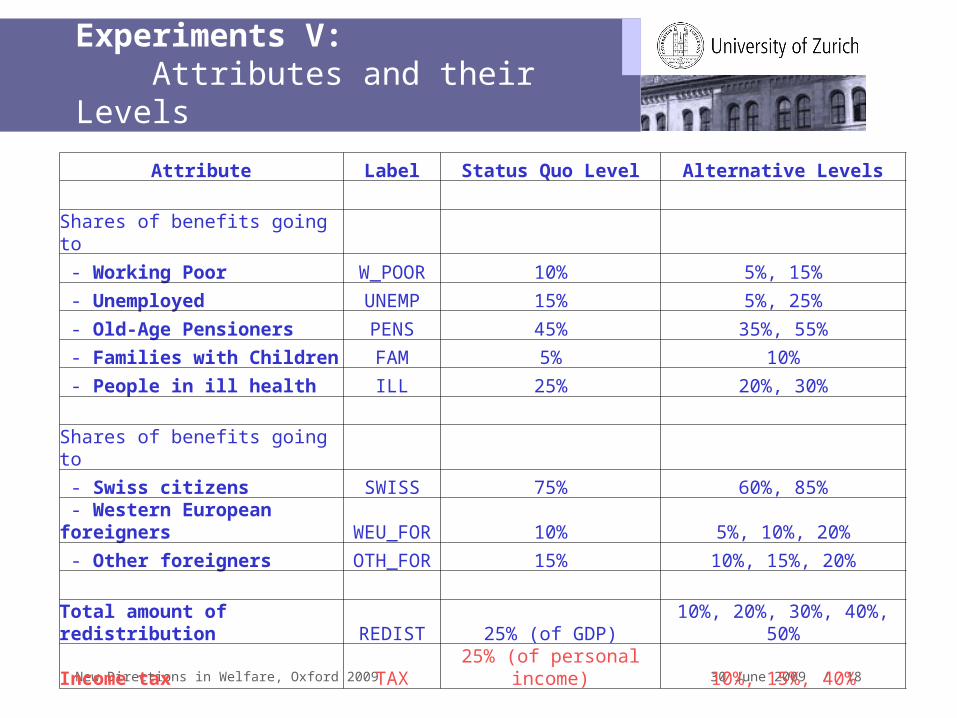
3. Discrete Choice Experiments V: Attributes and their Levels
Attribute Label Status Quo Level Alternative Levels
Shares of benefits going to
- Working Poor W_POOR 10% 5%, 15%
- Unemployed UNEMP 15% 5%, 25%
- Old-Age Pensioners PENS 45% 35%, 55%
- Families with Children FAM 5% 10%
- People in ill health ILL 25% 20%, 30%
Shares of benefits going to
- Swiss citizens SWISS 75% 60%, 85%
- Western European foreigners WEU_FOR 10% 5%, 10%, 20%
- Other foreigners OTH_FOR 15% 10%, 15%, 20%
Total amount of redistribution REDIST 25% (of GDP) 10%, 20%, 30%, 40%, 50%
Income tax TAX 25% (of personal income) 10%, 15%, 40%
New Directions in Welfare, Oxford 2009 30 June 2009 / 19
3. Discrete Choice Experiments VI
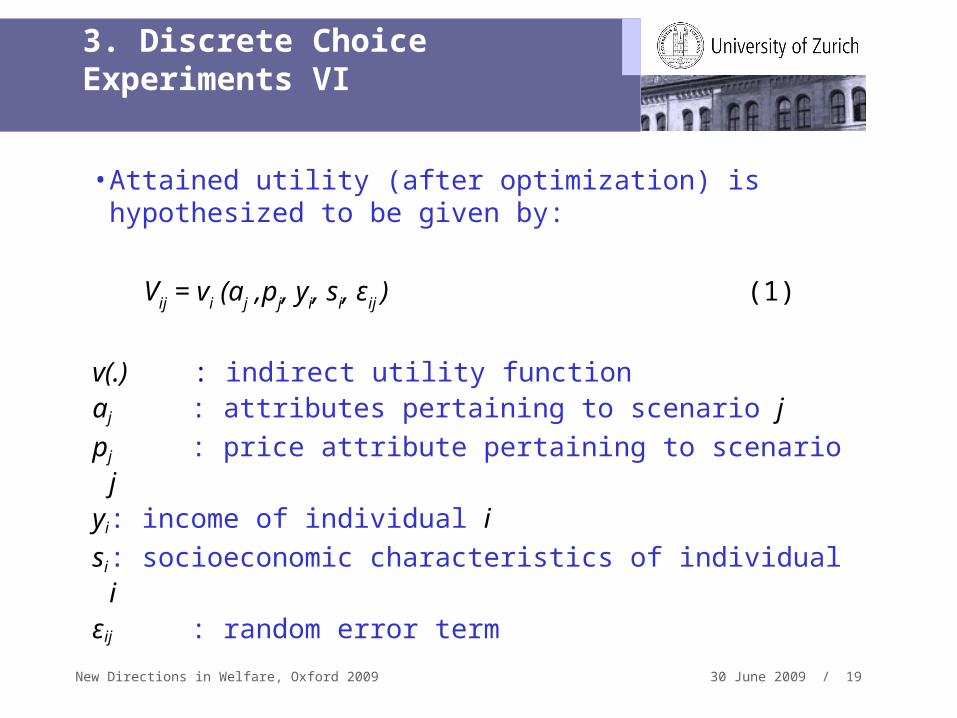
• Attained utility (after optimization) is hypothesized to be given by:
Vij = vi (aj ,pj, yi, si, εij ) (1)
v(.) : indirect utility functionaj : attributes pertaining to scenario j
pj : price attribute pertaining to scenario j
yi: income of individual i
si : socioeconomic characteristics of individual i
εij : random error term
New Directions in Welfare, Oxford 2009 30 June 2009 / 20
3. Discrete Choice Experiments VII
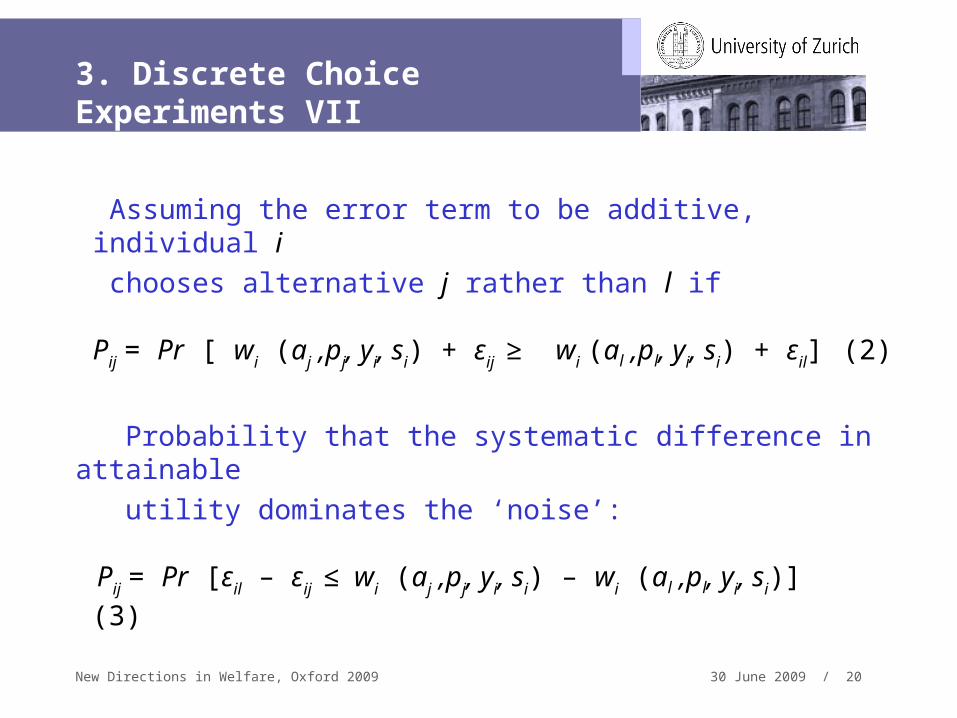
Assuming the error term to be additive, individual i
chooses alternative j rather than l if
Pij = Pr [ wi (aj ,pj, yi, si) + εij ≥ wi (al ,pl, yi, si) + εil] (2)
Probability that the systematic difference in attainable
utility dominates the ‘noise’:
Pij = Pr [εil – εij ≤ wi (aj ,pj, yi, si) – wi (al ,pl, yi, si)] (3)
New Directions in Welfare, Oxford 2009 30 June 2009 / 21
3. Discrete Choice Experiments VIII
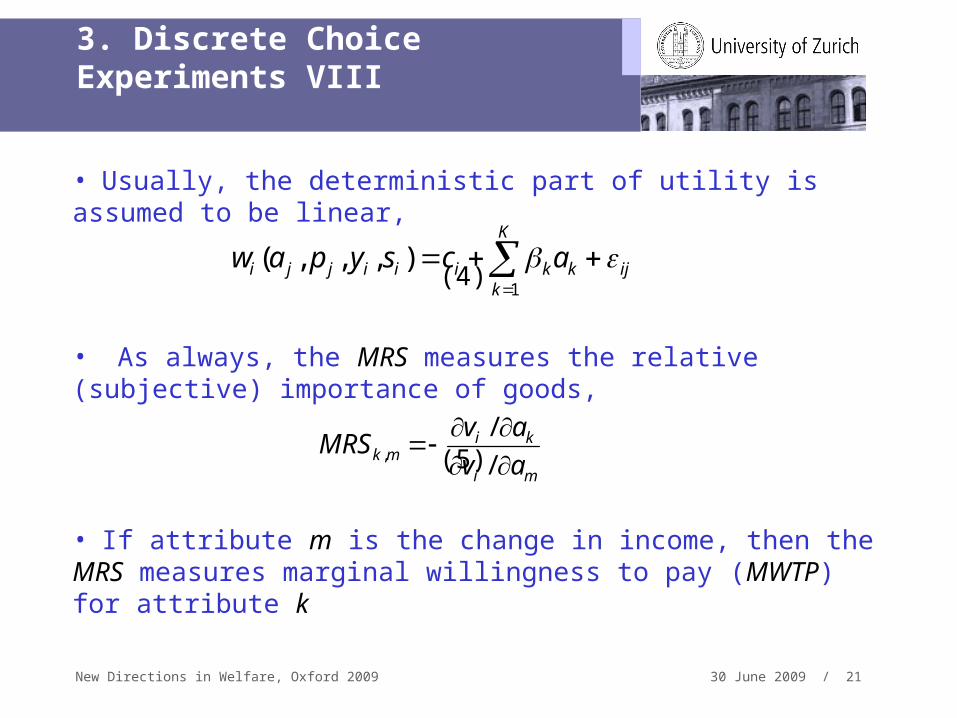
• Usually, the deterministic part of utility is assumed to be linear, (4)
• As always, the MRS measures the relative (subjective) importance of goods,
(5)
• If attribute m is the change in income, then the MRS measures marginal willingness to pay (MWTP) for attribute k
ijk
K
kkiiijji acsypaw
1
),,,(
mi
kimk av
avMRS
/
/,
New Directions in Welfare, Oxford 2009 30 June 2009 / 22
4. Some Descriptive Statistics
• Representative sample with 979 respondents (70% German-speaking, 30% French-speaking)
• The frequency distribution of income and education levels reflected the structure of the Swiss population.
• Total decisions: 979*8=7,832. • 20% of decisions made in favour of an alternative
over the status quo.• However, only 21% of respondents never opted for
an alternative
New Directions in Welfare, Oxford 2009 30 June 2009 / 23
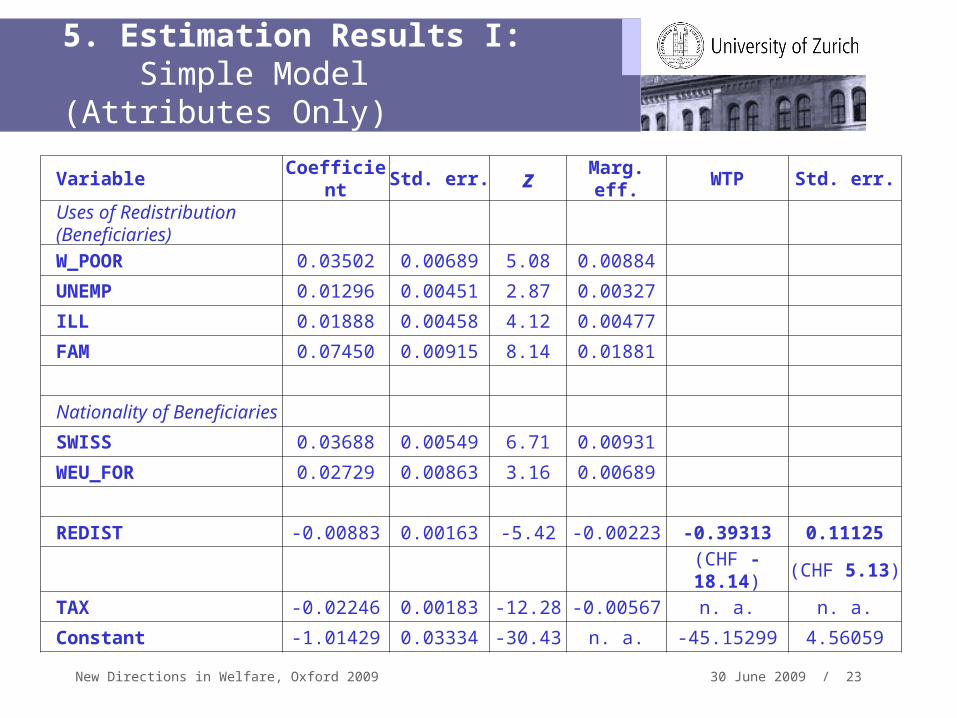
5. Estimation Results I: Simple Model (Attributes Only)
Variable Coefficient Std. err. z Marg. eff. WTP Std. err.
Uses of Redistribution (Beneficiaries)
W_POOR 0.03502 0.00689 5.08 0.00884
UNEMP 0.01296 0.00451 2.87 0.00327
ILL 0.01888 0.00458 4.12 0.00477
FAM 0.07450 0.00915 8.14 0.01881
Nationality of Beneficiaries
SWISS 0.03688 0.00549 6.71 0.00931
WEU_FOR 0.02729 0.00863 3.16 0.00689
REDIST -0.00883 0.00163 -5.42 -0.00223 -0.39313 0.11125
(CHF -18.14) (CHF 5.13)
TAX -0.02246 0.00183 -12.28 -0.00567 n. a. n. a.
Constant -1.01429 0.03334 -30.43 n. a. -45.15299 4.56059
New Directions in Welfare, Oxford 2009 30 June 2009 / 24
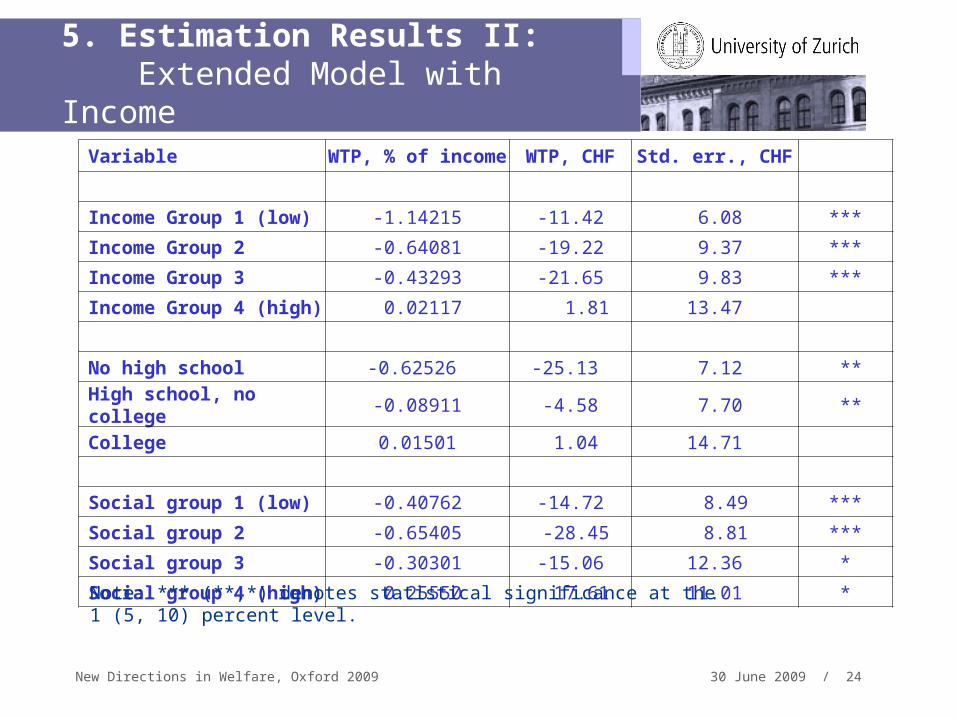
5. Estimation Results II: Extended Model with Income
Variable WTP, % of income WTP, CHF Std. err., CHF
Income Group 1 (low) -1.14215 -11.42 6.08 ***
Income Group 2 -0.64081 -19.22 9.37 ***
Income Group 3 -0.43293 -21.65 9.83 ***
Income Group 4 (high) 0.02117 1.81 13.47
No high school -0.62526 -25.13 7.12 **
High school, no college -0.08911 -4.58 7.70 **
College 0.01501 1.04 14.71
Social group 1 (low) -0.40762 -14.72 8.49 ***
Social group 2 -0.65405 -28.45 8.81 ***
Social group 3 -0.30301 -15.06 12.36 *
Social group 4 (high) 0.25550 17.61 11.01 *
Note: *** (**,*) denotes statistical significance at the 1 (5, 10) percent level.
New Directions in Welfare, Oxford 2009 30 June 2009 / 25
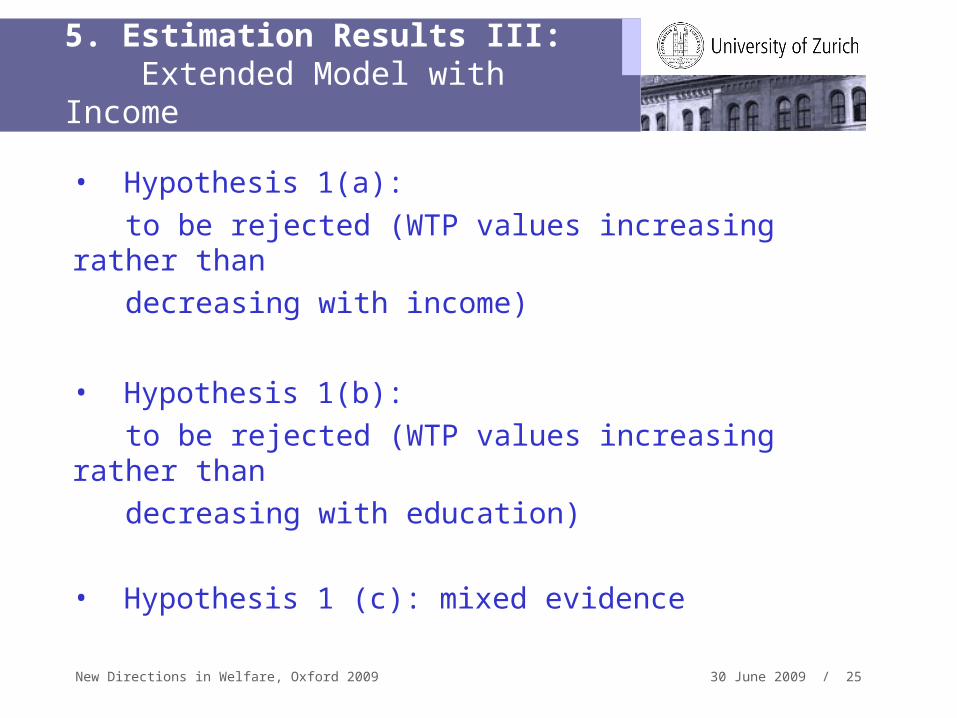
5. Estimation Results III: Extended Model with Income
• Hypothesis 1(a):
to be rejected (WTP values increasing rather than
decreasing with income)
• Hypothesis 1(b):
to be rejected (WTP values increasing rather than
decreasing with education)
• Hypothesis 1 (c): mixed evidence
New Directions in Welfare, Oxford 2009 30 June 2009 / 26
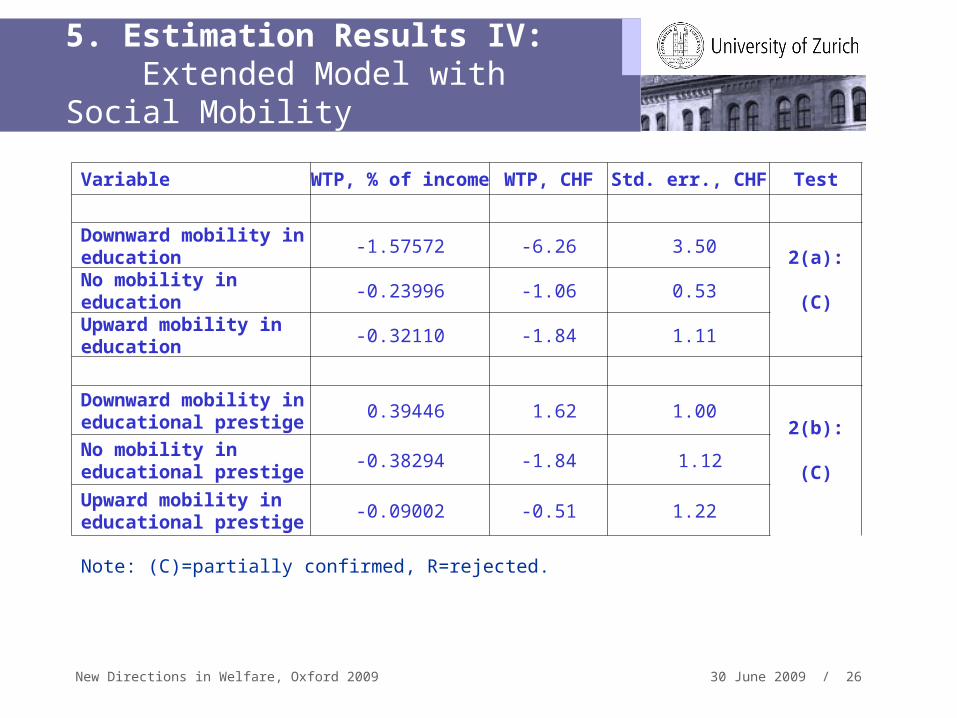
5. Estimation Results IV: Extended Model with Social Mobility
Variable WTP, % of income WTP, CHF Std. err., CHF Test
Downward mobility in education
-1.57572 -6.26 3.502(a):
(C)No mobility in education -0.23996 -1.06 0.53
Upward mobility in education
-0.32110 -1.84 1.11
Downward mobility in educational prestige
0.39446 1.62 1.002(b):
(C)No mobility ineducational prestige
-0.38294 -1.84 1.12
Upward mobility in educational prestige
-0.09002 -0.51 1.22
Note: (C)=partially confirmed, R=rejected.
New Directions in Welfare, Oxford 2009 30 June 2009 / 27
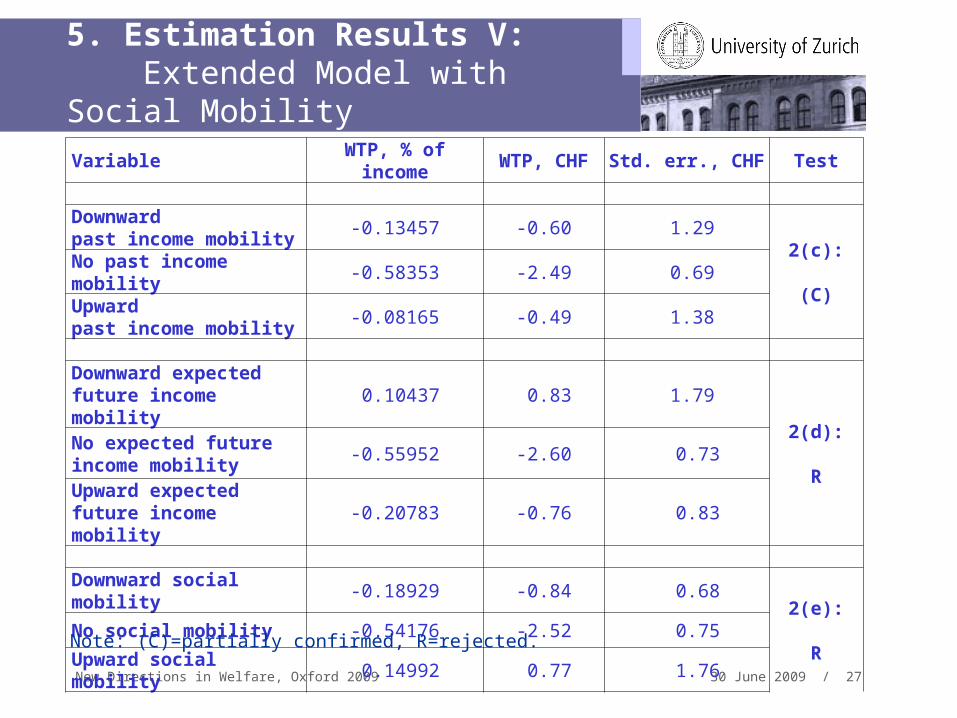
5. Estimation Results V: Extended Model with Social MobilityVariable WTP, % of income WTP, CHF Std. err., CHF Test
Downward past income mobility
-0.13457 -0.60 1.292(c):
(C)No past income mobility -0.58353 -2.49 0.69
Upward past income mobility
-0.08165 -0.49 1.38
Downward expected future income mobility
0.10437 0.83 1.79
2(d):
R
No expected future income mobility
-0.55952 -2.60 0.73
Upward expected future income mobility
-0.20783 -0.76 0.83
Downward social mobility -0.18929 -0.84 0.682(e):
RNo social mobility -0.54176 -2.52 0.75
Upward social mobility 0.14992 0.77 1.76
Note: (C)=partially confirmed, R=rejected.
New Directions in Welfare, Oxford 2009 30 June 2009 / 28
6. Discussion and Conclusion I
• Status quo bias is high (3.75% of annual income)• Additional redistribution causes respondents to opt for the alternative with a lower probability• Even more true for an increase in the income tax• For an additional % point of GDP devoted for redistribution, an average respondent must be paid a compensation of
CHF 18.14 per month (0.39% of monthly income)
New Directions in Welfare, Oxford 2009 30 June 2009 / 29
6. Discussion and Conclusion II
• Demand for redistribution cannot be shown to decrease with personal income
• Demand for redistribution is shown to increase with the level of education (however, only partial statistical significance)
• Demand for redistribution is shown to decrease with higher self-positioning on a social scale but only for lower social classes
New Directions in Welfare, Oxford 2009 30 June 2009 / 30
6. Discussion and Conclusion III
Results of testing the POUM hypothesis:• In 4 out of 5 model specifications (except mobility in education), citizens with no mobility display the highest resistance against redistribution• Possible explanation: risk aversion (not controlled for in this study)• However: risk-aversion argument traditionally used to predict a positive WTP for redistribution• Still: risk aversion can explain the status quo bias
New Directions in Welfare, Oxford 2009 30 June 2009 / 31
6. Discussion and Conclusion IV
The results seem to suggest the following:
• Swiss citizens do not consider public redistribution to be an effective means of protection against economic risks
New Directions in Welfare, Oxford 2009 30 June 2009 / 32
6. Discussion and Conclusion V
Limitations of the analysis:
1. Only purely economic explanations of demand for redistribution (income, social mobility) were tested.
2. Evidence relates to a point of time (may be subject to transitory shocks).
3. The status quo used in the experimental design was only an approximation of the actual status quo, which is individual-dependent.
Related Documents