HAL Id: hal-00728653 https://hal.archives-ouvertes.fr/hal-00728653 Submitted on 30 Aug 2012 HAL is a multi-disciplinary open access archive for the deposit and dissemination of sci- entific research documents, whether they are pub- lished or not. The documents may come from teaching and research institutions in France or abroad, or from public or private research centers. L’archive ouverte pluridisciplinaire HAL, est destinée au dépôt et à la diffusion de documents scientifiques de niveau recherche, publiés ou non, émanant des établissements d’enseignement et de recherche français ou étrangers, des laboratoires publics ou privés. New concept to compute confidence of reported information level for logic diagnosis Quoc Bao Duong, Éric Zamaï, Khoi Quoc Tran Dinh To cite this version: Quoc Bao Duong, Éric Zamaï, Khoi Quoc Tran Dinh. New concept to compute confidence of reported information level for logic diagnosis. 9th International Conference on Modeling, Optimization & SIMulation, Jun 2012, Bordeaux, France. hal-00728653

Welcome message from author
This document is posted to help you gain knowledge. Please leave a comment to let me know what you think about it! Share it to your friends and learn new things together.
Transcript

HAL Id: hal-00728653https://hal.archives-ouvertes.fr/hal-00728653
Submitted on 30 Aug 2012
HAL is a multi-disciplinary open accessarchive for the deposit and dissemination of sci-entific research documents, whether they are pub-lished or not. The documents may come fromteaching and research institutions in France orabroad, or from public or private research centers.
L’archive ouverte pluridisciplinaire HAL, estdestinée au dépôt et à la diffusion de documentsscientifiques de niveau recherche, publiés ou non,émanant des établissements d’enseignement et derecherche français ou étrangers, des laboratoirespublics ou privés.
New concept to compute confidence of reportedinformation level for logic diagnosis
Quoc Bao Duong, Éric Zamaï, Khoi Quoc Tran Dinh
To cite this version:Quoc Bao Duong, Éric Zamaï, Khoi Quoc Tran Dinh. New concept to compute confidence of reportedinformation level for logic diagnosis. 9th International Conference on Modeling, Optimization &SIMulation, Jun 2012, Bordeaux, France. hal-00728653
9th International Conference of Modeling, Optimization and Simulation - MOSIM’12June 6-8, 2012 - Bordeaux - France
”Performance, interoperability and safety for sustainable development”
NEW CONCEPT TO COMPUTE CONFIDENCE OF
REPORTED INFORMATION LEVEL FOR LOGIC DIAGNOSIS
Quoc Bao DUONG; Eric ZAMAI Khoi Quoc TRAN DINH
G-SCOP / Grenoble - INP Danang University of Technology
46 avenue Felix Viallet, 54 Nguyen Luong Bang Street,
38031 Grenoble Cedex, France Danang city, Vietnam
[email protected], [email protected] [email protected]
ABSTRACT: This paper proposes a model to compute confidence of reported information level (CRIL) inthe domain of logic diagnosis. This level of confidence is provided by a diagnosis module allowing to quicklyidentify the origin of equipment failure. We studied the factors affecting CRIL, such as measurement systemreliability, production context, position of sensors in the acquisition chains, type of product, reference metrology,preventive maintenance and corrective maintenance based on historical data and reported information generatedby production equipment. We have introduced a new ’CRIL’ concept based on the Bayesian Network approach,Naıve Bayes model and Tree Augmented Naıve Bayes model. Our contribution includes an on-line confidencecomputation module for production equipment data, and an algorithm to compute CRIL. We suggest it beapplied to the semiconductor manufacturing industry.
KEYWORDS: Diagnosis, Confidence, Bayesian networks, Naıve Bayes, Semiconductor Manufactur-ing, Discrete-event system.
1 INTRODUCTION
Nowadays, Semiconductor Manufacturing operatesin an intense competitive environment. Companiesworking in this industry are striving to improve pro-cess quality while also improving production equip-ment effectiveness. However, virtual metrology, dy-namic control plan, and maintenance, etc are remainchallenging areas. In this paper, we introduce theconcept of CRIL to improve the method for an on-line diagnosis to quickly detect the origin of equip-ment failures. The CRIL is computed from the pro-duction equipment data with Bayesian Network. Anautomated tool is also developed and proposed to beused in the semiconductor manufacturing industry.
This paper is divided in 6 sections. The semicon-ductor manufacturing process and CRIL concept arepresented in section- 2 and section- 3, respectively.Bayesian network approach is discussed in section-4 followed by the algorithm and CRIL computationmodel in section- 5. Section- 6 includes conclusionand the future works.
2 SEMICONDUCTOR MANUFACTUR-ING SYSTEM
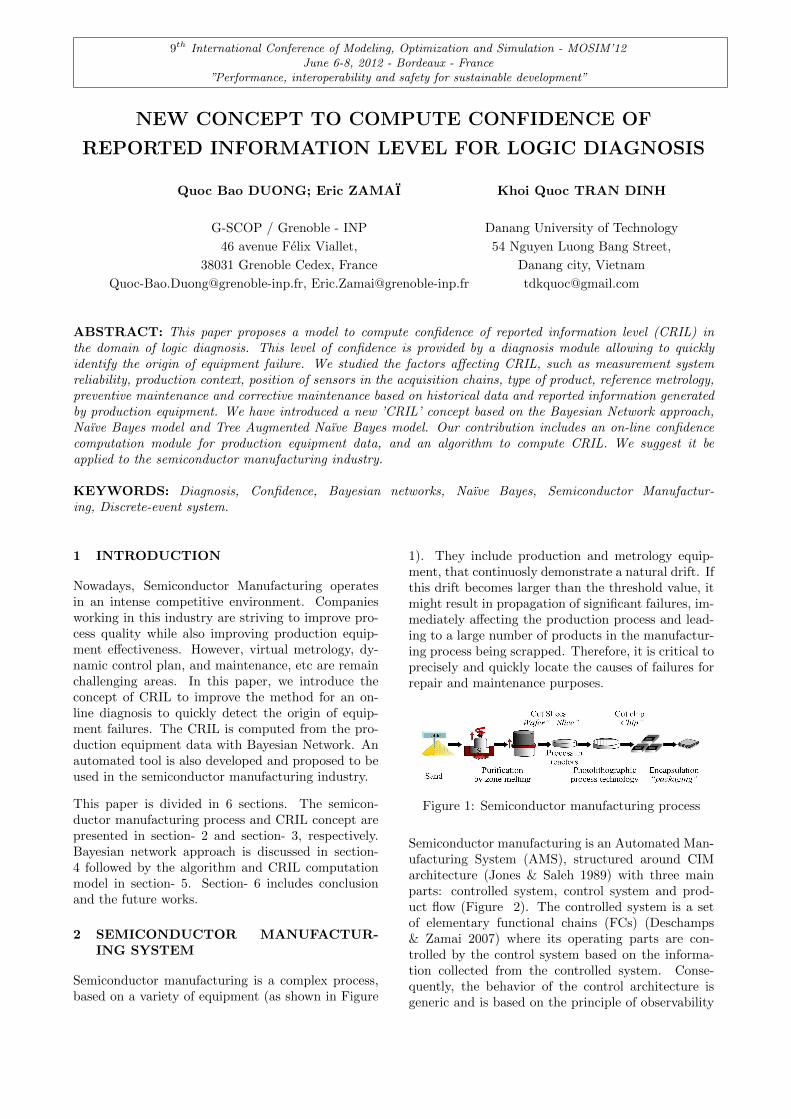
Semiconductor manufacturing is a complex process,based on a variety of equipment (as shown in Figure
1). They include production and metrology equip-ment, that continuosly demonstrate a natural drift. Ifthis drift becomes larger than the threshold value, itmight result in propagation of significant failures, im-mediately affecting the production process and lead-ing to a large number of products in the manufactur-ing process being scrapped. Therefore, it is critical toprecisely and quickly locate the causes of failures forrepair and maintenance purposes.
Figure 1: Semiconductor manufacturing process
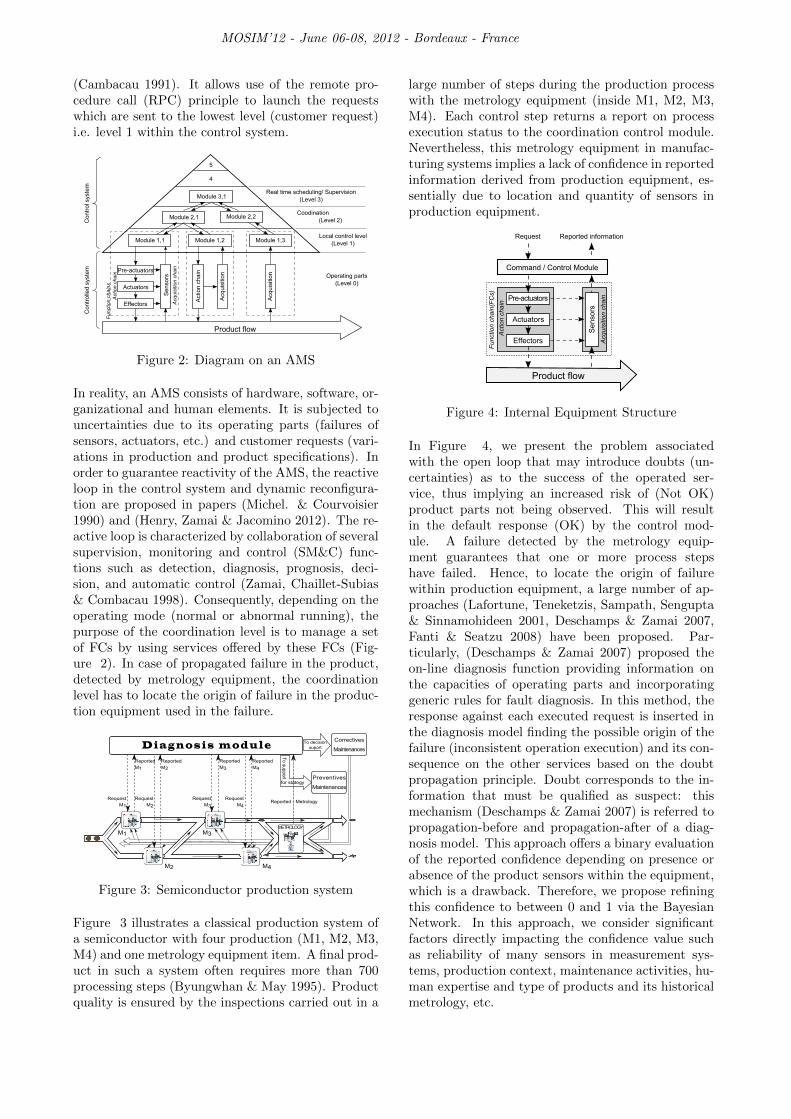
Semiconductor manufacturing is an Automated Man-ufacturing System (AMS), structured around CIMarchitecture (Jones & Saleh 1989) with three mainparts: controlled system, control system and prod-uct flow (Figure 2). The controlled system is a setof elementary functional chains (FCs) (Deschamps& Zamai 2007) where its operating parts are con-trolled by the control system based on the informa-tion collected from the controlled system. Conse-quently, the behavior of the control architecture isgeneric and is based on the principle of observability
MOSIM’12 - June 06-08, 2012 - Bordeaux - France
(Cambacau 1991). It allows use of the remote pro-cedure call (RPC) principle to launch the requestswhich are sent to the lowest level (customer request)i.e. level 1 within the control system.
Pre-actuators
Actuators
Effectors
Se
nso
rs
Module 1,1
Product flow
Module 1,2 Module 1,3
Acq
uis
itio
n
Actio
n c
ha
in
Acq
uis
itio
n c
ha
in
Actio
n c
ha
in
Acq
uis
itio
n
Fu
nctio
n c
ha
ins
Co
ntr
olle
d s
yste
mC
on
tro
l syste
m
Module 2,1 Module 2,2
Module 3,1
5
4
Operating parts
(Level 0)
Local control level
(Level 1)
Coodination
(Level 2)
Real time scheduling/ Supervision
(Level 3)
Figure 2: Diagram on an AMS
In reality, an AMS consists of hardware, software, or-ganizational and human elements. It is subjected touncertainties due to its operating parts (failures ofsensors, actuators, etc.) and customer requests (vari-ations in production and product specifications). Inorder to guarantee reactivity of the AMS, the reactiveloop in the control system and dynamic reconfigura-tion are proposed in papers (Michel. & Courvoisier1990) and (Henry, Zamai & Jacomino 2012). The re-active loop is characterized by collaboration of severalsupervision, monitoring and control (SM&C) func-tions such as detection, diagnosis, prognosis, deci-sion, and automatic control (Zamai, Chaillet-Subias& Combacau 1998). Consequently, depending on theoperating mode (normal or abnormal running), thepurpose of the coordination level is to manage a setof FCs by using services offered by these FCs (Fig-ure 2). In case of propagated failure in the product,detected by metrology equipment, the coordinationlevel has to locate the origin of failure in the produc-tion equipment used in the failure.
M1 M3
M2 M4
METROLOGY
Request
M1
Reported
M1
Request
M2
Request
M3
Request
M4
Reported
M2
Reported
M3
Reported
M4
Reported - Metrology
To
sup
po
rt
for stategy
To decision
suport
Correctives
Maintenances
Preventives
Maintenances
D i a g n o s i s m o d u l e
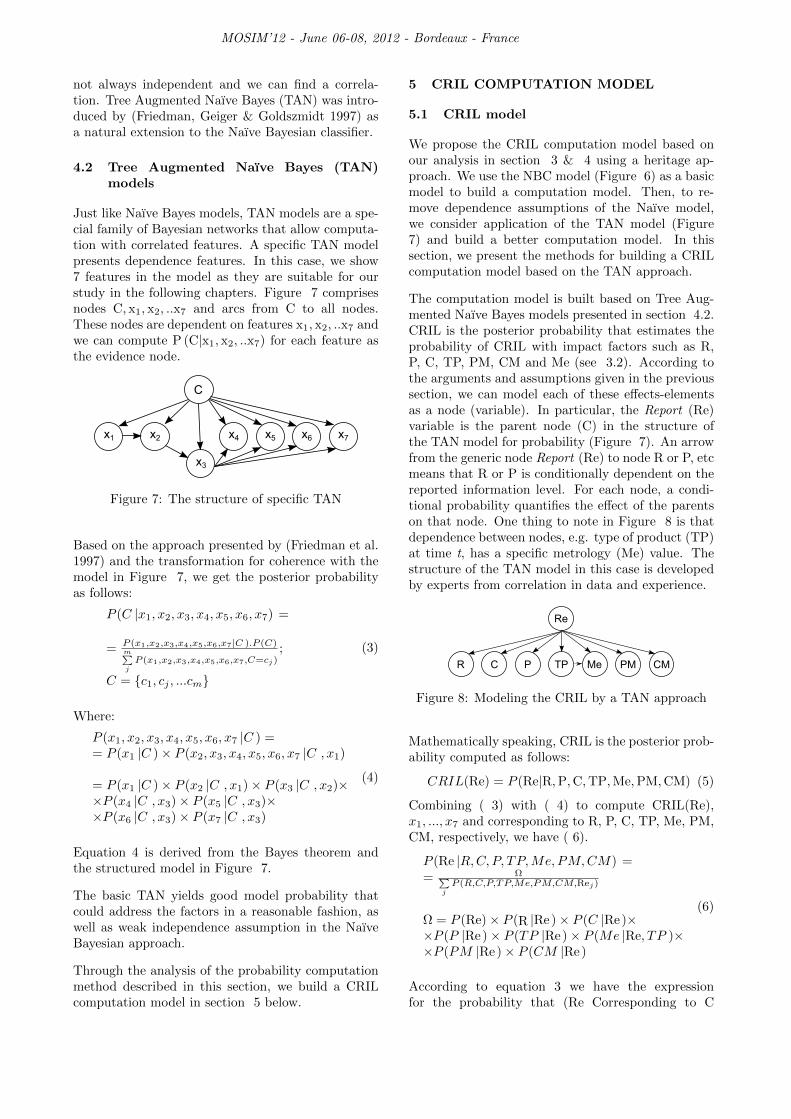
Figure 3: Semiconductor production system
Figure 3 illustrates a classical production system ofa semiconductor with four production (M1, M2, M3,M4) and one metrology equipment item. A final prod-uct in such a system often requires more than 700processing steps (Byungwhan & May 1995). Productquality is ensured by the inspections carried out in a
large number of steps during the production processwith the metrology equipment (inside M1, M2, M3,M4). Each control step returns a report on processexecution status to the coordination control module.Nevertheless, this metrology equipment in manufac-turing systems implies a lack of confidence in reportedinformation derived from production equipment, es-sentially due to location and quantity of sensors inproduction equipment.
Command / Control Module
Product flow
Fu
nctio
n c
ha
in(F
Cs)
Pre-actuators
Actuators
Effectors
Action
ch
ain
Se
nso
rs
Acqu
isitio
n c
hain
Request Reported information
Figure 4: Internal Equipment Structure
In Figure 4, we present the problem associatedwith the open loop that may introduce doubts (un-certainties) as to the success of the operated ser-vice, thus implying an increased risk of (Not OK)product parts not being observed. This will resultin the default response (OK) by the control mod-ule. A failure detected by the metrology equip-ment guarantees that one or more process stepshave failed. Hence, to locate the origin of failurewithin production equipment, a large number of ap-proaches (Lafortune, Teneketzis, Sampath, Sengupta& Sinnamohideen 2001, Deschamps & Zamai 2007,Fanti & Seatzu 2008) have been proposed. Par-ticularly, (Deschamps & Zamai 2007) proposed theon-line diagnosis function providing information onthe capacities of operating parts and incorporatinggeneric rules for fault diagnosis. In this method, theresponse against each executed request is inserted inthe diagnosis model finding the possible origin of thefailure (inconsistent operation execution) and its con-sequence on the other services based on the doubtpropagation principle. Doubt corresponds to the in-formation that must be qualified as suspect: thismechanism (Deschamps & Zamai 2007) is referred topropagation-before and propagation-after of a diag-nosis model. This approach offers a binary evaluationof the reported confidence depending on presence orabsence of the product sensors within the equipment,which is a drawback. Therefore, we propose refiningthis confidence to between 0 and 1 via the BayesianNetwork. In this approach, we consider significantfactors directly impacting the confidence value suchas reliability of many sensors in measurement sys-tems, production context, maintenance activities, hu-man expertise and type of products and its historicalmetrology, etc.

MOSIM’12 - June 06-08, 2012 - Bordeaux - France
To
supp
ort
for stategy
To decision
suportD i a g n o s i s m o d u l e
C R I L m o d u l e
CRIL1 CRIL2 CRIL3 CRIL4
M1 M3
M2 M4
METROLOGY
Request
M1
Reported
M1
Request
M2
Request
M3
Request
M4
Reported
M2
Reported
M3
Reported
M4
Reported - Metrology
Correctives
Maintenances
Preventives
Maintenances
Figure 5: Module for the computation of CRIL
Accurate computation of confidence of reported in-formation level based on collected data plays an im-portant role in the final diagnosis. We thus suggestthe on-line module for computation of the CRIL inreal time (Figure 5). Furthermore, the BN approachallows probability computation based on knowledgegained (Niculescu & Mitchell 2006, Ben-Gal 2007).Next, we present the definition of the confidence ofreported information level (CRIL), the characteriza-tion of CRIL and its model.
3 THE CONFIDENCE OF REPORTED IN-FORMATION LEVEL (CRIL)
Confidence of the reported information received fromthe local controlled system of Automated Manufac-turing Systems (AMS) is based on previous and cur-rent data of the operating parts, followed by the com-putation of CRIL at coordination level.
3.1 Definition
The Confidence of Reported Information Level(CRIL) corresponds to the capacity of the functionalchains that have correctly performed the requestedservices. It is a probability value between 0 and 1.The purpose of CRIL computation is to support diag-nosis and provide relevant information about correctactions confidence of reported information.
3.2 Characterization of CRIL
To study confidence of reported information de-rived from equipment, we have developed a part-nership with the internationally reputed semiconduc-tor manufacturer within the European IMPROVEproject. This project aims at improving Europeansemiconductor fabrication efficiency by providing bet-ter methods and tools to control process variability,thus reducing cycle time and enhancing equipmenteffectiveness. Based on the information provided byindustrial partners (STMicroelectronics, LPFundary,INTEL), we mainly focus on analyzing the factorswhich directly affect the CRIL based on Fault De-tection Classification (FDC), Failure Modes and Ef-fects Analysis (FMEA), and Statistical Process Con-
trol (SPC), etc. An analysis of equipment life fromFDC data (Table 1) is given as an illustration, andrepresents monitoring of evolution of equipment pa-rameters. For confidentiality reasons the table is vol-untarily limited and some information is hidden. Fora given item of equipment, table 1 shows the startand end time of the event, the type of product, thetype of maintenance processing, etc.
EQ Event StartTime
EndDate
Maintstatename
Maintpreviousstate
...
EQ01FAILURE9:18:12 10:15:03 REPAIRFAIL ...EQ01 MAINT 10:58:16 11:21:38 PM IDLE ...EQ01 PROD 18:27:19 19:22:46 NONE NONE ...
... ... ... ... ... ... ...
Table 1: Equipment life from FDC data
Initial data analysis and brainstorming sessions heldwith engineers have resulted in the following sevenmain parameters with high impact on the CRIL:
- Measurement system reliability (R).
- Production context (C).
- Position of sensor (P) in the acquisition chain.
- Type of product (TP).
- Reference metrology for each type of product (Me).
- Preventive maintenance activities (PM).
- Corrective maintenance activities (CM).
These parameters are clearly different from the be-havior issues as the whole production process is fullyautomated in most of the semiconductor productionfacilities. The production context and the productmix are well recorded, and preventive maintenance isclearly characterized. However, sensor data from theproduction and metrology equipment have an inher-ent temporal value that must be utilized to improveconfidence of reported information level. The relia-bility of a measurement system (Maquin, Huynh, Lu-ong & Ragot 1994) is highly temporal and varies ac-cording to usage and operating conditions. It is thusdifficult to determine the relationship between mea-surement system reliability and real time reported in-formation. In this paper, we propose CRIL as anestimation of the probability distribution function ofa metrology system with respect to reported infor-mation. It is highly impacted by corrective mainte-nance as this type of maintenance cannot be sched-uled. However, we present a methodology to improveand compute a real time CRIL. To accurately modelthe relationship between the above mentioned param-eters affecting the CRIL, we have relied on the ex-

MOSIM’12 - June 06-08, 2012 - Bordeaux - France
pert’s knowledge and on probabilistic methods e.g.Expectation Maximization (EM) (Dempster, Laird &Rubin 1977), Markov chain Monte Carlo (MCMC)(Gilks, Richardson & Spiegelhalter 1995), NeuralNetwork (Nauck, Klawonn & Kruse 1997). Someimportant probabilistic analysis methods are men-tioned (Bouaziz, Zamai, Duvivier & Hubac 2011) inthe European IMPROVE project. We have adopteda Bayesian approach to model the CRIL. A real timeCRIL computation module, presented in this paper,combines knowledge representation in a graphicalform (direct dependence relationships: cause→ effect→ failure) and probabilistic knowledge uncertainty(Populaire 2000). This method is used to model a di-rected acyclic graph (DAG) as causal dependencies ofinformation even if they are imperfect or missing. Itis thus ideally adapted to the context of our study, aslearning and inference of this real time CRIL compu-tation module are powerful features enabling mergingof incomplete data with assistance of an expert. Weassume that the effects of these elements on CRIL aredependent and discrete.
4 BAYESIAN NETWORK
BNs are a family of probabilistic graphical modelsproviding joint distribution for a set of random vari-ables (Ben-Gal 2007). Known as a DAG, they areused to represent uncertain knowledge in artificial in-telligence (Korb & Nicholson 2004). The structure ofa DAG combines sets of nodes and arcs where nodesrepresent a set of random variables from a domain.A set of directed arcs (or links) connects pairs ofnodes, representing direct dependencies between vari-ables, where variables are defined over several states.Assuming these are discrete variables, the strengthof the relationship between variables is estimated byconditional probability distributions associated witheach node. BNs are applied in cases of uncertainty,when we know certain conditional probabilities andseek unknown probabilities for given specific condi-tions. To achieve this goal, one of the BN mod-els is widely used as a Naıve Bayes model (Lowd &Domingos 2005). This model is based on the sim-plest assumption that variables are conditionally in-dependent in a given node (class): the Naıve Bayesmodel is presented by a single common parent nodeto all the variable nodes. It has certain advantagessuch as an intuitive technique that does not require alarge amount of data before learning can begin, andfast computation, etc (Ben-Gal 2007). Therefore, theNaıve Bayes model provides reasonably good resultsin some practical problems and is particularly suit-able for our analysis and hypotheses in this paper forreal time CRIL computation. We will describe NaıveBayes in more detail in the next section.
4.1 Naıve Bayes models for probability
The naıve Bayes method is a widely used classificationand clustering method based on the Bayesian theory.It is a special form of Bayesian network relying on animportant simplifying assumption of independence.It has a single node (class) that directly influencesother variables, and other variables are independentfor a given class.
C
x1 x2 xn
Figure 6: The structure of Naıve Bayes classifier
Figure 6 shows a Naıve Bayesian classifier for theclass variable C. Using Bayes’s theorem, we have:
P (C|xi) =P (xi|C)P (C)
P (xi)(1)
Where: C : hypothesis; P (C) : prior probability(probability of hypothesis C before seeing any data);P (xi|C) : conditional probability (likelihood proba-bility); P (xi) : probability of occurrence of record xi;P (C|xi) : posterior probability estimating the prob-ability of C given xi.
Let us have a set of classes C = c1, c2, .., cm repre-senting the observed training set. All variables (train-ing set) X = x1, x2, . . . , xn are assumed to be mutu-ally independent given C. If variable C is observedin the training data, Naıve Bayes can be used by as-signing training set (x1, x2, . . . , xn) to compute max-imum P (C|xi). If C is unobserved then the datacan be clustered using the Expectation Maximiza-tion (EM) algorithm (Dempster et al. 1977) alternat-ing between computing expectations for unobservedvalues using current parameters and the maximumlikelihood. Since the training set has n independentfeatures, we estimate by the conjunction of all condi-tional probabilities of the features as shown in ( 2).
P (X|C) =
n∏i=1
P(xi|C) (2)
The Naıve Bayes model is a simple and efficientapproach for classifying new training set instances.Naıve Bayes is very efficient in computation mod-els for the probability of classifying new training setsas its structure is easily constructed by an expert.Besides, it outperforms analysis of a set of sophis-ticated classifiers over a large set of data, notablywhere features are not strongly correlated (Lowd &Domingos 2005). Unfortunately, their features are
MOSIM’12 - June 06-08, 2012 - Bordeaux - France
not always independent and we can find a correla-tion. Tree Augmented Naıve Bayes (TAN) was intro-duced by (Friedman, Geiger & Goldszmidt 1997) asa natural extension to the Naıve Bayesian classifier.
4.2 Tree Augmented Naıve Bayes (TAN)models
Just like Naıve Bayes models, TAN models are a spe-cial family of Bayesian networks that allow computa-tion with correlated features. A specific TAN modelpresents dependence features. In this case, we show7 features in the model as they are suitable for ourstudy in the following chapters. Figure 7 comprisesnodes C, x1, x2, ..x7 and arcs from C to all nodes.These nodes are dependent on features x1, x2, ..x7 andwe can compute P (C|x1, x2, ..x7) for each feature asthe evidence node.
C
x1 x2 x7
x3
x4 x5 x6
Figure 7: The structure of specific TAN
Based on the approach presented by (Friedman et al.1997) and the transformation for coherence with themodel in Figure 7, we get the posterior probabilityas follows:
P (C |x1, x2, x3, x4, x5, x6, x7) =
= P (x1,x2,x3,x4,x5,x6,x7|C ).P (C)m∑jP (x1,x2,x3,x4,x5,x6,x7,C=cj)
;
C = c1, cj , ...cm
(3)
Where:
P (x1, x2, x3, x4, x5, x6, x7 |C ) == P (x1 |C )× P (x2, x3, x4, x5, x6, x7 |C , x1)
= P (x1 |C )× P (x2 |C , x1)× P (x3 |C , x2)××P (x4 |C , x3)× P (x5 |C , x3)××P (x6 |C , x3)× P (x7 |C , x3)
(4)
Equation 4 is derived from the Bayes theorem andthe structured model in Figure 7.
The basic TAN yields good model probability thatcould address the factors in a reasonable fashion, aswell as weak independence assumption in the NaıveBayesian approach.
Through the analysis of the probability computationmethod described in this section, we build a CRILcomputation model in section 5 below.
5 CRIL COMPUTATION MODEL
5.1 CRIL model
We propose the CRIL computation model based onour analysis in section 3 & 4 using a heritage ap-proach. We use the NBC model (Figure 6) as a basicmodel to build a computation model. Then, to re-move dependence assumptions of the Naıve model,we consider application of the TAN model (Figure7) and build a better computation model. In thissection, we present the methods for building a CRILcomputation model based on the TAN approach.
The computation model is built based on Tree Aug-mented Naıve Bayes models presented in section 4.2.CRIL is the posterior probability that estimates theprobability of CRIL with impact factors such as R,P, C, TP, PM, CM and Me (see 3.2). According tothe arguments and assumptions given in the previoussection, we can model each of these effects-elementsas a node (variable). In particular, the Report (Re)variable is the parent node (C) in the structure ofthe TAN model for probability (Figure 7). An arrowfrom the generic node Report (Re) to node R or P, etcmeans that R or P is conditionally dependent on thereported information level. For each node, a condi-tional probability quantifies the effect of the parentson that node. One thing to note in Figure 8 is thatdependence between nodes, e.g. type of product (TP)at time t, has a specific metrology (Me) value. Thestructure of the TAN model in this case is developedby experts from correlation in data and experience.
Re
R C CMP TP Me PM
Figure 8: Modeling the CRIL by a TAN approach
Mathematically speaking, CRIL is the posterior prob-ability computed as follows:
CRIL(Re) = P (Re|R,P,C,TP,Me,PM,CM) (5)
Combining ( 3) with ( 4) to compute CRIL(Re),x1, ..., x7 and corresponding to R, P, C, TP, Me, PM,CM, respectively, we have ( 6).
P (Re |R,C, P, TP,Me, PM,CM) == Ω∑
jP (R,C,P,TP,Me,PM,CM,Rej)
Ω = P (Re)× P (R |Re)× P (C |Re)××P (P |Re)× P (TP |Re)× P (Me |Re, TP )××P (PM |Re)× P (CM |Re)
(6)
According to equation 3 we have the expressionfor the probability that (Re Corresponding to C
MOSIM’12 - June 06-08, 2012 - Bordeaux - France
in equation 3) will take on (Re = OK) or (Re= Not OK). In equation 6 we need to computeP (Re), P (R|Re), P (C|Re), P (P |Re), P (TP |Re),P (Me|Re, TP ), P (PM |Re) and P (CM |Re)where P(Re) is computed from the training set(data) by counting the number of occurrencesof the Reported event, for example (Reported= OK) or (Reported = Not OK). The probabilityP (C|Re), P (P |Re), P (TP |Re), P (PM |Re), P (CM |Re)can be estimated by counting how often each valueC, P, TP, PM, CM occurs within a class in thetraining set.
The computation model for the CRIL that we presentin this section takes into account the observed datasuch as: C, P, TP, PM and CM. However, reliabil-ity of the measurement system varies over time. Wethus propose a model for the measurement systemand the approach EM algorithm to find the correla-tion between measurement system reliability and Re-port (P (R|Re). This is presented in section 5.1.1.The probability P (Me|Re, TP ) in equation 6 is de-veloped in section 5.1.2.
5.1.1 Measurement system reliability
Sensor reliability is defined as the probability r(t) ofthe non-failure of the sensor at time t, which repre-sents the intrinsic quality of the sensor. It is a mainfactor in CRIL calculation as lower sensor reliability
means lower CRIL. r(t) = 1 −t∫
0
f(t)dt , f(t): failure
density function.
Sensor time to failure is described by the probabilitydensity function. For exponentially distributed timesto failure of sensor (Dhillon 2002), sensor reliabilitycan be written as, λ: failure per a time unit. Themeasurement system is made up of many sensors, andis represented by a block diagram. The probability offailure or success of one of these sensors is estimatedto calculate the probability of failure or success of theoverall system. In this case, the system consistingof m sensors with respective reliabilities ri(t) maydefine the reliability of a measurement system by R =f (ri (t) , r2 (t) , . . . , rm (t)).
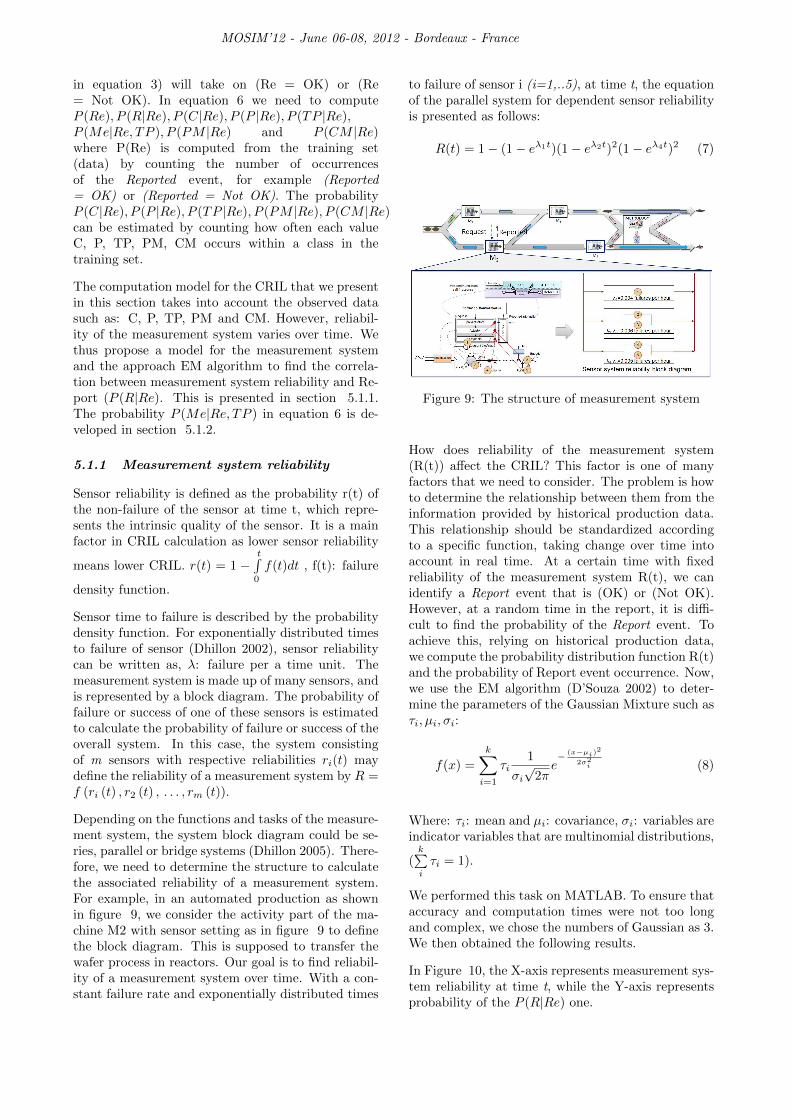
Depending on the functions and tasks of the measure-ment system, the system block diagram could be se-ries, parallel or bridge systems (Dhillon 2005). There-fore, we need to determine the structure to calculatethe associated reliability of a measurement system.For example, in an automated production as shownin figure 9, we consider the activity part of the ma-chine M2 with sensor setting as in figure 9 to definethe block diagram. This is supposed to transfer thewafer process in reactors. Our goal is to find reliabil-ity of a measurement system over time. With a con-stant failure rate and exponentially distributed times
to failure of sensor i (i=1,..5), at time t, the equationof the parallel system for dependent sensor reliabilityis presented as follows:
R(t) = 1− (1− eλ1t)(1− eλ2t)2(1− eλ4t)2 (7)
Figure 9: The structure of measurement system
How does reliability of the measurement system(R(t)) affect the CRIL? This factor is one of manyfactors that we need to consider. The problem is howto determine the relationship between them from theinformation provided by historical production data.This relationship should be standardized accordingto a specific function, taking change over time intoaccount in real time. At a certain time with fixedreliability of the measurement system R(t), we canidentify a Report event that is (OK) or (Not OK).However, at a random time in the report, it is diffi-cult to find the probability of the Report event. Toachieve this, relying on historical production data,we compute the probability distribution function R(t)and the probability of Report event occurrence. Now,we use the EM algorithm (D’Souza 2002) to deter-mine the parameters of the Gaussian Mixture such asτi, µi, σi:
f(x) =
k∑i=1
τi1
σi√
2πe− (x−µi)
2
2σ2i (8)
Where: τi: mean and µi: covariance, σi: variables areindicator variables that are multinomial distributions,
(k∑i
τi = 1).
We performed this task on MATLAB. To ensure thataccuracy and computation times were not too longand complex, we chose the numbers of Gaussian as 3.We then obtained the following results.
In Figure 10, the X-axis represents measurement sys-tem reliability at time t, while the Y-axis representsprobability of the P (R|Re) one.

MOSIM’12 - June 06-08, 2012 - Bordeaux - France
Figure 10: The relationship between measurementsystem reliability and reported information
5.1.2 Metrology activities for each type ofproduct
As presented in the above section, the metrology ma-chine is located at the end of a process to decidewhether end products are OK or Not OK. Our goalin this part is to analyze the relationship between themetrology decision, the type of product, and the re-ported information (Re) to show elements affectingconfidence of reported information. We assume cor-rect report by the metrology machine, random test-ing in a batch of products, and existence of a fixedlate time comparison with the report of manufactur-ing machines.
Date and time Type of product Reported in-formation
21:57 06-Jan-2005 TypeA Not OK22:04 06-Jan-2005 TypeC Ok01:32 07-Jan-2005 TypeA Not OK02:44 07-Jan-2005 TypeB Not OK02:49 07-Jan-2005 TypeC Not OK03:27 07-Jan-2005 TypeC Ok08:09 07-Jan-2005 TypeB Ok15:09 07-Jan-2005 TypeA Not OK16:00 07-Jan-2005 TypeC Ok16:12 07-Jan-2005 TypeA Not OK17:50 07-Jan-2005 TypeB Ok18:05 07-Jan-2005 TypeB Not OK01:42 08-Jan-2005 TypeB OK02:56 08-Jan-2005 TypeC Not OK
Table 2: Production data
For example (as shows in Table 2, 3), we considerthree types of products, A, B and C, which passthrough production machines M3. The historical pro-duction data for three dates are shown in Table 2.The first column shows data on the random time re-ceiving reports from M3. The results of the metrologymachine are shown in Table 3. The metrology ma-
chine randomly tests all types of products with, onaverage, one time per date. Column 3 in table 3 sup-plies two possible values (Metrology = Pass) or (Re= Not Pass). Pass means that the quality of a prod-uct manufactured by the machine is good, while NotPass means the opposite. Considering a particularcase at 01:42:00, 08-jan-2005, product type B afterthe production process at machine M3 had receivedthe report (Re = OK). However, after a fixed latetime at 17-jan-2005, the metrology report receivedwas Not Pass. This means that there is a differencebetween the reports of M3 and the metrology machineresulting in an uncertainty of reported information onproduction machines. We thus need to analyze theimpact of reported information and metrology in theCRIL model.
Date Type of product Metrology
08-Jan-2005 TypeA Pass17-Jan-2005 TypeB Not Pass24-Jan-2005 TypeC Pass
Table 3: Metrology data
In Equation ( 6), to calculate the CRIL, we need todefine P (Me|Re, TP ).
Considering the Bayes’ theorem, we obtain as follows:
P (Me |TP,Re) = P (Me,TP,Re)P (TP,Re) = P (Me,TP,Re)
U∑jP (TP,Re,Mej)
;
U = Pass,Not Pass(9)
Production and metrology data are required in thesame survey period to compute P(Me,TP,Re) fromequation ( 9). However, we faced difficulties as tothe time reported in Tables 2 and 3 such as thedifference in format and the number of reports (pro-duction data time reports on average 10 times/day,whereas metrology data reports once every day). Wecan solve this problem by integrating the data (Table4) on the sampling principle. The result of metrologyin the production system reflects the quality of theproduct in one day. In other words, the time beforethe new results or the result in (t-1) will be true atany time before it.
P(Me,TP,Re) is computed from Table 4 by countingthe number of occurrences (simultaneous appearanceof values) in Table 4, e.g. TypeA,OK,Pass.
MOSIM’12 - June 06-08, 2012 - Bordeaux - France
Date and time Type of productReport Metrology
21:57 06-Jan-2005 TypeA Not OK Pass22:04 06-Jan-2005 TypeC Ok Pass01:32 07-Jan-2005 TypeA Not OK Pass02:44 07-Jan-2005 TypeB Not OK Not Pass02:49 07-Jan-2005 TypeC Not OK Pass03:27 07-Jan-2005 TypeC Ok Pass08:09 07-Jan-2005 TypeB Ok Not Pass15:09 07-Jan-2005 TypeA Not OK Pass16:00 07-Jan-2005 TypeC Ok Pass16:12 07-Jan-2005 TypeA Not OK Pass17:50 07-Jan-2005 TypeB Ok Not Pass18:05 07-Jan-2005 TypeB Not OK Not Pass01:42 08-Jan-2005 TypeB OK Not Pass02:56 08-Jan-2005 TypeC Not OK Pass
Table 4: Mixing the data
5.2 Algorithm and Implementation
5.2.1 CRIL Computation Algorithm
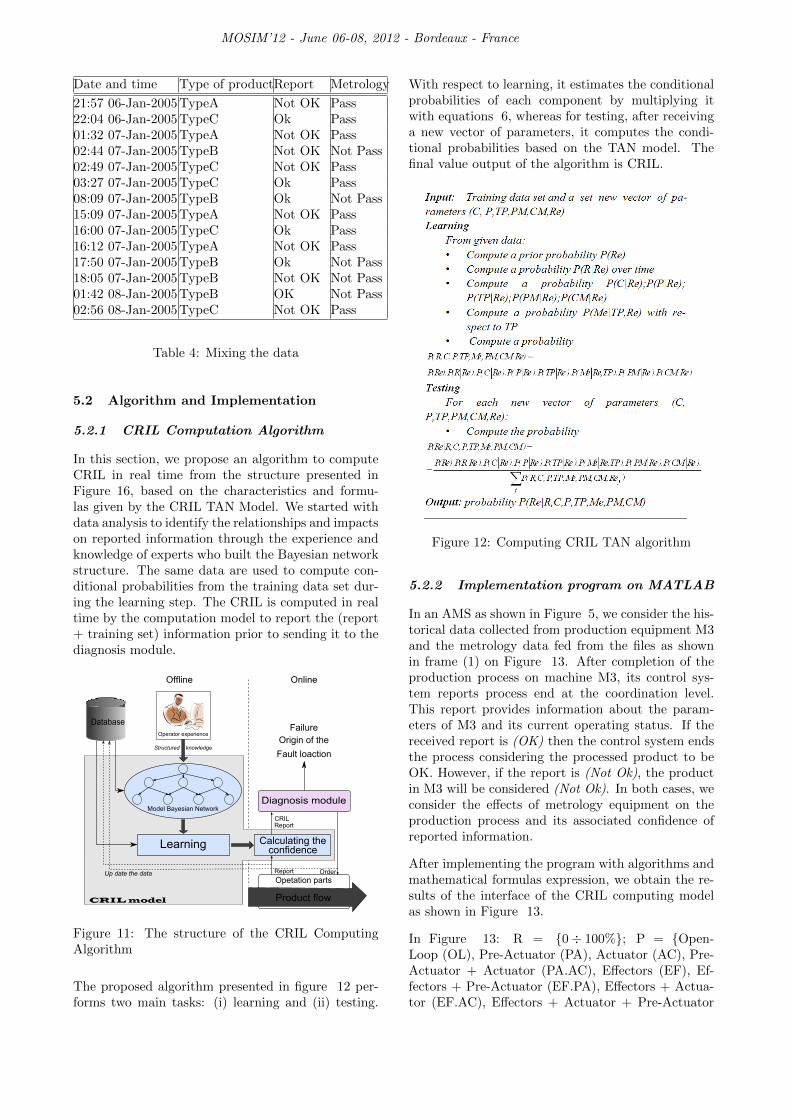
In this section, we propose an algorithm to computeCRIL in real time from the structure presented inFigure 16, based on the characteristics and formu-las given by the CRIL TAN Model. We started withdata analysis to identify the relationships and impactson reported information through the experience andknowledge of experts who built the Bayesian networkstructure. The same data are used to compute con-ditional probabilities from the training data set dur-ing the learning step. The CRIL is computed in realtime by the computation model to report the (report+ training set) information prior to sending it to thediagnosis module.
Offline Online
Database
Operator experience
Model Bayesian NetworkDiagnosis module
Learning Calculating theconfidence
Opetation parts
Product flow
Up date the data
CRIL model
Structured knowledge
Report
Order
CRIL
Report
Fault loaction
Origin of the
Failure
Figure 11: The structure of the CRIL ComputingAlgorithm
The proposed algorithm presented in figure 12 per-forms two main tasks: (i) learning and (ii) testing.
With respect to learning, it estimates the conditionalprobabilities of each component by multiplying itwith equations 6, whereas for testing, after receivinga new vector of parameters, it computes the condi-tional probabilities based on the TAN model. Thefinal value output of the algorithm is CRIL.
Figure 12: Computing CRIL TAN algorithm
5.2.2 Implementation program on MATLAB
In an AMS as shown in Figure 5, we consider the his-torical data collected from production equipment M3and the metrology data fed from the files as shownin frame (1) on Figure 13. After completion of theproduction process on machine M3, its control sys-tem reports process end at the coordination level.This report provides information about the param-eters of M3 and its current operating status. If thereceived report is (OK) then the control system endsthe process considering the processed product to beOK. However, if the report is (Not Ok), the productin M3 will be considered (Not Ok). In both cases, weconsider the effects of metrology equipment on theproduction process and its associated confidence ofreported information.
After implementing the program with algorithms andmathematical formulas expression, we obtain the re-sults of the interface of the CRIL computing modelas shown in Figure 13.
In Figure 13: R = 0÷ 100%; P = Open-Loop (OL), Pre-Actuator (PA), Actuator (AC), Pre-Actuator + Actuator (PA.AC), Effectors (EF), Ef-fectors + Pre-Actuator (EF.PA), Effectors + Actua-tor (EF.AC), Effectors + Actuator + Pre-Actuator

MOSIM’12 - June 06-08, 2012 - Bordeaux - France
1
2
3
4
5
67
Figure 13: Interface of confidence of reported information computing model
(EF.AC.PA); C= Normal production (N), Massproduction (MP), Change recipes (CR) ; PM =0÷m; CM = 0÷ k.
We introduce some main frames in the interface asfollows: (1). Input data (Production and Metrologydata). (2). Description of the model structure. (3).The temporary result of equation 6 . (4). The re-ported information at time t. (5). Presentation ofprobability P (R|Re) over time. (6). The temporaryresult of probability P(Me,TP,Re). (7). Show all thecalculated results.
In line 18, of frame 7, the CRIL of Report is (OK)with the current parameters of M3, e.g. R(7391h)= 0.1196. This means that reliability of the mea-surement system, considering its operated time as7391 hours is 0.1196. We can infer value P (R|Re) =0.56714 from R(7391h). C = MP, P = EF.AC.PA,TypeC, PM = 9 CM = 10, and association with thebackward reference metrology activity (Me = Pass)is computed as 49.68%.
In this case, the CRIL of equipment M3 that hascorrectly performed the requested services (Reported= OK) is 49.68% at the time of computation, withthe current equipment parameters and the productioncontext. It helps automation engineers to locate theprocess equipment leading to product failure detectedby the Metrology. Change over time in the currentparameters of M3 results in different CRILs(frame 7).
Based on process data and the expert’s knowledge,we are now able to evaluate the confidence of allthe reported information taken from the equipment.The resulting CRIL is a value between 0 and 1that extends the diagnosis inference proposed by(Deschamps & Zamai 2007).
6 CONCLUSIONS
This paper proposes a concept of confidence of re-ported information level (CRIL) to help automationengineers locate the process equipment leading toproduct failure detected by the Metrology. The pro-posed CRIL index is a value between 0 and 1 andis computed based on the BNs approach which iswidely accepted as a methodology to learn uncertain-ties. Furthermore, we have developed an algorithmand a computation module for real time computa-tion of the said CRIL index. Based on the algorithmsand the TAN model, a tool developed in Matlab ispresented and proposed for use in the semiconductormanufacturing industry. Our work is an extensionto the diagnosis approach proposed by (Deschamps& Zamai 2007). Based on the our analysis, we havehighlighted seven main factors that impact the CRIL.Our proposed TAN model processes the inherent un-certainty reported information and obtain the poste-rior probabilisty of the reported information. It isthus able to provide the diagnosis module with theinformation it need to facilitate locate of the origin

MOSIM’12 - June 06-08, 2012 - Bordeaux - France
of an equipment failure in a given production pro-cess. In future, we focus on validating the model onthe data collected from a world reputed semiconduc-tor manufacturing industry (partner in the EuropeanIMPROVE project). Furthermore, we are working onthe extension of the proposed TAN model with theinclusion of continuous and temporal variable usingDynamic Bayesian network.
REFERENCES
References
Ben-Gal, I. (2007). Bayesian networks, in F. Ruggeri,R. Kenett & F. W. Faltin (eds), Encyclopedia ofstatistics in quality and reliability, John Wileyand Sons.
Bouaziz, M. F., Zamai, E., Duvivier, F. & Hubac,S. (2011). Dependability of complex semicon-ductor systems: Learning bayesian networks fordecision support, Dependable Control of DiscreteSystems (DCDS), 2011 3rd International Work-shop on, pp. 7–12.
Byungwhan, K. & May, G. S. (1995). Real-time diagnosis of semiconductor manufactur-ing equipment using neural networks, Electron-ics Manufacturing Technology Symposium, 1995.’Manufacturing Technologies - Present and Fu-ture’, Seventeenth IEEE/CPMT International,pp. 224–231.
Cambacau, M. (1991). Commande et surveillance dessystemes a evenement discrets complexes: appli-action aux ateliers flexible, PhD thesis.
Dempster, A. P., Laird, N. M. & Rubin, D. B. (1977).Maximum likelihood from incomplete data viathe em algorithm, Journal of the Royal Statisti-cal Society. Series B (Methodological) 39(1): 1–38.
Deschamps, E. & Zamai, E. (2007). Diagnostis forcontrol system reconfiguration, The 4th Interna-tional Federation of Automatic Control Confer-ence on Management and Control of Productionand Logistics.
Dhillon, B. (2002). Reliability, Engineering mainte-nance, CRC PRESS.
Dhillon, B. (2005). Dynamic reliability evaluationmodels, in B. Dhillon (ed.), Reliability, Quality,and Safety for Engineers, CRC PRESS.
D’Souza, A. A. (2002). Using em to estimate a prob-ablity density with a mixture of gaussians.
Fanti, M. P. & Seatzu, C. (2008). Fault diagnosisand identification of discrete event systems us-ing petri nets, Discrete Event Systems, 2008.
WODES 2008. 9th International Workshop on,pp. 432–435.
Friedman, N., Geiger, D. & Goldszmidt, M. (1997).Bayesian network classifiers, Mach. Learn. 29(2-3): 131–163.
Gilks, W. R., Richardson, S. & Spiegelhalter (1995).Markov Chain Monte Carlo in Practice, Chap-man & Hall/CRC.
Henry, S., Zamai, E. & Jacomino, M. (2012). Logiccontrol law design for automated manufacturingsystems, Engineering Applications of ArtificialIntelligence (0).
Jones, A. & Saleh, A. (1989). A multi-layer/multi-level control architecture for computer inte-grated manufacturing systems, Industrial Elec-tronics Society, 1989. IECON ’89., 15th AnnualConference of IEEE, pp. 519–525 vol.3.
Korb, K. B. & Nicholson, A. E. (2004). BayesianArtificial Intelligence.
Lafortune, S., Teneketzis, D., Sampath, M., Sen-gupta, R. & Sinnamohideen, K. (2001). Fail-ure diagnosis of dynamic systems: An approachbased on discrete event systems, The Ameri-can Control Conference, Vol. 25-27, Arlington,pp. 2058–2071.
Lowd, D. & Domingos, P. (2005). Naive bayes modelsfor probability estimation.
Maquin, D., Huynh, C. T., Luong, M. & Ragot,J. (1994). Observability, redundancy, reliabil-ity and integrated design of measurement sys-tems, 2nd IFAC Symposium on Intelligent Com-ponents and Instruments for Control Applica-tions, SICICA’94, p. . SURFDIAG.
Michel., C. & Courvoisier, M. (1990). A hierarchi-cal and modular structure for fms control andmonitoring, The 1st Conference AI simulationand planning in high autonomy systems, Tucson,Arizona.
Nauck, D., Klawonn, F. & Kruse, R. (1997). Foun-dations of Neuro-Fuzzy Systems, Wiley.
Niculescu, R. & Mitchell, T. (2006). Bayesian net-work learning with parameter constraints.
Populaire, S. (2000). Introduction aux reeauxbayesiens, Rapport interne du laboratoire SIME,Universite de Technologie de Compiegne.
Zamai, E., Chaillet-Subias, A. & Combacau, M.(1998). An architecture for control and moni-toring of discrete events systems, Computers inIndustry 36(1-2): 95–100.
Related Documents