Promotoren: prof. dr. ir. J.-M. Noterdaeme, prof. dr. ir. M. Van Schoor Proefschrift ingediend tot het behalen van de graden van Doctor in de ingenieurswetenschappen: toegepaste natuurkunde (Universiteit Gent) en Doctor in de ingenieurswetenschappen (Koninklijke Militaire School) Vakgroep Toegepaste Fysica Voorzitter: prof. dr. ir. C. Leys Faculteit Ingenieurswetenschappen en Architectuur Departement Fysica Departementshoofd: prof. dr. ir. M. Van Schoor Faculteit Polytechniek Academiejaar 2018 - 2019 A New ICRF Antenna for Future Reactors: The Travelling Wave Array Antenna Een nieuwe ICRF-antenne voor toekomstige reactoren: de ‘Travelling Wave Array’-antenne Riccardo Ragona

Welcome message from author
This document is posted to help you gain knowledge. Please leave a comment to let me know what you think about it! Share it to your friends and learn new things together.
Transcript
Promotoren: prof. dr. ir. J.-M. Noterdaeme, prof. dr. ir. M. Van SchoorProefschrift ingediend tot het behalen van de graden van
Doctor in de ingenieurswetenschappen: toegepaste natuurkunde (Universiteit Gent)en Doctor in de ingenieurswetenschappen (Koninklijke Militaire School)
Vakgroep Toegepaste FysicaVoorzitter: prof. dr. ir. C. Leys
Faculteit Ingenieurswetenschappen en Architectuur
Departement FysicaDepartementshoofd: prof. dr. ir. M. Van Schoor
Faculteit Polytechniek
Academiejaar 2018 - 2019
A New ICRF Antenna for Future Reactors: The Travelling Wave Array Antenna
Een nieuwe ICRF-antenne voor toekomstige reactoren: de ‘Travelling Wave Array’-antenne
Riccardo Ragona

ISBN 978-94-6355-183-0NUR 959, 961Wettelijk depot: D/2018/10.500/101

Members of the examination commiee
Chair
em. prof. dr. ir. Daniël De Zuer (Universiteit Gent)
Reading Commiee
prof. dr. ir. Kristel Crombé (Universiteit Gent)prof. dr. ir. Hendrik Rogier (Universiteit Gent)prof. dr. ir. Raymond Koch (Koninklijke Militaire School, Brussel)
Other members
dr. André Messiaen (Koninklijke Militaire School, Brussel)dr. Jean Jacquinot (ITER Organization, Saint-Paul-lès-Durance, Frankrijk)prof. dr. ir. Jean-Marie Noterdaeme (Universiteit Gent)prof. dr. ir. Michael Van Schoor (Koninklijke Militaire School, Brussel)


Acknowledgment
Part of this work has been carried out within the framework of the EUROfusionConsortium and has received funding from the Euratom research and train-ing programme 2014-2018 under grant agreement No 633053 in the frame-work of the PPPT programme. The views and opinions expressed herein donot necessarily reflect those of the European Commission.

Thanks
A special thanks goes to the Laboratory for Plasma Physics - ERM/KMS inthe person of Prof. Michael Van Schoor for the moral and financial supportduring this work. Thanks also to Prof. Jean-Marie Noterdaeme for the longand stimulating discussions.
My sincere gratitude goes to all the colleagues that have worked with me.I am very happy and proud to have worked with you.
A special thanks goes to André for sharing with me his knowledge and hispassion for this beautiful and interesting field. Your guide and help have beenessential for this work. A special thanks to Dirk for finding always a couple ofminutes for me and for my sometimes crazy questions. The discussions withyou have brought many fruits. Many thanks also for the time spent rockingw/o rolling on the belgian limestone. I felt one step closer to home. Anotherspecial thanks goes to Jef for his endless help in solving my scientific/politicalissues and for the interesting discussions on energy, a very important anddiicult topic. I would also like to mention our common interest in the beautyof the flemish and italian accents.
My profound gratitude goes to all my families and friends that, despite thedistance or the diiculties, have always been supporting and inspiring.
Infine un grazie di cuore va ai miei cari genitori per il loro inesauribile aeoe sostegno..
Grazie, Tak, Merci, Dank u
Riccardo RagonaBruxelles, December 5, 2018


NOBIS MAIOR PRODEST


Contents
Nederlandse samenvaing v
Summary in English xi
List of Abbreviations xvii
1 Background 1
1.1 Thermonuclear Fusion . . . . . . . . . . . . . . . . . . . . . . 1
1.2 Tokamak . . . . . . . . . . . . . . . . . . . . . . . . . . . . . . 4
1.3 ICRF System . . . . . . . . . . . . . . . . . . . . . . . . . . . . 6
1.4 Dispersion relation . . . . . . . . . . . . . . . . . . . . . . . . 9
1.5 ICRF scenarios . . . . . . . . . . . . . . . . . . . . . . . . . . . 16
1.6 Simplest wave coupling model. . . . . . . . . . . . . . . . . . . 17
1.7 Launcher analysis . . . . . . . . . . . . . . . . . . . . . . . . . 23
1.8 Antenna Matching . . . . . . . . . . . . . . . . . . . . . . . . 32
2 Travelling Wave Array 35
2.1 Circuit modelling . . . . . . . . . . . . . . . . . . . . . . . . . 35
2.2 Coupling properties . . . . . . . . . . . . . . . . . . . . . . . . 42
2.3 Computation of the strap matrix Z . . . . . . . . . . . . . . . 45
2.4 Approximate relations and optimization of TWA . . . . . . . . 47
i
CONTENTS
3 Resonant Ring feeding 51
3.1 Four port couplers . . . . . . . . . . . . . . . . . . . . . . . . . 53
3.2 Variable Coupling Coeicient Coupler . . . . . . . . . . . . . 54
3.3 TWA in a Resonant Ring . . . . . . . . . . . . . . . . . . . . . 57
3.4 Resonant Ring control . . . . . . . . . . . . . . . . . . . . . . . 59
3.5 Comparison between dierent feeding schemes . . . . . . . . 63
3.5.1 Simulation parameters . . . . . . . . . . . . . . . . . . 63
3.5.2 360 array all straps fed . . . . . . . . . . . . . . . . . 64
3.5.3 360 array periodic feeding . . . . . . . . . . . . . . . 65
3.5.4 360 array consecutive resonant rings . . . . . . . . . 68
4 Measurements 73
4.1 Hybrid coupler . . . . . . . . . . . . . . . . . . . . . . . . . . . 73
4.2 Variable coupling coeicient coupler . . . . . . . . . . . . . . 75
4.3 Directional coupler . . . . . . . . . . . . . . . . . . . . . . . . 79
4.4 Resonant Ring . . . . . . . . . . . . . . . . . . . . . . . . . . . 80
4.5 TWA in a resonant ring . . . . . . . . . . . . . . . . . . . . . . 87
5 Application to DEMO 101
5.1 TWA for DEMO . . . . . . . . . . . . . . . . . . . . . . . . . . 102
5.1.1 TWA performance . . . . . . . . . . . . . . . . . . . . 102
5.1.2 Proposed TWA system . . . . . . . . . . . . . . . . . . 105
5.2 Sensitivity on loading . . . . . . . . . . . . . . . . . . . . . . . 109
6 Proof of Principle on WEST 131
6.1 WEST ion cyclotron antenna . . . . . . . . . . . . . . . . . . . 132
6.1.1 Model specification . . . . . . . . . . . . . . . . . . . . 132
6.1.2 Performance . . . . . . . . . . . . . . . . . . . . . . . 134
6.2 Travelling Wave Array . . . . . . . . . . . . . . . . . . . . . . 138
6.2.1 Model specifications . . . . . . . . . . . . . . . . . . . 138
6.2.2 Performance . . . . . . . . . . . . . . . . . . . . . . . 141
6.2.3 Sensitivity on loading . . . . . . . . . . . . . . . . . . 144
ii

CONTENTS
6.3 Comparison between ICA and TWA . . . . . . . . . . . . . . . 149
6.3.1 ANTITER-II analysis . . . . . . . . . . . . . . . . . . . 149
6.3.2 HFSS analysis . . . . . . . . . . . . . . . . . . . . . . . 151
6.3.3 Near fields . . . . . . . . . . . . . . . . . . . . . . . . . 160
6.4 Capacitor sensitivity . . . . . . . . . . . . . . . . . . . . . . . 166
6.5 Antenna position . . . . . . . . . . . . . . . . . . . . . . . . . 171
6.6 System overview . . . . . . . . . . . . . . . . . . . . . . . . . . 172
7 Overview and conclusions 177
7.1 Overview . . . . . . . . . . . . . . . . . . . . . . . . . . . . . . 177
7.2 Summary and discussion . . . . . . . . . . . . . . . . . . . . . 179
7.3 Final conclusion . . . . . . . . . . . . . . . . . . . . . . . . . . 185
Appendices 187
A Derivation of Svc 189
B Ohmic loss estimation 191
C ICA performance 199
Bibliography 207
iii


Nederlandse samenvaing
Onze geïndustrialiseerde maatschappij staat of valt met de beschikbaarheidvan goedkope energie. Twee eeuwen lang werd die energie voornamelijkgeproduceerd door fossiele brandstoen. Nu echter is het om economischeen ecologische redenen noodzakelijk om op zoek te gaan naar een anderemanier om op grote schaal energie te verschaen. Velen zien gecontroleerdethermonucleaire fusie als een veelbelovende kandidaat om aan die vraagte voldoen. Gebaseerd op grondstoen die overvloedig aanwezig zijn (inzeewater en lithium) zou fusie duizenden komende generaties van de nodigeenergie kunnen voorzien.Er bestaan verschillende soorten experimentele fusiereactoren die steunenop het principe van magnetische opsluiting. Al die alternatieven hebben éénaspect gemeen: om de hoge temperaturen te kunnen bereiken die nodig zijnom fusiereacties spontaan op gang te brengen hebben ze allen een eiciënteverhiingsmethode nodig. Elektromagnetische golven die opgewekt wordenop de rand van de machine, waar de temperatuur en de dichtheid laag zijn,maar die energie naar het hete en dichte centrum van het plasma kunnentransporteren, kunnen die opdracht vervullen.
Het onderwerp van deze thesis is de studie van een vrij nieuw concept vanantenne, aangewend in het ionen cyclotron (radio-)frequente domein: de"traveling wave antenna" (TWA), een antenna die steunt op het principe dater een golfstructuur van de ene strap naar de andere "reist". In dit werk zalaangetoond worden dat dat ontwerp een aantal duidelijke voordelen heein vergelijking met de antennas die meer traditioneel in fusiemachines ge-bruikt worden. In het bijzonder zal uitgelegd worden hoe een moeilijkheidomgebogen wordt tot een voordeel: In grote machines is de afstand van deantenna tot aan het plasma vrij groot zodat de golven evanescent zijn in deregio waar ze opgewekt worden. Om door de evanescente zone te tunnelendient het elektrisch veld bij haar geboorte zo groot te zijn dat risico bestaatop ionisatie, ontlading, spuering of vorming van oververhie plaatsen op dewand. De hier voorgestelde antenna laat niet alleen toe om de veldamplitudebeperkt te houden, ze hee zelfs nood aan een voldoende afstand tussen de
v
CONTENTS
geleider en het plasma opdat de antenne optimaal zou werken.
De geleiders van een klassieke antenne worden onafhankelijk van elkaargevoed. De vorm van het antenne-spectrum wordt bepaald door de relatievefase van de stroomdichtheden op de antennebladen. Vermits de verschil-lende geleiders onafhankelijk van elkaar bestuurd worden, wordt koppel-ing als een te vermijden fenomeen beschouwd. Om die koppeling beperktte houden worden tussen de straps geleidende plaatjes ("septa") geplaatst,wat de verschillende netwerken - in belangrijke mate - gescheiden houdt entoelaat de generatoren te besturen zonder te moeten vrezen voor ongewen-ste terugkoppeling van vermogen. De TWA vertrekt van een compleet ver-schillend uitgangspunt: slecht 1 strap wordt actief gevoed, en eerder dande straps van mekaar te ontkoppelen wordt vertrouwd op het feit dat zekoppelen om op naburige elementen een stroom op te wekken die op zijnbeurt een elektrisch veld opwekt; in het RF-domein is die koppeling meestalinductief van aard. Gezien de antenne bestaat uit een groot aantal strapsdient elke individuele strap minder vermogen uit te stralen. Daardoor is devermogendichtheid van de golf kleiner voor eenzelfde aan het plasma te kop-pelen vermogen dan bij een klassieke antenne. Het hoe geen betoog dat deassemblage van dit soort verhiingsinstallatie minder omslachtig is: er zijnbeduidend minder netwerken nodig. Magnetische opsluiting laat toe geladendeeltjes in banen te dwingen, zodat ze niet alleen in het reactorvat blijvenmaar tevens de wand van het vat niet raken. Deze vorm van opsluiting isechter niet perfect en dus zijn er onvermijdelijk verliezen. Vermits het aantalfusiereacties in het reactorvat evenredig is met het beschikbare volume, maargezien de verliezen enkel door de wand opgevangen kunnen worden, zullentoekomstige fusiereactoren naar alle waarschijnlijkheid grote machines zijn.De verhouding tussen het geproduceerde fusievermogen en het verloren ver-mogen schaalt als de verhouding van het volume tot het oppervlak. Op diemanier levert een verdubbeling van de doorsnede van de machine dus 8xmeer fusiereacties op terwijl de verliezen slechts met een factor 4 toenemen.De performantie neemt toe met een factor twee. In de praktijk is de winstnog groter, o.m. omdat grotere machines grotere plasmastromen toelaten,waardoor de dichtheid verder in de hoogte kan worden geduwd.
De eiciëntie waarmee het - door de snelle magneto-sonische golf gedragen- RF-vermogen ingekoppeld wordt in het tokamakplasma hangt gevoelig afvan hoe het dichtheidsprofiel er uit ziet vlak bij de antenna. In het bijzonderis de afstand tot aan de "cut-o" - de laag waar de snelle golf niet langerevanescent is - van groot belang. Na ITER - dat onder internationale vlaggebouwd wordt in Cadarache - is DEMO de volgende stap naar de commer-ciële realisatie van kernfusie. Deze Europese demonstratiereactor is omvan-grijk; hij zal bijvoorbeeld een kleine straal hebben van 3m. Die machine
vi
CONTENTS
is dus beduidend groter dan eender welke momenteel bestaande tokamak,en dat hee zijn repercussies op de koppeling. Daar waar de afstand totaan de cut-o enkele centimeters bedraagt in de opstellingen die momenteelbestaan, zal hij enkele tientallen centimeters zijn in DEMO. Wanneer we detot nu toe vergaarde kennis inzake deeltjes- en energie-opsluiting - opgedaanin de huidige en vorige generaties fusiemachines - in rekening brengen om tevoorspellen hoe DEMO zich zal gedragen, dan leert dat dat we tussen de 50en 100MW vermogen zullen nodig hebben om het DEMO-plasma tot ont-branding te brengen. Met de momenteel gebruikte antennes en aannemenddat we door een ≈ 20 cm dikke evanescente laag moeten tunnelen vooraleerde snelle golf propagatief wordt betekent dat dat we voltages van de ordevan 45 kV op de antennestraps zullen moeten verdragen. De TWA is een ele-gante en passende oplossing voor het probleem van de grote te overbruggenafstand en het groot vermogen dat nodig is voor fusie. Het vermogen dateen antenna kan uitstralen is proportioneel met het aantal elementen/bladenwaaruit het systeem is opgebouwd. De TWA laat toe dit vermogen te verdelenover een groot aantal straps. Voor een vooraf opgelegde maximale voltageop de straps laat de TWA op natuurlijke wijze toe meer vermogen uit testralen. Equivalent laat het toe de voltage op individuele straps beduidendte verlagen als een vooropgesteld vermogen in het plasma dient ingekoppeldte worden. In deze thesis zal uitgebreid aan bod komen waarom precies deTWA een geschikte oplossing is om het probleem van de beperkte koppelinghet hoofd te bieden. Aan de rand van een plasma dat toelaat fusie-relevantetemperaturen te bereiken zijn bruuske en aanzienlijke veranderingen van dedichtheid schering en inslag. Het type antenne dat in deze thesis uitgebreidbestudeerd wordt is zal tevens blijken uiterst robust te zijn om het hoofd tebieden aan die - aan de tokamak inherente - plasmainstabiliteiten.
Het idee om een TWA als RF-antenna te gebruiken werd al geöpperd doorhet Amerikaanse DIII-D team in de jaren ’90 van de vorige eeuw. Het conceptwerd in het verleden getest met het oog op "current drive"-toepassingen (hetopwekken van een plasmastroom op niet-inductieve wijze moet toelaten eenreactor continu - in tegenstelling tot gedurende min of meer korte pulsen -te bedrijven, een niet onbelangrijk economische voordeel voor een commer-ciële reactor) bij hoge frequentie in de Japanse JFT-2M-tokamaks. Ook dezogenaamde "helicon"-antennes die voor de studie van golfgedrag bij hogeharmonieken van de ion cyclotronfrequentie gebruikt zijn - meer bepaald inDIII-D (USA) en KSTAR (Korea) - zijn structuren die nauw verwant zijn metde antenna die hier ter studie ligt. De TWA werd echter nooit getest om deverhiing van een ionenminoriteit - ontegensprekelijk momenteel het meestfrequent aangewend verhiingsscenario voor tokamak plasmaś dat gebruikmaakt van elektromagnetische golven en het mechanisme dat allicht in de
vii
CONTENTS
toekomst ook een sleutelrol zal spelen - te verwezenlijken, en dat ondanksde talrijke interessante eigenschappen en potentiële voordelen die de TWAhee ten opzichte van het klassieke antennedesign. Eén van de doelen vanhet hier voorgestelde werk is degelijke wetenschappelijke argumenten aan tevoeren om de discussie omtrent het gebruik van dit type antenna in Europate kunnen voeren. In dit werk wordt een uitgebreide, systematische en nooiteerder verwezenlijkte studie van het TWA-concept aangeboden. Daar waarer hiaten zijn in de literatuur worden die opgevuld. De karakteristieken vande TWA komen uitgebreid aan bod. Deze studie beöogt het aanbieden vanal het nodige materiaal om een conceptuele design te kunnen maken voorhuidige en toekomstige machines, en vergelijkt ook het TWA-concept metzijn klassieke tegenhanger.
Deze studie is geenszins zuiver theoretisch van aard. In het kader van dezethesis is al een stuk experimenteel materiaal beschikbaar. Spijtig genoegtonen die resultaten enkel aan dat de reële antenna werkt zoals de theorie hetvoorspelt in vacuum of in aanwezigheid van een eenvoudig diëlectricum. Omhaar nut te bewijzen voor de fusiegemeenschap moet dit concept ook getestworden in een tokamak, in aanwezigheid van een fusie-relevant plasma. Dezethesis doet het voorbereidende werk voor de twee volgende stappen: (i) Voortoepassing op lange termijn en meer specifiek met het oog op de "demon-stratietokamak" DEMO wordt een ICRF systeem voorgesteld dat gebaseerdis op de TWA-filosofie en dat gebruik maakt van een resonante ring. (ii)Omdat het concept nog niet werd getest in een tokamak die toelaat ionente verhien, is tevens een uitgebreide test nodig op kortere termijn. In dezethesis stellen we met dat doel in gedachten de conceptuele design voor vooreen TWA-systeem specifiek voor de WEST-machine (Cadarache, Frankrijk).De eerste onderhandelingen voor het inbouwen van zulk een antenna indie machine zijn al opgestart maar geen concrete plannen bestaan op ditmoment. Het is de bedoeling in WEST de performantie van de 2 soortenantennes te vergelijken in fusie-relevante omstandigheden. Het is allichtnuig aan te stippen dat het experimenteel testen van plasmaverhiing doormiddel van minoriteitsverhiing in een machine die - net zoals toekomstigereactoren - een metalen reactorvatwand hee door de fusiegemeenschap iserkend als een wetenschappelijk uiterst waardevol experiment. Deze thesishee als opzet een grote stap voorwaarts te maken in de richting van depraktische verwezenlijking van dat doel.
Deze tekst is als volgt opgebouwd:
• In het eerste hoofdstuk worden noodzakelijke elementen van de toka-makfysica - nodig voor het begrijpen van de subtiliteiten van de RFgolysica en de RF engineering in aanwezigheid van een gemagne-
viii
CONTENTS
tiseerd plasma - behandeld. Tevens wordt een ruwe schets gemaakt vanhoe een RF-systeem is opgebouwd. Golfkoppeling en -voortplanting inhet voor fusie relevante milieu van geladen deeltjes wordt bekeken. Erwordt ook uitgelegd welk soort modellen gebruikt wordt om antenneste ontwerpen en beschrijven. Ook hoe matching in zijn werk gaat komtaan bod.
• In het tweede hoofdstuk wordt de theorie waarop de TWA steunt indetail uit de doeken gedaan. De procedure - die op punt werd gezet omhet design en de karakterisatie van de antenne te kunnen doen - wordtgaandeweg ontwikkeld en verklaard. Fundamentele eigenschappenvan structuren die toelaten "reizende" golven op te wekken worden inde verf gezet.
• Vervolgens wordt het principe van de resonante ring theoretisch uit-gelegd. Dit onderdeel van de thesis toont het werkingsprincipe aanwaarop het voeden van de TWA steunt.
• Het bespreken van de experimentele verificatie - aan de hand van eenmeetopstelling op schaal en bij beperkt vermogen - van het systeemmet de TWA en de resonante ring zijn het onderwerp van het volgendehoofdstuk. De werking van alle componenten wordt eerst apart be-licht, vervolgens wordt de assemblage en de werking van het geheelonder de loupe genomen. Om de plasmarespons te simuleren wordteen dielektricum gebruikt.
• De kennis vergaard in de vorige hoofdstukken, wordt dan bijeenge-bracht om een ICRF-installatie gebaseerd op het TWA-concept en ge-bruik makend van de resonante ring voor te stellen voor de toekomstigeDEMO-fusiereactor. Aan de hand van een aantal - theoretisch berek-ende maar van de huidige know-how gebruik makende - plasmaprofie-len wordt de performantie van de aangeboden design onderzocht. Degevoeligheid van het systeem ten aanzien van veranderingen van hetplasma en de koppeling worden in het licht gezet. Kort worden ookaspecten van integratie van de antenne in de machine besproken.
• Een proof-of-principle TWA-systeem wordt vervolgens voorgesteld voorde WEST-machine. Een vergelijking wordt gemaakt met de perfor-mantie van het momenteel reeds geïnstalleerde klassieke systeem. Eendiepere analyse belicht de respons van het RF-systeem op grote veran-deringen van het plasma. Het gedrag van de velden dicht bij de antennewordt kort besproken.
ix

CONTENTS
• Tensloe worden de belangrijkste verwezenlijkingen van dit werk opge-somd in een laatste hoofdstuk.
Dit rapport bevat het hoofdbestanddeel van het werk uitgevoerd teneindeaan de verplichtingen te voldoen die vereist zijn om de graad van Doctor inde Fysische Ingenieurswetenschappen aan de Universiteit van Gent (Gent,België) alsook de graad van Doctor in de Ingenieurswetenschappen aan deKoninklijke Militaire School (Brussel, België) te bekomen.
x
Summary in English
Our industrial society critically depends on the availability of cheap energy.Aer 2 centuries in which burning fossil fuels was the main method adoptedto fulfil this need, economical as well as ecological reasons force mankindto find an alternative base-load energy providing scheme. Controlled ther-monuclear fusion is considered to be a promising candidate in that respect.In view of the fact that it ultimately requires materials that are abundantlyavailable (sea water and lithium), it has the potential to guarantee energywill be available on a large scale for thousands of years to come. A number ofdierent types of experimental fusion reactors relying on magnetic confine-ment exist. They all have 1 key aspect in common: To ensure the plasmas canreach temperatures high enough for spontaneous fusion to set in, an eicientheating scheme is required. Electromagnetic waves that are excited in thelow density, low temperature edge region of such devices but that carry waveenergy to the hot, dense plasma core where they are subsequently absorbed,have proven experimentally to reach that goal.
The subject of this thesis is the study of a relatively new concept of ioncyclotron range of frequency (ICRF) antennas: the travelling wave antenna.As its name says, this type of antenna relies on waves "traveling" along thelaunching structure. It will be shown that this type of wave launcher hassome important advantages compared to the type of antenna that has beenroutinely used. In particular, it turns one of the drawbacks of the classical an-tenna into an asset : In large machines, the distance between the antenna andthe main plasma is inherently large and the waves excited by the launcher areevanescent close to it. To ensure the power can successfully tunnel throughthis evanescence layer and be coupled to the plasma, the electric field ampli-tude close to the launcher needs to be significant, bringing with it the risk forwave-induced ionisation, arcing, spuering and hot spots. Not only does thehere proposed antenna allow to keep the field amplitude much more modest,it actually relies on the distance to the plasma being fairly large to functionoptimally.
Straps of classical antennas are fed independently. The shape of the antenna
xi
CONTENTS
spectrum is determined by the relative phase of the current density on thestraps. Cross-coupling is an issue one wishes to avoid and hence septa areintroduced to physically separate the straps, decoupling the various net-works and ensuring the RF power generators are operated safely. Completelyopposite in design, only one strap of a traveling wave antenna is actively fedand the currents on the other straps are induced by mutual coupling withneighbouring elements; in the ICRF domain the coupling is mostly inductive.Counting on rather than aiming at reducing the interaction between strapsallows using a large number of straps, reducing the wave power density fora given power. It goes without saying that reducing the number of feedingnetworks for the antenna is an extra surplus from the integration point ofview, an aspect on which the TWA clearly beats the more classical system.
Magnetic confinement allows confining extremely hot plasmas, but theconfinement is not without bounds. Since the number of fusion reactionsscales with the volume of the reactor vessel, while the losses unavoidableoccur at the edge, future reactors will most likely be large machines: Theratio of the power produced over the power lost thus scales as the ratio of theplasma volume over plasma surface. So doubling the linear dimension of themachine yields an 8-fold increase of the fusion power but only 4-fold increaseof the surface through which the particles and energy are lost and yields aperformance improvement by a factor of 2. In practice, the performance evenimproves more, e.g. because bigger machines allow higher plasma currentsand hence higher density limits.
The eiciency with which RF power carried by the fast magneto-sonic wavecan be coupled to the plasma heavily depends on the shape of the plasmadensity profile. In particular, the distance to the cut-o location (beyondwhich the fast magneto-sonic wave becomes propagative) is a key parameter.This distance - of the order of a few centimetres in current day devices -will likely be tens of centimetres in future reactors. DEMO, the Europeandemonstration reactor that represents the next-step fusion device, has a mi-nor plasma radius of approximately 3m. Accounting for present-day know-ledge on energy and particle transport, about 50 ÷ 100MW of power willbe necessary to bring DEMO to ignition. To couple that amount of poweracross a ≈ 20 cm gap with a classical antenna would require voltages on theantenna of the order of 45 kV. The TWA is an elegant and suitable solution tocope both with the large antenna/cut-o distance and - connected - the largepower requirement. The power launched by an antenna scales proportionallywith the number of radiating elements. Hence, since a TWA consists of alarge number of radiating elements, it allows more power to be radiated fora given voltage on the strap or - alternatively but equivalently - to operate atless prohibitive voltages. It will be shown in this thesis that a TWA performs
xii

CONTENTS
well in low coupling conditions. Moreover, the antenna is load resilient ina natural way, a necessary characteristic for an eicient ICRF system in afusion device suering from violent and frequent edge density variations asa result of plasma instabilities inherently occurring close to the plasma edgein tokamaks.
The idea of using a TWA as ICRF antenna was already proposed in the ’90by the DIII-D team in US. The concept has been tested in the past for cur-rent drive application at high frequency (driving the plasma current non-inductively is a key need for a steady state reactor as it allows continuous -as opposed to pulsed - operation and hence has clear economical benefits),on the Japanese device JFT-2M, and it is currently subject of studies for highharmonics helicon in DIII-D (US) and KSTAR (Korea). It has - however - neverbeen put to the test for ICRF fast wave minority heating, the wave heatingscheme most likely to be exploited in future machines, in spite of its multipleinteresting properties and potential advantages compared to classical ICRFantenna designs. One aspect of the present work is to provide solid scientificarguments to revive the discussion on this exceedingly promising conceptin Europe. A systematic study of an arbitrary TWA in front of a realisticplasma profile is presented. Gaps in the literature will be filled, allowing theantenna concept to be beer known and its characteristics to be appreciated.The study allows performing conceptual designs for present day and futuremachines.
The present study is not intended to be purely theoretical. As will be shown,experimental evidence has already been gathered. Unfortunately, to dateonly measurements are available stating that the real antenna behaves aspredicted in vacuum or in front of a dielectric. To prove its potential inan actual fusion-relevant environment, the concept needs to be put to thetest facing a tokamak plasma. The here presented work prepares for futureexploitation on 2 fronts: (i) For application in the long-run, a proposal for aICRF system based on the TWA concept fed by an external resonant ring fora future fusion reactor as DEMO is made. (ii) Because the TWA concept hasnever been tested before for ion heating in a tokamak environment, a near-term test in a currently existing machine is needed to confirm the modellingprocedure and to demonstrate the expected performance of the TWA. Thisthesis presents a conceptual design of a TWA system for the WEST device(Cadarache, France), negotiations for which have been initiated although noconcrete plans exist yet. An experimental verification of the performanceof the new system would allow comparing the TWA with a classical design,underlining its potential for the future reactor DEMO. Beside that, a testof the TWA concept for fast wave minority heating at high power level ina metallic wall machine has been recognised as scientifically valuable by
xiii
CONTENTS
the fusion community. The work presented here is a solid first step in thatdirection.
The work is presented here with the following structure:
• A first chapter explains briefly the general background on tokamakphysics, necessary to be able to grasp the subtleties of wave physicsand engineering in the RF domain for waves launched into in a mag-netised plasma. The text sketches what an ICRF system is composedof, and how wave coupling and propagation in electrically conducting,magnetised gases can be modeled and understood. An introductionwill also be provided on which models are minimally required andused to allow designing and realistically modelling antennas as wellas matching networks.
• In the second chapter the theory of the TWA is described in detail.The procedure developed to design and characterise the antenna isderived. The fundamental characteristics of the travelling wave arraysare highlighted.
• Subsequently the resonant ring feeding scheme is presented theoreti-cally. The analysis shows the working principle and the technique usedto exploit the unique property of the resonant ring as feeding networkfor the TWA.
• This is followed by an experimental verification, on a testbed, of theantenna itself and of the antenna with the resonant ring as feedingscheme. All the components are characterised separately and assem-bled to obtain a mock-up of a complete TWA in an external resonantring system that is characterised using an equivalent dielectric to sim-ulate the plasma response.
• Based on the theory explained in the previous chapters, a system basedon the TWA and the resonant ring is proposed for the ICRF heating ofa future reactor like DEMO. The performance of such system is com-puted for dierent plasma profiles and the sensitivity of the system toload variations is highlighted. Some aspects like integration in DEMOare briefly discussed.
• A proof-of-principle system for the WEST device is then proposed andcompared to the classical design currently used in the machine. Moreanalysis is performed to assess the load resilience capability of theTWA. The near field behaviour of the TWA is briefly discussed.
xiv

CONTENTS
• Finally, the key points of the work are discussed in the concludingchapter.
This report contains the main part of the work carried out in partial fulfilmentof the requirements for the doctoral degree in Engineering Physics at GhentUniversity (Gent, BE) and for the doctoral degree in Engineering Science atRoyal Military Academy ERM/KMS (Brussels, BE).
xv


List of Abbreviations
ctu continuity.
CW continuous wave.
EM electromgnetic.
FEM finite element method.
FMW fast magneto-sonic wave.
HFS high field side.
HFSS high frequency signals simulator.
ICA ion cyclotron antenna.
ICRF ion cyclotron range (of) frequency.
ICRH ion cyclotron resonance heating.
LAD linear averaged density.
lcms last closed magnetic surface.
LFS low field side.
PEC perfect electric conductor.
PML perfectly matched layer.
RAMI reliability availability maintainability inspectability.
RDL resonant double loop.
xvii

List of Abbreviations
RF radio frequency.
SMW slow magneto-sonic wave.
SOL scrape-o layer.
TE/z transverse electric with respect to z-direction.
TL transmission line.
TM/z transverse magnetic with respect to z-direction.
TWA travelling wave array/antenna.
VCCC variable coupling coeicient coupler.
VNA vector network analyser.
VSWR voltage standing wave ratio.
xviii

Chapter 1
Background
The world’s population is expected to grow to 9 billion by 2040, driving globaldemand for electricity up by 45% [1]. Meeting this demand with the tech-nologies available today will require that fossil fuels remain a primary meansof electricity generation. Our industrial society critically depends on theavailability of cheap energy. To sustain economic growth while at the sametime overcoming climate change, we need to develop sources of energy thatare emission-free, safe, globally available and economically viable. It is widelybelieved that renewables alone will suice. If Europe wants to become freefrom burning and importing fossil fuels, several important aspects like highpower consumption per capita, high population density, energy indepen-dence (large fraction of consumed energy is currently imported), somewhatlimited availability of land area to be dedicated to renewables needs to beaddressed. Renewables will certainly become more and more important inthe world and in Europe, but most of them suer from the serious problemof being intermient and non-controllable. As far as today, despite dierentstorage solutions are proposed, economical and political arguments makequestionable the possibility of relying only on renewables technologies tomeet the present "human needs". Fusion has the unique capability to provideutility-scale energy on-demand wherever it is needed, making it an excellentcomplement for intermient renewables and baery storage. Combined,these technologies make for a practical energy portfolio that mitigates cli-mate change while driving economic prosperity.
1.1 Thermonuclear Fusion
Nuclear fusion is the reaction in which two or more atomic nuclei come closeenough together to form one or more dierent atomic nuclei and subatomic
1

Thermonuclear Fusion
particles. The energy released by the fusion reaction comes from the dier-ence in mass between the reactants and the products. This energy releaserepresent a possible valuable source of energy for our future generations.
• Fusion is safe. A fusion reactor is intrinsically safe. A runaway nuclearchain reaction cannot take place, under any circumstance. No highlyradioactive and long-living byproducts are created. The radioactivematerial used in a fusion reactors has a half-life orders of magnitudelower than in their fission counterparts. All waste will be recyclable orreusable within 100 years.
• Fusion has low carbon footprint. Fusion produces zero greenhouse gasemissions, emiing only helium as exhaust, an inert non-toxic gas. Italso requires less land than other renewable technologies.
• Fusion is sustainable and abundant. Fusion fuel are widely availableand nearly inexhaustible. There is enough fusion fuel to power theplanet for hundreds of millions of years. A fusion power plant runs ondeuterium and tritium, isotopes which can be extracted from seawa-ter and derived from lithium. Fusing atoms together in a controlledway releases nearly four millions times more energy than a chemicalreaction. Fusion could potentially provide the base-load energy for oursociety.
• Fusion is on-demand. Fusion can produce energy on-demand, and isnot aected by weather. Because it is also safe and produces no pollu-tion, a fusion power plant can be located close to where it is required.
The interested reader could find valuable material in [2–5].
Thermonuclear fusion is the process that allows obtaining nuclear fusion bymeans of very high temperatures of the nuclear fuel. At extreme tempera-tures, electrons are separated from nuclei forming a plasma - an ionised gas.This fourth state of maer was firstly identified by Sir William Crookes in1879 [6] and subsequently called plasma, an ancient greek word meaning"jelly" [7], by Irving Langmuir in 1928 [8]. Plasmas may have dierent be-haviours depending on the environment in which they are created. Examplesof a plasma are an unexpected lightning before a thunderstorm, a neon signin front of a cozy restaurant, an astonishing Aurora over the the Earth’s polesjust to cite some. Fusion plasmas provide the environment in which lightelements can fuse and yield energy. An example of a nuclear fusion reactor isthe Sun! To achieve fusion in a laboratory, three conditions must be fulfilled:very high temperatures, enough plasma density and suicient confinement
2

Background
time. Very high temperatures are needed to provoke high energy collisionsbetween the particles such that the fusion reaction can take place. High den-sities are needed to increase the likelihood that those high energy collisionsdo occur. Long confinement times are needed to hold the plasma together forprofiting from the energy yield. Among many, the most promising nuclearreaction to be used to produce energy on our planet is the D + T→ 4He + ndue to its favourable cross section and a large amount of energy released: aDeuterium nucleus fuses with a Tritium nucleus producing an alpha particlewith an energy of 3.5MeV and a neutron with a n energy of 14.1MeV.
To achieve fusion on Earth, in a controlled way, dierent technologies havebeen developed in its long history [9, 10]. Among them the tokamak hasbeen developed more than the others technologies. It is a device that usesmagnetic fields to contain and control the high temperature plasma fuel.
3
Tokamak
1.2 Tokamak
The tokamak is magnetic confining device for plasmas. Ionised particles,the components of a plasma, are charged particles; they can be manipulatedby means of magnetic or electric fields. In case of magnetic fields, chargedparticles, under the eect of the Lorentz force, will spiral around the linesof force. Their trajectory will then be an helix and the angular frequency ofthe helical motion is called gyro-frequency. Particles moving around the filedlines may collide and fuse provided they have enough energy (temperature)and that the field lines are close enough to each others. A solenoid, an helicalcoil tightly wounded, could provide this type of fields with parallel lines offorce along its axis. This will prevent particles to run away perpendicularlyfrom the axis; but does not prevent particles from escaping at the end ofsuch device. The natural solution to the escaping problem, is to wound thesolenoids in order to join the two ends thus creating a toroidal structure. Par-ticles will then circles on the closed field lines endlessly [11]. Unfortunatelythis will produce a gradient of the confining field that produces a dri ofthe particles, that depends on their charge, resulting in a force that dragsthe plasma out of the confinement region [12]. The solution is to providean helical magnetic field such that particles will average out the eect ofthe gradient of the magnetic field. The supplementary magnetic field is ob-tained by inducing a current in the plasma, which is a fairly good conductor[13]. Once confined, the particles need to be heated up to fusion relevanttemperatures. Among dierent systems [14], RF waves in the ion cyclotronrange of frequencies have been used since the outset and are nowadays awell-established technique. This is the context of the thesis.
4
Background
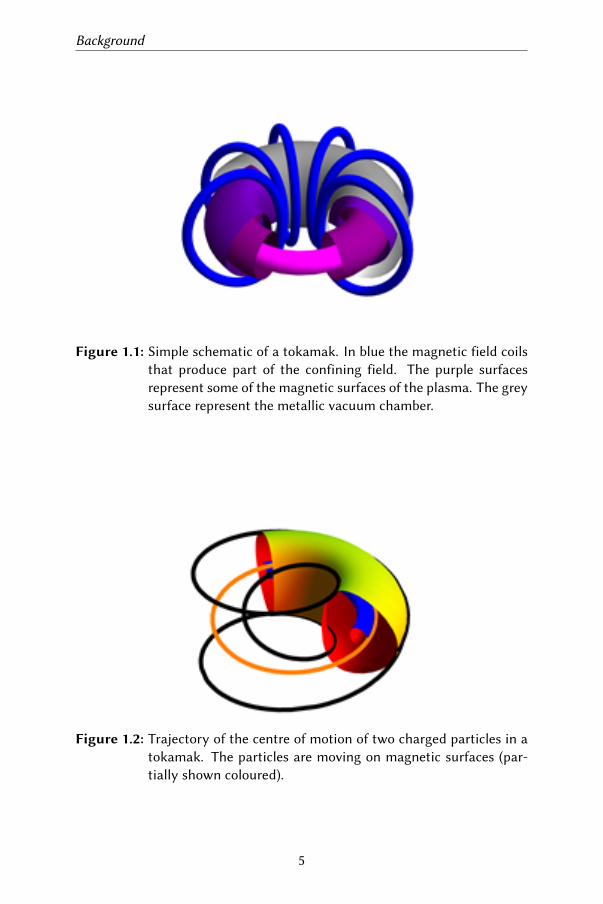
Figure 1.1: Simple schematic of a tokamak. In blue the magnetic field coilsthat produce part of the confining field. The purple surfacesrepresent some of the magnetic surfaces of the plasma. The greysurface represent the metallic vacuum chamber.
Figure 1.2: Trajectory of the centre of motion of two charged particles in atokamak. The particles are moving on magnetic surfaces (par-tially shown coloured).
5

ICRF System
1.3 ICRF System
Ion cyclotron resonance heating (ICRH) consists essentially in launching ra-diofrequency (RF) waves with frequencies equal to the cyclotron frequencyof one of the ion species of the plasma or harmonics thereof. A particularadvantage of ICRH is the absence of a high-density cut-o, thus allowingcentral heating of high density plasmas in tokamaks and stellarators.
The Ion Cyclotron Resonance Frequency system has the aim of producing anamount of RF power, transporting it inside the tokamak vessel and injectingit into the plasma edge in a way such that a plasma natural mode will beexcited leading to absorption of the energy and subsequent transfer of thewave energy to the plasma particles. The energy is transferred to the ions byresonant wave-particle interactions [15]. The power level of Ion cyclotronresonance heating (ICRH) system is of the order of several MW and thefrequency range depends on the confining magnetic field and the plasmacomposition, as it will be shown in the next section.
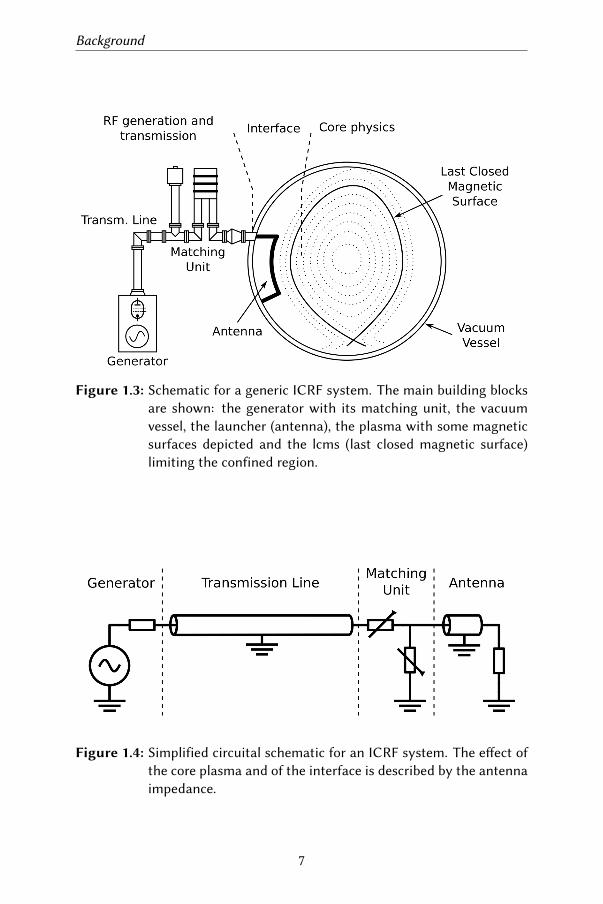
The complexity of an ICRF system could be boiled down into two main cat-egories and one interface. On one side there is a technology part that dealswith the generation of the RF power and its transport into the vacuum vesselof the confining machine. On the other side there is a physics part thatdeals with the characterisation of the natural modes of the plasma and theabsorption mechanisms. In the middle between the two sides, there is aninterface which deals with aspects from both sides. This interface is thedevice that couples the RF power to the plasma edge: the ICRF launcher,alternatively called antenna. Those three blocks are represented in figure1.3 where an example of how an ICRF system cloud look like is illustrated.The antenna is one of the building blocks of an ICRF system. The others arethe RF generator, the transmission line and the matching unit. A simplifiedschematic is shown in figure 1.4.
The two main dierent aspects, core physics and RF engineering, can betreated separately up to some extent. In fact, both are mutually influenced.From the point of view of the RF engineer, the antenna could be treated asan impedance with some particular characteristics. It is then possible to usethe appropriate strategy to match this impedance to the output impedanceof the generator to maximise the power delivered to the antenna. It maylook like a simple task, however due to the design constrains of a tokamakenvironment and to the presence of a rebel plasma, it has been an eort forthe IC community to find ingenious solutions in line with the technologicaland scientific progress in the long history of plasma physics research on toka-mak devices. From the point of view of the plasma physicist, exploring wavespropagation into a magnetised plasma, an ICRF system is a valuable tool to
6
Background
Figure 1.3: Schematic for a generic ICRF system. The main building blocksare shown: the generator with its matching unit, the vacuumvessel, the launcher (antenna), the plasma with some magneticsurfaces depicted and the lcms (last closed magnetic surface)limiting the confined region.
Figure 1.4: Simplified circuital schematic for an ICRF system. The eect ofthe core plasma and of the interface is described by the antennaimpedance.
7

ICRF System
perform research, with the antenna seen mostly as a idealised current thatexcites an electromagnetic field capable of coupling RF power to the plasmaat the given frequency with the proper wave vector of interest. But the ICRFantenna is the natural interface between this two worlds; it presents somechallenges both form the pure RF engineering point of view (best modellingstrategy, control of the current distribution amplitude and phase, radiationproperties) both from the pure plasma physics point of view (eect of theplasma density profile on the current distribution, coupling properties, , nearfield interaction in the plasma edge). In what follows, an overview of thewave propagation, power coupling and power absorption in the ion cyclotronrange of frequency is given, for a good understanding of the later chapters.
8
Background
1.4 Dispersion relation
The dierential equation for the waves which can be excited in the ion cy-clotron range of frequencies (ICRF) are obtained from Maxwell‘s equationsand the plasma permiivity tensor K [14, 16, 17]. The plasma angular fre-quency for electrons and ions is
ωpe =
√neq2
ε0meωpi =
√niZ2q2
ε0Amp(1.1)
where ne and ni are respectively the electron and ion densities, me and mp
are respectively the electron and proton masses, q is the elementary charge,ε0 is the permiivity of vacuum, A the mass number of the ion and Z itsatomic number.The cyclotron angular frequency for electrons and ions is:
ωce = −qB0
meωci =
ZqB0
Amp(1.2)
Following Stix [16], in the rotating frame of reference (u+, u−, uz), withu± = (ux ± uy)/
√2, the plasma dielectric tensor has the following form
Kcircular =
R 0 00 L 00 0 P
(1.3)
where R is the right-hand polarised component, L is the le-hand polarisedcomponent and P is the plasma component defined as
R = 1−ω2
pe
ω(ω + ωce)−
N∑s=1
ω2pi,s
ω(ω + ωci,s)(1.4)
L = 1−ω2
pe
ω(ω − ωce)−
N∑s=1
ω2pi,s
ω(ω − ωci,s)(1.5)
P = 1−ω2
pe
ω2−
N∑s=1
ω2pi,s
ω2(1.6)
It is possible to express the plasma dielectric tensor in the cartesian frame ofreference with the following transformation
Kcartesian = U Kcircular U† (1.7)
9
Dispersion relation
U =1√2
1 1 0i −i 0
0 0√
2
(1.8)
where U† is the Hermitian conjugate of U. The plasma dielectric tensor canbe then expressed as
Kcartesian =
S −iD 0iD S 00 0 P
(1.9)
with the sum element S and the dierence element D defined as
S =R+ L
2D =
R− L2
(1.10)
The wave equation can be wrien as follows
k × k ×E + k20K ·E = 0 (1.11)
and for a background magnetic fieldB0 in the z-direction the wave equationcan be rewrien asS − p2 −iD pq
iD S − (p2 + q2) 0pq 0 P − q2
ExEyEz
= 0 (1.12)
with p = k‖/k0 and q = k⊥/k0, where k‖ and k⊥ are respectively thecomponent of the wave vector parallel and perpendicular toB0, k2
⊥ = k2x+k2
y .Equation 1.12 has non-trivial solution only if the determinant of the 3x3matrix is null which gives a fourth order equation in k⊥
Ak4⊥ + Bk2
⊥ + C = 0
with
A = S
B = k2‖(P + S)− k2
0(S2 −D2 + PS)
C = Pk20(S2 −D2) + k4
‖ − 2S(k0k‖)2
(1.13)
for which the solutions are
k2⊥,1 =
−B +√B2 − 4AC
2A(1.14)
k2⊥,2 =
−B−√B2 − 4AC
2A(1.15)
10
Background
The value of P is usually much bigger than the value of both S andD, due tothe mass dierence between electrons and ions. It is possible to derive fromthe two solutions (equations 1.14, 1.15) two separate decoupled roots whenB2 4AC. Those roots are the Fast Magnetosonic Wave (FMW)
k2⊥,FMW =
(k20S − k2
‖)2 − (k2
0D)2
k20S − k2
‖=
(k20R− k2
‖)(k20L− k2
‖)
k20S − k2
‖(1.16)
and the Slow Magnetosonic Wave (SMW)
k2⊥,SMW =
P (k20S − k2
‖)
S(1.17)
Usually this two waves are decoupled because the magnitude of their wavevectors is (except at very low density) more than an oder of magnitude dif-ferent. Equation 1.16 could also be wrien for the refractive index n = kc/ωas
n2⊥,FMW =
(R− n2‖)(L− n
2‖)
S − n2‖
(1.18)
where n⊥ and n‖ are respectively the component perpendicular and parallelto the magnetic field. In the same way, equation 1.17 can be expressed as
n2⊥,SMW =
P (S − n2‖)
S(1.19)
Equation 1.18 shows a singularity when n2‖ = S [18]. Near this point, con-
fluences between the two modes (FMW and SMW) with power transfer fromone mode to the other can occur [19]. This phenomenon is called modeconversion (MC) [20, 21]. Equation 1.18 shows also the existence of two cut-o layers, the R-cut-o and the L-cut-o, that correspond to the conditionsn2‖ = R and n2
‖ = L, respectively. Those cut-os represents boundariesbetween regions of wave propagation and wave evanescence. The cut-odensity nco,R and nco,L are the plasma densities at which those cut-oscorresponds and are function of the plasma parameters and of the frequencyand k‖ of the injected waves.
To compute the position of the cyclotron resonance layer in a given plasma, itis useful to write down the equation for the cyclotron resonant frequency fora given value of the magnetic field B0. Considering the typical behaviour ofthe toroidal magnetic field in a tokamak as a function of the radius: B(r) =B0R0/r. The cyclotron frequency of equation 1.2, can then be expressedtaking into account this dependency of the magnetic field on the radius as
fres(r) = NZq
2πAmp
B0R0
r=
15.225B0NZ
A(1 + x/R0)[MHz] (1.20)
11
Dispersion relation
where q/2πmp ≈ 15.225× 10⁶ Ckg−1, N is the harmonic number and x isthe distance from the central axis (i.e. R0). Rewriting the previous formulaallows to express in a convenient way the position of the resonance layer fora given species, magnetic field, frequency and harmonic number as
R0 + xres =15.225B0ZNR0
Af(1.21)
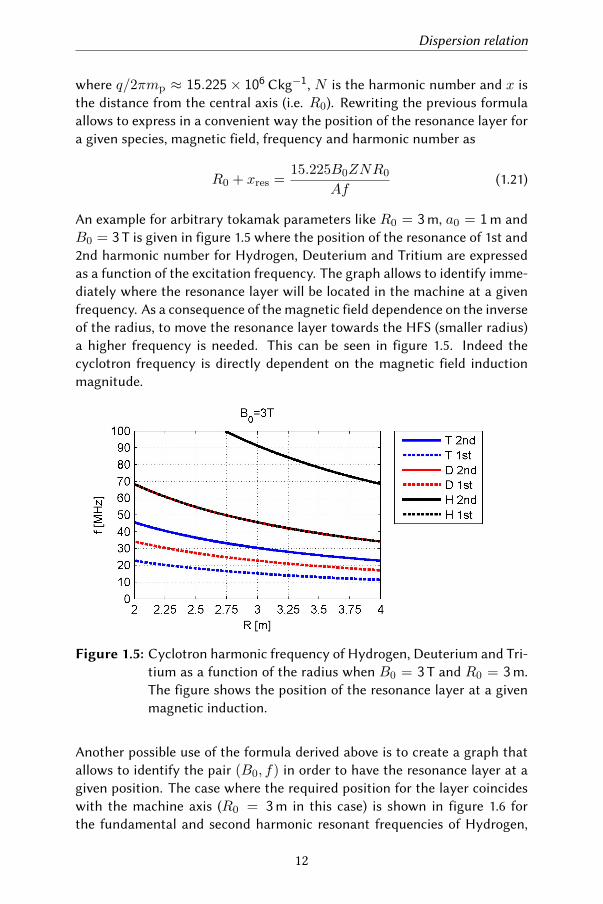
An example for arbitrary tokamak parameters like R0 = 3m, a0 = 1m andB0 = 3 T is given in figure 1.5 where the position of the resonance of 1st and2nd harmonic number for Hydrogen, Deuterium and Tritium are expressedas a function of the excitation frequency. The graph allows to identify imme-diately where the resonance layer will be located in the machine at a givenfrequency. As a consequence of the magnetic field dependence on the inverseof the radius, to move the resonance layer towards the HFS (smaller radius)a higher frequency is needed. This can be seen in figure 1.5. Indeed thecyclotron frequency is directly dependent on the magnetic field inductionmagnitude.
Figure 1.5: Cyclotron harmonic frequency of Hydrogen, Deuterium and Tri-tium as a function of the radius when B0 = 3 T and R0 = 3m.The figure shows the position of the resonance layer at a givenmagnetic induction.
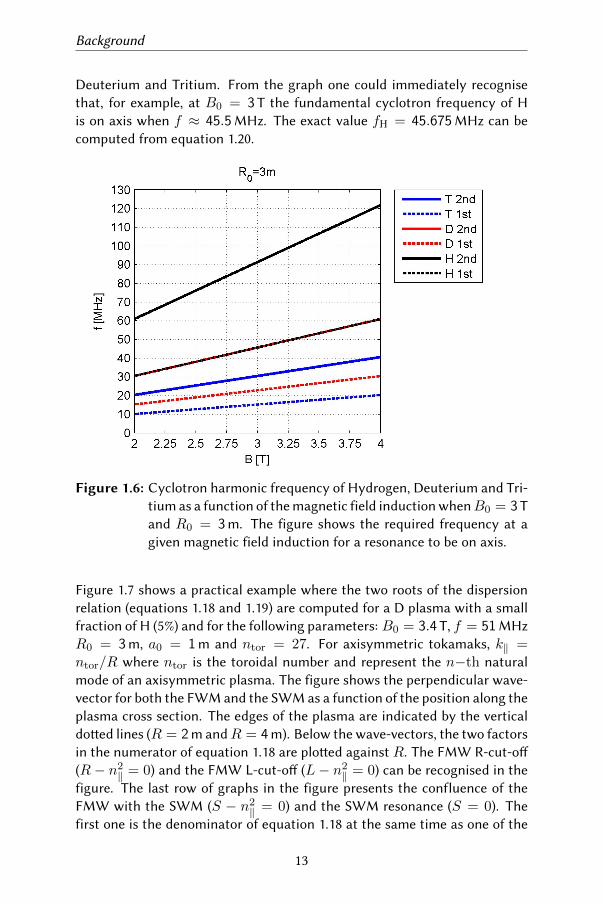
Another possible use of the formula derived above is to create a graph thatallows to identify the pair (B0, f) in order to have the resonance layer at agiven position. The case where the required position for the layer coincideswith the machine axis (R0 = 3m in this case) is shown in figure 1.6 forthe fundamental and second harmonic resonant frequencies of Hydrogen,
12
Background
Deuterium and Tritium. From the graph one could immediately recognisethat, for example, at B0 = 3 T the fundamental cyclotron frequency of His on axis when f ≈ 45.5MHz. The exact value fH = 45.675MHz can becomputed from equation 1.20.
Figure 1.6: Cyclotron harmonic frequency of Hydrogen, Deuterium and Tri-tium as a function of the magnetic field induction whenB0 = 3 Tand R0 = 3m. The figure shows the required frequency at agiven magnetic field induction for a resonance to be on axis.
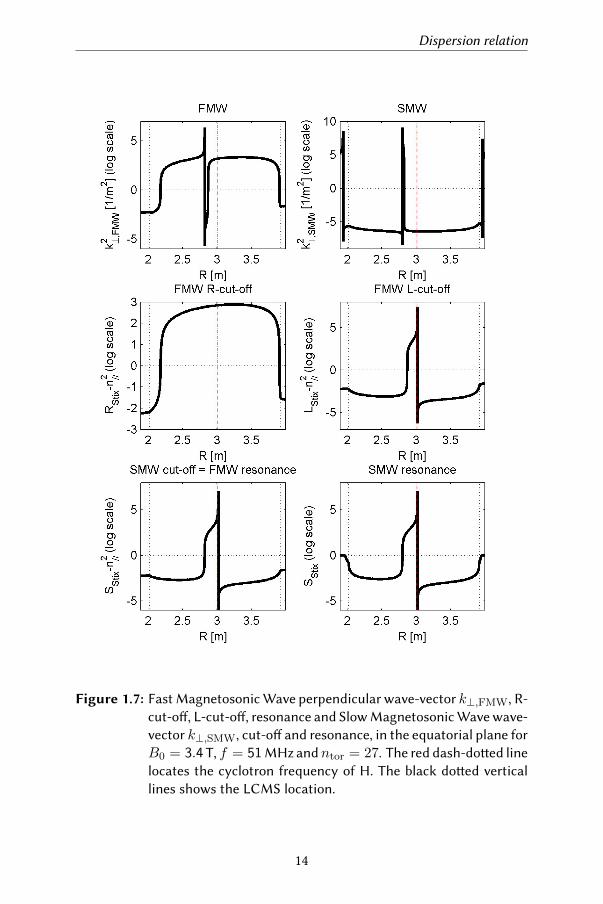
Figure 1.7 shows a practical example where the two roots of the dispersionrelation (equations 1.18 and 1.19) are computed for a D plasma with a smallfraction of H (5%) and for the following parameters: B0 = 3.4 T, f = 51MHzR0 = 3m, a0 = 1m and ntor = 27. For axisymmetric tokamaks, k‖ =ntor/R where ntor is the toroidal number and represent the n−th naturalmode of an axisymmetric plasma. The figure shows the perpendicular wave-vector for both the FWM and the SWM as a function of the position along theplasma cross section. The edges of the plasma are indicated by the verticaldoed lines (R = 2m andR = 4m). Below the wave-vectors, the two factorsin the numerator of equation 1.18 are ploed against R. The FMW R-cut-o(R− n2
‖ = 0) and the FMW L-cut-o (L− n2‖ = 0) can be recognised in the
figure. The last row of graphs in the figure presents the confluence of theFMW with the SWM (S − n2
‖ = 0) and the SWM resonance (S = 0). Thefirst one is the denominator of equation 1.18 at the same time as one of the
13
Dispersion relation
Figure 1.7: Fast Magnetosonic Wave perpendicular wave-vector k⊥,FMW, R-cut-o, L-cut-o, resonance and Slow Magnetosonic Wave wave-vector k⊥,SMW, cut-o and resonance, in the equatorial plane forB0 = 3.4 T, f = 51MHz andntor = 27. The red dash-doed linelocates the cyclotron frequency of H. The black doed verticallines shows the LCMS location.
14
Background
factors in the numerator of equation 1.19.
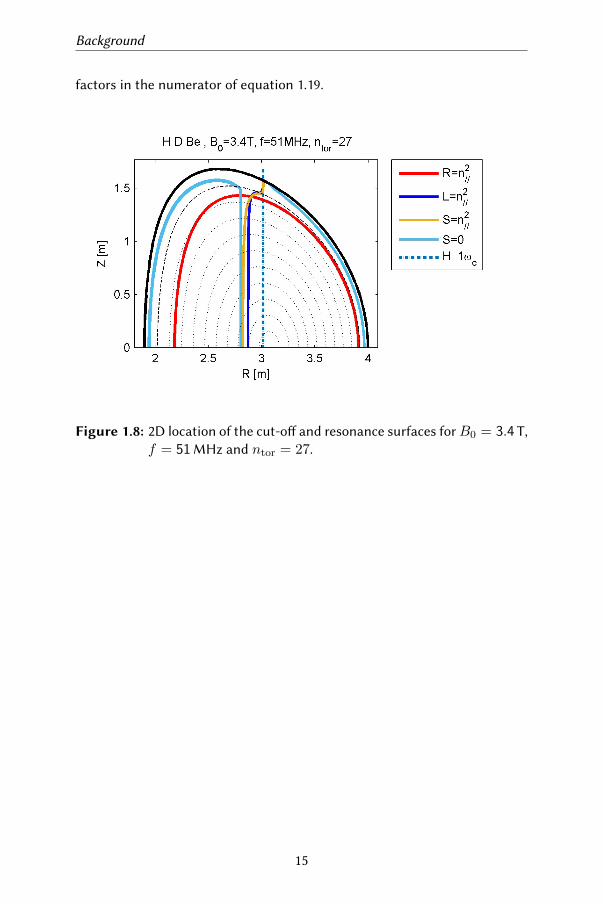
Figure 1.8: 2D location of the cut-o and resonance surfaces forB0 = 3.4 T,f = 51MHz and ntor = 27.
15
ICRF scenarios
1.5 ICRF scenarios
Minority
A minority heating regime [15, 22] occurs when the FMW (fast magnetosonicwave) energy is absorbed mainly at the ion cyclotron resonance layer by aminority ion specie. The minority ion cyclotron resonance condition can bewrien as
ω −Nωc,i − k‖v‖ = 0 (1.22)
where ω = 2πf is the ICRF angular frequency, ωc,i is the minority ioncyclotron angular frequency,N is the harmonic number and v‖ is the parallelcomponent of the minority ion velocity. The FMW absorption results in theformation of a tail in the minority ion distribution function, i.e. a high energypopulation. The heating of the background ions and electrons takes place onthe rather long time scale of the fast minority ions collisional slowing-downtime. When the energy of the fast minority ions is above a certain criticalenergy Ec, the fast ions predominantly heat electrons by collisions, whereasin the opposite case it is obtained mainly ion heating [23, 24]. In standardscenarios with the Zmin/Amin > Zmaj/Amaj, the ion-ion layer is located onthe high field side (HFS) of the minority ion cyclotron resonance layer. Inthis case, the FMW launched from low field side (LFS) antennas encountersthe minority ion cyclotron resonance layer first. Minority Heating is themain heating scenario. When the minority concentration exceeds a criticalvalue, the fast wave electric field component E+, which rotates in the samedirection as the minority ions, is significantly reduced at the minority layer.Consequently, as the single-pass minority damping decreases significantly,a larger fraction of the FMW can be mode-converted at the ion-ion layer.
Mode Conversion
The Mode Conversion [20–22] regime occurs when the incoming FMW ef-ficiently tunnels through the thin evanescence layer between the L-cut-oand the ion-ion hybrid layer. Considering a finite temperature plasma, theFMW can be mode converted to hot plasma waves near the ion-ion layer. De-pending on the plasma properties and on the relative importance of temper-ature and poloidal field eects, these short wavelength waves can be kineticAlfvén waves, ion Bernstein waves (IBW) or electromagnetic ion cyclotronwaves (ICW). But all of them have a common characteristic: they are stronglydamped on electrons by electron landau damping (ELD) because of the strongup- or down-shi of n‖ due to the presence of a finite poloidal magnetic field.
16
Background
1.6 Simplest wave coupling model.
A simple model to get a feeling of the coupling of electromagnetic wavesto anisotropic plasma could be wrien as follows. The problem is reducedto 1D considering it homogeneous in the other two directions. No curvatureeects are considered (plasma slab approximation) and the x-direction corre-sponds to the radial direction in the tokamak geometry. The FMW is a wavethat propagate across the magnetic field lines, thus in the radial direction.The antenna is modelled as a current sheath, with an appropriate boundarycondition, and lies between a wall and a plasma core where no reflection ofthe waves is assumed (i.e. imposed by the boundary condition). The maincharacteristics of the FMW coupling could be investigated by this simplemodel.
The The simplest possible analytical solution of the FMW-only-like waveequation for the electric field poloidal component E(x) is
d2E
dx2(x) + k2(x)E(x) = 0 (1.23)
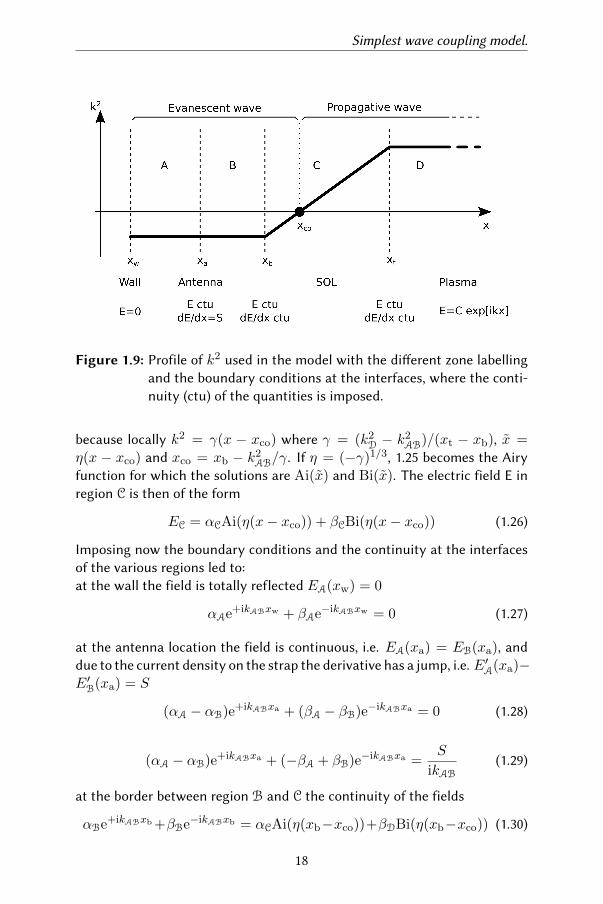
where k is the FMW dispersion equation root perpendicular to the back-ground magnetic field. The time dependence convention is exp(−iωt). With-out loss of generality, k2 could be taken constant between the antenna andthe scrape-o-layer, linear in the scrape-o-layer, and constant again at thetop of the pedestal. The k2 profile is shown in figure 1.9 with the dierentsolution regions and the relative boundary conditions at the interfaces.
There is a metal wall at xw and an antenna at xa siing on the interfacebetween region A and B, at a distance xa − xw from the metallic wall. TheSOL is described for xb < x < xt and for x > xt an homogeneous plasmais considered where the wave is imposed to propagate away without anyreflection. The solution is computed for each one of the four regions. Thedomain could also be divided in two main parts: an evanescent zone and apropagative zone. The boundary is the location of the cut-o, i.e. the pointwhere k2 = 0. In region A the solution have the form
EA = αAe+ikABx + βAe−ikABx (1.24)
with a purely evanescent dispersion equation root kAB = i|kAB|. The fieldin region B has the same form.In region C the wave equation could be rewrien as
η2 d2E
dx2(x) +
γ
ηxE(x) = 0 (1.25)
17
Simplest wave coupling model.
Figure 1.9: Profile of k2 used in the model with the dierent zone labellingand the boundary conditions at the interfaces, where the conti-nuity (ctu) of the quantities is imposed.
because locally k2 = γ(x − xco) where γ = (k2D − k2
AB)/(xt − xb), x =η(x − xco) and xco = xb − k2
AB/γ. If η = (−γ)1/3, 1.25 becomes the Airyfunction for which the solutions are Ai(x) and Bi(x). The electric field E inregion C is then of the form
EC = αCAi(η(x− xco)) + βCBi(η(x− xco)) (1.26)
Imposing now the boundary conditions and the continuity at the interfacesof the various regions led to:at the wall the field is totally reflected EA(xw) = 0
αAe+ikABxw + βAe−ikABxw = 0 (1.27)
at the antenna location the field is continuous, i.e. EA(xa) = EB(xa), anddue to the current density on the strap the derivative has a jump, i.e. E′A(xa)−E′B(xa) = S
(αA − αB)e+ikABxa + (βA − βB)e−ikABxa = 0 (1.28)
(αA − αB)e+ikABxa + (−βA + βB)e−ikABxa =S
ikAB
(1.29)
at the border between region B and C the continuity of the fields
αBe+ikABxb +βBe−ikABxb = αCAi(η(xb−xco))+βDBi(η(xb−xco)) (1.30)
18
Background
and the continuity of the derivatives, involving the derivative of the Airyfunctions w.r.t x
ikAB
[αBe+ikABxb − βCe−ikABxb
]=
η[αCAi′(η(xb − xco)) + βCBi′(η(xb − xco))
] (1.31)
at the border between region C and D the continuity of the fields and of thederivatives
αCAi(η(xt − xco)) + βCBi(η(xt − xco)) = αDe+ikDxt + βDe−ikDxt (1.32)
η[αCAi′(η(xb − xco)) + βCBi′(η(xb − xco))
]=
ikD
[αDe+ikDxt − βDe−ikDxt
] (1.33)
at regionD the waves are imposed to propagate away in the plasma requiringβD = 0.
A didactic example could be made considering the following parameters:xw = 0, xa = 0.1m, xb = 0.2m, xt = 0.3m, k2
AB = −35m−2 (k2 ≈k2
0−k2// for a k// ≈ 6m−1), k2
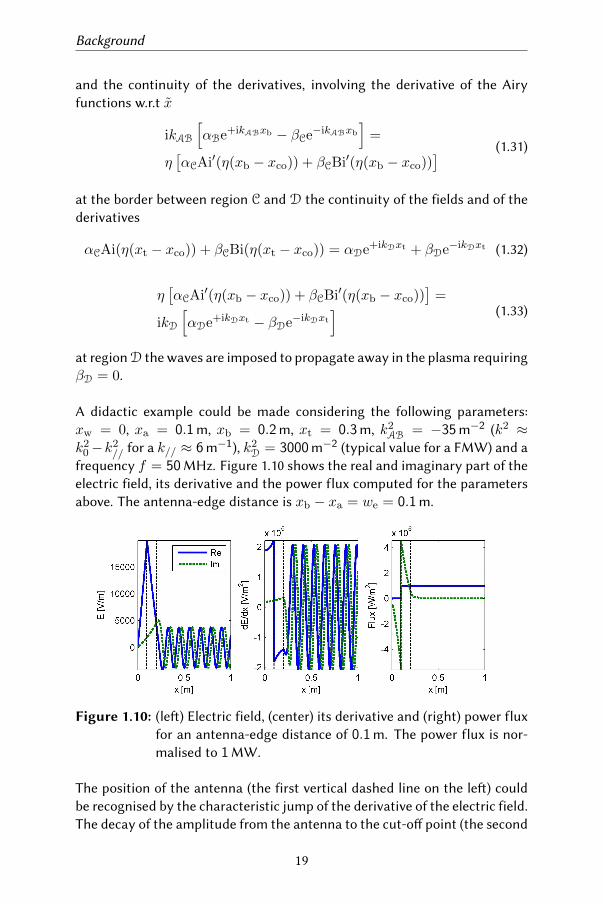
D = 3000m−2 (typical value for a FMW) and afrequency f = 50MHz. Figure 1.10 shows the real and imaginary part of theelectric field, its derivative and the power flux computed for the parametersabove. The antenna-edge distance is xb − xa = we = 0.1m.
Figure 1.10: (le) Electric field, (center) its derivative and (right) power fluxfor an antenna-edge distance of 0.1m. The power flux is nor-malised to 1MW.
The position of the antenna (the first vertical dashed line on the le) couldbe recognised by the characteristic jump of the derivative of the electric field.The decay of the amplitude from the antenna to the cut-o point (the second
19
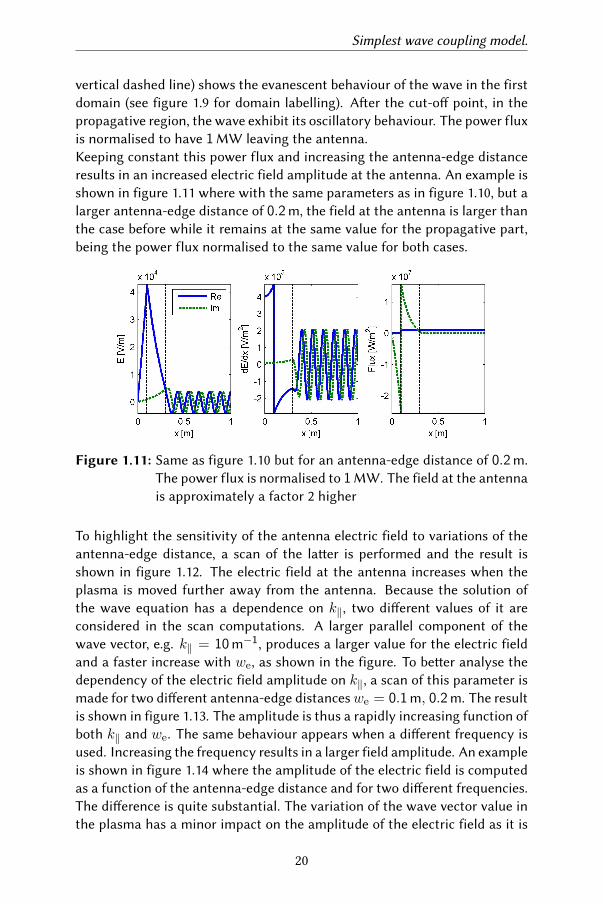
Simplest wave coupling model.
vertical dashed line) shows the evanescent behaviour of the wave in the firstdomain (see figure 1.9 for domain labelling). Aer the cut-o point, in thepropagative region, the wave exhibit its oscillatory behaviour. The power fluxis normalised to have 1MW leaving the antenna.Keeping constant this power flux and increasing the antenna-edge distanceresults in an increased electric field amplitude at the antenna. An example isshown in figure 1.11 where with the same parameters as in figure 1.10, but alarger antenna-edge distance of 0.2m, the field at the antenna is larger thanthe case before while it remains at the same value for the propagative part,being the power flux normalised to the same value for both cases.
Figure 1.11: Same as figure 1.10 but for an antenna-edge distance of 0.2m.The power flux is normalised to 1MW. The field at the antennais approximately a factor 2 higher
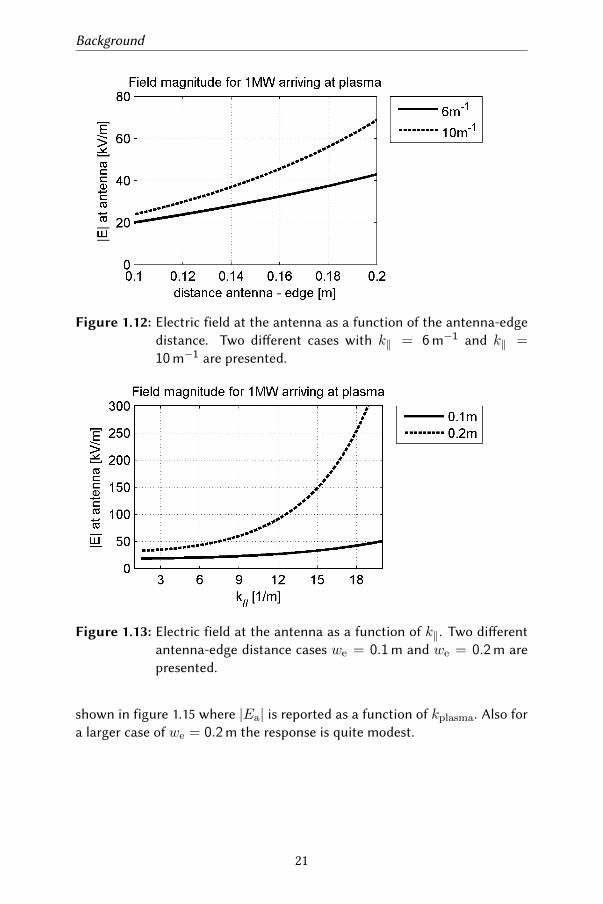
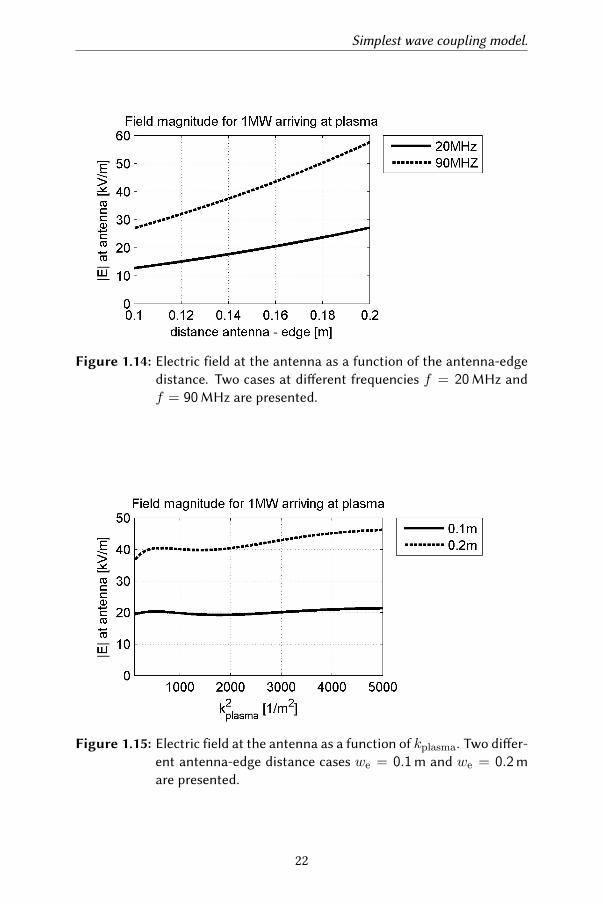
To highlight the sensitivity of the antenna electric field to variations of theantenna-edge distance, a scan of the laer is performed and the result isshown in figure 1.12. The electric field at the antenna increases when theplasma is moved further away from the antenna. Because the solution ofthe wave equation has a dependence on k‖, two dierent values of it areconsidered in the scan computations. A larger parallel component of thewave vector, e.g. k‖ = 10m−1, produces a larger value for the electric fieldand a faster increase with we, as shown in the figure. To beer analyse thedependency of the electric field amplitude on k‖, a scan of this parameter ismade for two dierent antenna-edge distanceswe = 0.1m, 0.2m. The resultis shown in figure 1.13. The amplitude is thus a rapidly increasing function ofboth k‖ and we. The same behaviour appears when a dierent frequency isused. Increasing the frequency results in a larger field amplitude. An exampleis shown in figure 1.14 where the amplitude of the electric field is computedas a function of the antenna-edge distance and for two dierent frequencies.The dierence is quite substantial. The variation of the wave vector value inthe plasma has a minor impact on the amplitude of the electric field as it is
20
Background
Figure 1.12: Electric field at the antenna as a function of the antenna-edgedistance. Two dierent cases with k‖ = 6m−1 and k‖ =10m−1 are presented.
Figure 1.13: Electric field at the antenna as a function of k‖. Two dierentantenna-edge distance cases we = 0.1m and we = 0.2m arepresented.
shown in figure 1.15 where |Ea| is reported as a function of kplasma. Also fora larger case of we = 0.2m the response is quite modest.
21
Simplest wave coupling model.
Figure 1.14: Electric field at the antenna as a function of the antenna-edgedistance. Two cases at dierent frequencies f = 20MHz andf = 90MHz are presented.
Figure 1.15: Electric field at the antenna as a function of kplasma. Two dier-ent antenna-edge distance cases we = 0.1m and we = 0.2mare presented.
22
Background
1.7 Launcher analysis
The radiating structure used to excite the magneto-sonic wave usually con-sists of an array of straps with a suitable current distribution in phase andamplitude that produces the desired wavenumber spectrum for best couplingwith good RF power absorption by the plasma species. Short (with respect tothe vacuum wavelength) straps are used, as example, in JET ILA, WEST, ITER,LHD, EAST, DIII-D [25–33] and were used in Alcator C-MOD, TEXTOR, TFTR[21, 34–36]. Some other designs use folded straps that could be a quarterof a wavelength long at the mid band frequency. This is the case of JET A2,ASDEX-Upgrade, Alcator C-MOD, EAST [37–40]. A common characteristic isthat the straps are aligned in the poloidal direction (or at best, perpendicularto the total steady magnetic field like in the case of the field-aligned antennain Alcator C-MOD [40]) in order to produce fields with the proper polariza-tion to excite the fast wave into the plasma. This polarisation correspondsto the transverse electric TE/z (with respect to the z axis along the magneticfield) solution of the Maxwell’s equations. The TE/z electromagnetic fieldexcited by the antenna current distribution has to cross the plasma boundaryregion before launching the fast magneto-sonic waves. The TM/z field com-ponent excited by the antenna is small with respect to the TE/z one becausethe considered strap currents are close to a current antinode (e.g. close to thestrap short-circuited end with a strap length lstr << λ/4). There is a non-negligible coupling between the TE/z and TM/z solutions inside the plasmaprofile if there is a confluence between the fast and slow modes as at theAlfven, Lower Hybrid or Ion-Ion Hybrid resonances.
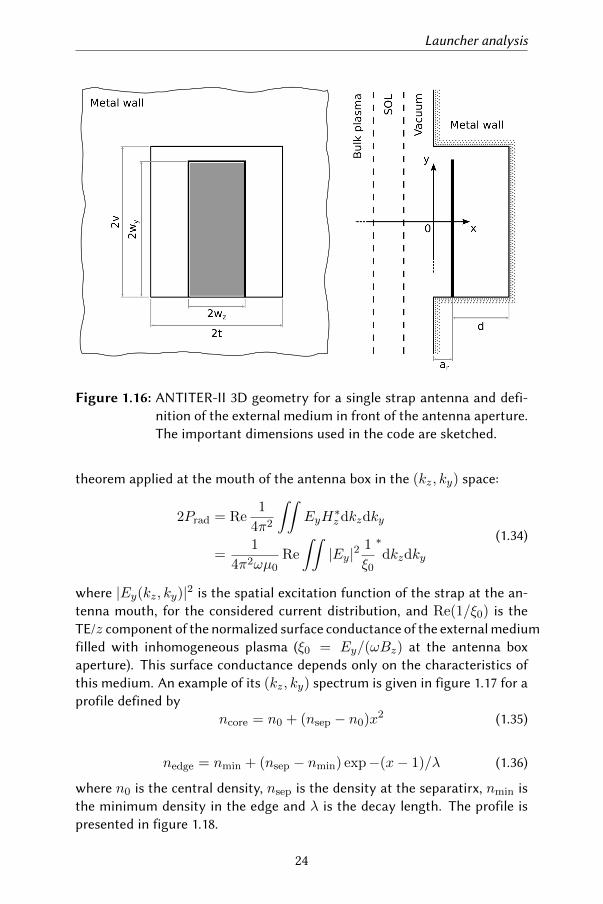
Let us consider the planar model of figure 1.16 showing a radiating straplocated in an antenna box recessed with respect to the vacuum vessel metalwall and in front of a plasma density profile. The half space x < 0 in front ofthe antenna box defines the external medium and is usually made of a thinvacuum layer followed by a scrape-o layer that terminates in a bulk plasmalayer. The plasma profile starts from the interface between the vacuum layerand the SOL. Figure 1.16 portrays also the dimensions used in the code todefine the 3D geometry solved by the code ANTITER-II [41]. The cartesiancoordinate system considered has the z axis along the background magneticfield and the x axis in the radial outwards direction. The radiated waves aredescribed by Fourier analysis in their exp(−iωt+ ikzz + ikyy) componentswith ω = 2πf the angular frequency, kz the propagation constant along thebackground magnetic field and ky the one perpendicular to the laer andto the radial x direction. The y axis represents approximately the tokamakpoloidal direction and the z axis represent its toroidal direction.
The total TE/z radiated power Prad can then be obtained from the Poynting
23
Launcher analysis
Figure 1.16: ANTITER-II 3D geometry for a single strap antenna and defi-nition of the external medium in front of the antenna aperture.The important dimensions used in the code are sketched.
theorem applied at the mouth of the antenna box in the (kz, ky) space:
2Prad = Re1
4π2
∫∫EyH
∗zdkzdky
=1
4π2ωµ0Re
∫∫|Ey|2
1
ξ0
∗dkzdky
(1.34)
where |Ey(kz, ky)|2 is the spatial excitation function of the strap at the an-tenna mouth, for the considered current distribution, and Re(1/ξ0) is theTE/z component of the normalized surface conductance of the external mediumfilled with inhomogeneous plasma (ξ0 = Ey/(ωBz) at the antenna boxaperture). This surface conductance depends only on the characteristics ofthis medium. An example of its (kz, ky) spectrum is given in figure 1.17 for aprofile defined by
ncore = n0 + (nsep − n0)x2 (1.35)
nedge = nmin + (nsep − nmin) exp−(x− 1)/λ (1.36)
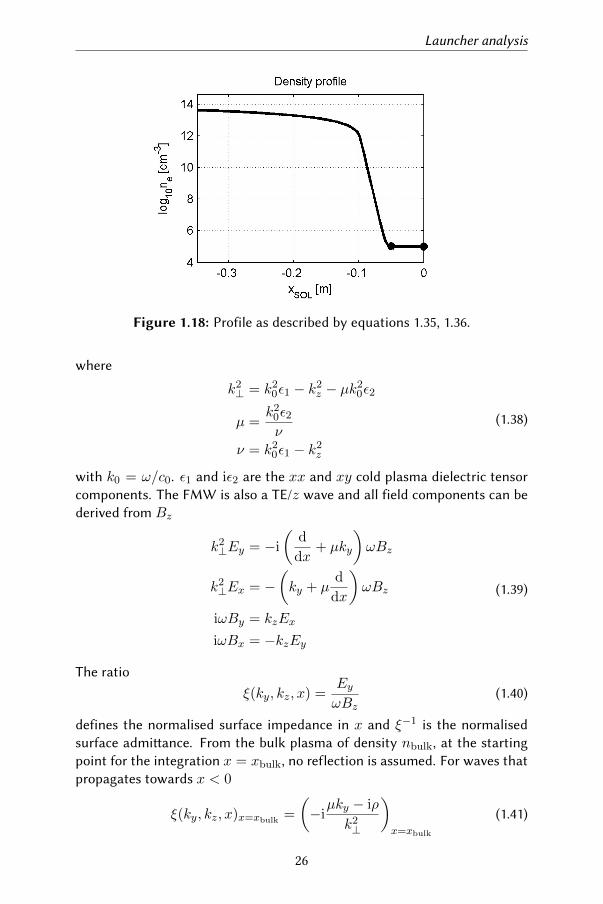
where n0 is the central density, nsep is the density at the separatirx, nmin isthe minimum density in the edge and λ is the decay length. The profile ispresented in figure 1.18.
24
Background
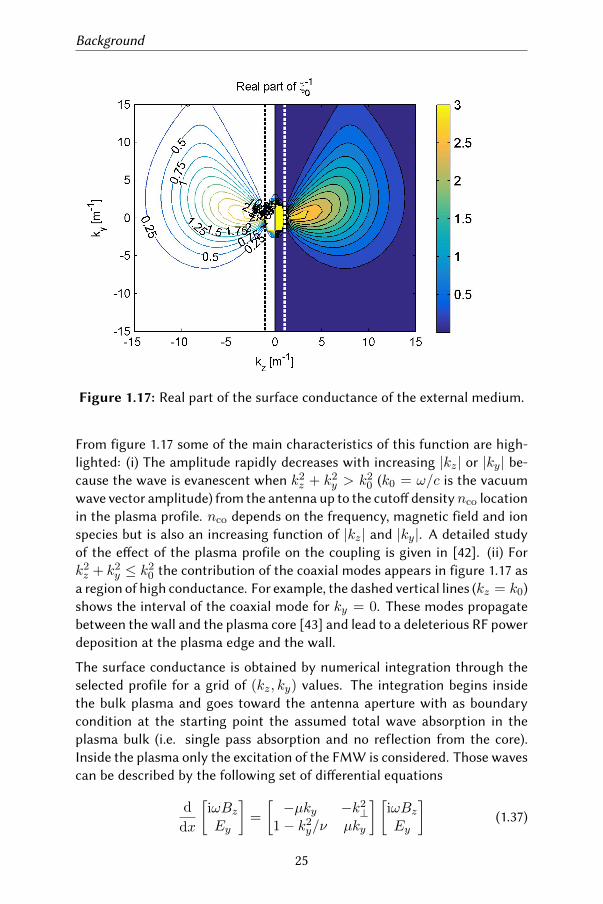
Figure 1.17: Real part of the surface conductance of the external medium.
From figure 1.17 some of the main characteristics of this function are high-lighted: (i) The amplitude rapidly decreases with increasing |kz| or |ky| be-cause the wave is evanescent when k2
z + k2y > k2
0 (k0 = ω/c is the vacuumwave vector amplitude) from the antenna up to the cuto densitynco locationin the plasma profile. nco depends on the frequency, magnetic field and ionspecies but is also an increasing function of |kz| and |ky|. A detailed studyof the eect of the plasma profile on the coupling is given in [42]. (ii) Fork2z + k2
y ≤ k20 the contribution of the coaxial modes appears in figure 1.17 as
a region of high conductance. For example, the dashed vertical lines (kz = k0)shows the interval of the coaxial mode for ky = 0. These modes propagatebetween the wall and the plasma core [43] and lead to a deleterious RF powerdeposition at the plasma edge and the wall.
The surface conductance is obtained by numerical integration through theselected profile for a grid of (kz, ky) values. The integration begins insidethe bulk plasma and goes toward the antenna aperture with as boundarycondition at the starting point the assumed total wave absorption in theplasma bulk (i.e. single pass absorption and no reflection from the core).Inside the plasma only the excitation of the FMW is considered. Those wavescan be described by the following set of dierential equations
d
dx
[iωBzEy
]=
[−µky −k2
⊥1− k2
y/ν µky
] [iωBzEy
](1.37)
25
Launcher analysis
Figure 1.18: Profile as described by equations 1.35, 1.36.
where
k2⊥ = k2
0ε1 − k2z − µk2
0ε2
µ =k2
0ε2ν
ν = k20ε1 − k2
z
(1.38)
with k0 = ω/c0. ε1 and iε2 are the xx and xy cold plasma dielectric tensorcomponents. The FMW is also a TE/z wave and all field components can bederived from Bz
k2⊥Ey = −i
(d
dx+ µky
)ωBz
k2⊥Ex = −
(ky + µ
d
dx
)ωBz
iωBy = kzEx
iωBx = −kzEy
(1.39)
The ratio
ξ(ky, kz, x) =EyωBz
(1.40)
defines the normalised surface impedance in x and ξ−1 is the normalisedsurface admiance. From the bulk plasma of density nbulk, at the startingpoint for the integration x = xbulk, no reflection is assumed. For waves thatpropagates towards x < 0
ξ(ky, kz, x)x=xbulk =
(−iµky − iρ
k2⊥
)x=xbulk
(1.41)
26
Background
with the propagation constant in the uniform bulk plasma given by ρ =√k2⊥ − k2
y . Each wave from the Fourier expansion is non-propagating if
k2⊥ − k2
y < 0. This corresponds in plasma to an electron density below thecut o one (ne < nco) and in vacuum to k2
0−k2z−k2
y < 0. The cut o densitynco is given for ky = 0 by the solution of k2
z/k20 = ε1(x)− ε2(x) [42].
The TE/z field in the box corresponds to waveguide modes excited far belowcut-o because t and wy are << λ0 (λ0 is the vacuum wavelength) by con-stant surface current distribution Jy at x = ar . The usual case considered isv ≈ wy . Jy is expanded in Fourier series in domain |z| < t and |y| < wy
Jy =∑n
Jn sinnπ(z + t)
2t[U(y + wy)− U(y − wy)]
=∑n
JnXn,0 n = 1, 3, 5, ...(1.42)
with
Jn =I
2wz
4
nπsin
nπ
2sin
nπwz2t
(1.43)
and U is the unit step function. This expansion allows us to fulfil the bound-ary condition Ey = 0 on the box sides z = ±t. The other boundary condi-tions are expressed as Ey = 0 in x = d + ar , ∇s ×H = Jy in x = ar andcontinuity of Ey . The tangential field components in x = 0 are given by thefollowing expressions:
Ey =∑n
(Dnhn − Jnln)Xn,0 =∑n
Ey,n,0Xn,0
ωBz =∑n
(Dnfn − Jngn)Xn,0 =∑n
ωBz,n,0Xn,0
(1.44)
with
fn = (1 + δρ) exp(pnr)
gn = ωµ0(δ − 1)ρ exp(pnr/2)
hn = (−ipn/H2n)(δρ− 1) exp(pnr)
ln = gn(−ipn/H2n)
H2n = k2
0 − k2z,n
p2n = k2
y,m −H2n
δ = exp(−2pnd)
ρ = exp(−2pnr)
kz,n = nπ/(2t)
(1.45)
27
Launcher analysis
The Dn are the constants to be determined by the continuity of Ey and Bzacross the box aperture in x = 0.
The electric field component Ey(kz, ky) is solution of the Maxwell’s equa-tions inside the box with the boundary condition at the box aperture ex-pressed by its the surface impedance ξ0(kz, ky) and is closely related to itsexcitation by the current distribution of the straps Jy(kz, ky). As a conse-quence, the radiated power spectrumPrad(kz, ky) is also related to |Jy(kz, ky)|but its amplitude quickly decreases when |kz| or |ky| increases due to thedecrease of Re(1/ξ0). It could be inferred that the best portion of the spec-trum for what concerns the coupling of power to the external medium isachieved in the region of the low |kz| and |ky| values exceeding the regionk2z + k2
y ≤ k20 to avoid the coaxial modes if single pass absorption can be
still assumed. The aim of antenna optimization is to maximize the excitationfunction |Ey(kz, ky)|2 to obtain the maximum radiated power for a givensurface admiance, i.e. a given plasma profile in front of the antenna.
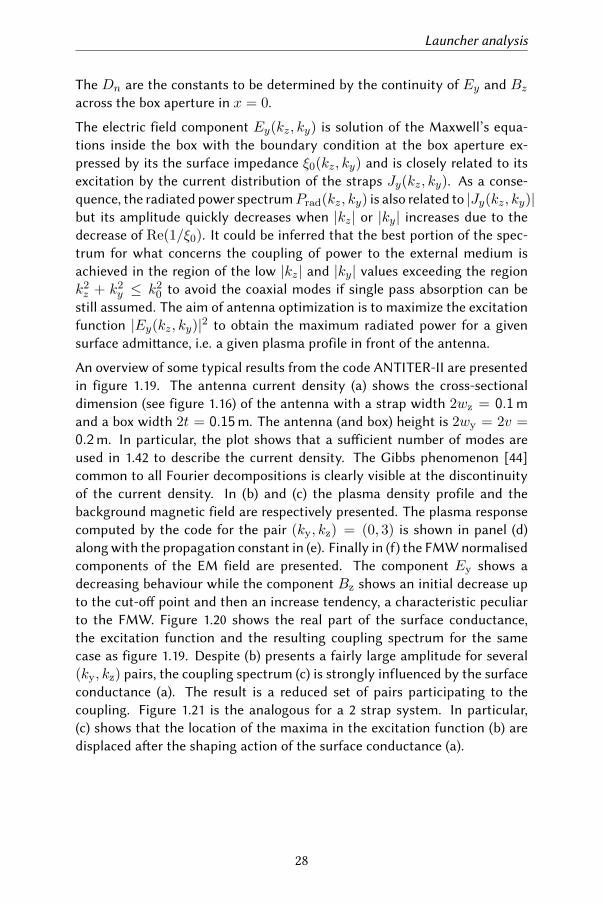
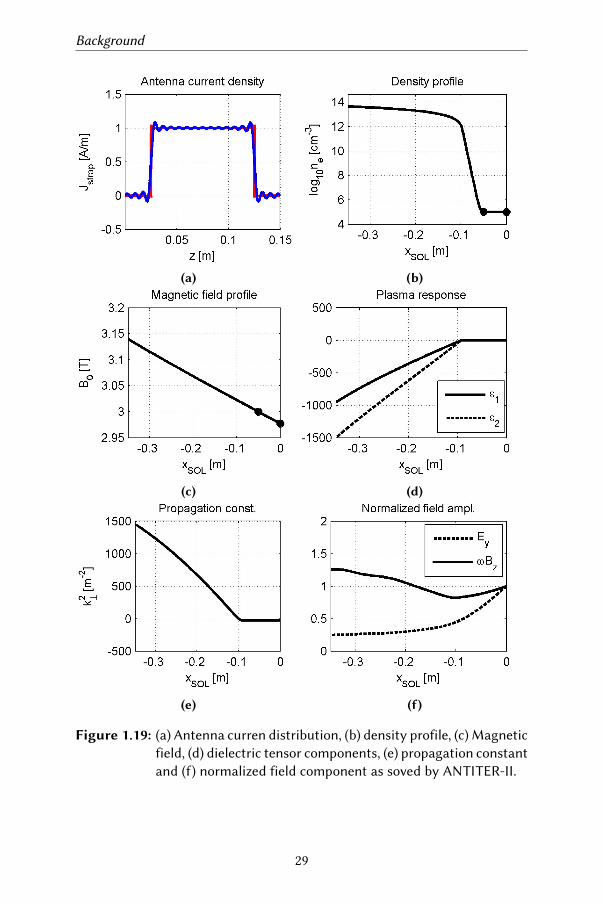
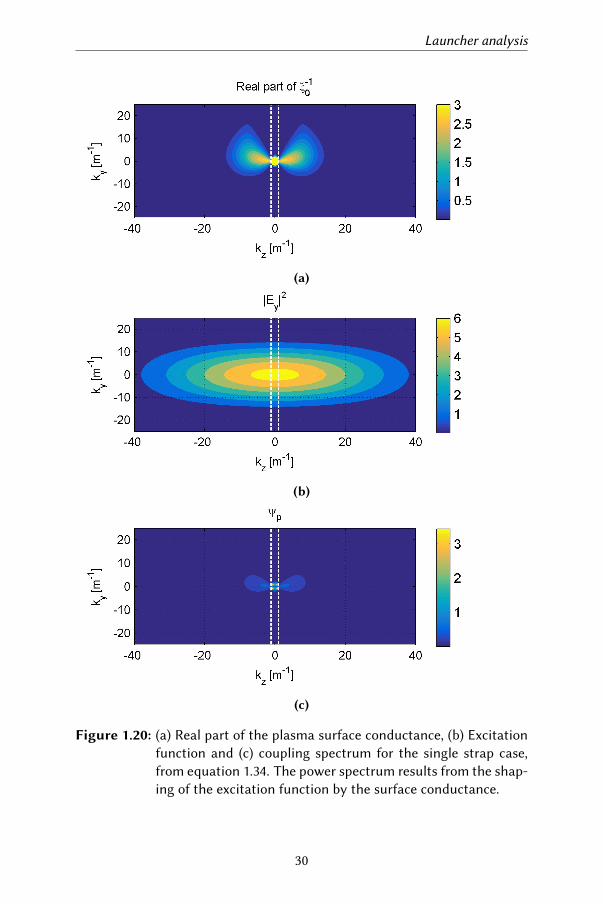
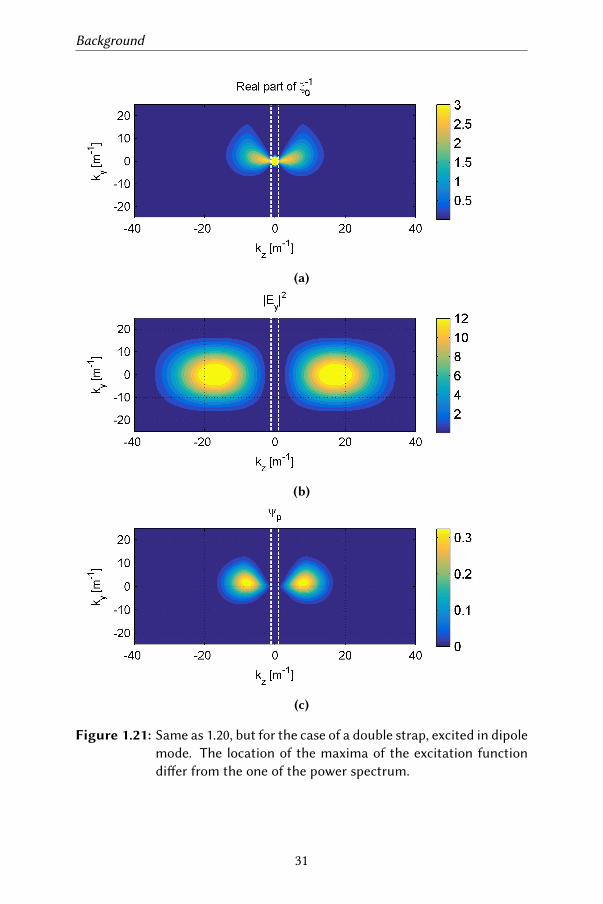
An overview of some typical results from the code ANTITER-II are presentedin figure 1.19. The antenna current density (a) shows the cross-sectionaldimension (see figure 1.16) of the antenna with a strap width 2wz = 0.1mand a box width 2t = 0.15m. The antenna (and box) height is 2wy = 2v =0.2m. In particular, the plot shows that a suicient number of modes areused in 1.42 to describe the current density. The Gibbs phenomenon [44]common to all Fourier decompositions is clearly visible at the discontinuityof the current density. In (b) and (c) the plasma density profile and thebackground magnetic field are respectively presented. The plasma responsecomputed by the code for the pair (ky, kz) = (0, 3) is shown in panel (d)along with the propagation constant in (e). Finally in (f) the FMW normalisedcomponents of the EM field are presented. The component Ey shows adecreasing behaviour while the component Bz shows an initial decrease upto the cut-o point and then an increase tendency, a characteristic peculiarto the FMW. Figure 1.20 shows the real part of the surface conductance,the excitation function and the resulting coupling spectrum for the samecase as figure 1.19. Despite (b) presents a fairly large amplitude for several(ky, kz) pairs, the coupling spectrum (c) is strongly influenced by the surfaceconductance (a). The result is a reduced set of pairs participating to thecoupling. Figure 1.21 is the analogous for a 2 strap system. In particular,(c) shows that the location of the maxima in the excitation function (b) aredisplaced aer the shaping action of the surface conductance (a).
28
Background
(a) (b)
(c) (d)
(e) (f)
Figure 1.19: (a) Antenna curren distribution, (b) density profile, (c) Magneticfield, (d) dielectric tensor components, (e) propagation constantand (f) normalized field component as soved by ANTITER-II.
29
Launcher analysis
(a)
(b)
(c)
Figure 1.20: (a) Real part of the plasma surface conductance, (b) Excitationfunction and (c) coupling spectrum for the single strap case,from equation 1.34. The power spectrum results from the shap-ing of the excitation function by the surface conductance.
30
Background
(a)
(b)
(c)
Figure 1.21: Same as 1.20, but for the case of a double strap, excited in dipolemode. The location of the maxima of the excitation functiondier from the one of the power spectrum.
31
Antenna Matching
1.8 Antenna Matching
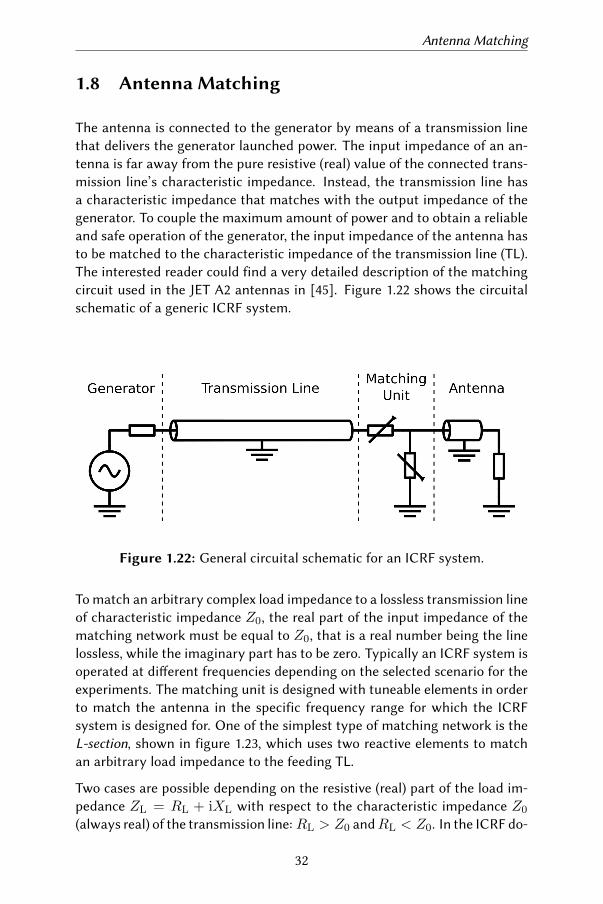
The antenna is connected to the generator by means of a transmission linethat delivers the generator launched power. The input impedance of an an-tenna is far away from the pure resistive (real) value of the connected trans-mission line’s characteristic impedance. Instead, the transmission line hasa characteristic impedance that matches with the output impedance of thegenerator. To couple the maximum amount of power and to obtain a reliableand safe operation of the generator, the input impedance of the antenna hasto be matched to the characteristic impedance of the transmission line (TL).The interested reader could find a very detailed description of the matchingcircuit used in the JET A2 antennas in [45]. Figure 1.22 shows the circuitalschematic of a generic ICRF system.
Figure 1.22: General circuital schematic for an ICRF system.
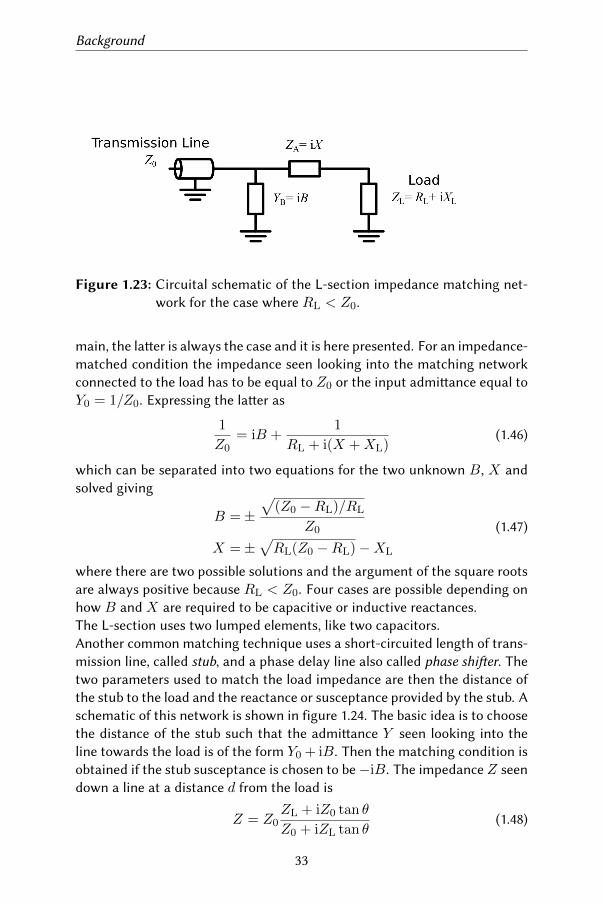
To match an arbitrary complex load impedance to a lossless transmission lineof characteristic impedance Z0, the real part of the input impedance of thematching network must be equal to Z0, that is a real number being the linelossless, while the imaginary part has to be zero. Typically an ICRF system isoperated at dierent frequencies depending on the selected scenario for theexperiments. The matching unit is designed with tuneable elements in orderto match the antenna in the specific frequency range for which the ICRFsystem is designed for. One of the simplest type of matching network is theL-section, shown in figure 1.23, which uses two reactive elements to matchan arbitrary load impedance to the feeding TL.
Two cases are possible depending on the resistive (real) part of the load im-pedance ZL = RL + iXL with respect to the characteristic impedance Z0
(always real) of the transmission line: RL > Z0 andRL < Z0. In the ICRF do-
32
Background
Figure 1.23: Circuital schematic of the L-section impedance matching net-work for the case where RL < Z0.
main, the laer is always the case and it is here presented. For an impedance-matched condition the impedance seen looking into the matching networkconnected to the load has to be equal to Z0 or the input admiance equal toY0 = 1/Z0. Expressing the laer as
1
Z0= iB +
1
RL + i(X +XL)(1.46)
which can be separated into two equations for the two unknown B, X andsolved giving
B =±√
(Z0 −RL)/RL
Z0
X =±√RL(Z0 −RL)−XL
(1.47)
where there are two possible solutions and the argument of the square rootsare always positive because RL < Z0. Four cases are possible depending onhow B and X are required to be capacitive or inductive reactances.The L-section uses two lumped elements, like two capacitors.Another common matching technique uses a short-circuited length of trans-mission line, called stub, and a phase delay line also called phase shier. Thetwo parameters used to match the load impedance are then the distance ofthe stub to the load and the reactance or susceptance provided by the stub. Aschematic of this network is shown in figure 1.24. The basic idea is to choosethe distance of the stub such that the admiance Y seen looking into theline towards the load is of the form Y0 + iB. Then the matching condition isobtained if the stub susceptance is chosen to be−iB. The impedance Z seendown a line at a distance d from the load is
Z = Z0ZL + iZ0 tan θ
Z0 + iZL tan θ(1.48)
33
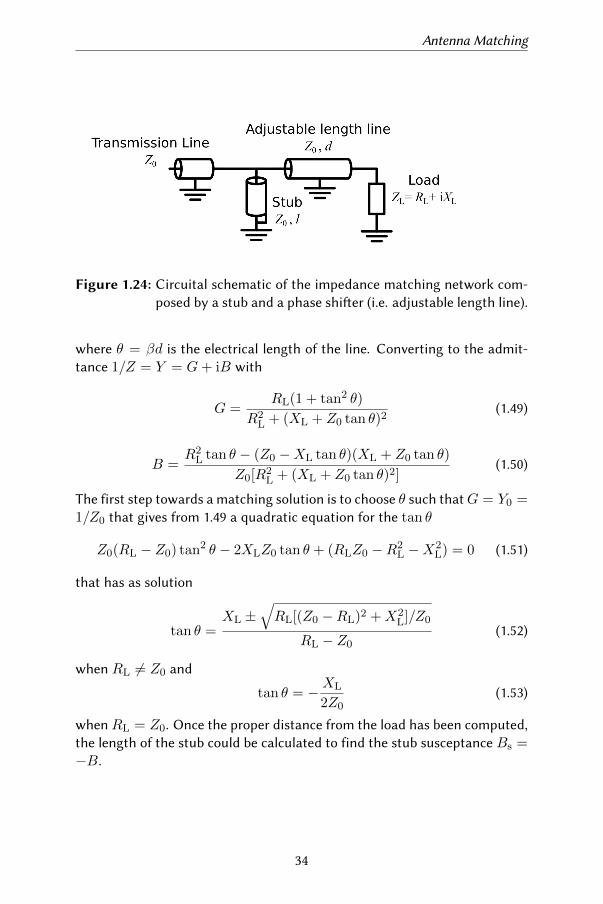
Antenna Matching
Figure 1.24: Circuital schematic of the impedance matching network com-posed by a stub and a phase shier (i.e. adjustable length line).
where θ = βd is the electrical length of the line. Converting to the admit-tance 1/Z = Y = G+ iB with
G =RL(1 + tan2 θ)
R2L + (XL + Z0 tan θ)2
(1.49)
B =R2
L tan θ − (Z0 −XL tan θ)(XL + Z0 tan θ)
Z0[R2L + (XL + Z0 tan θ)2]
(1.50)
The first step towards a matching solution is to choose θ such thatG = Y0 =1/Z0 that gives from 1.49 a quadratic equation for the tan θ
Z0(RL − Z0) tan2 θ − 2XLZ0 tan θ + (RLZ0 −R2L −X2
L) = 0 (1.51)
that has as solution
tan θ =XL ±
√RL[(Z0 −RL)2 +X2
L]/Z0
RL − Z0(1.52)
when RL 6= Z0 and
tan θ = −XL
2Z0(1.53)
whenRL = Z0. Once the proper distance from the load has been computed,the length of the stub could be calculated to find the stub susceptance Bs =−B.
34
Chapter 2
Travelling Wave Array
The traveling wave antenna is here presented and the basic theory described.The idea of using a TWA as ICRF antenna was already proposed in the ’90 bythe DIII-D team in US [46, 47]. The concept has been tested in the past forcurrent drive application at high frequency (driving the plasma current non-inductively is a key need for a steady state reactor as it allows continuous -as opposed to pulsed - operation and hence has clear economical benefits),on the Japanese device JFT-2M [48], and it is currently subject of studies forhigh harmonics helicon in DIII-D (US) [49] and KSTAR (Korea)[50, 51]. It has- however - never been put to the test for ICRF fast wave minority heating, thewave heating scheme most likely to be exploited in future machines, in spiteof its multiple interesting properties and potential advantages compared toclassical ICRF antenna designs. A systematic study of an arbitrary TWA infront of a realistic plasma profile will be presented in the subsequent chaptersand complements the work presented in [52–54].
2.1 Circuit modelling
A travelling wave array antenna is a structure composed by and array of mu-tually coupled strap, where an EM wave could propagate along the structureexciting, with its evanescent near fields, a propagating fast magneto sonicwave in the plasma facing the antenna aperture. This FMW will propagateto the core and deposit its energy to the plasma particles thus heating them.The A schematic example of this structure is shown in figure 2.1. Part of thepower that travel on the antenna structure is leaker to the plasma, dependingon the distance and profile of the plasma itself. This structure is a internallymatched antenna.
35
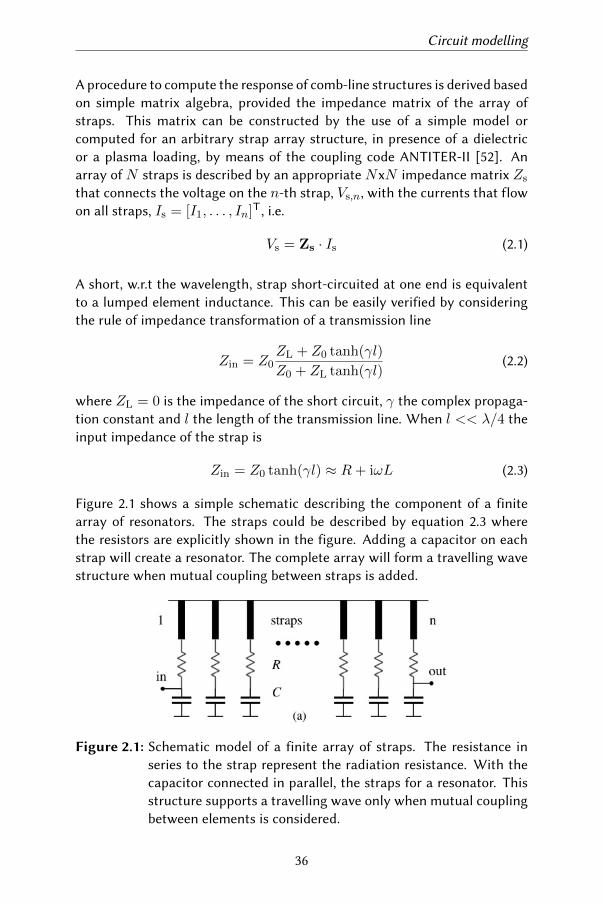
Circuit modelling
A procedure to compute the response of comb-line structures is derived basedon simple matrix algebra, provided the impedance matrix of the array ofstraps. This matrix can be constructed by the use of a simple model orcomputed for an arbitrary strap array structure, in presence of a dielectricor a plasma loading, by means of the coupling code ANTITER-II [52]. Anarray of N straps is described by an appropriate NxN impedance matrix Zs
that connects the voltage on the n-th strap, Vs,n, with the currents that flowon all straps, Is = [I1, . . . , In]T, i.e.
Vs = Zs · Is (2.1)
A short, w.r.t the wavelength, strap short-circuited at one end is equivalentto a lumped element inductance. This can be easily verified by consideringthe rule of impedance transformation of a transmission line
Zin = Z0ZL + Z0 tanh(γl)
Z0 + ZL tanh(γl)(2.2)
where ZL = 0 is the impedance of the short circuit, γ the complex propaga-tion constant and l the length of the transmission line. When l << λ/4 theinput impedance of the strap is
Zin = Z0 tanh(γl) ≈ R+ iωL (2.3)
Figure 2.1 shows a simple schematic describing the component of a finitearray of resonators. The straps could be described by equation 2.3 wherethe resistors are explicitly shown in the figure. Adding a capacitor on eachstrap will create a resonator. The complete array will form a travelling wavestructure when mutual coupling between straps is added.
Figure 2.1: Schematic model of a finite array of straps. The resistance inseries to the strap represent the radiation resistance. With thecapacitor connected in parallel, the straps for a resonator. Thisstructure supports a travelling wave only when mutual couplingbetween elements is considered.
36
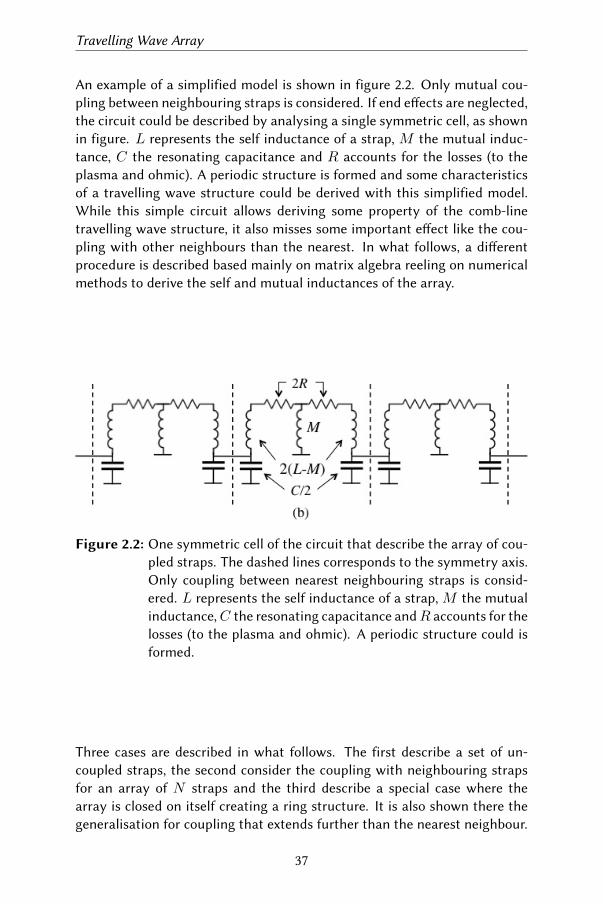
Travelling Wave Array
An example of a simplified model is shown in figure 2.2. Only mutual cou-pling between neighbouring straps is considered. If end eects are neglected,the circuit could be described by analysing a single symmetric cell, as shownin figure. L represents the self inductance of a strap, M the mutual induc-tance, C the resonating capacitance and R accounts for the losses (to theplasma and ohmic). A periodic structure is formed and some characteristicsof a travelling wave structure could be derived with this simplified model.While this simple circuit allows deriving some property of the comb-linetravelling wave structure, it also misses some important eect like the cou-pling with other neighbours than the nearest. In what follows, a dierentprocedure is described based mainly on matrix algebra reeling on numericalmethods to derive the self and mutual inductances of the array.
Figure 2.2: One symmetric cell of the circuit that describe the array of cou-pled straps. The dashed lines corresponds to the symmetry axis.Only coupling between nearest neighbouring straps is consid-ered. L represents the self inductance of a strap, M the mutualinductance,C the resonating capacitance andR accounts for thelosses (to the plasma and ohmic). A periodic structure could isformed.
Three cases are described in what follows. The first describe a set of un-coupled straps, the second consider the coupling with neighbouring strapsfor an array of N straps and the third describe a special case where thearray is closed on itself creating a ring structure. It is also shown there thegeneralisation for coupling that extends further than the nearest neighbour.
37
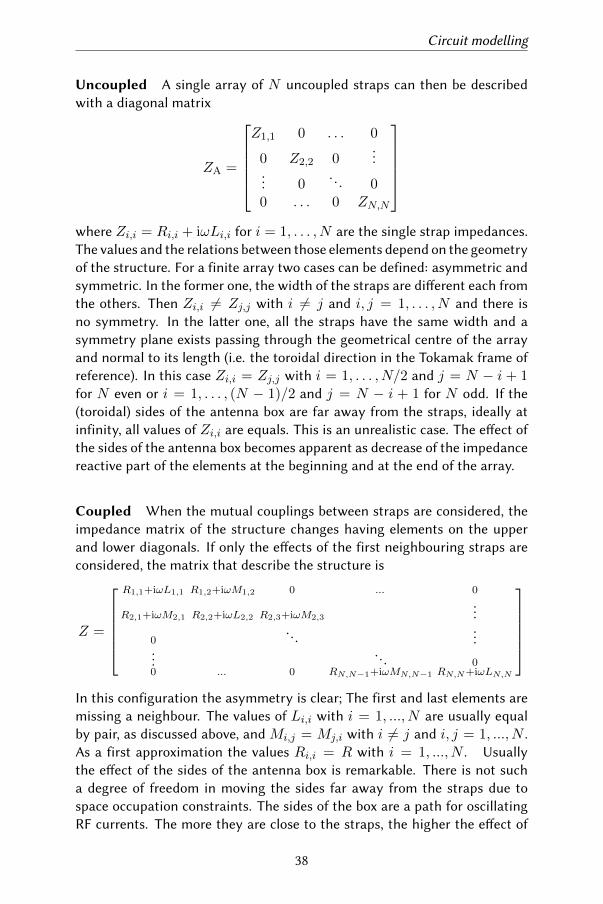
Circuit modelling
Uncoupled A single array of N uncoupled straps can then be describedwith a diagonal matrix
ZA =
Z1,1 0 . . . 0
0 Z2,2 0...
... 0. . . 0
0 . . . 0 ZN,N
where Zi,i = Ri,i + iωLi,i for i = 1, . . . , N are the single strap impedances.The values and the relations between those elements depend on the geometryof the structure. For a finite array two cases can be defined: asymmetric andsymmetric. In the former one, the width of the straps are dierent each fromthe others. Then Zi,i 6= Zj,j with i 6= j and i, j = 1, . . . , N and there isno symmetry. In the laer one, all the straps have the same width and asymmetry plane exists passing through the geometrical centre of the arrayand normal to its length (i.e. the toroidal direction in the Tokamak frame ofreference). In this case Zi,i = Zj,j with i = 1, . . . , N/2 and j = N − i + 1for N even or i = 1, . . . , (N − 1)/2 and j = N − i + 1 for N odd. If the(toroidal) sides of the antenna box are far away from the straps, ideally atinfinity, all values of Zi,i are equals. This is an unrealistic case. The eect ofthe sides of the antenna box becomes apparent as decrease of the impedancereactive part of the elements at the beginning and at the end of the array.
Coupled When the mutual couplings between straps are considered, theimpedance matrix of the structure changes having elements on the upperand lower diagonals. If only the eects of the first neighbouring straps areconsidered, the matrix that describe the structure is
Z =
R1,1+iωL1,1 R1,2+iωM1,2 0 ... 0
R2,1+iωM2,1 R2,2+iωL2,2 R2,3+iωM2,3
...
0. . .
......
. . . 00 ... 0 RN,N−1+iωMN,N−1 RN,N+iωLN,N
In this configuration the asymmetry is clear; The first and last elements aremissing a neighbour. The values of Li,i with i = 1, ..., N are usually equalby pair, as discussed above, and Mi,j = Mj,i with i 6= j and i, j = 1, ..., N .As a first approximation the values Ri,i = R with i = 1, ..., N . Usuallythe eect of the sides of the antenna box is remarkable. There is not sucha degree of freedom in moving the sides far away from the straps due tospace occupation constraints. The sides of the box are a path for oscillatingRF currents. The more they are close to the straps, the higher the eect of
38
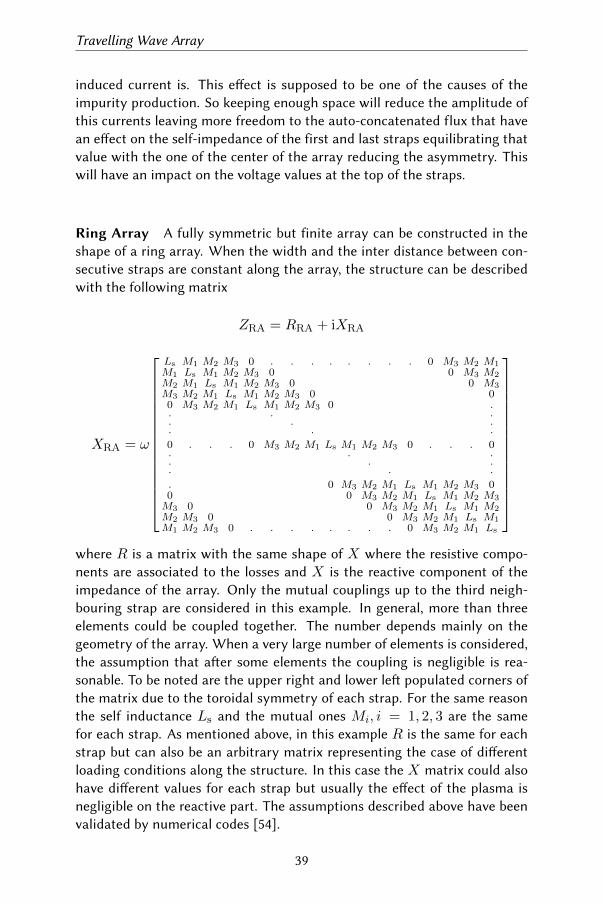
Travelling Wave Array
induced current is. This eect is supposed to be one of the causes of theimpurity production. So keeping enough space will reduce the amplitude ofthis currents leaving more freedom to the auto-concatenated flux that havean eect on the self-impedance of the first and last straps equilibrating thatvalue with the one of the center of the array reducing the asymmetry. Thiswill have an impact on the voltage values at the top of the straps.
Ring Array A fully symmetric but finite array can be constructed in theshape of a ring array. When the width and the inter distance between con-secutive straps are constant along the array, the structure can be describedwith the following matrix
ZRA = RRA + iXRA
XRA = ω
Ls M1 M2 M3 0 . . . . . . . . 0 M3 M2 M1M1 Ls M1 M2 M3 0 0 M3 M2M2 M1 Ls M1 M2 M3 0 0 M3M3 M2 M1 Ls M1 M2 M3 0 00 M3 M2 M1 Ls M1 M2 M3 0 .. . .. . .. . .
0 . . . 0 M3 M2 M1 Ls M1 M2 M3 0 . . . 0. . .. . .. . .
. 0 M3 M2 M1 Ls M1 M2 M3 00 0 M3 M2 M1 Ls M1 M2 M3M3 0 0 M3 M2 M1 Ls M1 M2M2 M3 0 0 M3 M2 M1 Ls M1M1 M2 M3 0 . . . . . . . . 0 M3 M2 M1 Ls
where R is a matrix with the same shape of X where the resistive compo-nents are associated to the losses and X is the reactive component of theimpedance of the array. Only the mutual couplings up to the third neigh-bouring strap are considered in this example. In general, more than threeelements could be coupled together. The number depends mainly on thegeometry of the array. When a very large number of elements is considered,the assumption that aer some elements the coupling is negligible is rea-sonable. To be noted are the upper right and lower le populated corners ofthe matrix due to the toroidal symmetry of each strap. For the same reasonthe self inductance Ls and the mutual ones Mi, i = 1, 2, 3 are the samefor each strap. As mentioned above, in this example R is the same for eachstrap but can also be an arbitrary matrix representing the case of dierentloading conditions along the structure. In this case the X matrix could alsohave dierent values for each strap but usually the eect of the plasma isnegligible on the reactive part. The assumptions described above have beenvalidated by numerical codes [54].
39
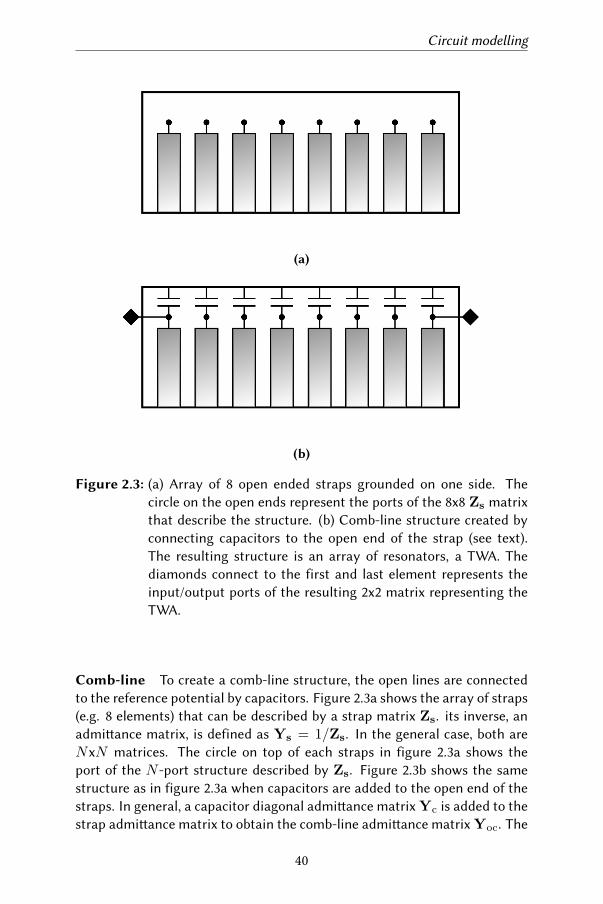
Circuit modelling
(a)
(b)
Figure 2.3: (a) Array of 8 open ended straps grounded on one side. Thecircle on the open ends represent the ports of the 8x8 Zs matrixthat describe the structure. (b) Comb-line structure created byconnecting capacitors to the open end of the strap (see text).The resulting structure is an array of resonators, a TWA. Thediamonds connect to the first and last element represents theinput/output ports of the resulting 2x2 matrix representing theTWA.
Comb-line To create a comb-line structure, the open lines are connectedto the reference potential by capacitors. Figure 2.3a shows the array of straps(e.g. 8 elements) that can be described by a strap matrix Zs. its inverse, anadmiance matrix, is defined as Ys = 1/Zs. In the general case, both areNxN matrices. The circle on top of each straps in figure 2.3a shows theport of the N -port structure described by Zs. Figure 2.3b shows the samestructure as in figure 2.3a when capacitors are added to the open end of thestraps. In general, a capacitor diagonal admiance matrix Yc is added to thestrap admiance matrix to obtain the comb-line admiance matrix Yoc. The
40
Travelling Wave Array
capacitor diagonal admiance matrix is defined as
Yc = iω
C1 0 . . . 0
0. . .
......
. . . 00 . . . 0 CN
(2.4)
where the capacitanceCi=1,..,N refers to the capacitor connected to the i−thstrap and ω = 2πf is the angular frequency. The admiance matrix Yoc isthen defined as
Yoc = Ys + Yc (2.5)
where the subscript oc refers to a matrix where all the ports are open-circuited.Yoc and its inverseZoc areNxN matrices describingN -port networks whereusually N > 2. Only the first and last elements of the structure are con-nected to an external circuit while the remaining N − 2 elements are leunconnected. This passage is equivalent to considerZoc connected to currentvector I = [Iin, 0, . . . , 0, Iout]
Tthat corresponds to the currents feeding the
structure. The procedure to compute Iin and Iout is described in what follows.A comb-line structure is then a 2-port network described only by a 2x2 matrix.Those two ports are the connections used to feed the structure; when used asa traveling wave antenna, an input line and an output line are required. The 2-port network matrix could be an impedance matrixZcb, an admiance matrixYcb = 1/Zcb or a scaering matrix Scb depending on which representationis more useful for the description. Zcb could be easily derived by extractingfromZoc the lines and the rows that correspond to the input and output lines.Those are usually the first and the last elements of the array, i.e. i = 1, N ,giving
Zcb =
[Zoc,1,1 Zoc,1,N
Zoc,N,1 Zoc,N,N
](2.6)
Once the comb-line impedance matrix is derived, the iterative impedance ofthe 2-port network [55] is computed as
Zit =√Z2
1,1 − Z21,2 (2.7)
It is now possible to compute a scaering matrix Scb by the relation
Scb = (Zcb −UZit) (Zcb + UZit)−1 (2.8)
The power flow, the voltage and the current on the straps could now be easilyfound. The scaering parameters are defined as ratios between reflected and
41
Coupling properties
forward voltage waves on the ports of a network and are expressed in the S-matrix by the equation
b = S · a (2.9)
where a is the vector of the forward voltage and b the vector of the reflectedvoltage. The way the matrix Scb is constructed ensures that the ports arematched when closed on an impedance Z = Zit. This means for a TWAthat when port #2 is terminated with Zit there is no reflection from thetermination, so the forward voltage on that port is equal to zero, i.e. a2 =0. Computed b from equation 2.9, the voltage and current on the ports isevaluated from
Vin = a1 + b1
Iin = (a1 − b1)/Zit
Vout = b2
Iout = −b2/Zit
(2.10)
The power flow could be then computed from
Pin =a2
1
2Zit
Pout =b22
2Zit
P− =b21
2Zit
(2.11)
To compute the voltage on the straps
Vs = Zoc · I (2.12)
where I = [Iin, 0, . . . , 0, Iout]T. Finally the current on the straps is evaluated
asIs = Ys · Vs (2.13)
Following this procedure, a complete description of the comb-line antennais obtained. This formulation allows deriving the frequency response of thestructure, the values of the voltages and current on the antenna elements[53]. In what follows, a method to derive the array matrix Zs in front of aplasma profile is described.
2.2 Coupling properties
The coupling properties of a generic array are here described highlighting themain characteristics and deriving some scalings that shows some of the main
42
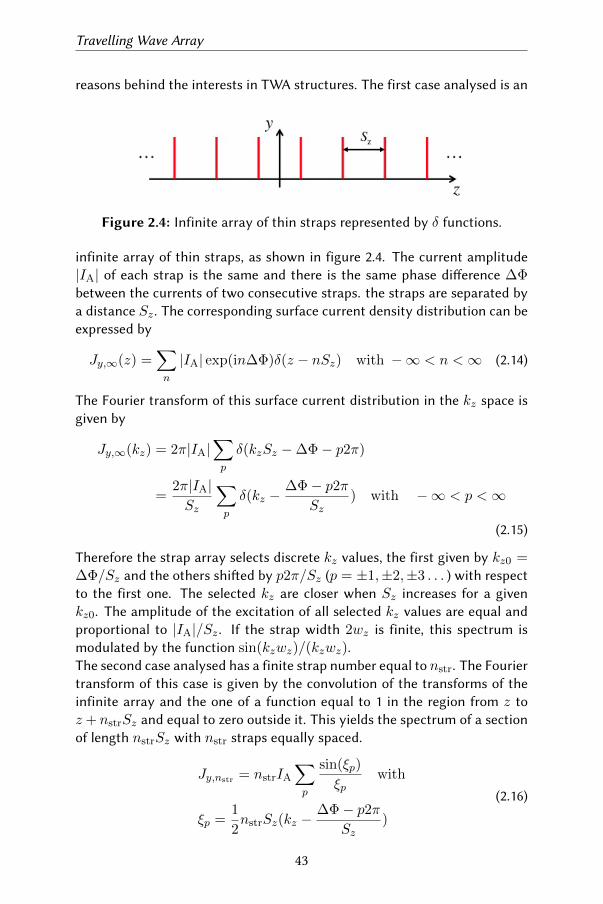
Travelling Wave Array
reasons behind the interests in TWA structures. The first case analysed is an
Figure 2.4: Infinite array of thin straps represented by δ functions.
infinite array of thin straps, as shown in figure 2.4. The current amplitude|IA| of each strap is the same and there is the same phase dierence ∆Φbetween the currents of two consecutive straps. the straps are separated bya distance Sz . The corresponding surface current density distribution can beexpressed by
Jy,∞(z) =∑n
|IA| exp(in∆Φ)δ(z − nSz) with −∞ < n <∞ (2.14)
The Fourier transform of this surface current distribution in the kz space isgiven by
Jy,∞(kz) = 2π|IA|∑p
δ(kzSz −∆Φ− p2π)
=2π|IA|Sz
∑p
δ(kz −∆Φ− p2π
Sz) with −∞ < p <∞
(2.15)
Therefore the strap array selects discrete kz values, the first given by kz0 =∆Φ/Sz and the others shied by p2π/Sz (p = ±1,±2,±3 . . . ) with respectto the first one. The selected kz are closer when Sz increases for a givenkz0. The amplitude of the excitation of all selected kz values are equal andproportional to |IA|/Sz . If the strap width 2wz is finite, this spectrum ismodulated by the function sin(kzwz)/(kzwz).The second case analysed has a finite strap number equal to nstr. The Fouriertransform of this case is given by the convolution of the transforms of theinfinite array and the one of a function equal to 1 in the region from z toz + nstrSz and equal to zero outside it. This yields the spectrum of a sectionof length nstrSz with nstr straps equally spaced.
Jy,nstr = nstrIA
∑p
sin(ξp)
ξpwith
ξp =1
2nstrSz(kz −
∆Φ− p2πSz
)
(2.16)
43
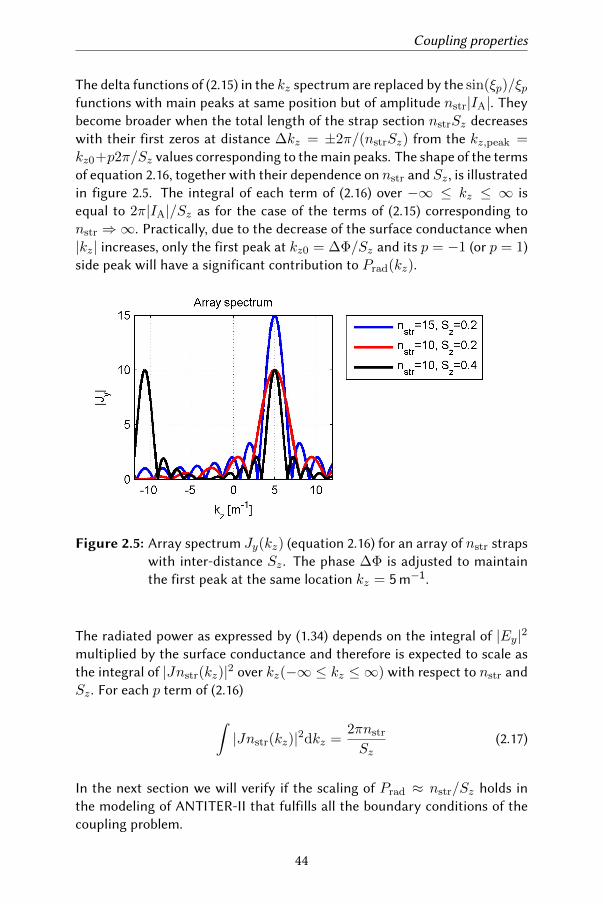
Coupling properties
The delta functions of (2.15) in the kz spectrum are replaced by the sin(ξp)/ξpfunctions with main peaks at same position but of amplitude nstr|IA|. Theybecome broader when the total length of the strap section nstrSz decreaseswith their first zeros at distance ∆kz = ±2π/(nstrSz) from the kz,peak =kz0+p2π/Sz values corresponding to the main peaks. The shape of the termsof equation 2.16, together with their dependence on nstr and Sz , is illustratedin figure 2.5. The integral of each term of (2.16) over −∞ ≤ kz ≤ ∞ isequal to 2π|IA|/Sz as for the case of the terms of (2.15) corresponding tonstr ⇒∞. Practically, due to the decrease of the surface conductance when|kz| increases, only the first peak at kz0 = ∆Φ/Sz and its p = −1 (or p = 1)side peak will have a significant contribution to Prad(kz).
Figure 2.5: Array spectrum Jy(kz) (equation 2.16) for an array of nstr strapswith inter-distance Sz . The phase ∆Φ is adjusted to maintainthe first peak at the same location kz = 5m−1.
The radiated power as expressed by (1.34) depends on the integral of |Ey|2multiplied by the surface conductance and therefore is expected to scale asthe integral of |Jnstr(kz)|2 over kz(−∞ ≤ kz ≤ ∞) with respect to nstr andSz . For each p term of (2.16)
∫|Jnstr(kz)|2dkz =
2πnstr
Sz(2.17)
In the next section we will verify if the scaling of Prad ≈ nstr/Sz holds inthe modeling of ANTITER-II that fulfills all the boundary conditions of thecoupling problem.
44
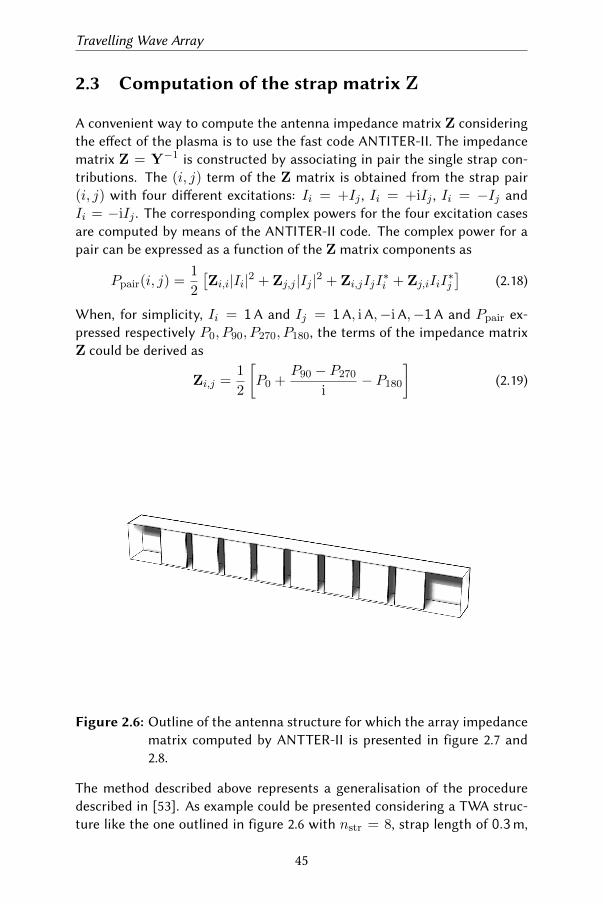
Travelling Wave Array
2.3 Computation of the strap matrix Z
A convenient way to compute the antenna impedance matrix Z consideringthe eect of the plasma is to use the fast code ANTITER-II. The impedancematrix Z = Y−1 is constructed by associating in pair the single strap con-tributions. The (i, j) term of the Z matrix is obtained from the strap pair(i, j) with four dierent excitations: Ii = +Ij , Ii = +iIj , Ii = −Ij andIi = −iIj . The corresponding complex powers for the four excitation casesare computed by means of the ANTITER-II code. The complex power for apair can be expressed as a function of the Z matrix components as
Ppair(i, j) =1
2
[Zi,i|Ii|2 + Zj,j |Ij |2 + Zi,jIjI
∗i + Zj,iIiI
∗j
](2.18)
When, for simplicity, Ii = 1A and Ij = 1A, i A,−i A,−1A and Ppair ex-pressed respectively P0, P90, P270, P180, the terms of the impedance matrixZ could be derived as
Zi,j =1
2
[P0 +
P90 − P270
i− P180
](2.19)
Figure 2.6: Outline of the antenna structure for which the array impedancematrix computed by ANTTER-II is presented in figure 2.7 and2.8.
The method described above represents a generalisation of the proceduredescribed in [53]. As example could be presented considering a TWA struc-ture like the one outlined in figure 2.6 with nstr = 8, strap length of 0.3m,
45
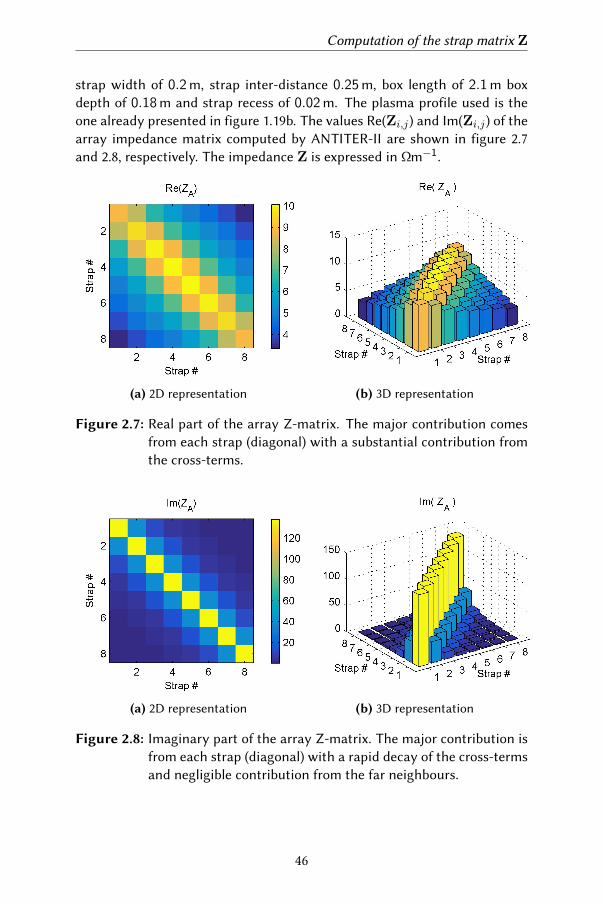
Computation of the strap matrix Z
strap width of 0.2m, strap inter-distance 0.25m, box length of 2.1m boxdepth of 0.18m and strap recess of 0.02m. The plasma profile used is theone already presented in figure 1.19b. The values Re(Zi,j) and Im(Zi,j) of thearray impedance matrix computed by ANTITER-II are shown in figure 2.7and 2.8, respectively. The impedance Z is expressed in Ωm−1.
(a) 2D representation (b) 3D representation
Figure 2.7: Real part of the array Z-matrix. The major contribution comesfrom each strap (diagonal) with a substantial contribution fromthe cross-terms.
(a) 2D representation (b) 3D representation
Figure 2.8: Imaginary part of the array Z-matrix. The major contribution isfrom each strap (diagonal) with a rapid decay of the cross-termsand negligible contribution from the far neighbours.
46
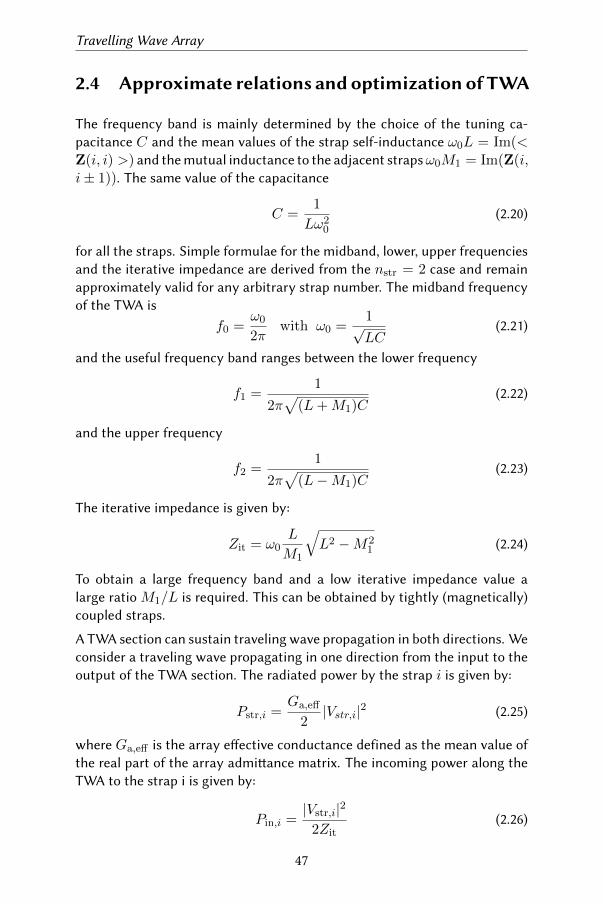
Travelling Wave Array
2.4 Approximate relations and optimization of TWA
The frequency band is mainly determined by the choice of the tuning ca-pacitance C and the mean values of the strap self-inductance ω0L = Im(<Z(i, i) >) and the mutual inductance to the adjacent strapsω0M1 = Im(Z(i,i± 1)). The same value of the capacitance
C =1
Lω20
(2.20)
for all the straps. Simple formulae for the midband, lower, upper frequenciesand the iterative impedance are derived from the nstr = 2 case and remainapproximately valid for any arbitrary strap number. The midband frequencyof the TWA is
f0 =ω0
2πwith ω0 =
1√LC
(2.21)
and the useful frequency band ranges between the lower frequency
f1 =1
2π√
(L+M1)C(2.22)
and the upper frequency
f2 =1
2π√
(L−M1)C(2.23)
The iterative impedance is given by:
Zit = ω0L
M1
√L2 −M2
1 (2.24)
To obtain a large frequency band and a low iterative impedance value alarge ratio M1/L is required. This can be obtained by tightly (magnetically)coupled straps.
A TWA section can sustain traveling wave propagation in both directions. Weconsider a traveling wave propagating in one direction from the input to theoutput of the TWA section. The radiated power by the strap i is given by:
Pstr,i =Ga,eff
2|Vstr,i|2 (2.25)
where Ga,eff is the array eective conductance defined as the mean value ofthe real part of the array admiance matrix. The incoming power along theTWA to the strap i is given by:
Pin,i =|Vstr,i|2
2Zit(2.26)
47
Approximate relations and optimization of TWA
while the outgoing power from strap i to the next strap i+1 can be expressedby
Pout,i = Pin,i+1 = Pin,i − Pstr,i (2.27)
Therefore the radiated power decay along the TWA section can be computedas a function of the parameters Ga,eff and Zit. We have
|Vi+1|2 = |Vi|2(
1−Ga,effZit
2
)2
(2.28)
and the total radiated power by the section is given by the following geomet-ric progression:
PTWA =1
2
N∑n=1
Ga,eff |Vin|2(
1−Ga,effZit
2
)2(n−1)
(2.29)
where N = nstr. If all straps have same voltage amplitude |Vstr,i| = |Vin|,the sum is equal to
PTWA,max =nstrGa,eff
2|Vin|2 (2.30)
This relation shows that the product Ga,effZit has to be minimized to avoida too large decay of the radiated power along the TWA section. The outputpower of the section is given by:
Pout =Ga,eff
2|Vout|2 =
Ga,eff
2|Vin|2
(1−
Ga,effZit
2
)2(nstr−1)
(2.31)
This is the power to be recirculated by the feeding system.
Design optimization for a TWA section
Ga,eff has to be maximized while Zit minimized in order to maximize theradiated power of a TWA section for a given value of |Vin|. Ga,eff stronglydepends on the plasma profile in front of the TWA. Moreover it also dependson the TWA geometry mainly due to its dependency on the selected k‖,max =∆Φ/Sz for which the radiated power spectrum Prad(k‖) is maximum. ∆Φ isthe mean phase dierence between adjacent straps and it is directly relatedto the choice of the frequency in the passband of the TWA section. At mid-band frequency f0 we have ∆Φ ≈ 75. The Zit value determines the powerPin fed to the TWA section for an input strap voltage amplitude |Vin| and actson the voltage decay along the TWA section by the product ZitGa,eff . Zit has
48
Travelling Wave Array
to be chosen as low as possible to reduce the voltage amplitude and increasethe eiciency of the TWA section. This means a high mutual coupling ratioM1/L and a small strap length lstr. Low L requires straps with large width2wz and high M1 requires small values of mid-strap inter-distance Sz . Acompromise has to be found between the contradictory request of small Szwith: (i) good voltage stando between adjacent straps, (ii) large strap widthto decreaseL and (iii) suiciently small |k‖,max| = ∆Φ/Sz value to maximizethe coupling. A short strap length is also incompatible with good coupling.This is the reason why, for increasing the eective strap length seen by theplasma, it could be proposed to cut a long strap in several grounded shortstraps having their currents in phase, like for the ITER antenna.
49

Chapter 3
Resonant Ring feeding
A traveling wave array (TWA) is a type of structure that can be used tocouple ICRF power to a reactor plasma [46, 47, 52]. It sustains a guided slowwave that travels along the structure due to the mutual coupling betweenelements and leaking power to the magnetised plasma. The power is injectedinto the first element and decreases while flowing from one element to theneighbouring one up to the last element where it is finally extracted. Thereare two possible feeding configurations for the TWA: not-recirculating andrecirculating. The former consists of an input line connected to a generatorand an output line connected to a dummy load that dumps the remainingpower, if any le, extracted from the structure. The laer consists of a ringcircuit that recirculates the remaining power back to the input [46, 52]. Thetwo configurations are shown in figure 3.1. The second option is best suitedfor an ICRF launcher for the following reasons. The ideal excitation spectrumis achieved with a homogeneous current distribution among all the radiatingelements of the launcher: all the strap currents have the same amplitudeand a definite phase dierence. This situation is achieved in a TWA onlywhen there are no losses, i.e. no power coupled to the plasma (and no ohmiclosses in the structure). When the power is actually coupled to the plasma,the phase dierence between consecutive straps is anyway maintained butthe current amplitude decreases from element to element due to the powercoupling to the plasma. In view of that, when the first feeding configuration isused, the amount of power that reaches the dummy load has to be the lowestpossible (ideally zero) to maximise the eiciency of the system. To achievethat, a large number of elements are necessary but only few of them havea significant current amplitude and thus contribute to the spectrum. Thisis a non optimal usage of the space inside the machine! On the contrary,if a considerable amount of power can be extracted from the structure a
51
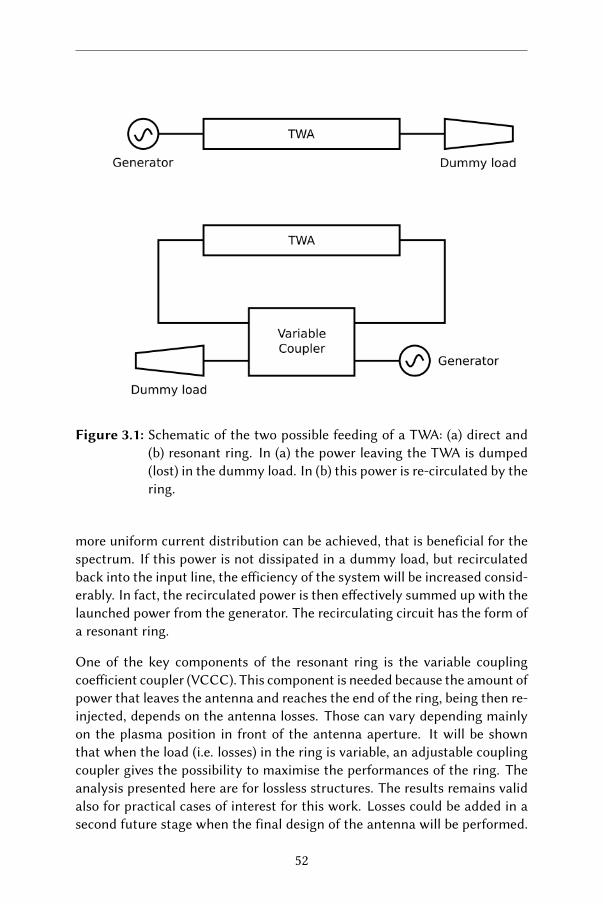
Figure 3.1: Schematic of the two possible feeding of a TWA: (a) direct and(b) resonant ring. In (a) the power leaving the TWA is dumped(lost) in the dummy load. In (b) this power is re-circulated by thering.
more uniform current distribution can be achieved, that is beneficial for thespectrum. If this power is not dissipated in a dummy load, but recirculatedback into the input line, the eiciency of the system will be increased consid-erably. In fact, the recirculated power is then eectively summed up with thelaunched power from the generator. The recirculating circuit has the form ofa resonant ring.
One of the key components of the resonant ring is the variable couplingcoeicient coupler (VCCC). This component is needed because the amount ofpower that leaves the antenna and reaches the end of the ring, being then re-injected, depends on the antenna losses. Those can vary depending mainlyon the plasma position in front of the antenna aperture. It will be shownthat when the load (i.e. losses) in the ring is variable, an adjustable couplingcoupler gives the possibility to maximise the performances of the ring. Theanalysis presented here are for lossless structures. The results remains validalso for practical cases of interest for this work. Losses could be added in asecond future stage when the final design of the antenna will be performed.
52
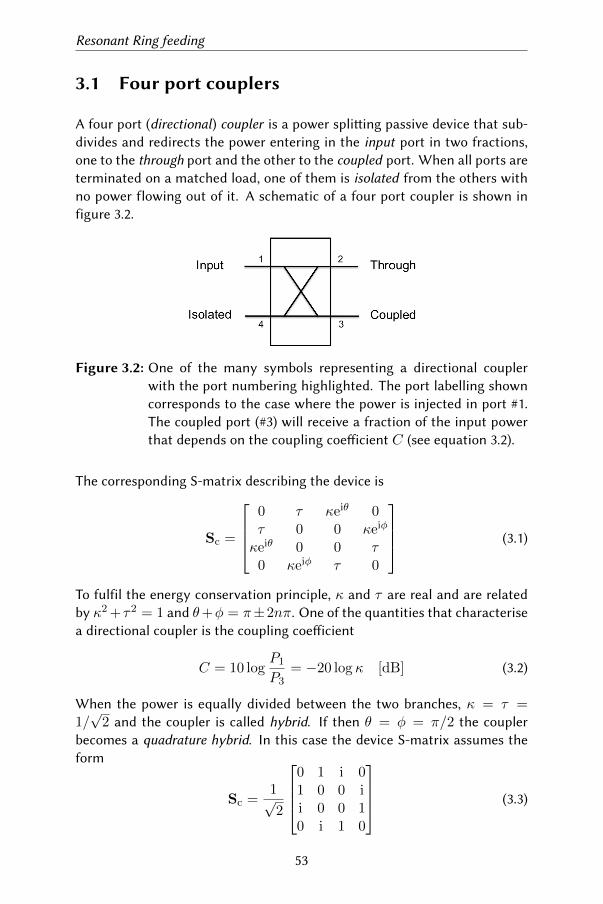
Resonant Ring feeding
3.1 Four port couplers
A four port (directional) coupler is a power spliing passive device that sub-divides and redirects the power entering in the input port in two fractions,one to the through port and the other to the coupled port. When all ports areterminated on a matched load, one of them is isolated from the others withno power flowing out of it. A schematic of a four port coupler is shown infigure 3.2.
Figure 3.2: One of the many symbols representing a directional couplerwith the port numbering highlighted. The port labelling showncorresponds to the case where the power is injected in port #1.The coupled port (#3) will receive a fraction of the input powerthat depends on the coupling coeicient C (see equation 3.2).
The corresponding S-matrix describing the device is
Sc =
0 τ κeiθ 0τ 0 0 κeiφ
κeiθ 0 0 τ0 κeiφ τ 0
(3.1)
To fulfil the energy conservation principle, κ and τ are real and are relatedby κ2 +τ2 = 1 and θ+φ = π±2nπ. One of the quantities that characterisea directional coupler is the coupling coeicient
C = 10 logP1
P3= −20 log κ [dB] (3.2)
When the power is equally divided between the two branches, κ = τ =1/√
2 and the coupler is called hybrid. If then θ = φ = π/2 the couplerbecomes a quadrature hybrid. In this case the device S-matrix assumes theform
Sc =1√2
0 1 i 01 0 0 ii 0 0 10 i 1 0
(3.3)
53
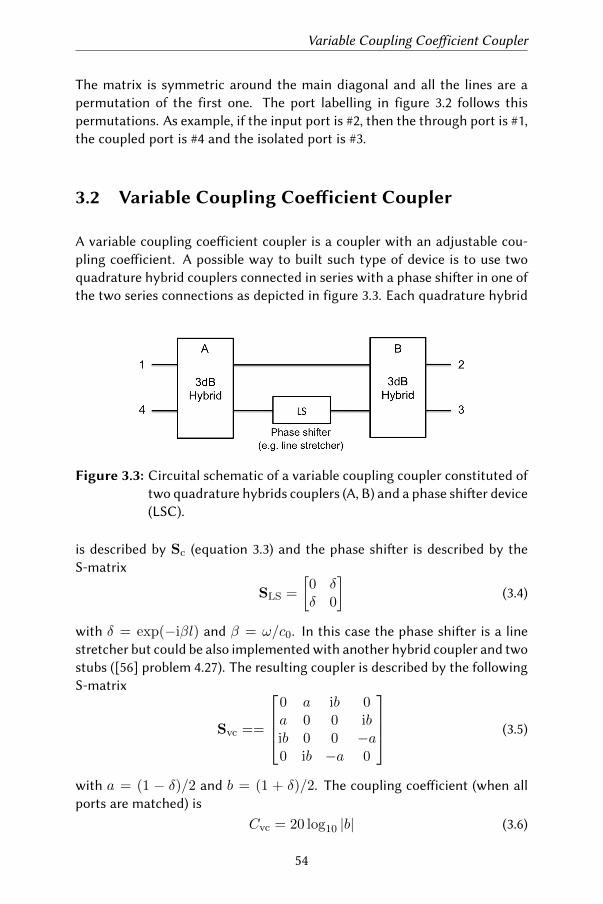
Variable Coupling Coeicient Coupler
The matrix is symmetric around the main diagonal and all the lines are apermutation of the first one. The port labelling in figure 3.2 follows thispermutations. As example, if the input port is #2, then the through port is #1,the coupled port is #4 and the isolated port is #3.
3.2 Variable Coupling Coeicient Coupler
A variable coupling coeicient coupler is a coupler with an adjustable cou-pling coeicient. A possible way to built such type of device is to use twoquadrature hybrid couplers connected in series with a phase shier in one ofthe two series connections as depicted in figure 3.3. Each quadrature hybrid
Figure 3.3: Circuital schematic of a variable coupling coupler constituted oftwo quadrature hybrids couplers (A, B) and a phase shier device(LSC).
is described by Sc (equation 3.3) and the phase shier is described by theS-matrix
SLS =
[0 δδ 0
](3.4)
with δ = exp(−iβl) and β = ω/c0. In this case the phase shier is a linestretcher but could be also implemented with another hybrid coupler and twostubs ([56] problem 4.27). The resulting coupler is described by the followingS-matrix
Svc ==
0 a ib 0a 0 0 ibib 0 0 −a0 ib −a 0
(3.5)
with a = (1 − δ)/2 and b = (1 + δ)/2. The coupling coeicient (when allports are matched) is
Cvc = 20 log10 |b| (3.6)
54
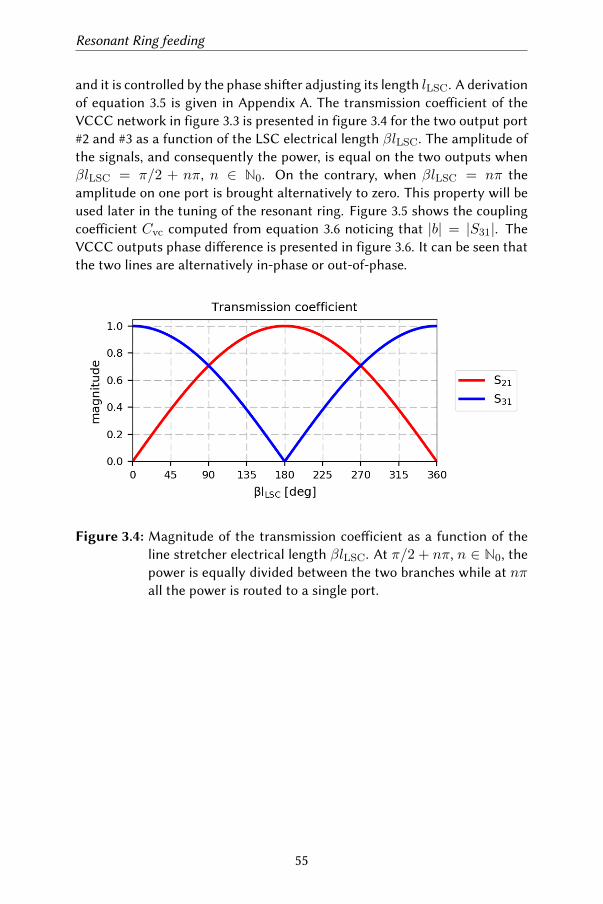
Resonant Ring feeding
and it is controlled by the phase shier adjusting its length lLSC. A derivationof equation 3.5 is given in Appendix A. The transmission coeicient of theVCCC network in figure 3.3 is presented in figure 3.4 for the two output port#2 and #3 as a function of the LSC electrical length βlLSC. The amplitude ofthe signals, and consequently the power, is equal on the two outputs whenβlLSC = π/2 + nπ, n ∈ N0. On the contrary, when βlLSC = nπ theamplitude on one port is brought alternatively to zero. This property will beused later in the tuning of the resonant ring. Figure 3.5 shows the couplingcoeicient Cvc computed from equation 3.6 noticing that |b| = |S31|. TheVCCC outputs phase dierence is presented in figure 3.6. It can be seen thatthe two lines are alternatively in-phase or out-of-phase.
Figure 3.4: Magnitude of the transmission coeicient as a function of theline stretcher electrical length βlLSC. At π/2 + nπ, n ∈ N0, thepower is equally divided between the two branches while at nπall the power is routed to a single port.
55
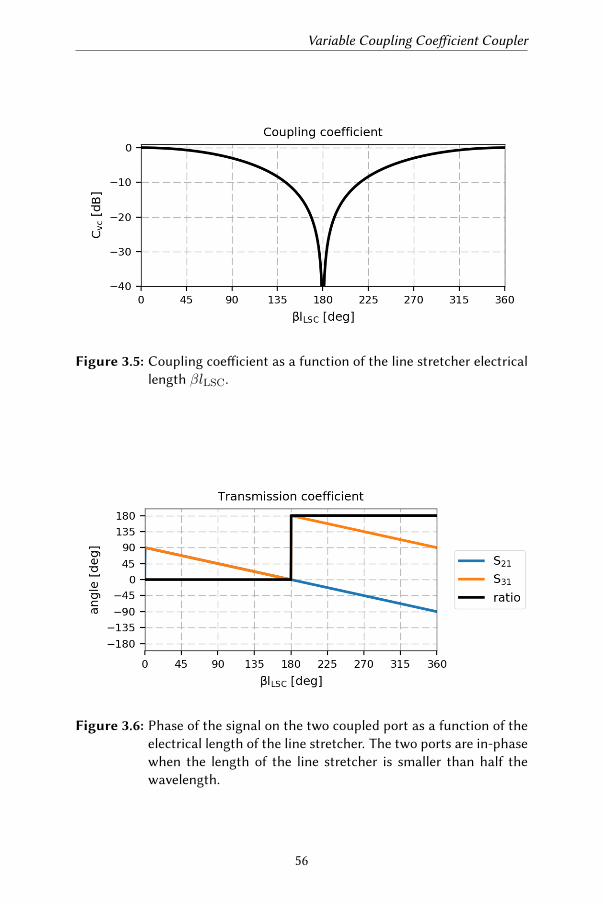
Variable Coupling Coeicient Coupler
Figure 3.5: Coupling coeicient as a function of the line stretcher electricallength βlLSC.
Figure 3.6: Phase of the signal on the two coupled port as a function of theelectrical length of the line stretcher. The two ports are in-phasewhen the length of the line stretcher is smaller than half thewavelength.
56
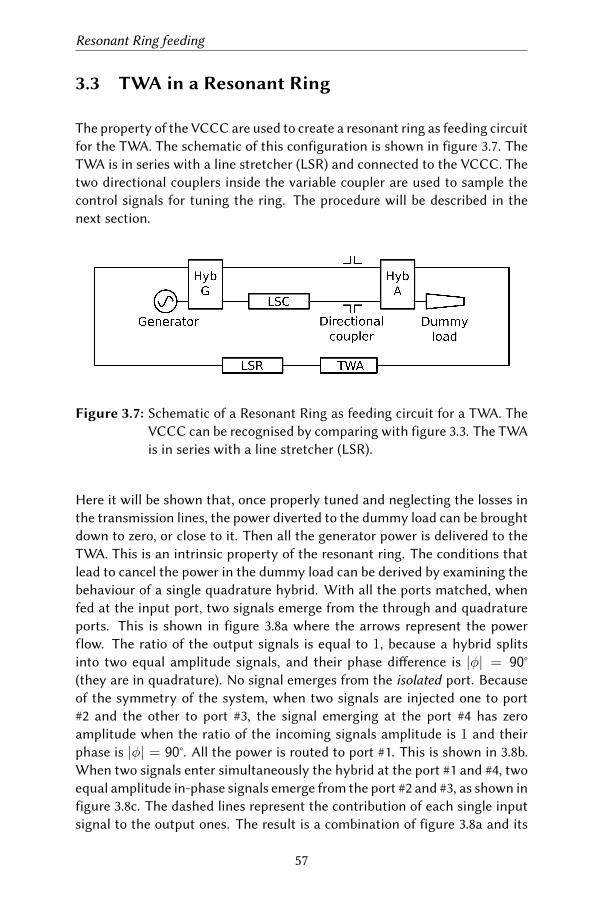
Resonant Ring feeding
3.3 TWA in a Resonant Ring
The property of the VCCC are used to create a resonant ring as feeding circuitfor the TWA. The schematic of this configuration is shown in figure 3.7. TheTWA is in series with a line stretcher (LSR) and connected to the VCCC. Thetwo directional couplers inside the variable coupler are used to sample thecontrol signals for tuning the ring. The procedure will be described in thenext section.
Figure 3.7: Schematic of a Resonant Ring as feeding circuit for a TWA. TheVCCC can be recognised by comparing with figure 3.3. The TWAis in series with a line stretcher (LSR).
Here it will be shown that, once properly tuned and neglecting the losses inthe transmission lines, the power diverted to the dummy load can be broughtdown to zero, or close to it. Then all the generator power is delivered to theTWA. This is an intrinsic property of the resonant ring. The conditions thatlead to cancel the power in the dummy load can be derived by examining thebehaviour of a single quadrature hybrid. With all the ports matched, whenfed at the input port, two signals emerge from the through and quadratureports. This is shown in figure 3.8a where the arrows represent the powerflow. The ratio of the output signals is equal to 1, because a hybrid splitsinto two equal amplitude signals, and their phase dierence is |φ| = 90°(they are in quadrature). No signal emerges from the isolated port. Becauseof the symmetry of the system, when two signals are injected one to port#2 and the other to port #3, the signal emerging at the port #4 has zeroamplitude when the ratio of the incoming signals amplitude is 1 and theirphase is |φ| = 90°. All the power is routed to port #1. This is shown in 3.8b.When two signals enter simultaneously the hybrid at the port #1 and #4, twoequal amplitude in-phase signals emerge from the port #2 and #3, as shown infigure 3.8c. The dashed lines represent the contribution of each single inputsignal to the output ones. The result is a combination of figure 3.8a and its
57
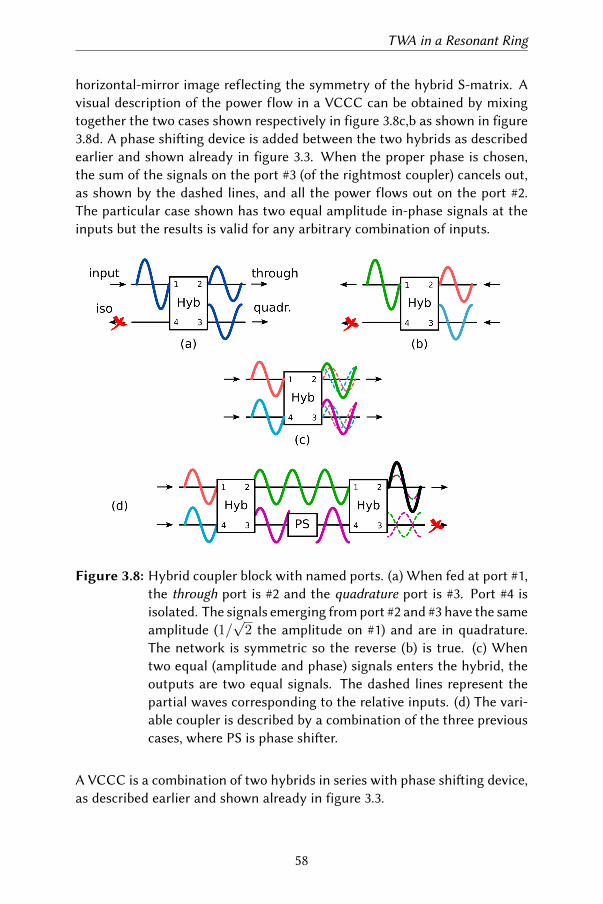
TWA in a Resonant Ring
horizontal-mirror image reflecting the symmetry of the hybrid S-matrix. Avisual description of the power flow in a VCCC can be obtained by mixingtogether the two cases shown respectively in figure 3.8c,b as shown in figure3.8d. A phase shiing device is added between the two hybrids as describedearlier and shown already in figure 3.3. When the proper phase is chosen,the sum of the signals on the port #3 (of the rightmost coupler) cancels out,as shown by the dashed lines, and all the power flows out on the port #2.The particular case shown has two equal amplitude in-phase signals at theinputs but the results is valid for any arbitrary combination of inputs.
Figure 3.8: Hybrid coupler block with named ports. (a) When fed at port #1,the through port is #2 and the quadrature port is #3. Port #4 isisolated. The signals emerging from port #2 and #3 have the sameamplitude (1/
√2 the amplitude on #1) and are in quadrature.
The network is symmetric so the reverse (b) is true. (c) Whentwo equal (amplitude and phase) signals enters the hybrid, theoutputs are two equal signals. The dashed lines represent thepartial waves corresponding to the relative inputs. (d) The vari-able coupler is described by a combination of the three previouscases, where PS is phase shier.
A VCCC is a combination of two hybrids in series with phase shiing device,as described earlier and shown already in figure 3.3.
58
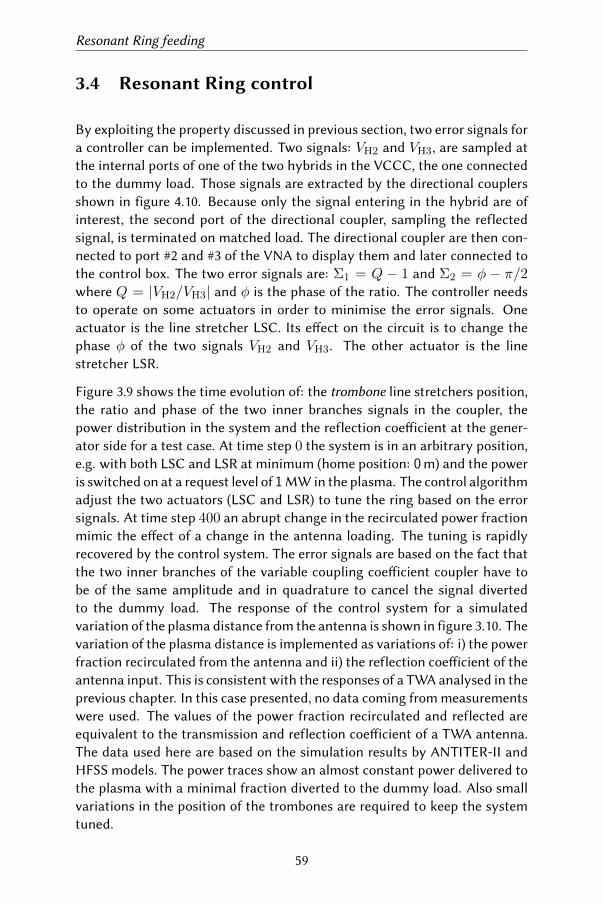
Resonant Ring feeding
3.4 Resonant Ring control
By exploiting the property discussed in previous section, two error signals fora controller can be implemented. Two signals: VH2 and VH3, are sampled atthe internal ports of one of the two hybrids in the VCCC, the one connectedto the dummy load. Those signals are extracted by the directional couplersshown in figure 4.10. Because only the signal entering in the hybrid are ofinterest, the second port of the directional coupler, sampling the reflectedsignal, is terminated on matched load. The directional coupler are then con-nected to port #2 and #3 of the VNA to display them and later connected tothe control box. The two error signals are: Σ1 = Q − 1 and Σ2 = φ − π/2where Q = |VH2/VH3| and φ is the phase of the ratio. The controller needsto operate on some actuators in order to minimise the error signals. Oneactuator is the line stretcher LSC. Its eect on the circuit is to change thephase φ of the two signals VH2 and VH3. The other actuator is the linestretcher LSR.
Figure 3.9 shows the time evolution of: the trombone line stretchers position,the ratio and phase of the two inner branches signals in the coupler, thepower distribution in the system and the reflection coeicient at the gener-ator side for a test case. At time step 0 the system is in an arbitrary position,e.g. with both LSC and LSR at minimum (home position: 0m) and the poweris switched on at a request level of 1MW in the plasma. The control algorithmadjust the two actuators (LSC and LSR) to tune the ring based on the errorsignals. At time step 400 an abrupt change in the recirculated power fractionmimic the eect of a change in the antenna loading. The tuning is rapidlyrecovered by the control system. The error signals are based on the fact thatthe two inner branches of the variable coupling coeicient coupler have tobe of the same amplitude and in quadrature to cancel the signal divertedto the dummy load. The response of the control system for a simulatedvariation of the plasma distance from the antenna is shown in figure 3.10. Thevariation of the plasma distance is implemented as variations of: i) the powerfraction recirculated from the antenna and ii) the reflection coeicient of theantenna input. This is consistent with the responses of a TWA analysed in theprevious chapter. In this case presented, no data coming from measurementswere used. The values of the power fraction recirculated and reflected areequivalent to the transmission and reflection coeicient of a TWA antenna.The data used here are based on the simulation results by ANTITER-II andHFSS models. The power traces show an almost constant power delivered tothe plasma with a minimal fraction diverted to the dummy load. Also smallvariations in the position of the trombones are required to keep the systemtuned.
59
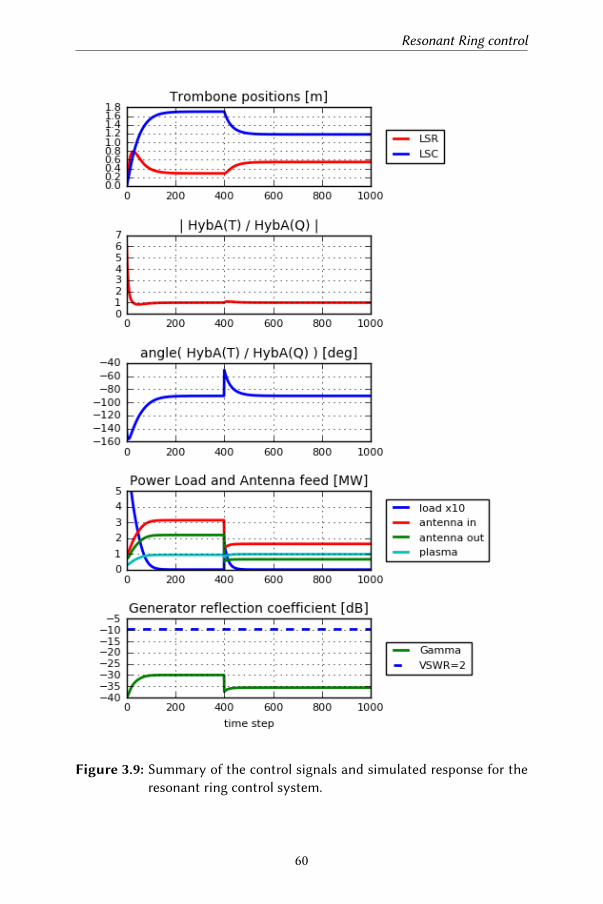
Resonant Ring control
Figure 3.9: Summary of the control signals and simulated response for theresonant ring control system.
60
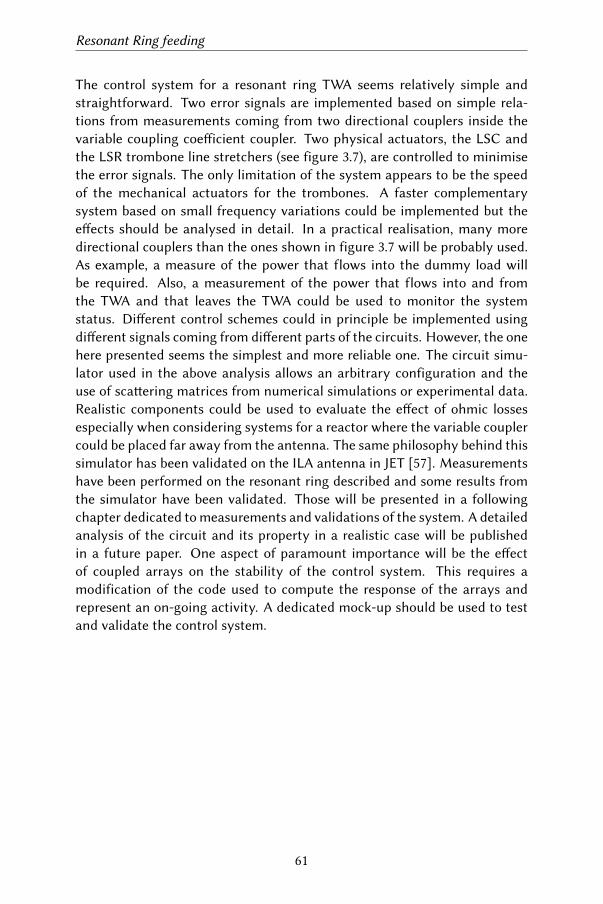
Resonant Ring feeding
The control system for a resonant ring TWA seems relatively simple andstraightforward. Two error signals are implemented based on simple rela-tions from measurements coming from two directional couplers inside thevariable coupling coeicient coupler. Two physical actuators, the LSC andthe LSR trombone line stretchers (see figure 3.7), are controlled to minimisethe error signals. The only limitation of the system appears to be the speedof the mechanical actuators for the trombones. A faster complementarysystem based on small frequency variations could be implemented but theeects should be analysed in detail. In a practical realisation, many moredirectional couplers than the ones shown in figure 3.7 will be probably used.As example, a measure of the power that flows into the dummy load willbe required. Also, a measurement of the power that flows into and fromthe TWA and that leaves the TWA could be used to monitor the systemstatus. Dierent control schemes could in principle be implemented usingdierent signals coming from dierent parts of the circuits. However, the onehere presented seems the simplest and more reliable one. The circuit simu-lator used in the above analysis allows an arbitrary configuration and theuse of scaering matrices from numerical simulations or experimental data.Realistic components could be used to evaluate the eect of ohmic lossesespecially when considering systems for a reactor where the variable couplercould be placed far away from the antenna. The same philosophy behind thissimulator has been validated on the ILA antenna in JET [57]. Measurementshave been performed on the resonant ring described and some results fromthe simulator have been validated. Those will be presented in a followingchapter dedicated to measurements and validations of the system. A detailedanalysis of the circuit and its property in a realistic case will be publishedin a future paper. One aspect of paramount importance will be the eectof coupled arrays on the stability of the control system. This requires amodification of the code used to compute the response of the arrays andrepresent an on-going activity. A dedicated mock-up should be used to testand validate the control system.
61
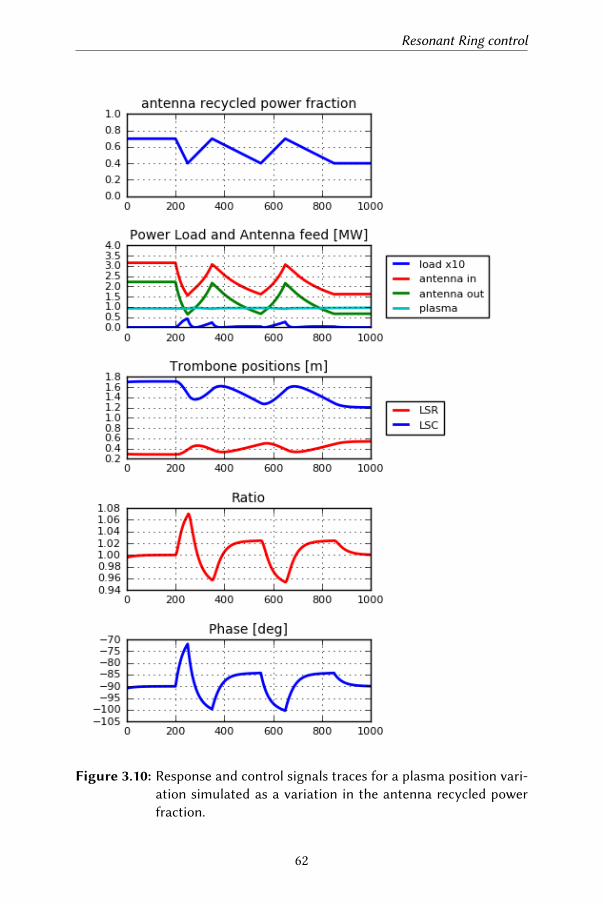
Resonant Ring control
Figure 3.10: Response and control signals traces for a plasma position vari-ation simulated as a variation in the antenna recycled powerfraction.
62
Resonant Ring feeding
3.5 Comparison between dierent feeding schemes
Three dierent feeding cases are analysed: (i) an array with all elementsfed, (ii) an array with periodic conventional feeding and (iii) an array withresonant ring recirculation feeding system. The first case is the one withthe best possible performances although with the drawback of requiring alarge number of mutually coupled feeding lines. For the second case thedependency of the response of the structure with dierent relative phasingof the generators is analysed and the power capabilities are studied. In theend an array fed with one resonant ring is compared to the traveling wavearray (TWA) and a general case of two consecutive resonant rings is stud-ied. The discussion and the results obtained in what follows could be easilyextrapolated to an arbitrary number of arrays and radiating elements for anarray. The procedure to compute the array impedance matrix is similar if notequal to the one described in the previous chapter.
3.5.1 Simulation parameters
All the three cases analysed are based on an array of an arbitrary number ofelements, e.g. Nstr = 28. This system can be described by a predominantlydiagonal matrix. The system is symmetric, thus some elements at the upperright and lower le corners are non-zero. Here, for simplicity, only the mutualcoupling with the first two neighbouring straps are considered. Exploitingthe symmetry of the system means that all values of the self-inductanceLi =L and mutual couplingsMi+1 = M1,Mi+2 = M2 are respectively the same,for i = 1, .., Nstr, and all other elements of the strap impedance matrix Zs
are equal to zero. This assumption is valid only in the case where the plasmais axisymmetric, thus loading the antenna in the same way everywhere. Notilting of the magnetic field is considered. At a frequency f0 = 50MHz, beingω0 = 2πf0 the angular frequency, ω0L = 56Ω, ω0M1 = 17.3Ω and ω0M2 =7.25Ω. Those values are representative of the typical structures used andrepresents somewhat a mean value of the results obtained by ANTITER-IIfor a an equivalent structure. A resistance Ri = R = 2.5Ω is added in seriesto each strap to account, in an simplified way, for the coupling of power to theplasma. This arbitrary value is chosen as reference to compare the dierentcases and it is not consistently derived from a coupling code (e.g. ANTITER-II). The array could be configured as comb-line with a tuning reactance oneach strap and can be described by an array impedance matrix Za such that1/Za = 1/Zs + 1/Zc where 1/Zc is the admiance matrix of the tuningcapacitors. The details of the modelling procedure are explained the previouschapter. It is worth to remind that, in its passband, the comb-line acts as
63
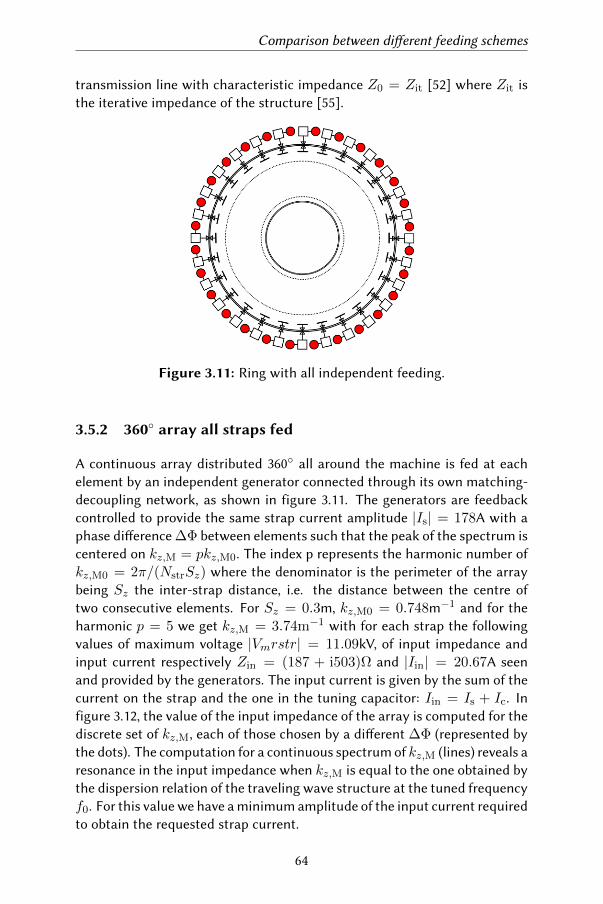
Comparison between dierent feeding schemes
transmission line with characteristic impedance Z0 = Zit [52] where Zit isthe iterative impedance of the structure [55].
Figure 3.11: Ring with all independent feeding.
3.5.2 360 array all straps fed
A continuous array distributed 360 all around the machine is fed at eachelement by an independent generator connected through its own matching-decoupling network, as shown in figure 3.11. The generators are feedbackcontrolled to provide the same strap current amplitude |Is| = 178A with aphase dierence ∆Φ between elements such that the peak of the spectrum iscentered on kz,M = pkz,M0. The index p represents the harmonic number ofkz,M0 = 2π/(NstrSz) where the denominator is the perimeter of the arraybeing Sz the inter-strap distance, i.e. the distance between the centre oftwo consecutive elements. For Sz = 0.3m, kz,M0 = 0.748m−1 and for theharmonic p = 5 we get kz,M = 3.74m−1 with for each strap the followingvalues of maximum voltage |Vmrstr| = 11.09kV, of input impedance andinput current respectively Zin = (187 + i503)Ω and |Iin| = 20.67A seenand provided by the generators. The input current is given by the sum of thecurrent on the strap and the one in the tuning capacitor: Iin = Is + Ic. Infigure 3.12, the value of the input impedance of the array is computed for thediscrete set of kz,M, each of those chosen by a dierent ∆Φ (represented bythe dots). The computation for a continuous spectrum of kz,M (lines) reveals aresonance in the input impedance when kz,M is equal to the one obtained bythe dispersion relation of the traveling wave structure at the tuned frequencyf0. For this value we have a minimum amplitude of the input current requiredto obtain the requested strap current.
64
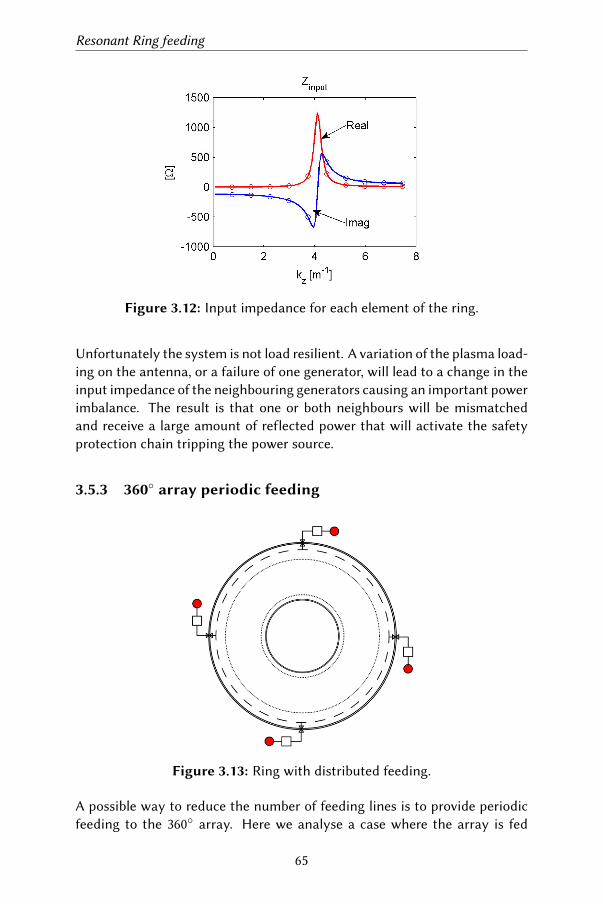
Resonant Ring feeding
Figure 3.12: Input impedance for each element of the ring.
Unfortunately the system is not load resilient. A variation of the plasma load-ing on the antenna, or a failure of one generator, will lead to a change in theinput impedance of the neighbouring generators causing an important powerimbalance. The result is that one or both neighbours will be mismatchedand receive a large amount of reflected power that will activate the safetyprotection chain tripping the power source.
3.5.3 360 array periodic feeding
Figure 3.13: Ring with distributed feeding.
A possible way to reduce the number of feeding lines is to provide periodicfeeding to the 360 array. Here we analyse a case where the array is fed
65
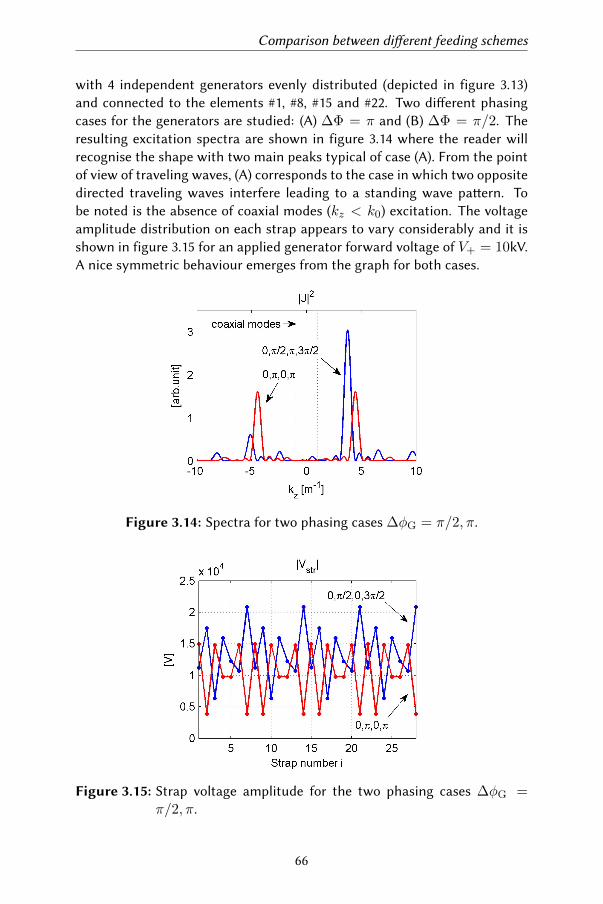
Comparison between dierent feeding schemes
with 4 independent generators evenly distributed (depicted in figure 3.13)and connected to the elements #1, #8, #15 and #22. Two dierent phasingcases for the generators are studied: (A) ∆Φ = π and (B) ∆Φ = π/2. Theresulting excitation spectra are shown in figure 3.14 where the reader willrecognise the shape with two main peaks typical of case (A). From the pointof view of traveling waves, (A) corresponds to the case in which two oppositedirected traveling waves interfere leading to a standing wave paern. Tobe noted is the absence of coaxial modes (kz < k0) excitation. The voltageamplitude distribution on each strap appears to vary considerably and it isshown in figure 3.15 for an applied generator forward voltage of V+ = 10kV.A nice symmetric behaviour emerges from the graph for both cases.
Figure 3.14: Spectra for two phasing cases ∆φG = π/2, π.
Figure 3.15: Strap voltage amplitude for the two phasing cases ∆φG =π/2, π.
66
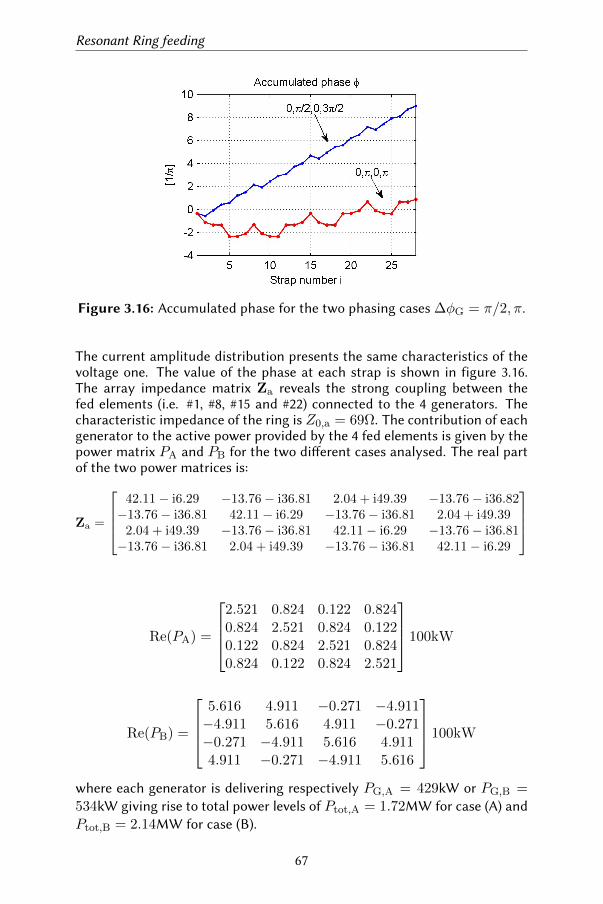
Resonant Ring feeding
Figure 3.16: Accumulated phase for the two phasing cases ∆φG = π/2, π.
The current amplitude distribution presents the same characteristics of thevoltage one. The value of the phase at each strap is shown in figure 3.16.The array impedance matrix Za reveals the strong coupling between thefed elements (i.e. #1, #8, #15 and #22) connected to the 4 generators. Thecharacteristic impedance of the ring is Z0,a = 69Ω. The contribution of eachgenerator to the active power provided by the 4 fed elements is given by thepower matrix PA and PB for the two dierent cases analysed. The real partof the two power matrices is:
Za =
42.11− i6.29 −13.76− i36.81 2.04 + i49.39 −13.76− i36.82−13.76− i36.81 42.11− i6.29 −13.76− i36.81 2.04 + i49.39
2.04 + i49.39 −13.76− i36.81 42.11− i6.29 −13.76− i36.81−13.76− i36.81 2.04 + i49.39 −13.76− i36.81 42.11− i6.29
Re(PA) =
2.521 0.824 0.122 0.8240.824 2.521 0.824 0.1220.122 0.824 2.521 0.8240.824 0.122 0.824 2.521
100kW
Re(PB) =
5.616 4.911 −0.271 −4.911−4.911 5.616 4.911 −0.271−0.271 −4.911 5.616 4.9114.911 −0.271 −4.911 5.616
100kW
where each generator is delivering respectively PG,A = 429kW or PG,B =534kW giving rise to total power levels of Ptot,A = 1.72MW for case (A) andPtot,B = 2.14MW for case (B).
67
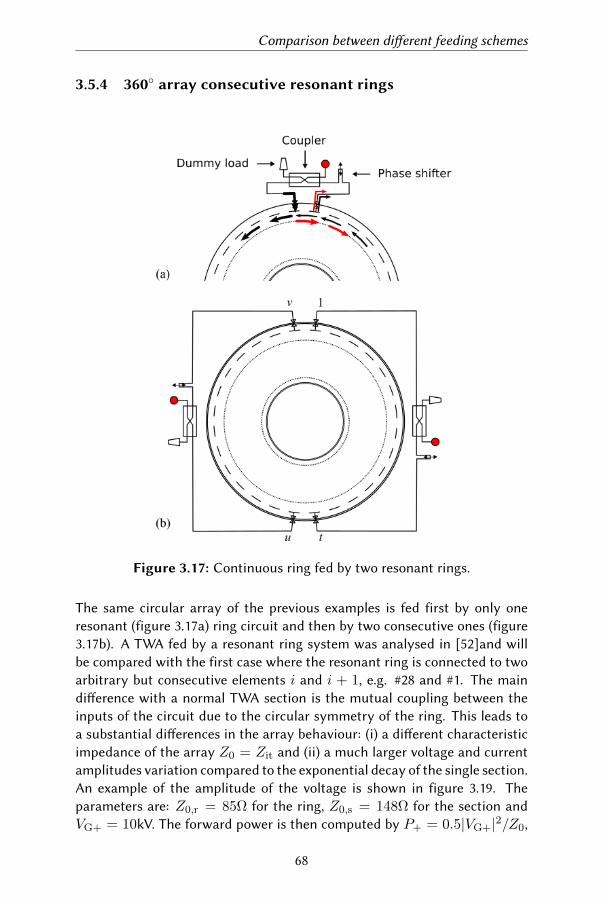
Comparison between dierent feeding schemes
3.5.4 360 array consecutive resonant rings
Figure 3.17: Continuous ring fed by two resonant rings.
The same circular array of the previous examples is fed first by only oneresonant (figure 3.17a) ring circuit and then by two consecutive ones (figure3.17b). A TWA fed by a resonant ring system was analysed in [52]and willbe compared with the first case where the resonant ring is connected to twoarbitrary but consecutive elements i and i + 1, e.g. #28 and #1. The maindierence with a normal TWA section is the mutual coupling between theinputs of the circuit due to the circular symmetry of the ring. This leads toa substantial dierences in the array behaviour: (i) a dierent characteristicimpedance of the array Z0 = Zit and (ii) a much larger voltage and currentamplitudes variation compared to the exponential decay of the single section.An example of the amplitude of the voltage is shown in figure 3.19. Theparameters are: Z0,r = 85Ω for the ring, Z0,s = 148Ω for the section andVG+ = 10kV. The forward power is then computed by P+ = 0.5|VG+|2/Z0,
68
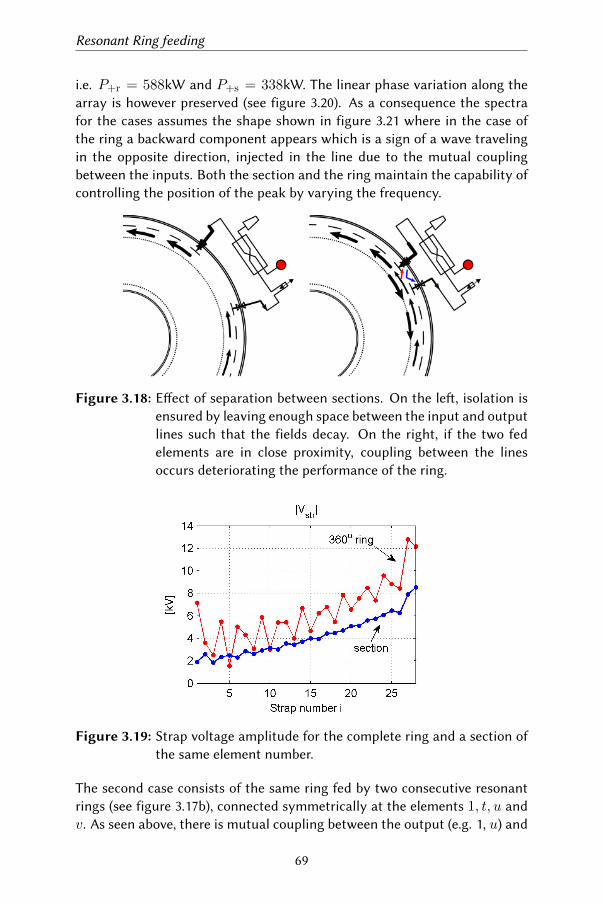
Resonant Ring feeding
i.e. P+r = 588kW and P+s = 338kW. The linear phase variation along thearray is however preserved (see figure 3.20). As a consequence the spectrafor the cases assumes the shape shown in figure 3.21 where in the case ofthe ring a backward component appears which is a sign of a wave travelingin the opposite direction, injected in the line due to the mutual couplingbetween the inputs. Both the section and the ring maintain the capability ofcontrolling the position of the peak by varying the frequency.
Figure 3.18: Eect of separation between sections. On the le, isolation isensured by leaving enough space between the input and outputlines such that the fields decay. On the right, if the two fedelements are in close proximity, coupling between the linesoccurs deteriorating the performance of the ring.
Figure 3.19: Strap voltage amplitude for the complete ring and a section ofthe same element number.
The second case consists of the same ring fed by two consecutive resonantrings (see figure 3.17b), connected symmetrically at the elements 1, t, u andv. As seen above, there is mutual coupling between the output (e.g. 1, u) and
69
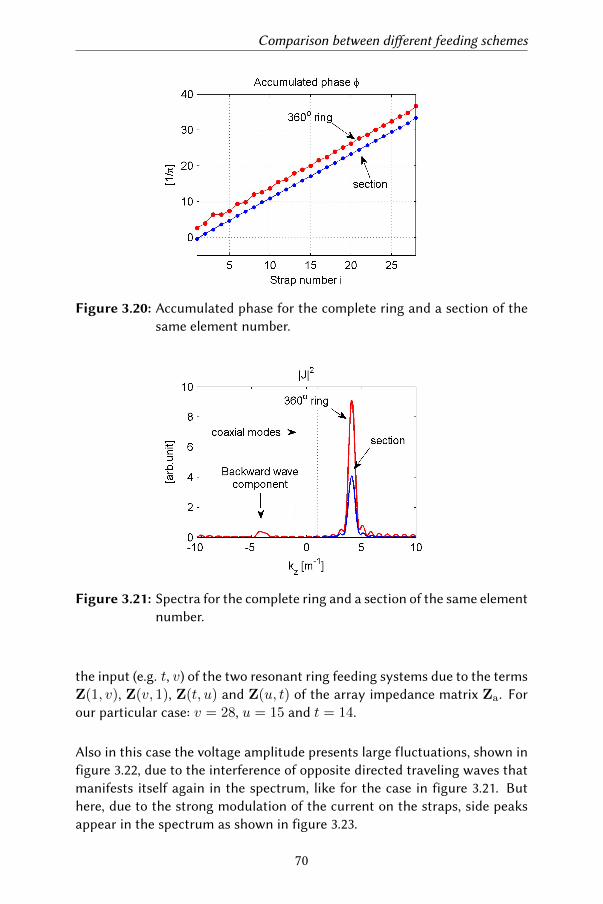
Comparison between dierent feeding schemes
Figure 3.20: Accumulated phase for the complete ring and a section of thesame element number.
Figure 3.21: Spectra for the complete ring and a section of the same elementnumber.
the input (e.g. t, v) of the two resonant ring feeding systems due to the termsZ(1, v), Z(v, 1), Z(t, u) and Z(u, t) of the array impedance matrix Za. Forour particular case: v = 28, u = 15 and t = 14.
Also in this case the voltage amplitude presents large fluctuations, shown infigure 3.22, due to the interference of opposite directed traveling waves thatmanifests itself again in the spectrum, like for the case in figure 3.21. Buthere, due to the strong modulation of the current on the straps, side peaksappear in the spectrum as shown in figure 3.23.
70
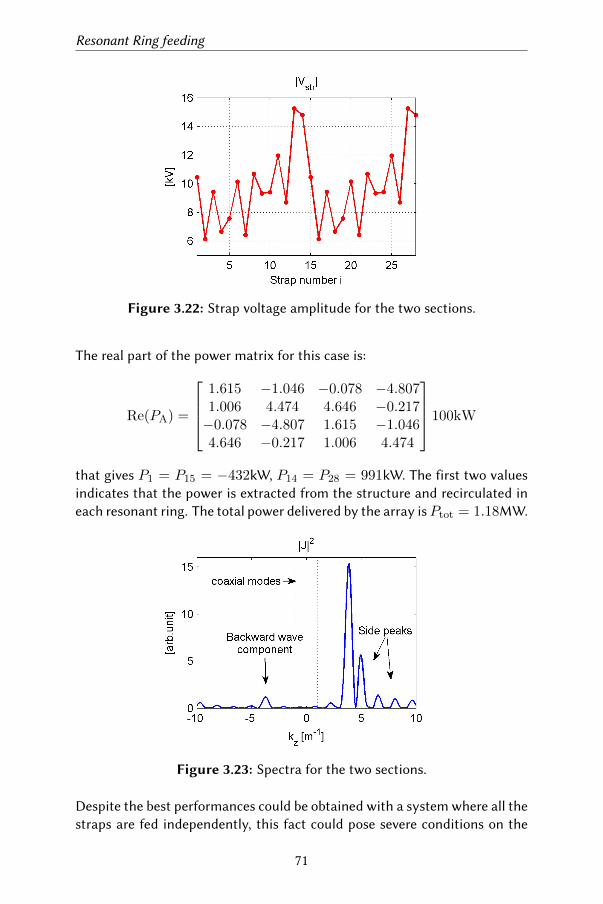
Resonant Ring feeding
Figure 3.22: Strap voltage amplitude for the two sections.
The real part of the power matrix for this case is:
Re(PA) =
1.615 −1.046 −0.078 −4.8071.006 4.474 4.646 −0.217−0.078 −4.807 1.615 −1.0464.646 −0.217 1.006 4.474
100kW
that gives P1 = P15 = −432kW, P14 = P28 = 991kW. The first two valuesindicates that the power is extracted from the structure and recirculated ineach resonant ring. The total power delivered by the array isPtot = 1.18MW.
Figure 3.23: Spectra for the two sections.
Despite the best performances could be obtained with a system where all thestraps are fed independently, this fact could pose severe conditions on the
71
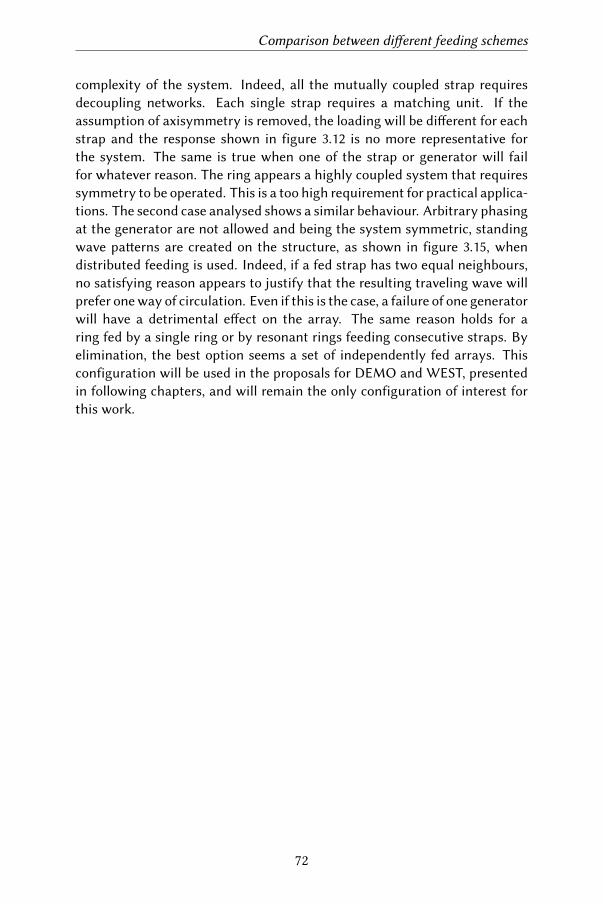
Comparison between dierent feeding schemes
complexity of the system. Indeed, all the mutually coupled strap requiresdecoupling networks. Each single strap requires a matching unit. If theassumption of axisymmetry is removed, the loading will be dierent for eachstrap and the response shown in figure 3.12 is no more representative forthe system. The same is true when one of the strap or generator will failfor whatever reason. The ring appears a highly coupled system that requiressymmetry to be operated. This is a too high requirement for practical applica-tions. The second case analysed shows a similar behaviour. Arbitrary phasingat the generator are not allowed and being the system symmetric, standingwave paerns are created on the structure, as shown in figure 3.15, whendistributed feeding is used. Indeed, if a fed strap has two equal neighbours,no satisfying reason appears to justify that the resulting traveling wave willprefer one way of circulation. Even if this is the case, a failure of one generatorwill have a detrimental eect on the array. The same reason holds for aring fed by a single ring or by resonant rings feeding consecutive straps. Byelimination, the best option seems a set of independently fed arrays. Thisconfiguration will be used in the proposals for DEMO and WEST, presentedin following chapters, and will remain the only configuration of interest forthis work.
72
Chapter 4
Measurements
In order to verify the properties of the dierent building blocks described inthe previous chapters, the various components of the TWA + resonant ringsystem are assembled in a testbed and characterised by RF measurementswith a vector network analyser (VNA) Rhode&Schwarz [58] ZVT-8. First avariable coupling coeicient coupler is assembled using commercially avail-able components. Then a resonant ring is assembled using the VCCC and acombination of line stretcher and aenuators. Finally a TWA is inserted in theresonant ring, replacing the aenuator, obtaining a complete ICRF systemmock-up. The scale of this mock-up is 1 : 4. The frequency is then scaled upby a factor 4 to maintain the same RF properties. A water tank is used tosimulate the eect of the plasma loading on the antenna and to characterisethe response of the ring. Two of the main commercial components used aremeasured separately before being used in the circuit: the hybrid couplerand the directional coupler. Dierent TWA models were built but only thefinal one is shown here. It is the one closest to the system proposed in thefollowing chapters.
4.1 Hybrid coupler
The device IPP-2066 from Innovative Power Products [59] is a 90 Hybridcoupler with a bandwidth 100÷ 500MHz. A schematic of the component isshown in figure 4.1 with the port ordering as they are connected to the VNA.The hybrid characteristic corresponds to the two output branches (port #2and port #3) having an equally divided power at the level of −3 dB w.r.t. theinput signal (port #1). The measured response curves are shown in figure4.2. Indeed a somewhat flat equal response for the S-parameters S21 and
73
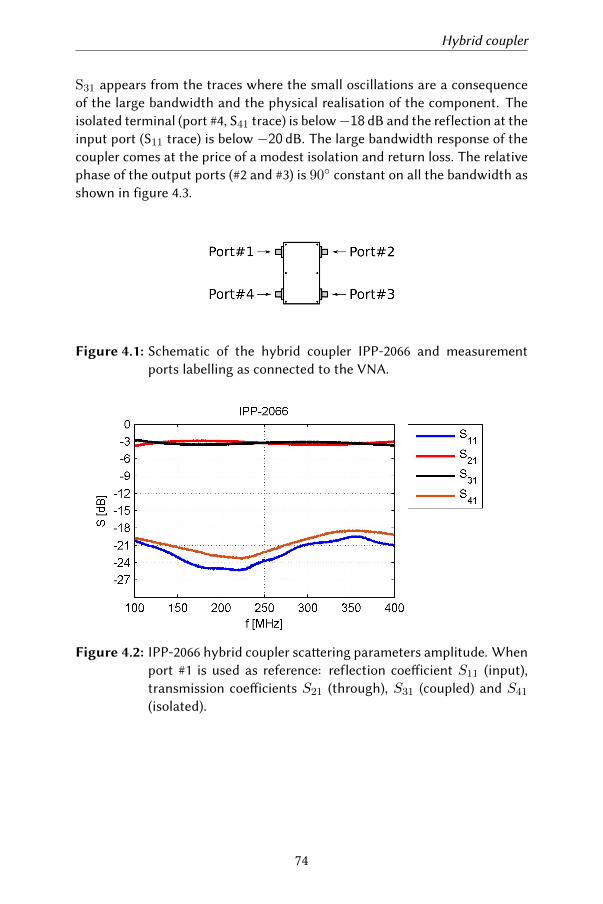
Hybrid coupler
S31 appears from the traces where the small oscillations are a consequenceof the large bandwidth and the physical realisation of the component. Theisolated terminal (port #4, S41 trace) is below−18 dB and the reflection at theinput port (S11 trace) is below −20 dB. The large bandwidth response of thecoupler comes at the price of a modest isolation and return loss. The relativephase of the output ports (#2 and #3) is 90 constant on all the bandwidth asshown in figure 4.3.
Figure 4.1: Schematic of the hybrid coupler IPP-2066 and measurementports labelling as connected to the VNA.
Figure 4.2: IPP-2066 hybrid coupler scaering parameters amplitude. Whenport #1 is used as reference: reflection coeicient S11 (input),transmission coeicients S21 (through), S31 (coupled) and S41
(isolated).
74
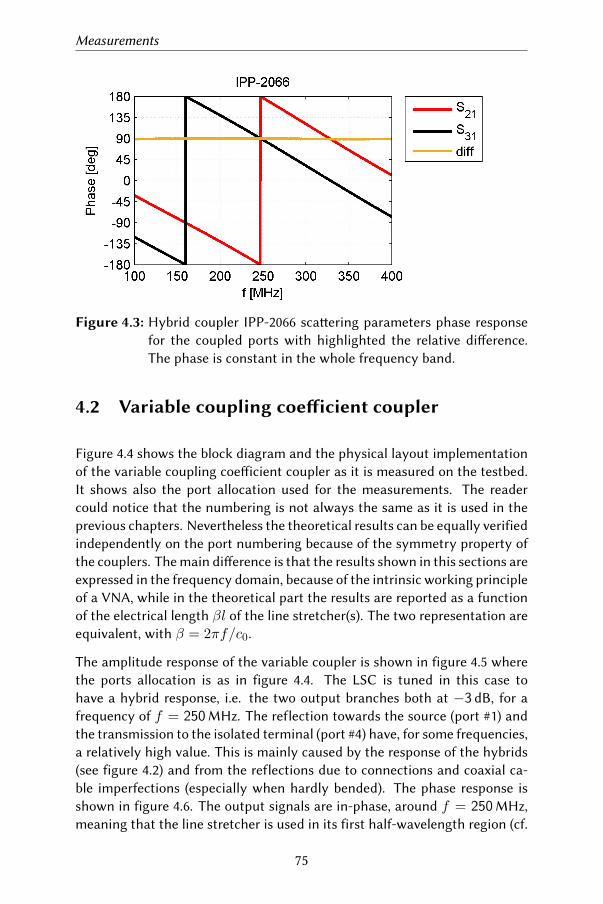
Measurements
Figure 4.3: Hybrid coupler IPP-2066 scaering parameters phase responsefor the coupled ports with highlighted the relative dierence.The phase is constant in the whole frequency band.
4.2 Variable coupling coeicient coupler
Figure 4.4 shows the block diagram and the physical layout implementationof the variable coupling coeicient coupler as it is measured on the testbed.It shows also the port allocation used for the measurements. The readercould notice that the numbering is not always the same as it is used in theprevious chapters. Nevertheless the theoretical results can be equally verifiedindependently on the port numbering because of the symmetry property ofthe couplers. The main dierence is that the results shown in this sections areexpressed in the frequency domain, because of the intrinsic working principleof a VNA, while in the theoretical part the results are reported as a functionof the electrical length βl of the line stretcher(s). The two representation areequivalent, with β = 2πf/c0.
The amplitude response of the variable coupler is shown in figure 4.5 wherethe ports allocation is as in figure 4.4. The LSC is tuned in this case tohave a hybrid response, i.e. the two output branches both at −3 dB, for afrequency of f = 250MHz. The reflection towards the source (port #1) andthe transmission to the isolated terminal (port #4) have, for some frequencies,a relatively high value. This is mainly caused by the response of the hybrids(see figure 4.2) and from the reflections due to connections and coaxial ca-ble imperfections (especially when hardly bended). The phase response isshown in figure 4.6. The output signals are in-phase, around f = 250MHz,meaning that the line stretcher is used in its first half-wavelength region (cf.
75
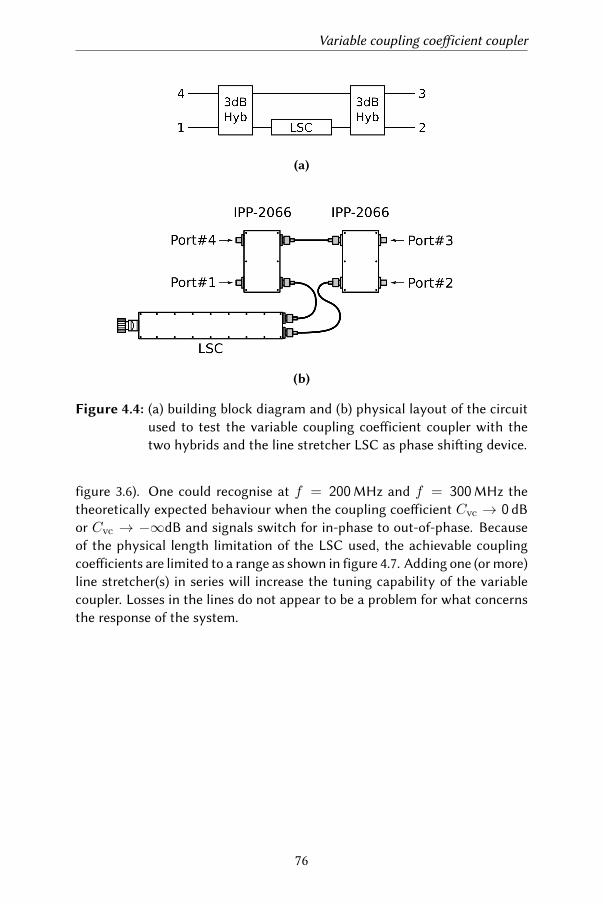
Variable coupling coeicient coupler
(a)
(b)
Figure 4.4: (a) building block diagram and (b) physical layout of the circuitused to test the variable coupling coeicient coupler with thetwo hybrids and the line stretcher LSC as phase shiing device.
figure 3.6). One could recognise at f = 200MHz and f = 300MHz thetheoretically expected behaviour when the coupling coeicient Cvc → 0 dBor Cvc → −∞dB and signals switch for in-phase to out-of-phase. Becauseof the physical length limitation of the LSC used, the achievable couplingcoeicients are limited to a range as shown in figure 4.7. Adding one (or more)line stretcher(s) in series will increase the tuning capability of the variablecoupler. Losses in the lines do not appear to be a problem for what concernsthe response of the system.
76
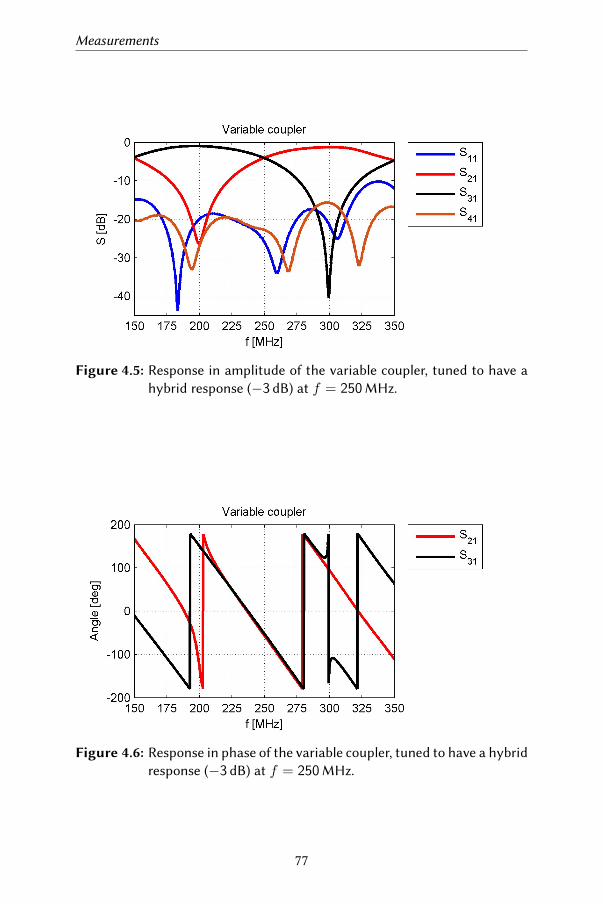
Measurements
Figure 4.5: Response in amplitude of the variable coupler, tuned to have ahybrid response (−3 dB) at f = 250MHz.
Figure 4.6: Response in phase of the variable coupler, tuned to have a hybridresponse (−3 dB) at f = 250MHz.
77
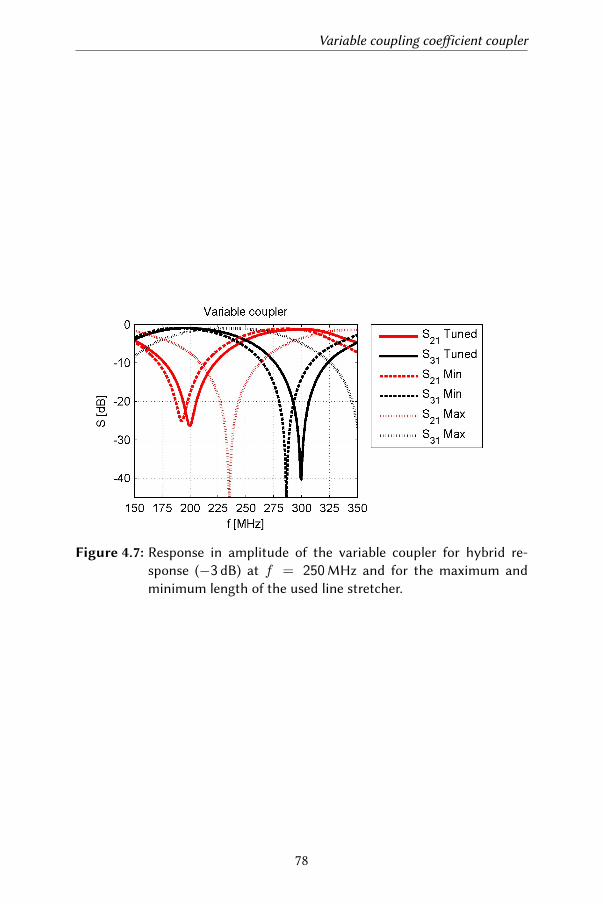
Variable coupling coeicient coupler
Figure 4.7: Response in amplitude of the variable coupler for hybrid re-sponse (−3 dB) at f = 250MHz and for the maximum andminimum length of the used line stretcher.
78
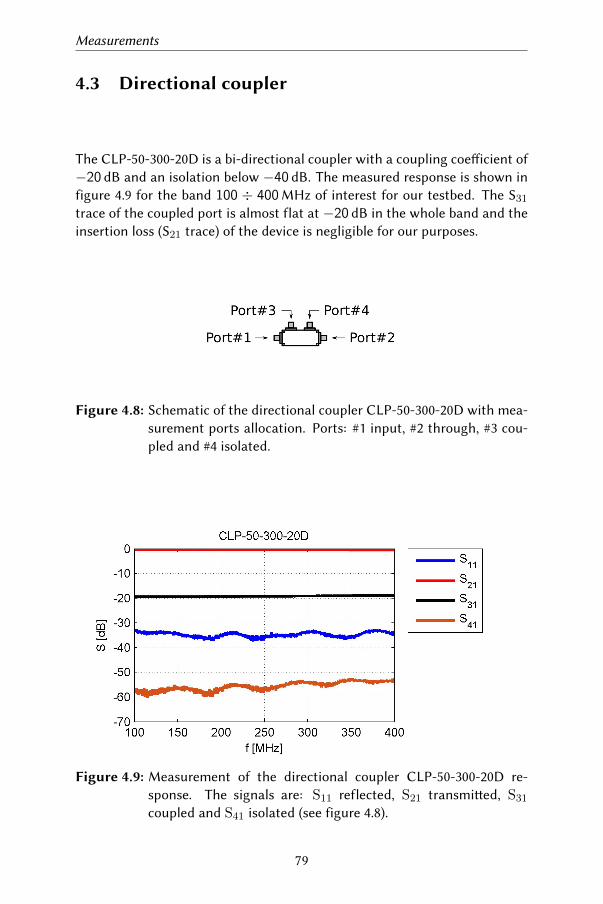
Measurements
4.3 Directional coupler
The CLP-50-300-20D is a bi-directional coupler with a coupling coeicient of−20 dB and an isolation below −40 dB. The measured response is shown infigure 4.9 for the band 100 ÷ 400MHz of interest for our testbed. The S31
trace of the coupled port is almost flat at −20 dB in the whole band and theinsertion loss (S21 trace) of the device is negligible for our purposes.
Figure 4.8: Schematic of the directional coupler CLP-50-300-20D with mea-surement ports allocation. Ports: #1 input, #2 through, #3 cou-pled and #4 isolated.
Figure 4.9: Measurement of the directional coupler CLP-50-300-20D re-sponse. The signals are: S11 reflected, S21 transmied, S31
coupled and S41 isolated (see figure 4.8).
79
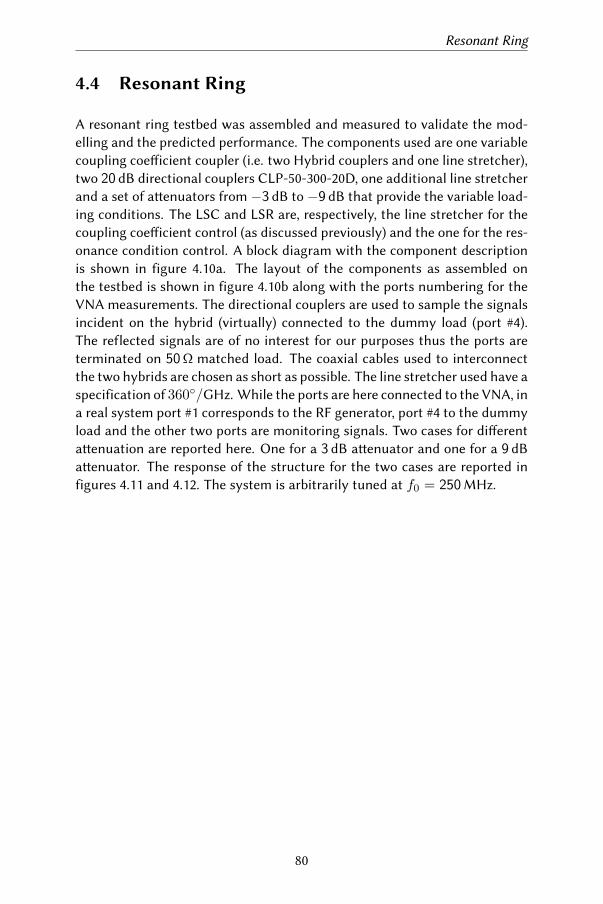
Resonant Ring
4.4 Resonant Ring
A resonant ring testbed was assembled and measured to validate the mod-elling and the predicted performance. The components used are one variablecoupling coeicient coupler (i.e. two Hybrid couplers and one line stretcher),two 20 dB directional couplers CLP-50-300-20D, one additional line stretcherand a set of aenuators from−3 dB to−9 dB that provide the variable load-ing conditions. The LSC and LSR are, respectively, the line stretcher for thecoupling coeicient control (as discussed previously) and the one for the res-onance condition control. A block diagram with the component descriptionis shown in figure 4.10a. The layout of the components as assembled onthe testbed is shown in figure 4.10b along with the ports numbering for theVNA measurements. The directional couplers are used to sample the signalsincident on the hybrid (virtually) connected to the dummy load (port #4).The reflected signals are of no interest for our purposes thus the ports areterminated on 50Ω matched load. The coaxial cables used to interconnectthe two hybrids are chosen as short as possible. The line stretcher used have aspecification of 360/GHz. While the ports are here connected to the VNA, ina real system port #1 corresponds to the RF generator, port #4 to the dummyload and the other two ports are monitoring signals. Two cases for dierentaenuation are reported here. One for a 3 dB aenuator and one for a 9 dBaenuator. The response of the structure for the two cases are reported infigures 4.11 and 4.12. The system is arbitrarily tuned at f0 = 250MHz.
80
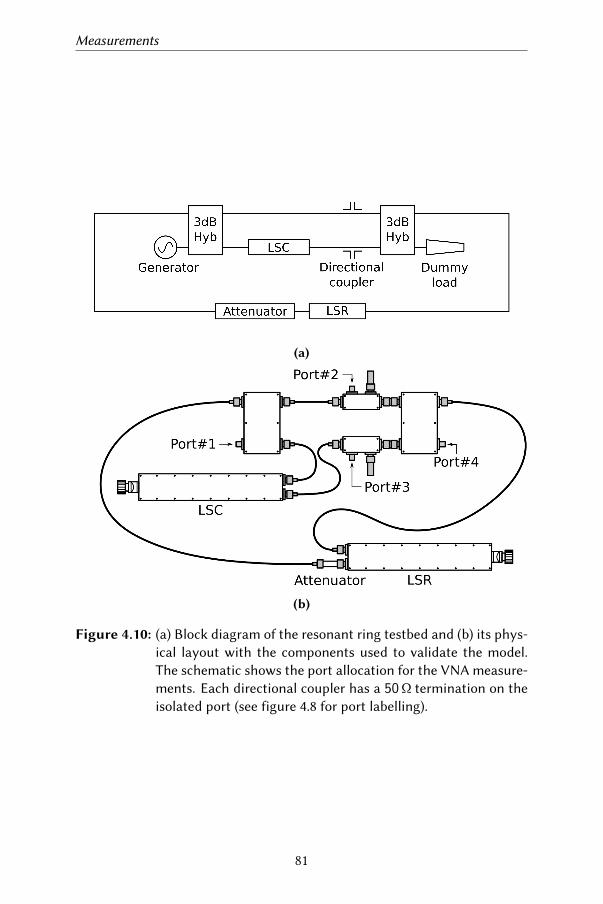
Measurements
(a)
(b)
Figure 4.10: (a) Block diagram of the resonant ring testbed and (b) its phys-ical layout with the components used to validate the model.The schematic shows the port allocation for the VNA measure-ments. Each directional coupler has a 50Ω termination on theisolated port (see figure 4.8 for port labelling).
81
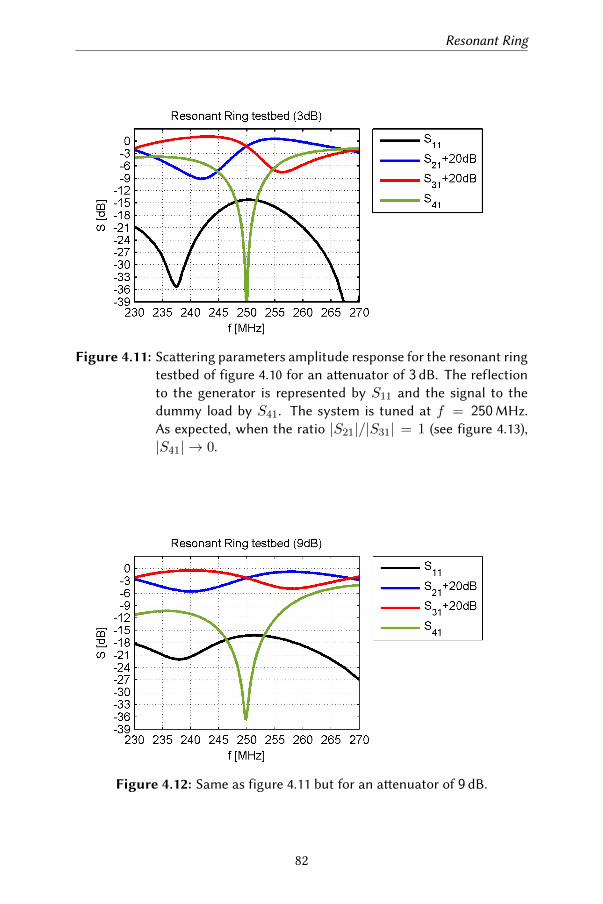
Resonant Ring
Figure 4.11: Scaering parameters amplitude response for the resonant ringtestbed of figure 4.10 for an aenuator of 3 dB. The reflectionto the generator is represented by S11 and the signal to thedummy load by S41. The system is tuned at f = 250MHz.As expected, when the ratio |S21|/|S31| = 1 (see figure 4.13),|S41| → 0.
Figure 4.12: Same as figure 4.11 but for an aenuator of 9 dB.
82
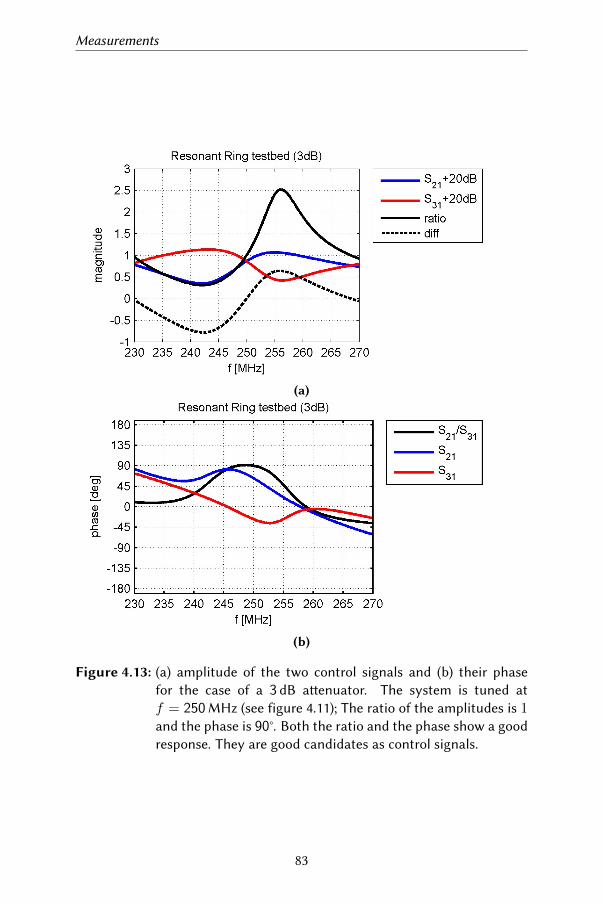
Measurements
(a)
(b)
Figure 4.13: (a) amplitude of the two control signals and (b) their phasefor the case of a 3 dB aenuator. The system is tuned atf = 250MHz (see figure 4.11); The ratio of the amplitudes is 1and the phase is 90°. Both the ratio and the phase show a goodresponse. They are good candidates as control signals.
83
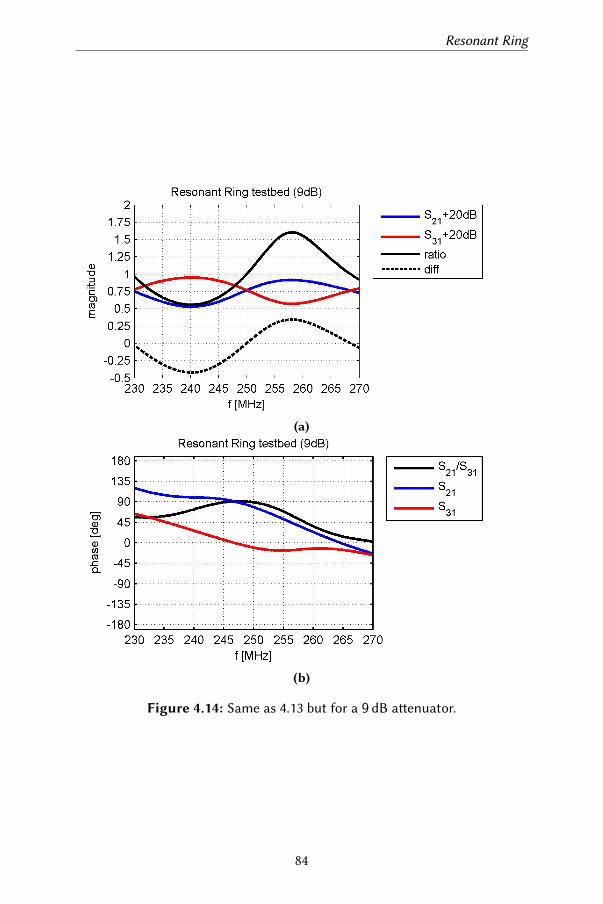
Resonant Ring
(a)
(b)
Figure 4.14: Same as 4.13 but for a 9 dB aenuator.
84
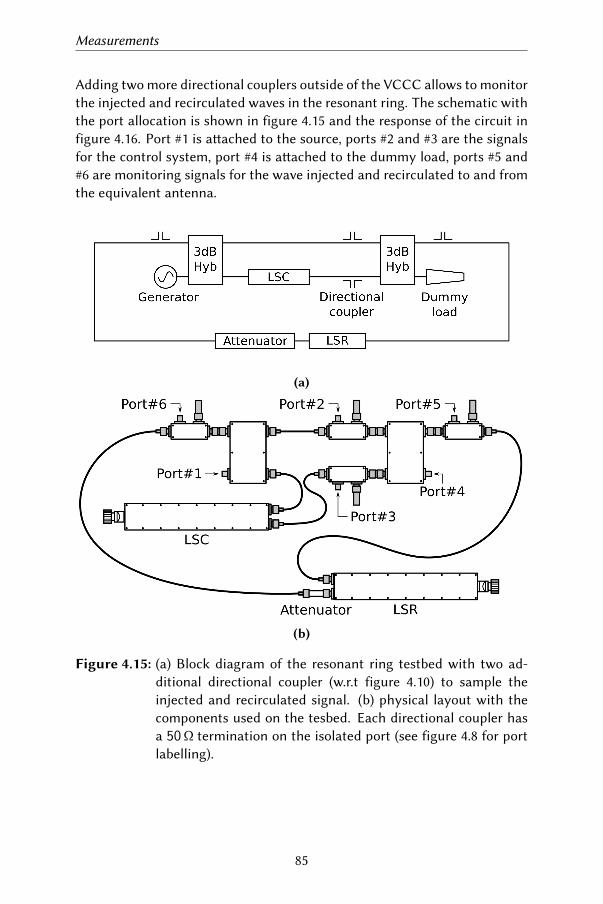
Measurements
Adding two more directional couplers outside of the VCCC allows to monitorthe injected and recirculated waves in the resonant ring. The schematic withthe port allocation is shown in figure 4.15 and the response of the circuit infigure 4.16. Port #1 is aached to the source, ports #2 and #3 are the signalsfor the control system, port #4 is aached to the dummy load, ports #5 and#6 are monitoring signals for the wave injected and recirculated to and fromthe equivalent antenna.
(a)
(b)
Figure 4.15: (a) Block diagram of the resonant ring testbed with two ad-ditional directional coupler (w.r.t figure 4.10) to sample theinjected and recirculated signal. (b) physical layout with thecomponents used on the tesbed. Each directional coupler hasa 50Ω termination on the isolated port (see figure 4.8 for portlabelling).
85
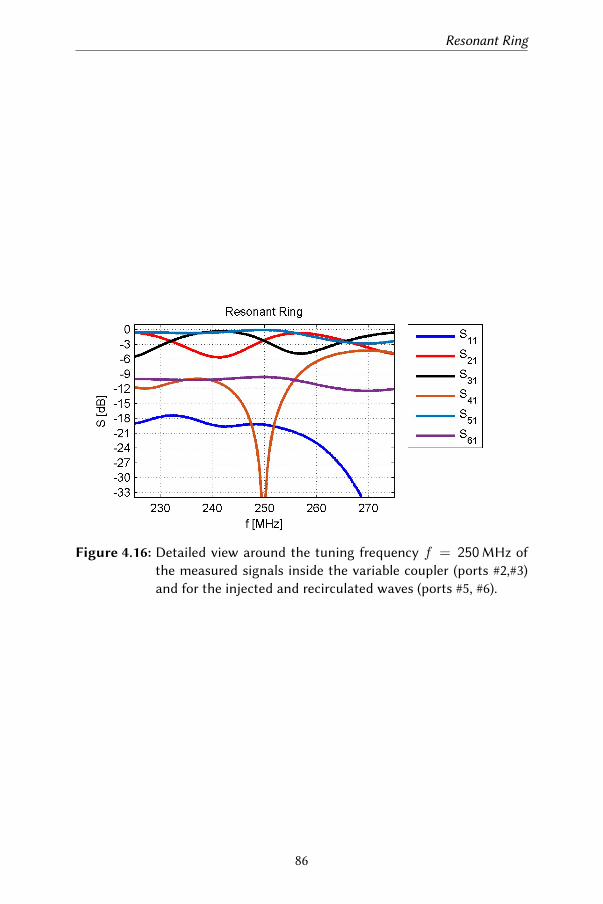
Resonant Ring
Figure 4.16: Detailed view around the tuning frequency f = 250MHz ofthe measured signals inside the variable coupler (ports #2,#3)and for the injected and recirculated waves (ports #5, #6).
86
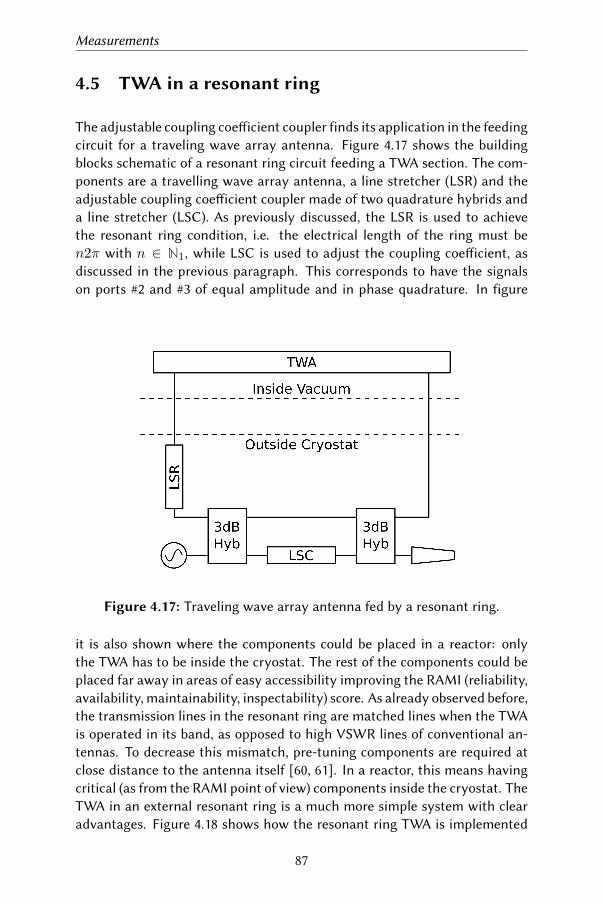
Measurements
4.5 TWA in a resonant ring
The adjustable coupling coeicient coupler finds its application in the feedingcircuit for a traveling wave array antenna. Figure 4.17 shows the buildingblocks schematic of a resonant ring circuit feeding a TWA section. The com-ponents are a travelling wave array antenna, a line stretcher (LSR) and theadjustable coupling coeicient coupler made of two quadrature hybrids anda line stretcher (LSC). As previously discussed, the LSR is used to achievethe resonant ring condition, i.e. the electrical length of the ring must ben2π with n ∈ N1, while LSC is used to adjust the coupling coeicient, asdiscussed in the previous paragraph. This corresponds to have the signalson ports #2 and #3 of equal amplitude and in phase quadrature. In figure
Figure 4.17: Traveling wave array antenna fed by a resonant ring.
it is also shown where the components could be placed in a reactor: onlythe TWA has to be inside the cryostat. The rest of the components could beplaced far away in areas of easy accessibility improving the RAMI (reliability,availability, maintainability, inspectability) score. As already observed before,the transmission lines in the resonant ring are matched lines when the TWAis operated in its band, as opposed to high VSWR lines of conventional an-tennas. To decrease this mismatch, pre-tuning components are required atclose distance to the antenna itself [60, 61]. In a reactor, this means havingcritical (as from the RAMI point of view) components inside the cryostat. TheTWA in an external resonant ring is a much more simple system with clearadvantages. Figure 4.18 shows how the resonant ring TWA is implemented
87
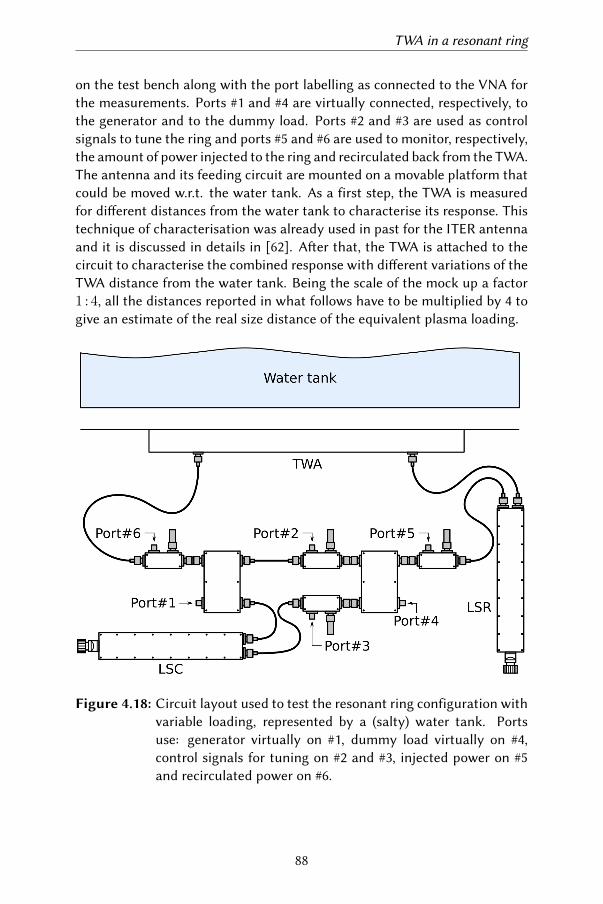
TWA in a resonant ring
on the test bench along with the port labelling as connected to the VNA forthe measurements. Ports #1 and #4 are virtually connected, respectively, tothe generator and to the dummy load. Ports #2 and #3 are used as controlsignals to tune the ring and ports #5 and #6 are used to monitor, respectively,the amount of power injected to the ring and recirculated back from the TWA.The antenna and its feeding circuit are mounted on a movable platform thatcould be moved w.r.t. the water tank. As a first step, the TWA is measuredfor dierent distances from the water tank to characterise its response. Thistechnique of characterisation was already used in past for the ITER antennaand it is discussed in details in [62]. Aer that, the TWA is aached to thecircuit to characterise the combined response with dierent variations of theTWA distance from the water tank. Being the scale of the mock up a factor1 : 4, all the distances reported in what follows have to be multiplied by 4 togive an estimate of the real size distance of the equivalent plasma loading.
Figure 4.18: Circuit layout used to test the resonant ring configuration withvariable loading, represented by a (salty) water tank. Portsuse: generator virtually on #1, dummy load virtually on #4,control signals for tuning on #2 and #3, injected power on #5and recirculated power on #6.
88
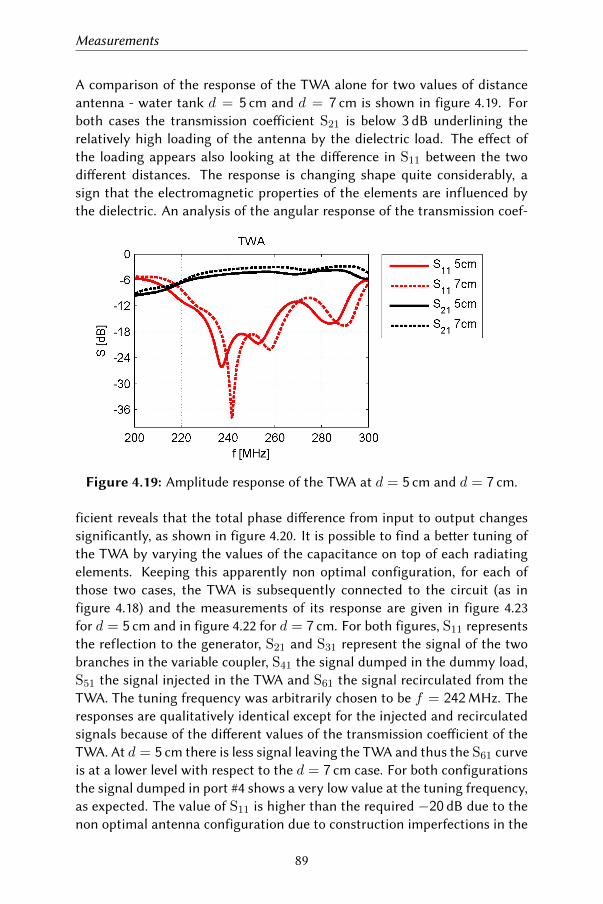
Measurements
A comparison of the response of the TWA alone for two values of distanceantenna - water tank d = 5 cm and d = 7 cm is shown in figure 4.19. Forboth cases the transmission coeicient S21 is below 3 dB underlining therelatively high loading of the antenna by the dielectric load. The eect ofthe loading appears also looking at the dierence in S11 between the twodierent distances. The response is changing shape quite considerably, asign that the electromagnetic properties of the elements are influenced bythe dielectric. An analysis of the angular response of the transmission coef-
Figure 4.19: Amplitude response of the TWA at d = 5 cm and d = 7 cm.
ficient reveals that the total phase dierence from input to output changessignificantly, as shown in figure 4.20. It is possible to find a beer tuning ofthe TWA by varying the values of the capacitance on top of each radiatingelements. Keeping this apparently non optimal configuration, for each ofthose two cases, the TWA is subsequently connected to the circuit (as infigure 4.18) and the measurements of its response are given in figure 4.23for d = 5 cm and in figure 4.22 for d = 7 cm. For both figures, S11 representsthe reflection to the generator, S21 and S31 represent the signal of the twobranches in the variable coupler, S41 the signal dumped in the dummy load,S51 the signal injected in the TWA and S61 the signal recirculated from theTWA. The tuning frequency was arbitrarily chosen to be f = 242MHz. Theresponses are qualitatively identical except for the injected and recirculatedsignals because of the dierent values of the transmission coeicient of theTWA. At d = 5 cm there is less signal leaving the TWA and thus the S61 curveis at a lower level with respect to the d = 7 cm case. For both configurationsthe signal dumped in port #4 shows a very low value at the tuning frequency,as expected. The value of S11 is higher than the required −20 dB due to thenon optimal antenna configuration due to construction imperfections in the
89
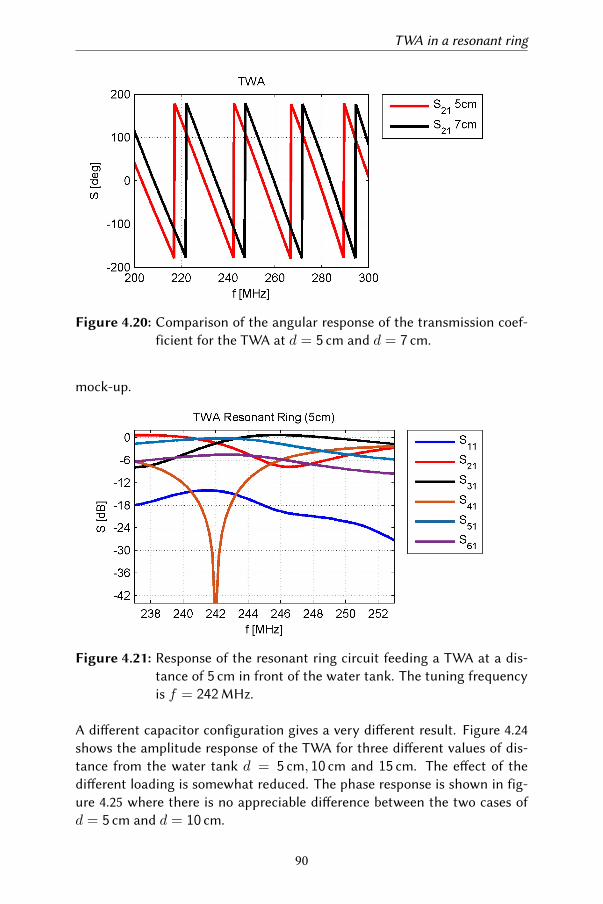
TWA in a resonant ring
Figure 4.20: Comparison of the angular response of the transmission coef-ficient for the TWA at d = 5 cm and d = 7 cm.
mock-up.
Figure 4.21: Response of the resonant ring circuit feeding a TWA at a dis-tance of 5 cm in front of the water tank. The tuning frequencyis f = 242MHz.
A dierent capacitor configuration gives a very dierent result. Figure 4.24shows the amplitude response of the TWA for three dierent values of dis-tance from the water tank d = 5 cm, 10 cm and 15 cm. The eect of thedierent loading is somewhat reduced. The phase response is shown in fig-ure 4.25 where there is no appreciable dierence between the two cases ofd = 5 cm and d = 10 cm.
90
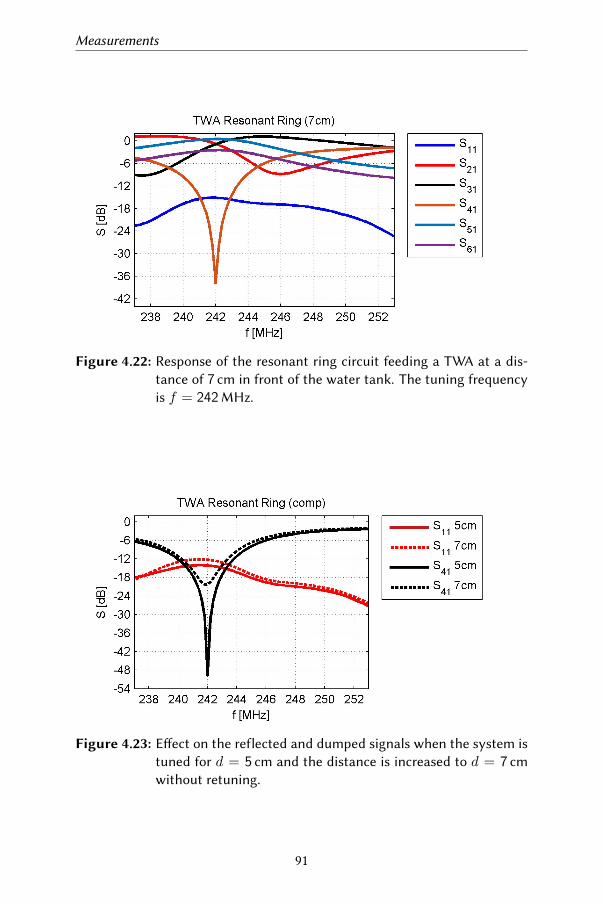
Measurements
Figure 4.22: Response of the resonant ring circuit feeding a TWA at a dis-tance of 7 cm in front of the water tank. The tuning frequencyis f = 242MHz.
Figure 4.23: Eect on the reflected and dumped signals when the system istuned for d = 5 cm and the distance is increased to d = 7 cmwithout retuning.
91
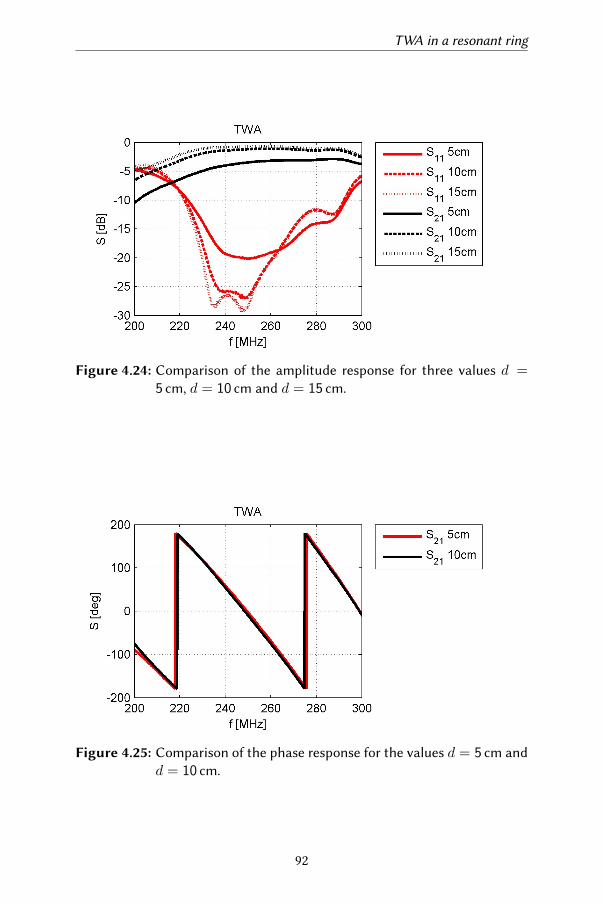
TWA in a resonant ring
Figure 4.24: Comparison of the amplitude response for three values d =5 cm, d = 10 cm and d = 15 cm.
Figure 4.25: Comparison of the phase response for the values d = 5 cm andd = 10 cm.
92
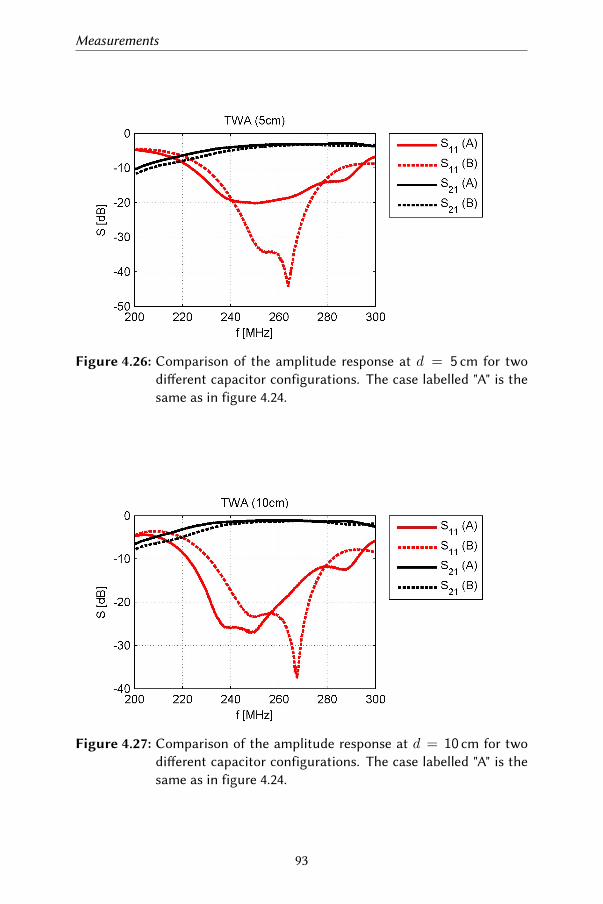
Measurements
Figure 4.26: Comparison of the amplitude response at d = 5 cm for twodierent capacitor configurations. The case labelled "A" is thesame as in figure 4.24.
Figure 4.27: Comparison of the amplitude response at d = 10 cm for twodierent capacitor configurations. The case labelled "A" is thesame as in figure 4.24.
93
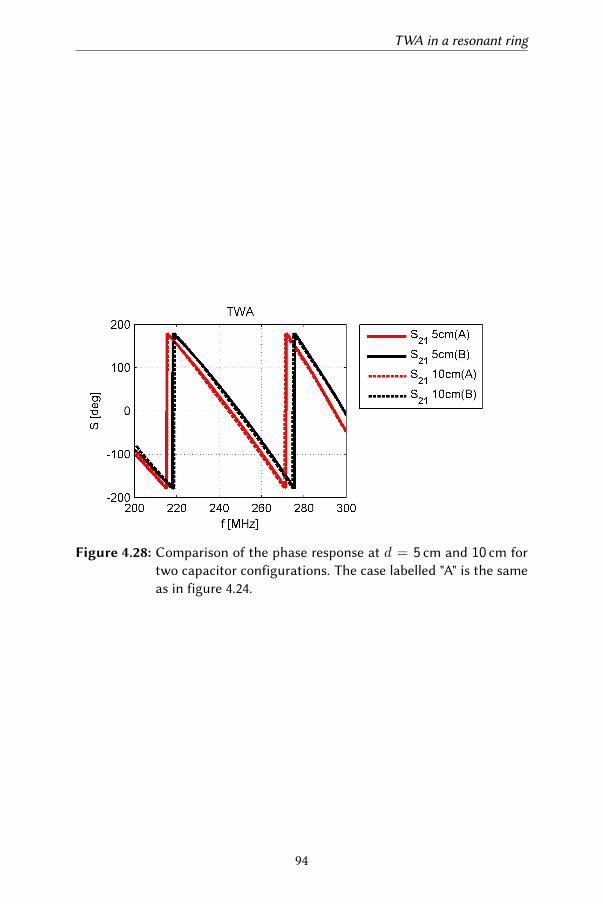
TWA in a resonant ring
Figure 4.28: Comparison of the phase response at d = 5 cm and 10 cm fortwo capacitor configurations. The case labelled "A" is the sameas in figure 4.24.
94
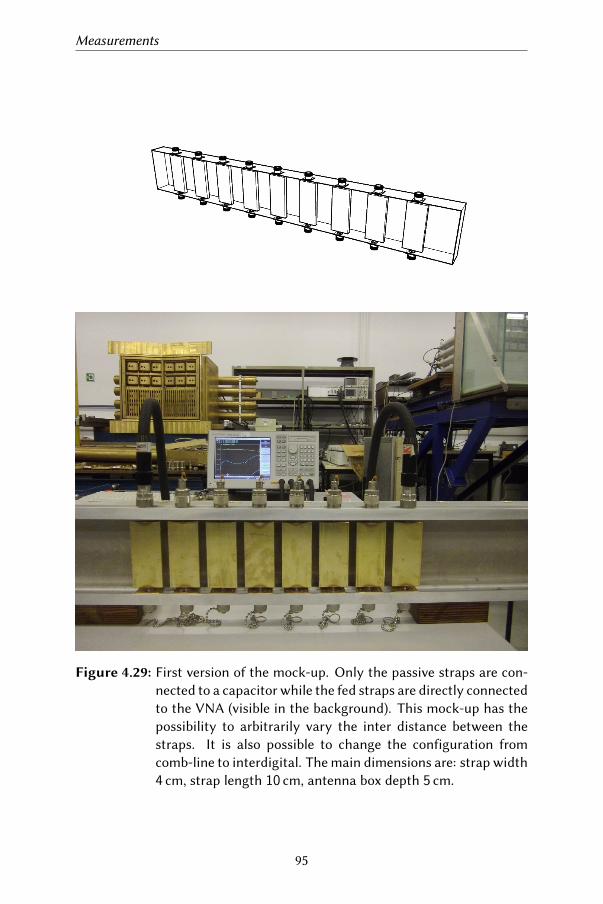
Measurements
Figure 4.29: First version of the mock-up. Only the passive straps are con-nected to a capacitor while the fed straps are directly connectedto the VNA (visible in the background). This mock-up has thepossibility to arbitrarily vary the inter distance between thestraps. It is also possible to change the configuration fromcomb-line to interdigital. The main dimensions are: strap width4 cm, strap length 10 cm, antenna box depth 5 cm.
95
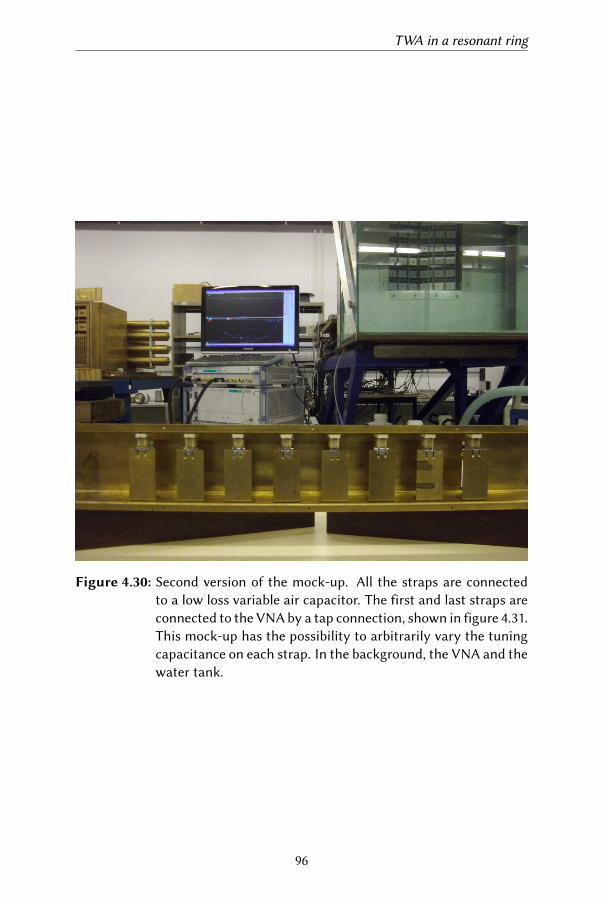
TWA in a resonant ring
Figure 4.30: Second version of the mock-up. All the straps are connectedto a low loss variable air capacitor. The first and last straps areconnected to the VNA by a tap connection, shown in figure 4.31.This mock-up has the possibility to arbitrarily vary the tuningcapacitance on each strap. In the background, the VNA and thewater tank.
96
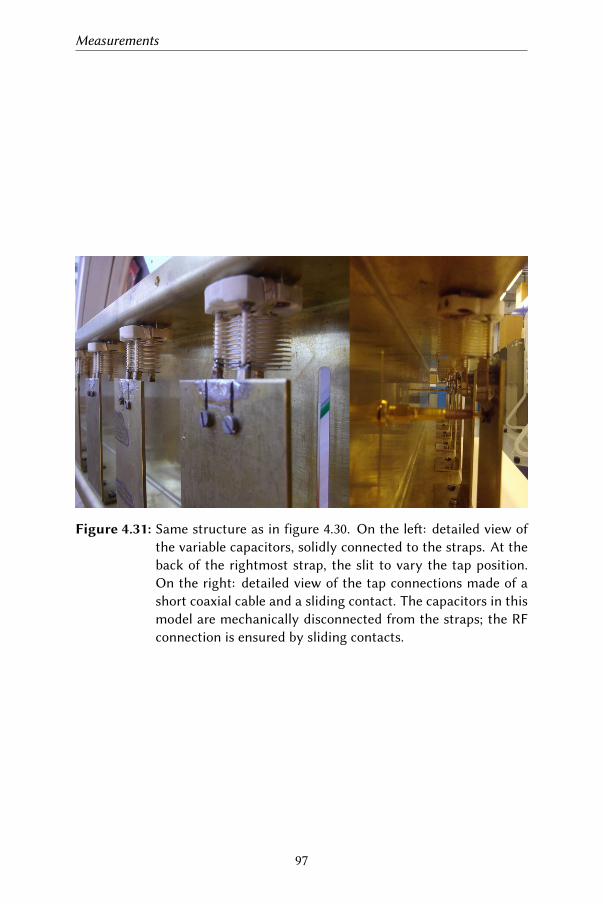
Measurements
Figure 4.31: Same structure as in figure 4.30. On the le: detailed view ofthe variable capacitors, solidly connected to the straps. At theback of the rightmost strap, the slit to vary the tap position.On the right: detailed view of the tap connections made of ashort coaxial cable and a sliding contact. The capacitors in thismodel are mechanically disconnected from the straps; the RFconnection is ensured by sliding contacts.
97
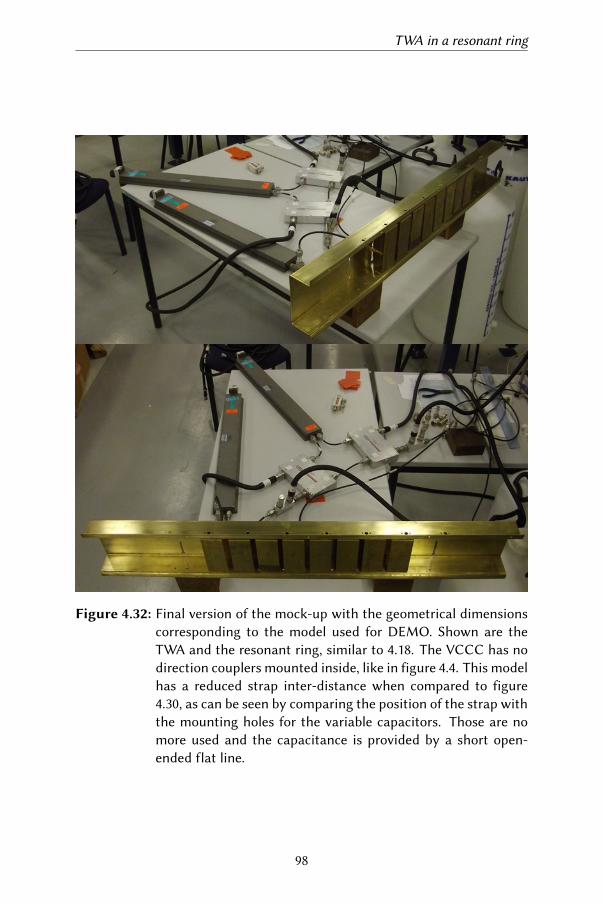
TWA in a resonant ring
Figure 4.32: Final version of the mock-up with the geometrical dimensionscorresponding to the model used for DEMO. Shown are theTWA and the resonant ring, similar to 4.18. The VCCC has nodirection couplers mounted inside, like in figure 4.4. This modelhas a reduced strap inter-distance when compared to figure4.30, as can be seen by comparing the position of the strap withthe mounting holes for the variable capacitors. Those are nomore used and the capacitance is provided by a short open-ended flat line.
98
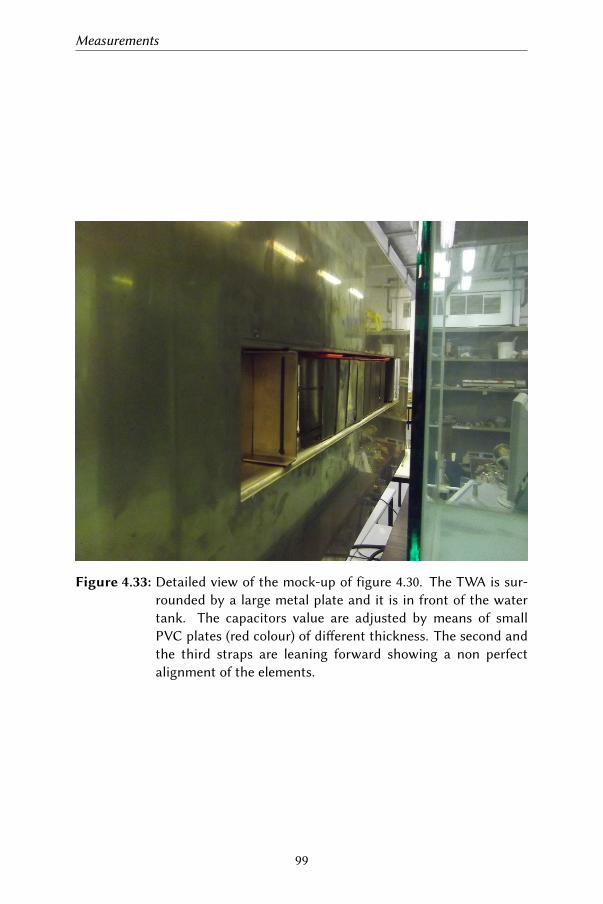
Measurements
Figure 4.33: Detailed view of the mock-up of figure 4.30. The TWA is sur-rounded by a large metal plate and it is in front of the watertank. The capacitors value are adjusted by means of smallPVC plates (red colour) of dierent thickness. The second andthe third straps are leaning forward showing a non perfectalignment of the elements.
99


Chapter 5
Application to DEMO
The Demonstration Fusion Power Plant, DEMO, is a tokamak which has thegoal of demonstrating net production of electricity from fusion with a closedfuel cycle, although not at the price and the quantities of commercial powerplants. It will be ITER’s successor. Current fusion experiments were primarilydesigned to investigate plasma physics. However, DEMO must demonstratethe necessary technologies not only for controlling a more powerful plasmathan has previously existed, but for safely generating electricity consistently,and for regular, rapid, and reliable maintenance of the plant. The designof such a plant must take account of engineering and technological lim-itations while preserving physics requirements. To achieve that the rightbalance must be found between high reliability, availability, maintainability,inspectability (RAMI) on the one hand and good performance, eiciencyand optimised design on the other hand. A sketch of the main tokamakcomponents is shown in figure 5.1.
Table 5.1: DEMO tokamak parameters
BT 4.89 T Ip(q95 2.5) 19MAR 8.94m Vp 2466m3
a 2.88m < ne > 7.9× 10¹⁹ m−3
A 3.1 < te > 12 keVκ95 1.65 Zeff 2.18δ95 0.33 τe 3.87 s
101
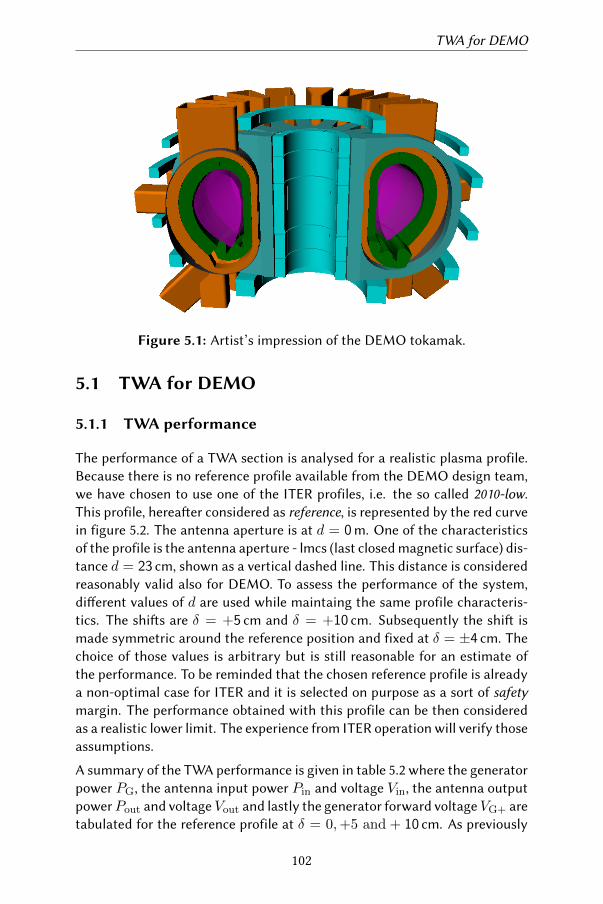
TWA for DEMO
Figure 5.1: Artist’s impression of the DEMO tokamak.
5.1 TWA for DEMO
5.1.1 TWA performance
The performance of a TWA section is analysed for a realistic plasma profile.Because there is no reference profile available from the DEMO design team,we have chosen to use one of the ITER profiles, i.e. the so called 2010-low.This profile, hereaer considered as reference, is represented by the red curvein figure 5.2. The antenna aperture is at d = 0m. One of the characteristicsof the profile is the antenna aperture - lmcs (last closed magnetic surface) dis-tance d = 23 cm, shown as a vertical dashed line. This distance is consideredreasonably valid also for DEMO. To assess the performance of the system,dierent values of d are used while maintaing the same profile characteris-tics. The shis are δ = +5 cm and δ = +10 cm. Subsequently the shi ismade symmetric around the reference position and fixed at δ = ±4 cm. Thechoice of those values is arbitrary but is still reasonable for an estimate ofthe performance. To be reminded that the chosen reference profile is alreadya non-optimal case for ITER and it is selected on purpose as a sort of safetymargin. The performance obtained with this profile can be then consideredas a realistic lower limit. The experience from ITER operation will verify thoseassumptions.
A summary of the TWA performance is given in table 5.2 where the generatorpower PG, the antenna input power Pin and voltage Vin, the antenna outputpowerPout and voltageVout and lastly the generator forward voltageVG+ aretabulated for the reference profile at δ = 0,+5 and + 10 cm. As previously
102
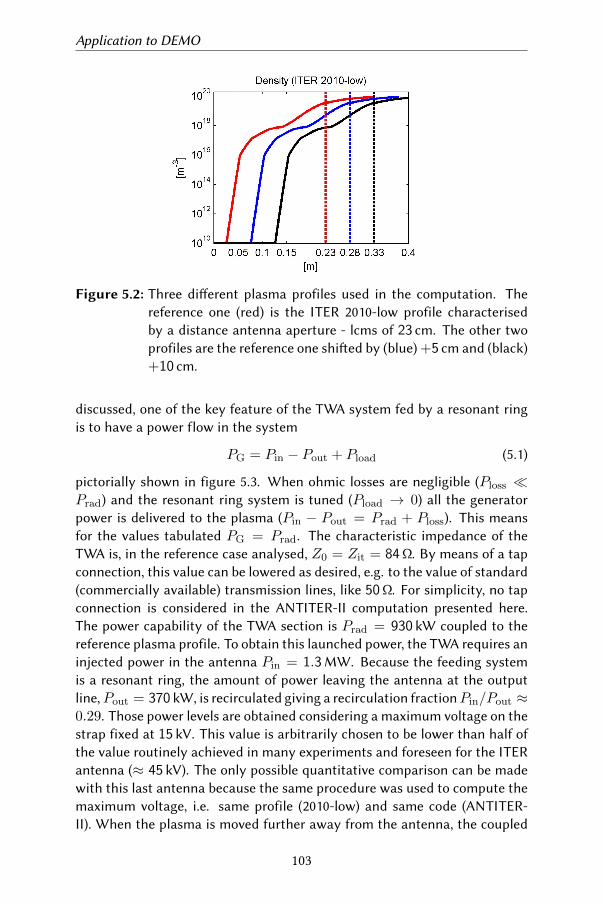
Application to DEMO
Figure 5.2: Three dierent plasma profiles used in the computation. Thereference one (red) is the ITER 2010-low profile characterisedby a distance antenna aperture - lcms of 23 cm. The other twoprofiles are the reference one shied by (blue) +5 cm and (black)+10 cm.
discussed, one of the key feature of the TWA system fed by a resonant ringis to have a power flow in the system
PG = Pin − Pout + Pload (5.1)
pictorially shown in figure 5.3. When ohmic losses are negligible (Ploss Prad) and the resonant ring system is tuned (Pload → 0) all the generatorpower is delivered to the plasma (Pin − Pout = Prad + Ploss). This meansfor the values tabulated PG = Prad. The characteristic impedance of theTWA is, in the reference case analysed, Z0 = Zit = 84Ω. By means of a tapconnection, this value can be lowered as desired, e.g. to the value of standard(commercially available) transmission lines, like 50Ω. For simplicity, no tapconnection is considered in the ANTITER-II computation presented here.The power capability of the TWA section is Prad = 930 kW coupled to thereference plasma profile. To obtain this launched power, the TWA requires aninjected power in the antenna Pin = 1.3MW. Because the feeding systemis a resonant ring, the amount of power leaving the antenna at the outputline,Pout = 370 kW, is recirculated giving a recirculation fractionPin/Pout ≈0.29. Those power levels are obtained considering a maximum voltage on thestrap fixed at 15 kV. This value is arbitrarily chosen to be lower than half ofthe value routinely achieved in many experiments and foreseen for the ITERantenna (≈ 45 kV). The only possible quantitative comparison can be madewith this last antenna because the same procedure was used to compute themaximum voltage, i.e. same profile (2010-low) and same code (ANTITER-II). When the plasma is moved further away from the antenna, the coupled
103
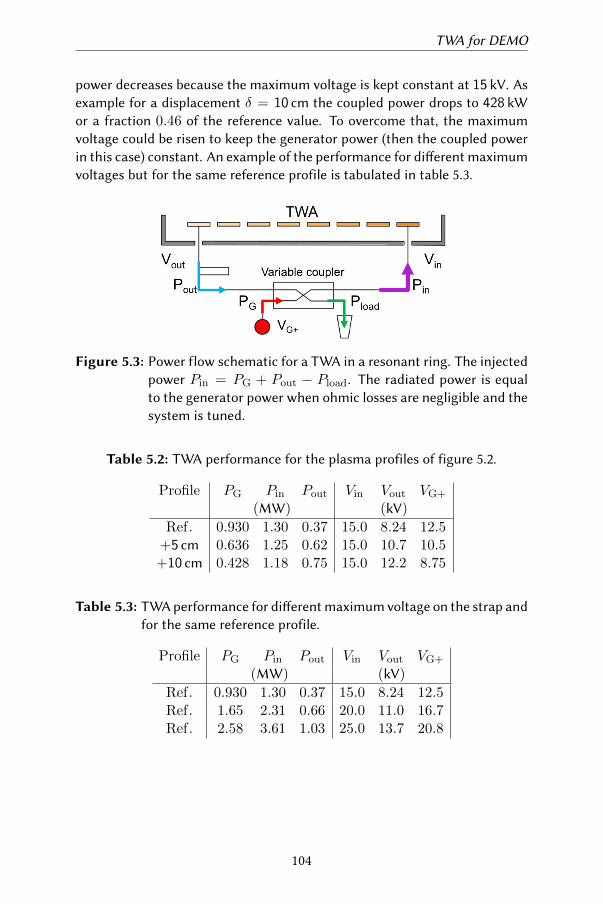
TWA for DEMO
power decreases because the maximum voltage is kept constant at 15 kV. Asexample for a displacement δ = 10 cm the coupled power drops to 428 kWor a fraction 0.46 of the reference value. To overcome that, the maximumvoltage could be risen to keep the generator power (then the coupled powerin this case) constant. An example of the performance for dierent maximumvoltages but for the same reference profile is tabulated in table 5.3.
Figure 5.3: Power flow schematic for a TWA in a resonant ring. The injectedpower Pin = PG + Pout − Pload. The radiated power is equalto the generator power when ohmic losses are negligible and thesystem is tuned.
Table 5.2: TWA performance for the plasma profiles of figure 5.2.
Profile PG Pin Pout Vin Vout VG+
(MW) (kV)
Ref. 0.930 1.30 0.37 15.0 8.24 12.5+5 cm 0.636 1.25 0.62 15.0 10.7 10.5+10 cm 0.428 1.18 0.75 15.0 12.2 8.75
Table 5.3: TWA performance for dierent maximum voltage on the strap andfor the same reference profile.
Profile PG Pin Pout Vin Vout VG+
(MW) (kV)
Ref. 0.930 1.30 0.37 15.0 8.24 12.5Ref. 1.65 2.31 0.66 20.0 11.0 16.7Ref. 2.58 3.61 1.03 25.0 13.7 20.8
104
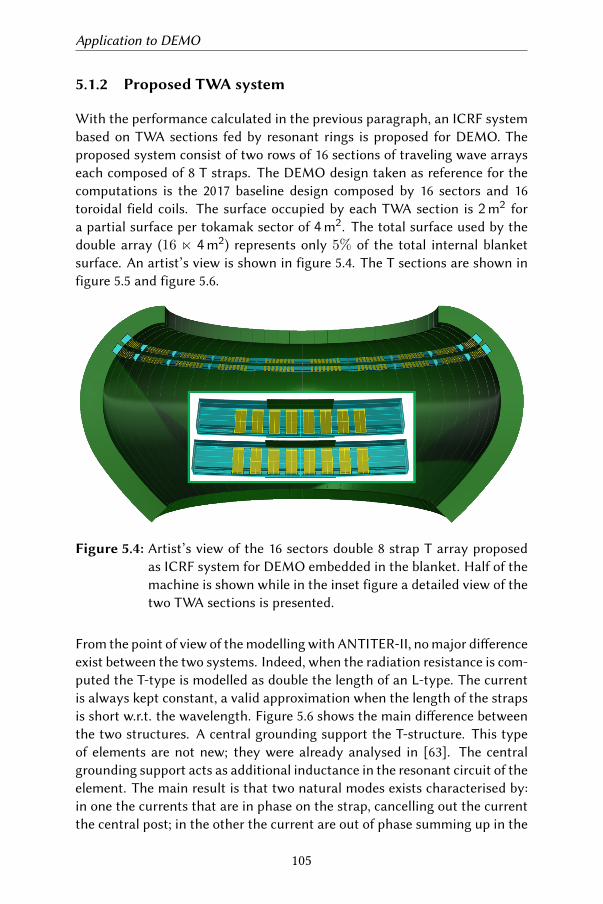
Application to DEMO
5.1.2 Proposed TWA system
With the performance calculated in the previous paragraph, an ICRF systembased on TWA sections fed by resonant rings is proposed for DEMO. Theproposed system consist of two rows of 16 sections of traveling wave arrayseach composed of 8 T straps. The DEMO design taken as reference for thecomputations is the 2017 baseline design composed by 16 sectors and 16toroidal field coils. The surface occupied by each TWA section is 2m2 fora partial surface per tokamak sector of 4m2. The total surface used by thedouble array (16 n 4m2) represents only 5% of the total internal blanketsurface. An artist’s view is shown in figure 5.4. The T sections are shown infigure 5.5 and figure 5.6.
Figure 5.4: Artist’s view of the 16 sectors double 8 strap T array proposedas ICRF system for DEMO embedded in the blanket. Half of themachine is shown while in the inset figure a detailed view of thetwo TWA sections is presented.
From the point of view of the modelling with ANTITER-II, no major dierenceexist between the two systems. Indeed, when the radiation resistance is com-puted the T-type is modelled as double the length of an L-type. The currentis always kept constant, a valid approximation when the length of the strapsis short w.r.t. the wavelength. Figure 5.6 shows the main dierence betweenthe two structures. A central grounding support the T-structure. This typeof elements are not new; they were already analysed in [63]. The centralgrounding support acts as additional inductance in the resonant circuit of theelement. The main result is that two natural modes exists characterised by:in one the currents that are in phase on the strap, cancelling out the currentthe central post; in the other the current are out of phase summing up in the
105
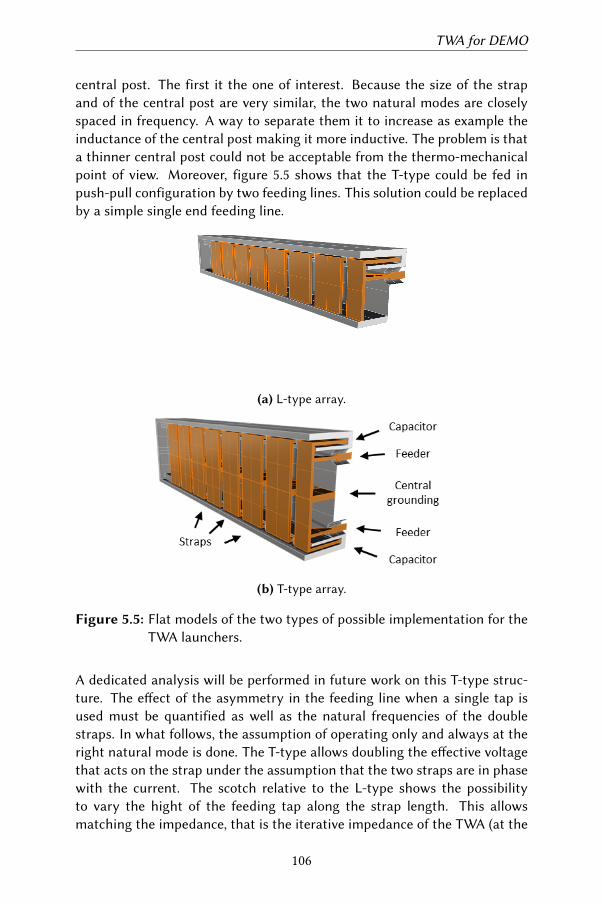
TWA for DEMO
central post. The first it the one of interest. Because the size of the strapand of the central post are very similar, the two natural modes are closelyspaced in frequency. A way to separate them it to increase as example theinductance of the central post making it more inductive. The problem is thata thinner central post could not be acceptable from the thermo-mechanicalpoint of view. Moreover, figure 5.5 shows that the T-type could be fed inpush-pull configuration by two feeding lines. This solution could be replacedby a simple single end feeding line.
(a) L-type array.
(b) T-type array.
Figure 5.5: Flat models of the two types of possible implementation for theTWA launchers.
A dedicated analysis will be performed in future work on this T-type struc-ture. The eect of the asymmetry in the feeding line when a single tap isused must be quantified as well as the natural frequencies of the doublestraps. In what follows, the assumption of operating only and always at theright natural mode is done. The T-type allows doubling the eective voltagethat acts on the strap under the assumption that the two straps are in phasewith the current. The scotch relative to the L-type shows the possibilityto vary the hight of the feeding tap along the strap length. This allowsmatching the impedance, that is the iterative impedance of the TWA (at the
106
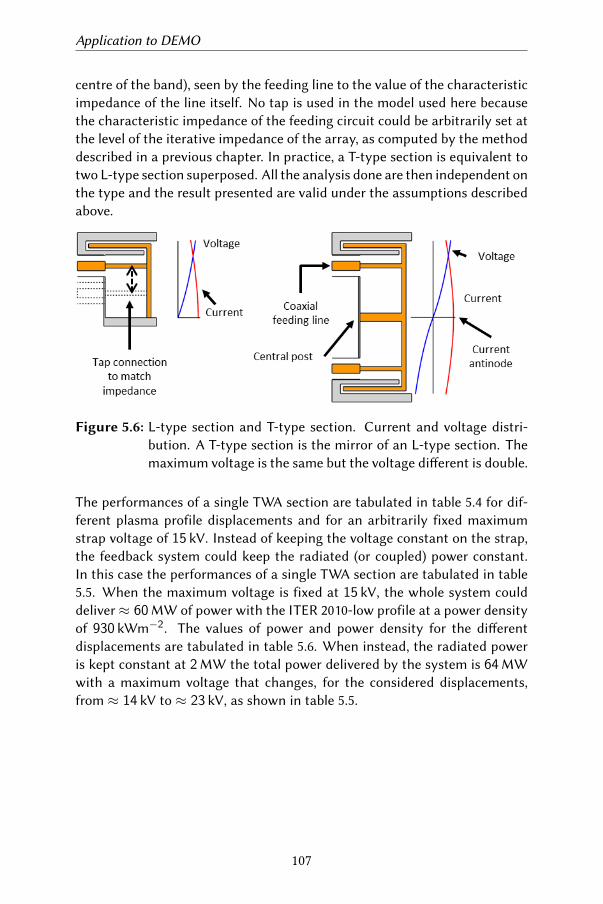
Application to DEMO
centre of the band), seen by the feeding line to the value of the characteristicimpedance of the line itself. No tap is used in the model used here becausethe characteristic impedance of the feeding circuit could be arbitrarily set atthe level of the iterative impedance of the array, as computed by the methoddescribed in a previous chapter. In practice, a T-type section is equivalent totwo L-type section superposed. All the analysis done are then independent onthe type and the result presented are valid under the assumptions describedabove.
Figure 5.6: L-type section and T-type section. Current and voltage distri-bution. A T-type section is the mirror of an L-type section. Themaximum voltage is the same but the voltage dierent is double.
The performances of a single TWA section are tabulated in table 5.4 for dif-ferent plasma profile displacements and for an arbitrarily fixed maximumstrap voltage of 15 kV. Instead of keeping the voltage constant on the strap,the feedback system could keep the radiated (or coupled) power constant.In this case the performances of a single TWA section are tabulated in table5.5. When the maximum voltage is fixed at 15 kV, the whole system coulddeliver≈ 60MW of power with the ITER 2010-low profile at a power densityof 930 kWm−2. The values of power and power density for the dierentdisplacements are tabulated in table 5.6. When instead, the radiated poweris kept constant at 2MW the total power delivered by the system is 64MWwith a maximum voltage that changes, for the considered displacements,from ≈ 14 kV to ≈ 23 kV, as shown in table 5.5.
107
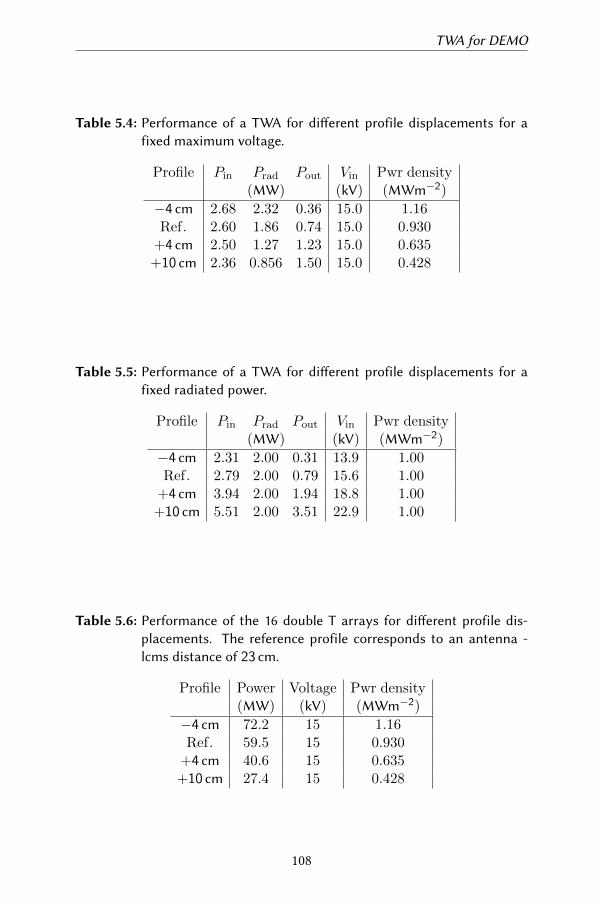
TWA for DEMO
Table 5.4: Performance of a TWA for dierent profile displacements for afixed maximum voltage.
Profile Pin Prad Pout Vin Pwr density(MW) (kV) (MWm−2)
−4 cm 2.68 2.32 0.36 15.0 1.16Ref. 2.60 1.86 0.74 15.0 0.930
+4 cm 2.50 1.27 1.23 15.0 0.635+10 cm 2.36 0.856 1.50 15.0 0.428
Table 5.5: Performance of a TWA for dierent profile displacements for afixed radiated power.
Profile Pin Prad Pout Vin Pwr density(MW) (kV) (MWm−2)
−4 cm 2.31 2.00 0.31 13.9 1.00Ref. 2.79 2.00 0.79 15.6 1.00
+4 cm 3.94 2.00 1.94 18.8 1.00+10 cm 5.51 2.00 3.51 22.9 1.00
Table 5.6: Performance of the 16 double T arrays for dierent profile dis-placements. The reference profile corresponds to an antenna -lcms distance of 23 cm.
Profile Power Voltage Pwr density(MW) (kV) (MWm−2)
−4 cm 72.2 15 1.16Ref. 59.5 15 0.930
+4 cm 40.6 15 0.635+10 cm 27.4 15 0.428
108
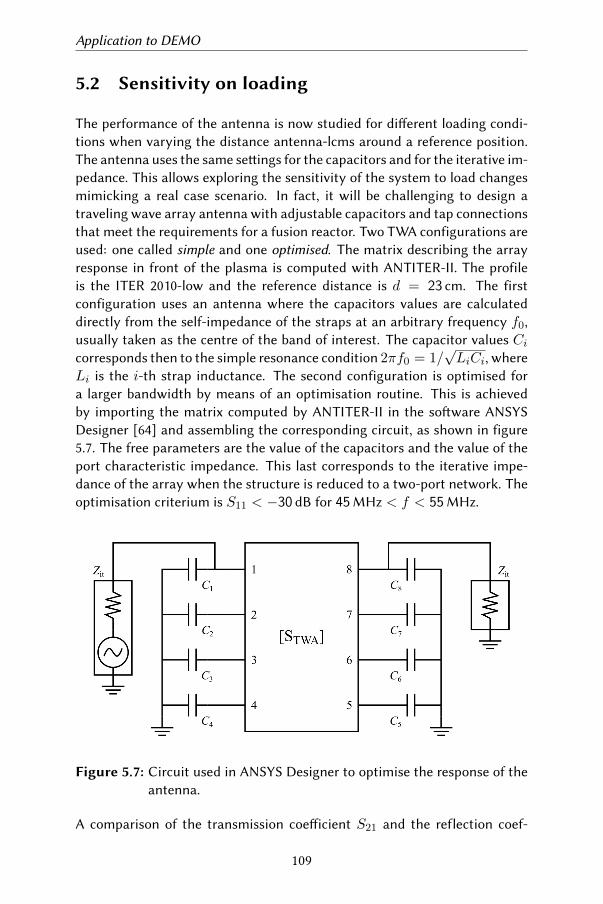
Application to DEMO
5.2 Sensitivity on loading
The performance of the antenna is now studied for dierent loading condi-tions when varying the distance antenna-lcms around a reference position.The antenna uses the same seings for the capacitors and for the iterative im-pedance. This allows exploring the sensitivity of the system to load changesmimicking a real case scenario. In fact, it will be challenging to design atraveling wave array antenna with adjustable capacitors and tap connectionsthat meet the requirements for a fusion reactor. Two TWA configurations areused: one called simple and one optimised. The matrix describing the arrayresponse in front of the plasma is computed with ANTITER-II. The profileis the ITER 2010-low and the reference distance is d = 23 cm. The firstconfiguration uses an antenna where the capacitors values are calculateddirectly from the self-impedance of the straps at an arbitrary frequency f0,usually taken as the centre of the band of interest. The capacitor values Cicorresponds then to the simple resonance condition 2πf0 = 1/
√LiCi, where
Li is the i-th strap inductance. The second configuration is optimised fora larger bandwidth by means of an optimisation routine. This is achievedby importing the matrix computed by ANTITER-II in the soware ANSYSDesigner [64] and assembling the corresponding circuit, as shown in figure5.7. The free parameters are the value of the capacitors and the value of theport characteristic impedance. This last corresponds to the iterative impe-dance of the array when the structure is reduced to a two-port network. Theoptimisation criterium is S11 < −30 dB for 45MHz < f < 55MHz.
Figure 5.7: Circuit used in ANSYS Designer to optimise the response of theantenna.
A comparison of the transmission coeicient S21 and the reflection coef-
109
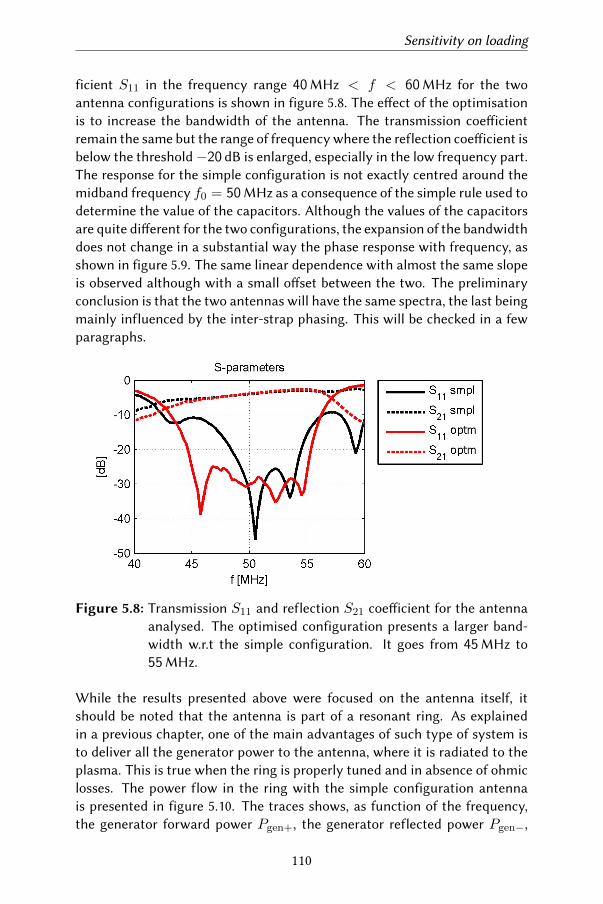
Sensitivity on loading
ficient S11 in the frequency range 40MHz < f < 60MHz for the twoantenna configurations is shown in figure 5.8. The eect of the optimisationis to increase the bandwidth of the antenna. The transmission coeicientremain the same but the range of frequency where the reflection coeicient isbelow the threshold−20 dB is enlarged, especially in the low frequency part.The response for the simple configuration is not exactly centred around themidband frequency f0 = 50MHz as a consequence of the simple rule used todetermine the value of the capacitors. Although the values of the capacitorsare quite dierent for the two configurations, the expansion of the bandwidthdoes not change in a substantial way the phase response with frequency, asshown in figure 5.9. The same linear dependence with almost the same slopeis observed although with a small oset between the two. The preliminaryconclusion is that the two antennas will have the same spectra, the last beingmainly influenced by the inter-strap phasing. This will be checked in a fewparagraphs.
Figure 5.8: Transmission S11 and reflection S21 coeicient for the antennaanalysed. The optimised configuration presents a larger band-width w.r.t the simple configuration. It goes from 45MHz to55MHz.
While the results presented above were focused on the antenna itself, itshould be noted that the antenna is part of a resonant ring. As explainedin a previous chapter, one of the main advantages of such type of system isto deliver all the generator power to the antenna, where it is radiated to theplasma. This is true when the ring is properly tuned and in absence of ohmiclosses. The power flow in the ring with the simple configuration antennais presented in figure 5.10. The traces shows, as function of the frequency,the generator forward power Pgen+, the generator reflected power Pgen−,
110
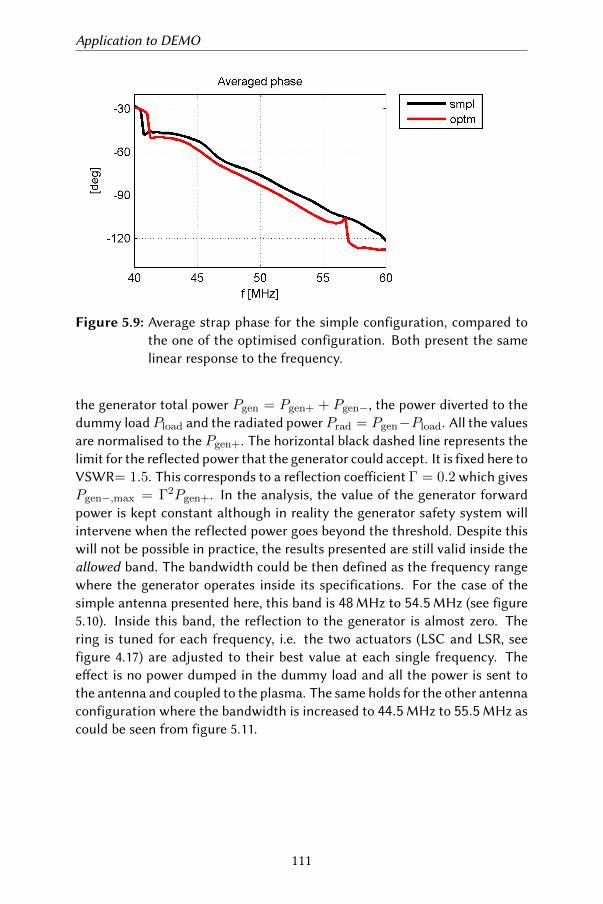
Application to DEMO
Figure 5.9: Average strap phase for the simple configuration, compared tothe one of the optimised configuration. Both present the samelinear response to the frequency.
the generator total power Pgen = Pgen+ + Pgen−, the power diverted to thedummy loadPload and the radiated powerPrad = Pgen−Pload. All the valuesare normalised to the Pgen+. The horizontal black dashed line represents thelimit for the reflected power that the generator could accept. It is fixed here toVSWR= 1.5. This corresponds to a reflection coeicient Γ = 0.2 which givesPgen−,max = Γ2Pgen+. In the analysis, the value of the generator forwardpower is kept constant although in reality the generator safety system willintervene when the reflected power goes beyond the threshold. Despite thiswill not be possible in practice, the results presented are still valid inside theallowed band. The bandwidth could be then defined as the frequency rangewhere the generator operates inside its specifications. For the case of thesimple antenna presented here, this band is 48MHz to 54.5MHz (see figure5.10). Inside this band, the reflection to the generator is almost zero. Thering is tuned for each frequency, i.e. the two actuators (LSC and LSR, seefigure 4.17) are adjusted to their best value at each single frequency. Theeect is no power dumped in the dummy load and all the power is sent tothe antenna and coupled to the plasma. The same holds for the other antennaconfiguration where the bandwidth is increased to 44.5MHz to 55.5MHz ascould be seen from figure 5.11.
111
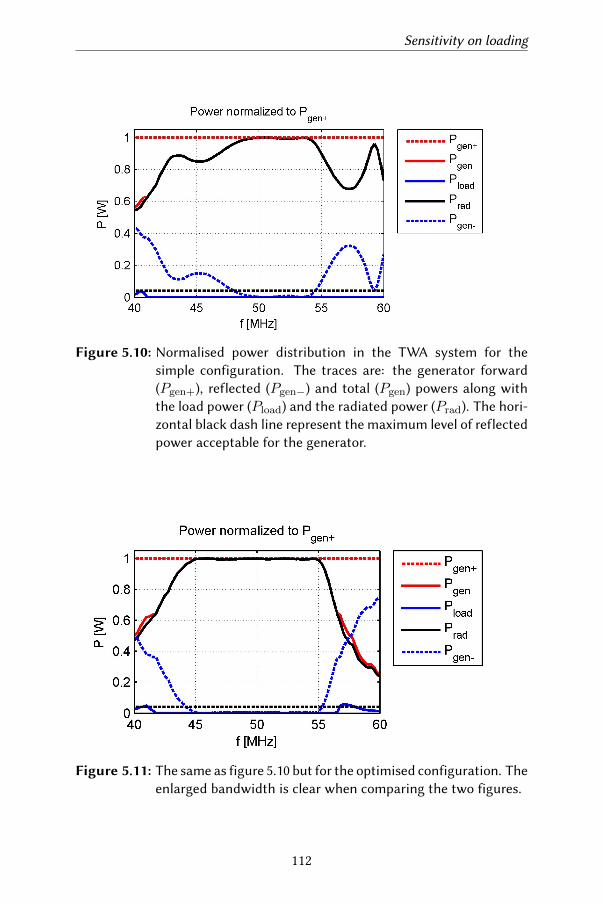
Sensitivity on loading
Figure 5.10: Normalised power distribution in the TWA system for thesimple configuration. The traces are: the generator forward(Pgen+), reflected (Pgen−) and total (Pgen) powers along withthe load power (Pload) and the radiated power (Prad). The hori-zontal black dash line represent the maximum level of reflectedpower acceptable for the generator.
Figure 5.11: The same as figure 5.10 but for the optimised configuration. Theenlarged bandwidth is clear when comparing the two figures.
112
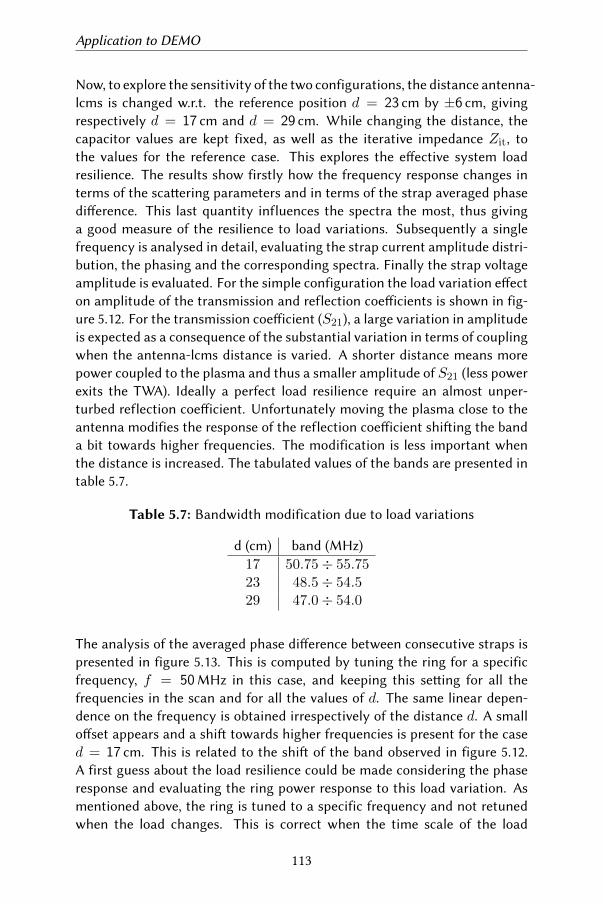
Application to DEMO
Now, to explore the sensitivity of the two configurations, the distance antenna-lcms is changed w.r.t. the reference position d = 23 cm by ±6 cm, givingrespectively d = 17 cm and d = 29 cm. While changing the distance, thecapacitor values are kept fixed, as well as the iterative impedance Zit, tothe values for the reference case. This explores the eective system loadresilience. The results show firstly how the frequency response changes interms of the scaering parameters and in terms of the strap averaged phasedierence. This last quantity influences the spectra the most, thus givinga good measure of the resilience to load variations. Subsequently a singlefrequency is analysed in detail, evaluating the strap current amplitude distri-bution, the phasing and the corresponding spectra. Finally the strap voltageamplitude is evaluated. For the simple configuration the load variation eecton amplitude of the transmission and reflection coeicients is shown in fig-ure 5.12. For the transmission coeicient (S21), a large variation in amplitudeis expected as a consequence of the substantial variation in terms of couplingwhen the antenna-lcms distance is varied. A shorter distance means morepower coupled to the plasma and thus a smaller amplitude of S21 (less powerexits the TWA). Ideally a perfect load resilience require an almost unper-turbed reflection coeicient. Unfortunately moving the plasma close to theantenna modifies the response of the reflection coeicient shiing the banda bit towards higher frequencies. The modification is less important whenthe distance is increased. The tabulated values of the bands are presented intable 5.7.
Table 5.7: Bandwidth modification due to load variations
d (cm) band (MHz)17 50.75÷ 55.7523 48.5÷ 54.529 47.0÷ 54.0
The analysis of the averaged phase dierence between consecutive straps ispresented in figure 5.13. This is computed by tuning the ring for a specificfrequency, f = 50MHz in this case, and keeping this seing for all thefrequencies in the scan and for all the values of d. The same linear depen-dence on the frequency is obtained irrespectively of the distance d. A smalloset appears and a shi towards higher frequencies is present for the cased = 17 cm. This is related to the shi of the band observed in figure 5.12.A first guess about the load resilience could be made considering the phaseresponse and evaluating the ring power response to this load variation. Asmentioned above, the ring is tuned to a specific frequency and not retunedwhen the load changes. This is correct when the time scale of the load
113
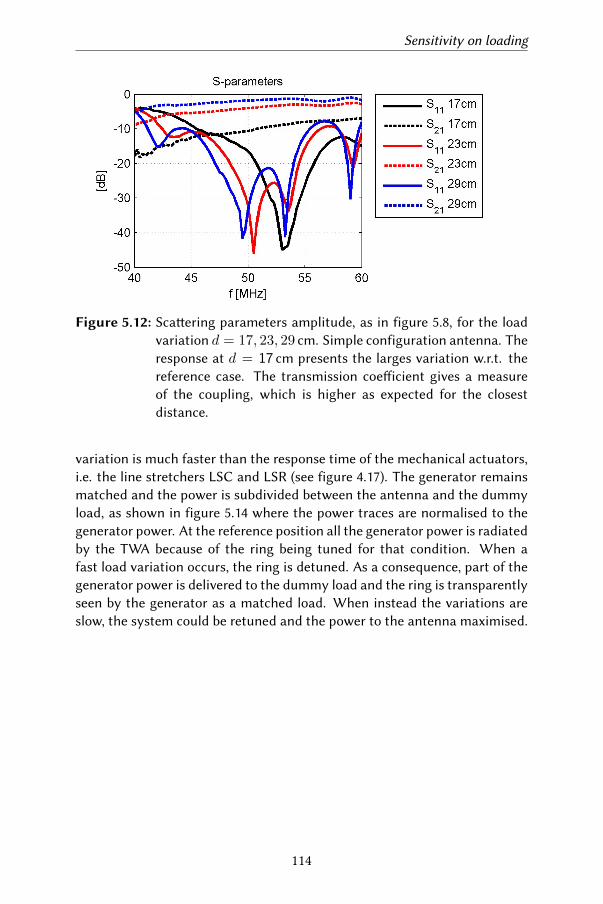
Sensitivity on loading
Figure 5.12: Scaering parameters amplitude, as in figure 5.8, for the loadvariation d = 17, 23, 29 cm. Simple configuration antenna. Theresponse at d = 17 cm presents the larges variation w.r.t. thereference case. The transmission coeicient gives a measureof the coupling, which is higher as expected for the closestdistance.
variation is much faster than the response time of the mechanical actuators,i.e. the line stretchers LSC and LSR (see figure 4.17). The generator remainsmatched and the power is subdivided between the antenna and the dummyload, as shown in figure 5.14 where the power traces are normalised to thegenerator power. At the reference position all the generator power is radiatedby the TWA because of the ring being tuned for that condition. When afast load variation occurs, the ring is detuned. As a consequence, part of thegenerator power is delivered to the dummy load and the ring is transparentlyseen by the generator as a matched load. When instead the variations areslow, the system could be retuned and the power to the antenna maximised.
114
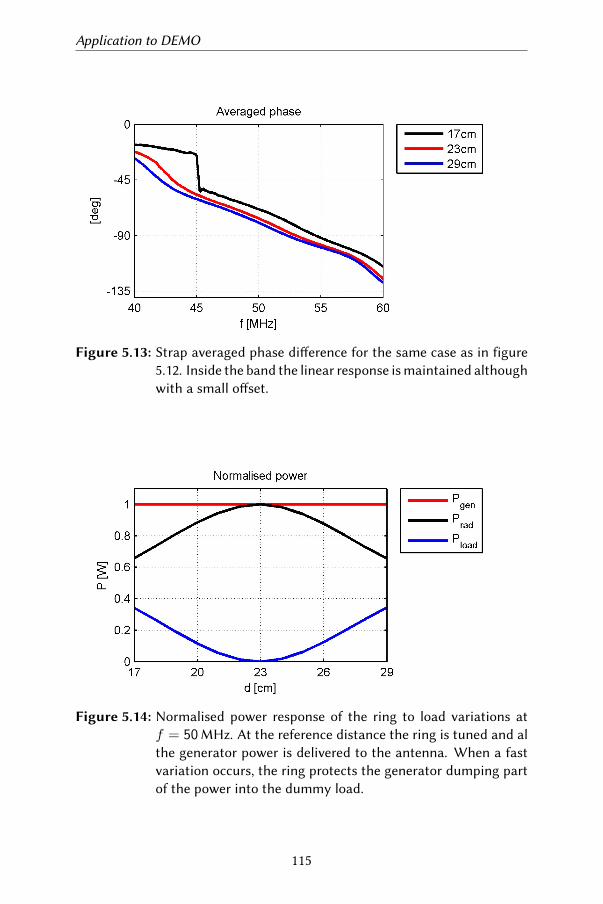
Application to DEMO
Figure 5.13: Strap averaged phase dierence for the same case as in figure5.12. Inside the band the linear response is maintained althoughwith a small oset.
Figure 5.14: Normalised power response of the ring to load variations atf = 50MHz. At the reference distance the ring is tuned and althe generator power is delivered to the antenna. When a fastvariation occurs, the ring protects the generator dumping partof the power into the dummy load.
115
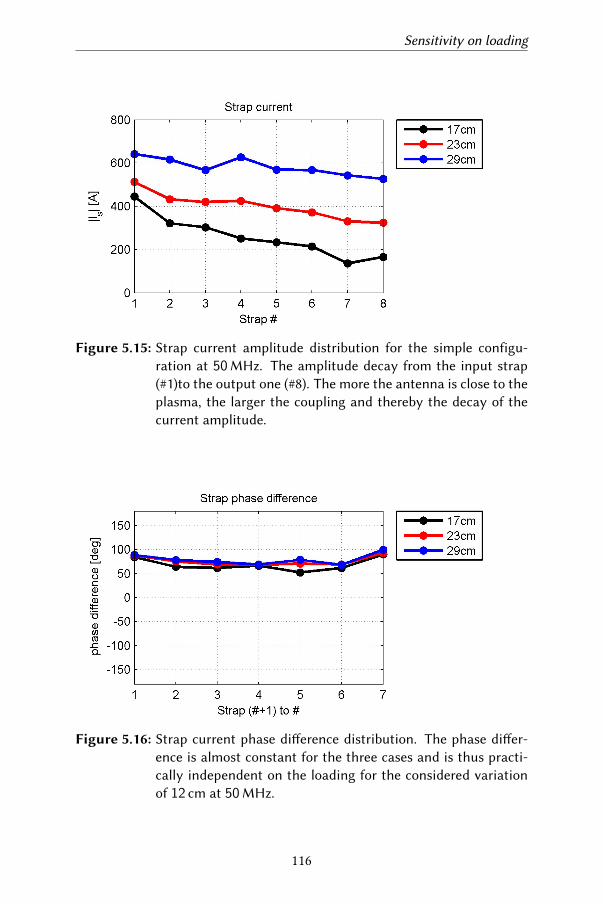
Sensitivity on loading
Figure 5.15: Strap current amplitude distribution for the simple configu-ration at 50MHz. The amplitude decay from the input strap(#1)to the output one (#8). The more the antenna is close to theplasma, the larger the coupling and thereby the decay of thecurrent amplitude.
Figure 5.16: Strap current phase dierence distribution. The phase dier-ence is almost constant for the three cases and is thus practi-cally independent on the loading for the considered variationof 12 cm at 50MHz.
116
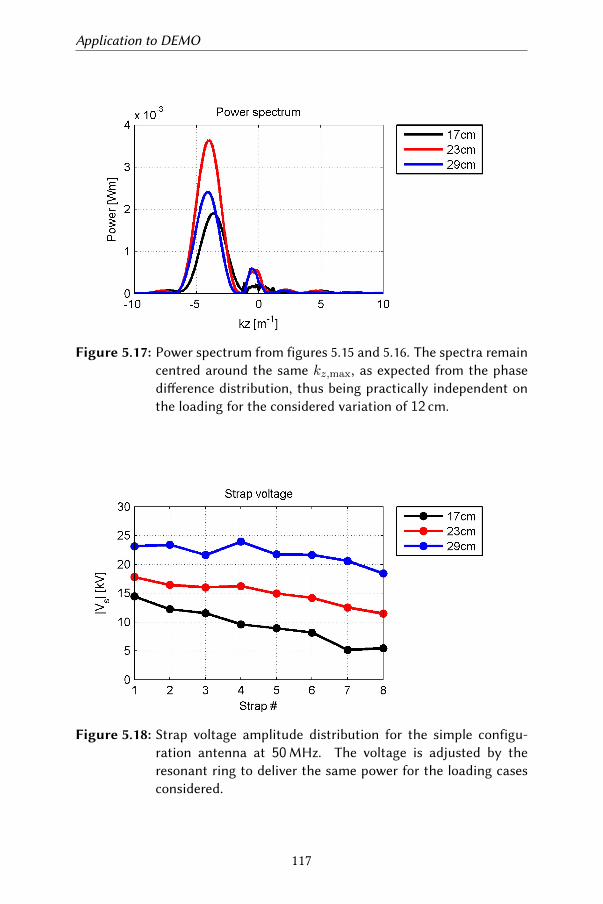
Application to DEMO
Figure 5.17: Power spectrum from figures 5.15 and 5.16. The spectra remaincentred around the same kz,max, as expected from the phasedierence distribution, thus being practically independent onthe loading for the considered variation of 12 cm.
Figure 5.18: Strap voltage amplitude distribution for the simple configu-ration antenna at 50MHz. The voltage is adjusted by theresonant ring to deliver the same power for the loading casesconsidered.
117
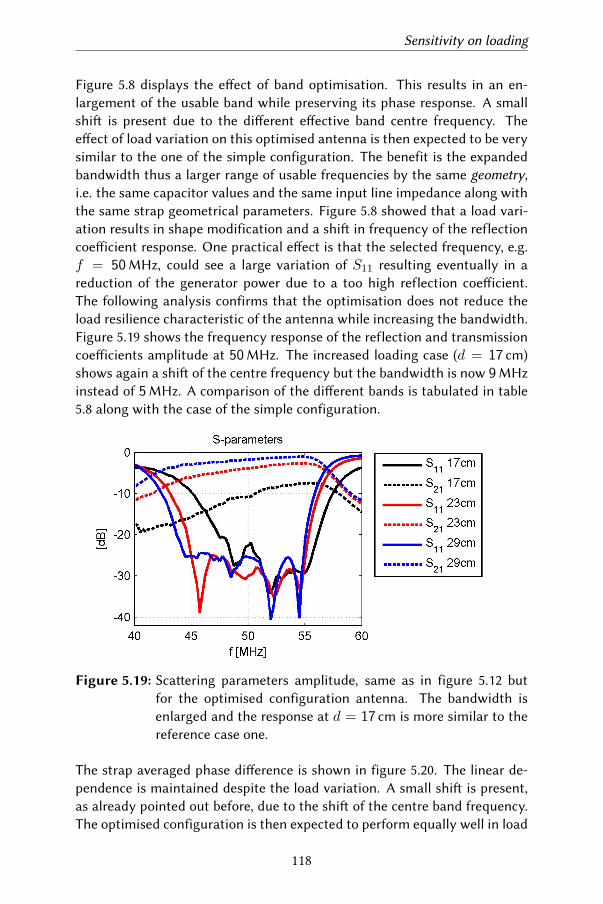
Sensitivity on loading
Figure 5.8 displays the eect of band optimisation. This results in an en-largement of the usable band while preserving its phase response. A smallshi is present due to the dierent eective band centre frequency. Theeect of load variation on this optimised antenna is then expected to be verysimilar to the one of the simple configuration. The benefit is the expandedbandwidth thus a larger range of usable frequencies by the same geometry,i.e. the same capacitor values and the same input line impedance along withthe same strap geometrical parameters. Figure 5.8 showed that a load vari-ation results in shape modification and a shi in frequency of the reflectioncoeicient response. One practical eect is that the selected frequency, e.g.f = 50MHz, could see a large variation of S11 resulting eventually in areduction of the generator power due to a too high reflection coeicient.The following analysis confirms that the optimisation does not reduce theload resilience characteristic of the antenna while increasing the bandwidth.Figure 5.19 shows the frequency response of the reflection and transmissioncoeicients amplitude at 50MHz. The increased loading case (d = 17 cm)shows again a shi of the centre frequency but the bandwidth is now 9MHzinstead of 5MHz. A comparison of the dierent bands is tabulated in table5.8 along with the case of the simple configuration.
Figure 5.19: Scaering parameters amplitude, same as in figure 5.12 butfor the optimised configuration antenna. The bandwidth isenlarged and the response at d = 17 cm is more similar to thereference case one.
The strap averaged phase dierence is shown in figure 5.20. The linear de-pendence is maintained despite the load variation. A small shi is present,as already pointed out before, due to the shi of the centre band frequency.The optimised configuration is then expected to perform equally well in load
118
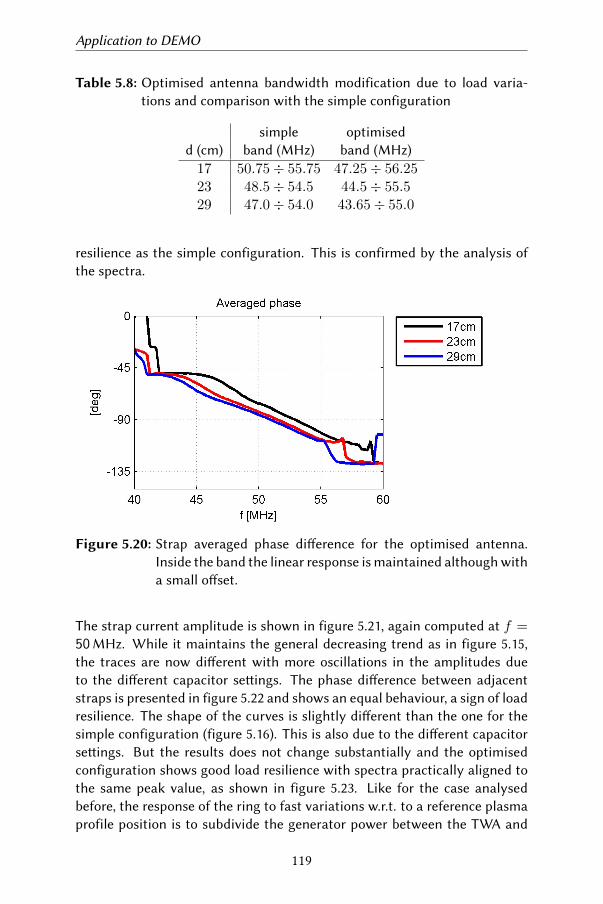
Application to DEMO
Table 5.8: Optimised antenna bandwidth modification due to load varia-tions and comparison with the simple configuration
simple optimisedd (cm) band (MHz) band (MHz)
17 50.75÷ 55.75 47.25÷ 56.2523 48.5÷ 54.5 44.5÷ 55.529 47.0÷ 54.0 43.65÷ 55.0
resilience as the simple configuration. This is confirmed by the analysis ofthe spectra.
Figure 5.20: Strap averaged phase dierence for the optimised antenna.Inside the band the linear response is maintained although witha small oset.
The strap current amplitude is shown in figure 5.21, again computed at f =50MHz. While it maintains the general decreasing trend as in figure 5.15,the traces are now dierent with more oscillations in the amplitudes dueto the dierent capacitor seings. The phase dierence between adjacentstraps is presented in figure 5.22 and shows an equal behaviour, a sign of loadresilience. The shape of the curves is slightly dierent than the one for thesimple configuration (figure 5.16). This is also due to the dierent capacitorseings. But the results does not change substantially and the optimisedconfiguration shows good load resilience with spectra practically aligned tothe same peak value, as shown in figure 5.23. Like for the case analysedbefore, the response of the ring to fast variations w.r.t. to a reference plasmaprofile position is to subdivide the generator power between the TWA and
119
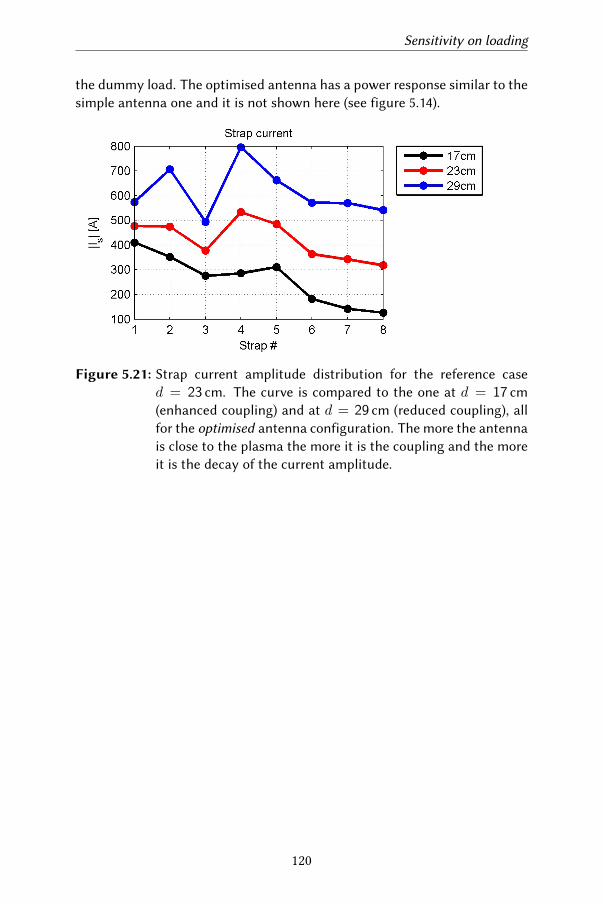
Sensitivity on loading
the dummy load. The optimised antenna has a power response similar to thesimple antenna one and it is not shown here (see figure 5.14).
Figure 5.21: Strap current amplitude distribution for the reference cased = 23 cm. The curve is compared to the one at d = 17 cm(enhanced coupling) and at d = 29 cm (reduced coupling), allfor the optimised antenna configuration. The more the antennais close to the plasma the more it is the coupling and the moreit is the decay of the current amplitude.
120
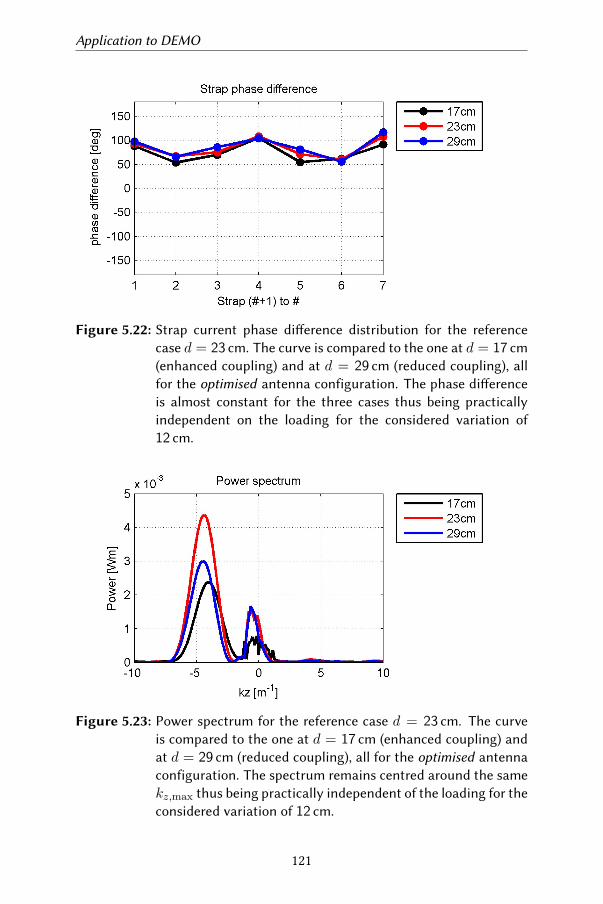
Application to DEMO
Figure 5.22: Strap current phase dierence distribution for the referencecase d = 23 cm. The curve is compared to the one at d = 17 cm(enhanced coupling) and at d = 29 cm (reduced coupling), allfor the optimised antenna configuration. The phase dierenceis almost constant for the three cases thus being practicallyindependent on the loading for the considered variation of12 cm.
Figure 5.23: Power spectrum for the reference case d = 23 cm. The curveis compared to the one at d = 17 cm (enhanced coupling) andat d = 29 cm (reduced coupling), all for the optimised antennaconfiguration. The spectrum remains centred around the samekz,max thus being practically independent of the loading for theconsidered variation of 12 cm.
121
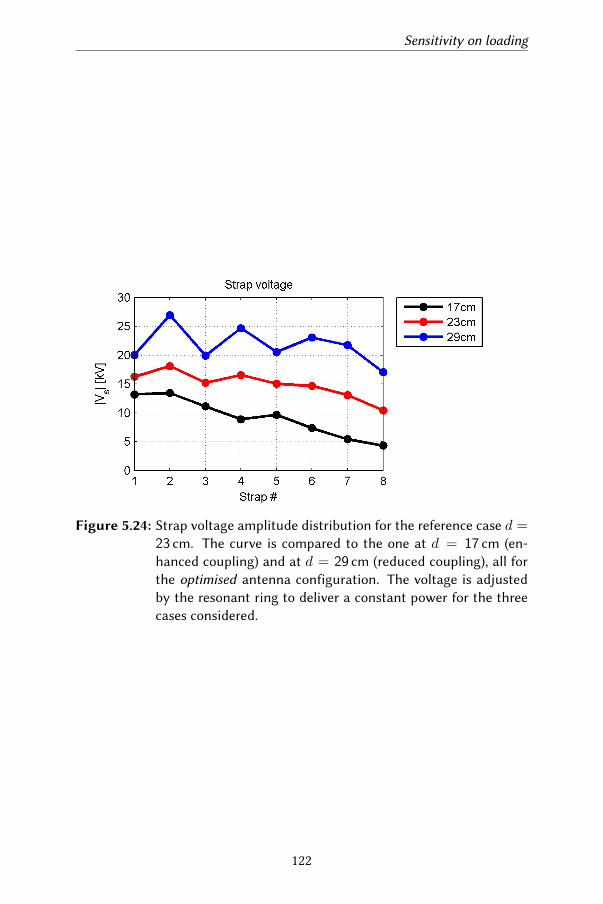
Sensitivity on loading
Figure 5.24: Strap voltage amplitude distribution for the reference case d =23 cm. The curve is compared to the one at d = 17 cm (en-hanced coupling) and at d = 29 cm (reduced coupling), all forthe optimised antenna configuration. The voltage is adjustedby the resonant ring to deliver a constant power for the threecases considered.
122
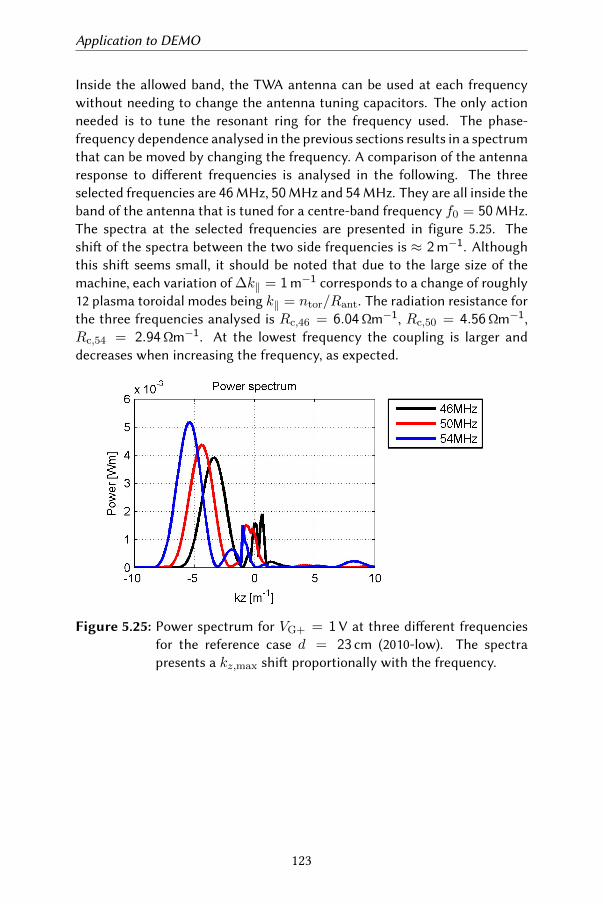
Application to DEMO
Inside the allowed band, the TWA antenna can be used at each frequencywithout needing to change the antenna tuning capacitors. The only actionneeded is to tune the resonant ring for the frequency used. The phase-frequency dependence analysed in the previous sections results in a spectrumthat can be moved by changing the frequency. A comparison of the antennaresponse to dierent frequencies is analysed in the following. The threeselected frequencies are 46MHz, 50MHz and 54MHz. They are all inside theband of the antenna that is tuned for a centre-band frequency f0 = 50MHz.The spectra at the selected frequencies are presented in figure 5.25. Theshi of the spectra between the two side frequencies is ≈ 2m−1. Althoughthis shi seems small, it should be noted that due to the large size of themachine, each variation of ∆k‖ = 1m−1 corresponds to a change of roughly12 plasma toroidal modes being k‖ = ntor/Rant. The radiation resistance forthe three frequencies analysed is Rc,46 = 6.04Ωm−1, Rc,50 = 4.56Ωm−1,Rc,54 = 2.94Ωm−1. At the lowest frequency the coupling is larger anddecreases when increasing the frequency, as expected.
Figure 5.25: Power spectrum for VG+ = 1V at three dierent frequenciesfor the reference case d = 23 cm (2010-low). The spectrapresents a kz,max shi proportionally with the frequency.
123
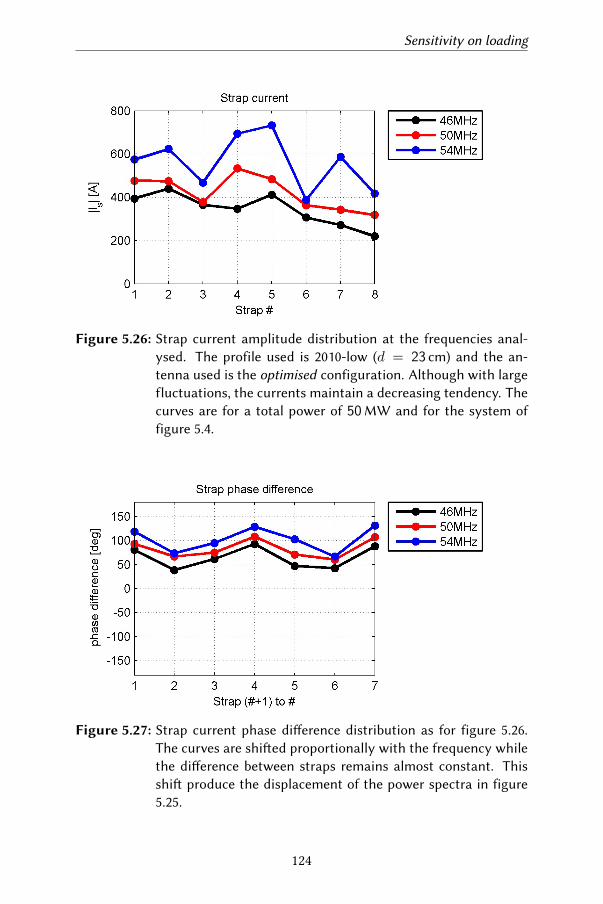
Sensitivity on loading
Figure 5.26: Strap current amplitude distribution at the frequencies anal-ysed. The profile used is 2010-low (d = 23 cm) and the an-tenna used is the optimised configuration. Although with largefluctuations, the currents maintain a decreasing tendency. Thecurves are for a total power of 50MW and for the system offigure 5.4.
Figure 5.27: Strap current phase dierence distribution as for figure 5.26.The curves are shied proportionally with the frequency whilethe dierence between straps remains almost constant. Thisshi produce the displacement of the power spectra in figure5.25.
124
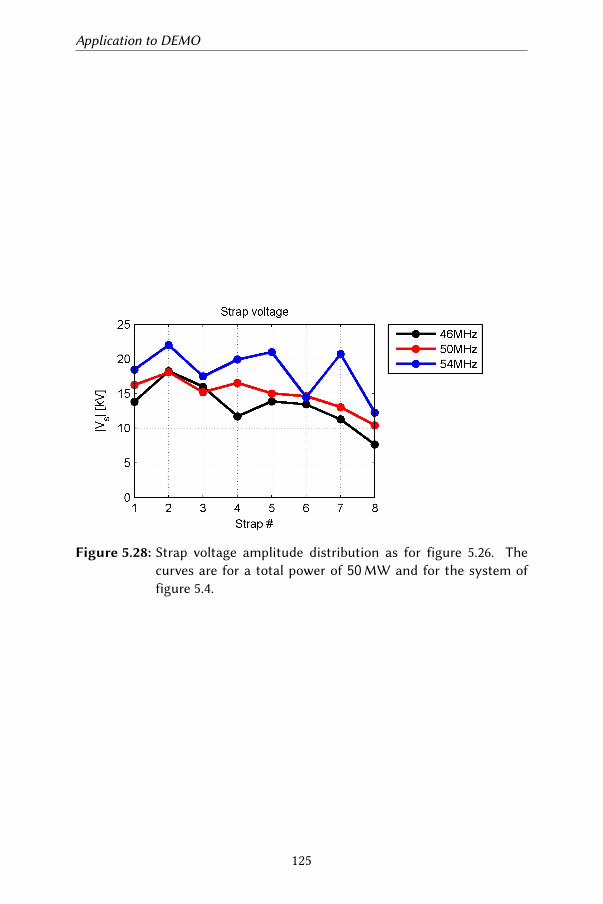
Application to DEMO
Figure 5.28: Strap voltage amplitude distribution as for figure 5.26. Thecurves are for a total power of 50MW and for the system offigure 5.4.
125
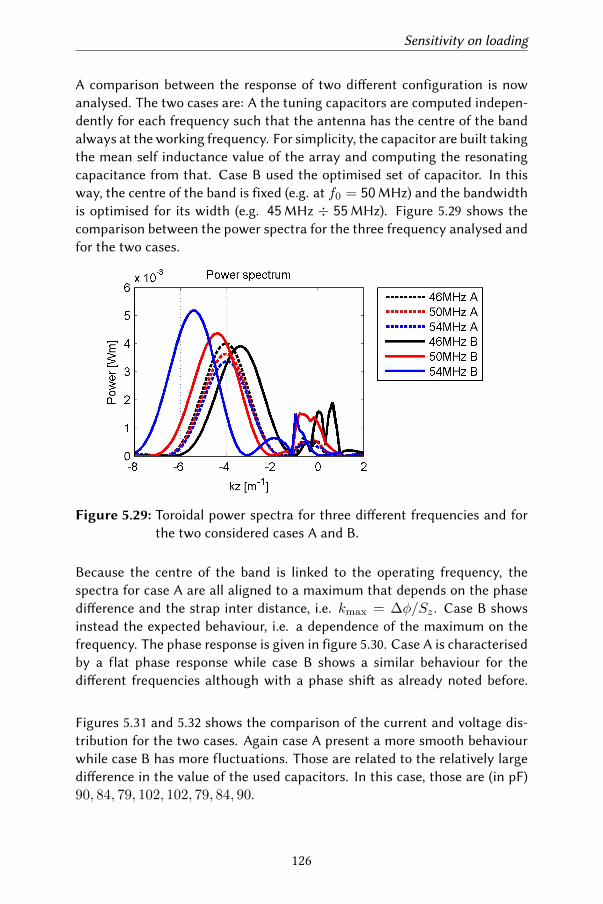
Sensitivity on loading
A comparison between the response of two dierent configuration is nowanalysed. The two cases are: A the tuning capacitors are computed indepen-dently for each frequency such that the antenna has the centre of the bandalways at the working frequency. For simplicity, the capacitor are built takingthe mean self inductance value of the array and computing the resonatingcapacitance from that. Case B used the optimised set of capacitor. In thisway, the centre of the band is fixed (e.g. at f0 = 50MHz) and the bandwidthis optimised for its width (e.g. 45MHz ÷ 55MHz). Figure 5.29 shows thecomparison between the power spectra for the three frequency analysed andfor the two cases.
Figure 5.29: Toroidal power spectra for three dierent frequencies and forthe two considered cases A and B.
Because the centre of the band is linked to the operating frequency, thespectra for case A are all aligned to a maximum that depends on the phasedierence and the strap inter distance, i.e. kmax = ∆φ/Sz . Case B showsinstead the expected behaviour, i.e. a dependence of the maximum on thefrequency. The phase response is given in figure 5.30. Case A is characterisedby a flat phase response while case B shows a similar behaviour for thedierent frequencies although with a phase shi as already noted before.
Figures 5.31 and 5.32 shows the comparison of the current and voltage dis-tribution for the two cases. Again case A present a more smooth behaviourwhile case B has more fluctuations. Those are related to the relatively largedierence in the value of the used capacitors. In this case, those are (in pF)90, 84, 79, 102, 102, 79, 84, 90.
126
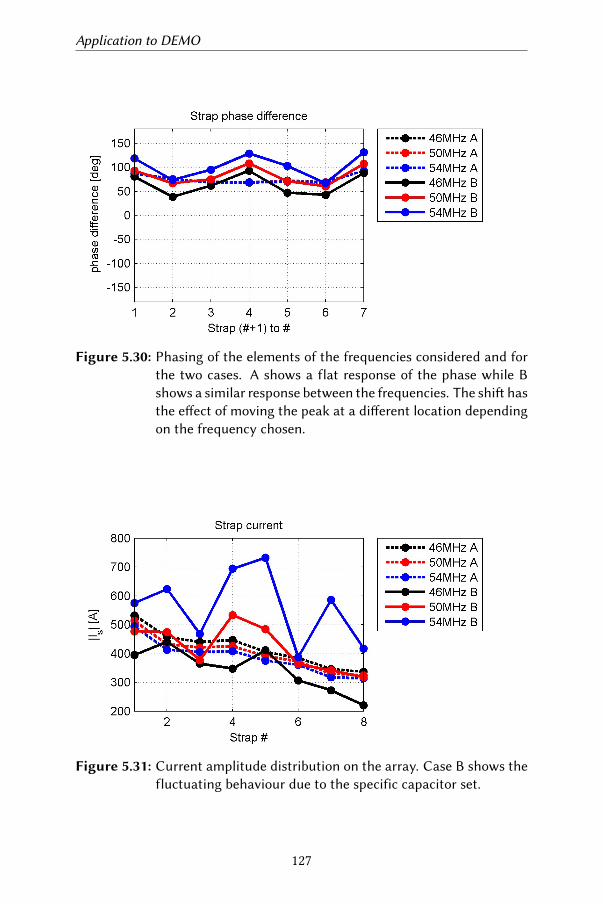
Application to DEMO
Figure 5.30: Phasing of the elements of the frequencies considered and forthe two cases. A shows a flat response of the phase while Bshows a similar response between the frequencies. The shi hasthe eect of moving the peak at a dierent location dependingon the frequency chosen.
Figure 5.31: Current amplitude distribution on the array. Case B shows thefluctuating behaviour due to the specific capacitor set.
127
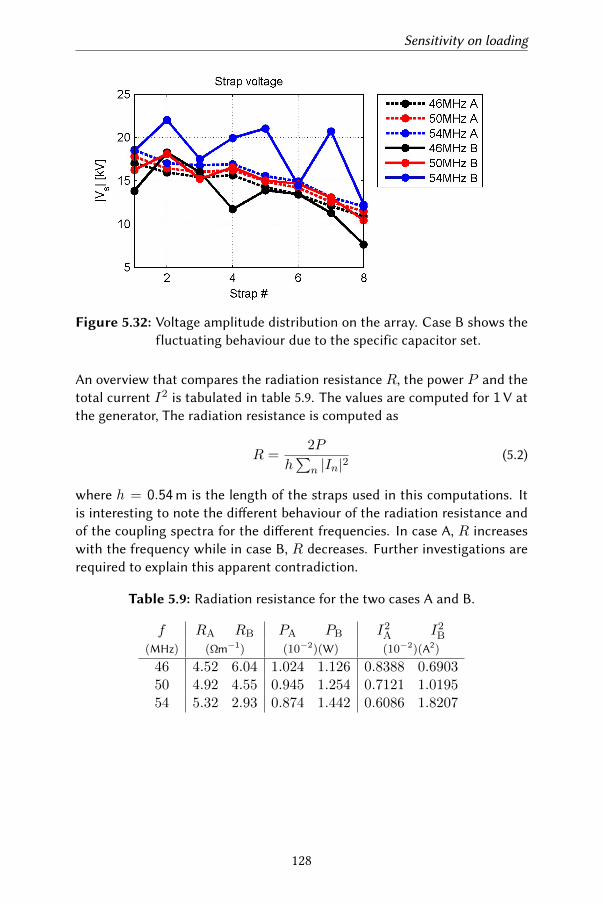
Sensitivity on loading
Figure 5.32: Voltage amplitude distribution on the array. Case B shows thefluctuating behaviour due to the specific capacitor set.
An overview that compares the radiation resistance R, the power P and thetotal current I2 is tabulated in table 5.9. The values are computed for 1V atthe generator, The radiation resistance is computed as
R =2P
h∑
n |In|2(5.2)
where h = 0.54m is the length of the straps used in this computations. Itis interesting to note the dierent behaviour of the radiation resistance andof the coupling spectra for the dierent frequencies. In case A, R increaseswith the frequency while in case B, R decreases. Further investigations arerequired to explain this apparent contradiction.
Table 5.9: Radiation resistance for the two cases A and B.
f RA RB PA PB I2A I2
B
(MHz) (Ωm−1) (10−2)(W) (10−2)(A2)
46 4.52 6.04 1.024 1.126 0.8388 0.690350 4.92 4.55 0.945 1.254 0.7121 1.019554 5.32 2.93 0.874 1.442 0.6086 1.8207
128
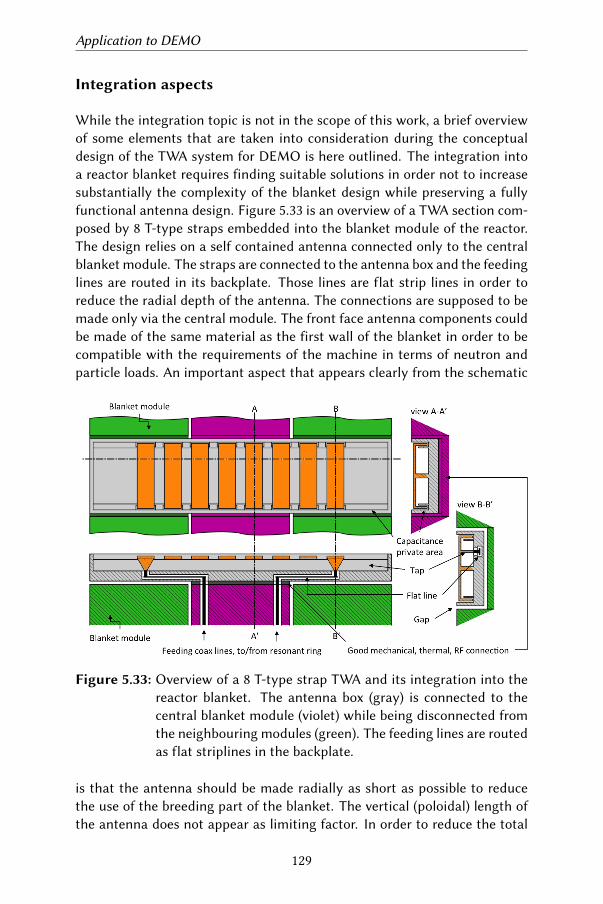
Application to DEMO
Integration aspects
While the integration topic is not in the scope of this work, a brief overviewof some elements that are taken into consideration during the conceptualdesign of the TWA system for DEMO is here outlined. The integration intoa reactor blanket requires finding suitable solutions in order not to increasesubstantially the complexity of the blanket design while preserving a fullyfunctional antenna design. Figure 5.33 is an overview of a TWA section com-posed by 8 T-type straps embedded into the blanket module of the reactor.The design relies on a self contained antenna connected only to the centralblanket module. The straps are connected to the antenna box and the feedinglines are routed in its backplate. Those lines are flat strip lines in order toreduce the radial depth of the antenna. The connections are supposed to bemade only via the central module. The front face antenna components couldbe made of the same material as the first wall of the blanket in order to becompatible with the requirements of the machine in terms of neutron andparticle loads. An important aspect that appears clearly from the schematic
Figure 5.33: Overview of a 8 T-type strap TWA and its integration into thereactor blanket. The antenna box (gray) is connected to thecentral blanket module (violet) while being disconnected fromthe neighbouring modules (green). The feeding lines are routedas flat striplines in the backplate.
is that the antenna should be made radially as short as possible to reducethe use of the breeding part of the blanket. The vertical (poloidal) length ofthe antenna does not appear as limiting factor. In order to reduce the total
129
Sensitivity on loading
radial depth of the antenna, flat coaxial lines (symmetric strip-lines) are usedto connect the (round) coaxial feeding lines coming from the outboard of thecentral blanket module to the side straps. The toroidal length of the antennacould be adapted to reduce, if necessary, the mechanical forces induced by adisruption. The passive straps do not present this issue because they do notform a closed loop. The eect of disruptions on the fed elements has to bequantified. Some preliminary studies are ongoing to assess the compatibilitywith the remote handling procedures. A possible solution for the deploymentof the antenna is to access the vessel from the equatorial plane or from theupper port. A similar technique was used to deploy the JET ILA. The idealsolution is however a fully integrated antenna that is part of the blanket.This allows reducing the RH requirements because the antenna is installedin the blanket during its assembly in the factory and not inside the vessel.The major issue of this solution is the continuity of the RF current in thebackplate of the antenna. Separated modules appear possible from the pointof view of the coupling between elements. A wave should travel on this newstructure with its own dispersion relation, possibly dierent from the onea continuous structure. The problem is the separation between the blanketmodules that creates a cavity with subsequent high electric field with a po-larisation favourable to excite the unwanted SMW. A study of this eect willbe performed in a future work. Finally, the poloidal position of the antennais still subject of discussion. The schematic shown in figure 5.33 is validfor every poloidal angle. The major dierence will be the available toroidallength that is maximum at the equatorial plane. In this particular location,the feeding of the antenna could be routed from the equatorial ports.
A dedicated study on the integration of this the of antenna requires a con-siderable eort and will be performed in the following years, adapting theantenna design to the final blanket design, when ready.
130
Chapter 6
Proof of Principle on WEST
At Cadarache (south of France), the Institute for Magnetic Fusion Research(CEA/DSM/IRFM) has modified the Tore Supra plasma facility which aerits transformation has become a test platform open to all ITER partners:the WEST project (acronym for W, the symbol element tungsten, Environ-ment in Steady-state Tokamak). The goal of the transformation was to equipthe tokamak with an actively cooled tungsten divertor, benefiing from itsunique long pulse capabilities, its high level of additional power and theunique experience of operation with actively cooled components. The diver-tor is a key component which faces the largest part of the heat and particlefluxes coming from the core plasma during experiments. Since Tore Suprawas a circular plasma device with a toroidal limiter, the upgrade primarilyconsisted of inserting additional in-vacuum vessel magnetic coils to allow theproduction of divertor plasma shapes, just like those which ITER uses. TheWEST tungsten divertor elements use the same design and manufacturersas the ITER ones. The series production and operation of the ITER tungstencomponents are the new challenges that the WEST Project will address, inclose collaboration with ITER Organisation and all interested parties. Byequipping the vessel with an entirely metallic blanket, WEST gains the capac-ity to carry out tests on high flux components made of tungsten in conditionssimilar to those of ITER. The implementation of the WEST Project requiredconsiderable modifications of the machine’s internal elements. In additionnew diagnostics and new ICRF antennas are (and will be) installed in theWEST tokamak. The transformation from a circular to a divertor plasmashape, while maintaing the same vessel structure, has reduced the plasmavolume, thus freeing some space that can be used to place a TWA antenna.
131
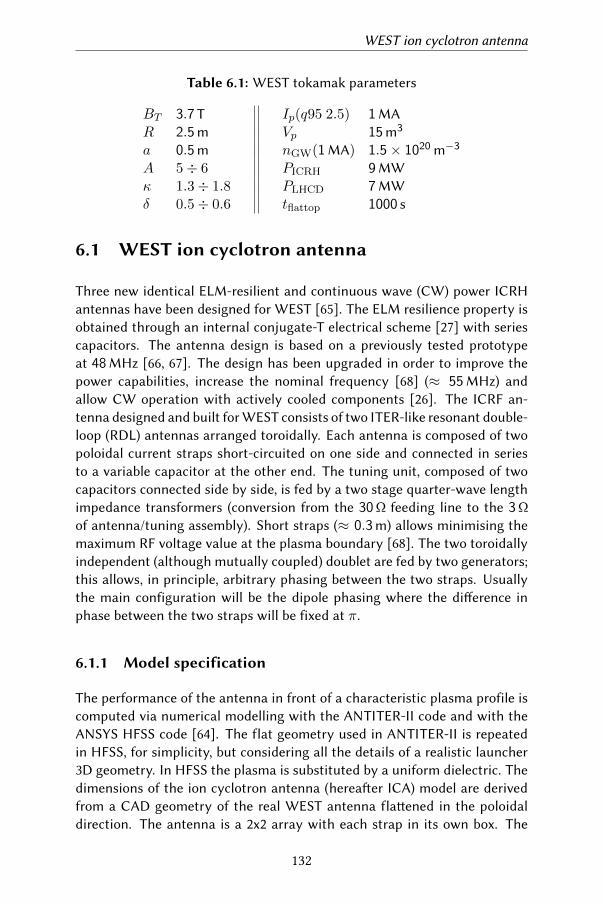
WEST ion cyclotron antenna
Table 6.1: WEST tokamak parameters
BT 3.7 T Ip(q95 2.5) 1MAR 2.5m Vp 15m3
a 0.5m nGW(1MA) 1.5× 10²⁰ m−3
A 5÷ 6 PICRH 9MWκ 1.3÷ 1.8 PLHCD 7MWδ 0.5÷ 0.6 tflattop 1000 s
6.1 WEST ion cyclotron antenna
Three new identical ELM-resilient and continuous wave (CW) power ICRHantennas have been designed for WEST [65]. The ELM resilience property isobtained through an internal conjugate-T electrical scheme [27] with seriescapacitors. The antenna design is based on a previously tested prototypeat 48MHz [66, 67]. The design has been upgraded in order to improve thepower capabilities, increase the nominal frequency [68] (≈ 55MHz) andallow CW operation with actively cooled components [26]. The ICRF an-tenna designed and built for WEST consists of two ITER-like resonant double-loop (RDL) antennas arranged toroidally. Each antenna is composed of twopoloidal current straps short-circuited on one side and connected in seriesto a variable capacitor at the other end. The tuning unit, composed of twocapacitors connected side by side, is fed by a two stage quarter-wave lengthimpedance transformers (conversion from the 30Ω feeding line to the 3Ωof antenna/tuning assembly). Short straps (≈ 0.3m) allows minimising themaximum RF voltage value at the plasma boundary [68]. The two toroidallyindependent (although mutually coupled) doublet are fed by two generators;this allows, in principle, arbitrary phasing between the two straps. Usuallythe main configuration will be the dipole phasing where the dierence inphase between the two straps will be fixed at π.
6.1.1 Model specification
The performance of the antenna in front of a characteristic plasma profile iscomputed via numerical modelling with the ANTITER-II code and with theANSYS HFSS code [64]. The flat geometry used in ANTITER-II is repeatedin HFSS, for simplicity, but considering all the details of a realistic launcher3D geometry. In HFSS the plasma is substituted by a uniform dielectric. Thedimensions of the ion cyclotron antenna (hereaer ICA) model are derivedfrom a CAD geometry of the real WEST antenna flaened in the poloidaldirection. The antenna is a 2x2 array with each strap in its own box. The
132
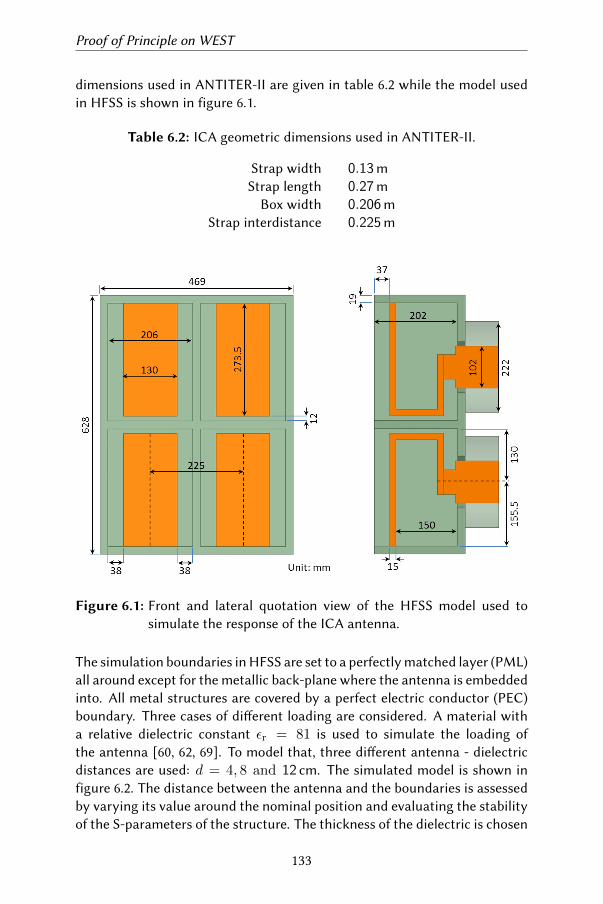
Proof of Principle on WEST
dimensions used in ANTITER-II are given in table 6.2 while the model usedin HFSS is shown in figure 6.1.
Table 6.2: ICA geometric dimensions used in ANTITER-II.
Strap width 0.13mStrap length 0.27m
Box width 0.206mStrap interdistance 0.225m
Figure 6.1: Front and lateral quotation view of the HFSS model used tosimulate the response of the ICA antenna.
The simulation boundaries in HFSS are set to a perfectly matched layer (PML)all around except for the metallic back-plane where the antenna is embeddedinto. All metal structures are covered by a perfect electric conductor (PEC)boundary. Three cases of dierent loading are considered. A material witha relative dielectric constant εr = 81 is used to simulate the loading ofthe antenna [60, 62, 69]. To model that, three dierent antenna - dielectricdistances are used: d = 4, 8 and 12 cm. The simulated model is shown infigure 6.2. The distance between the antenna and the boundaries is assessedby varying its value around the nominal position and evaluating the stabilityof the S-parameters of the structure. The thickness of the dielectric is chosen
133
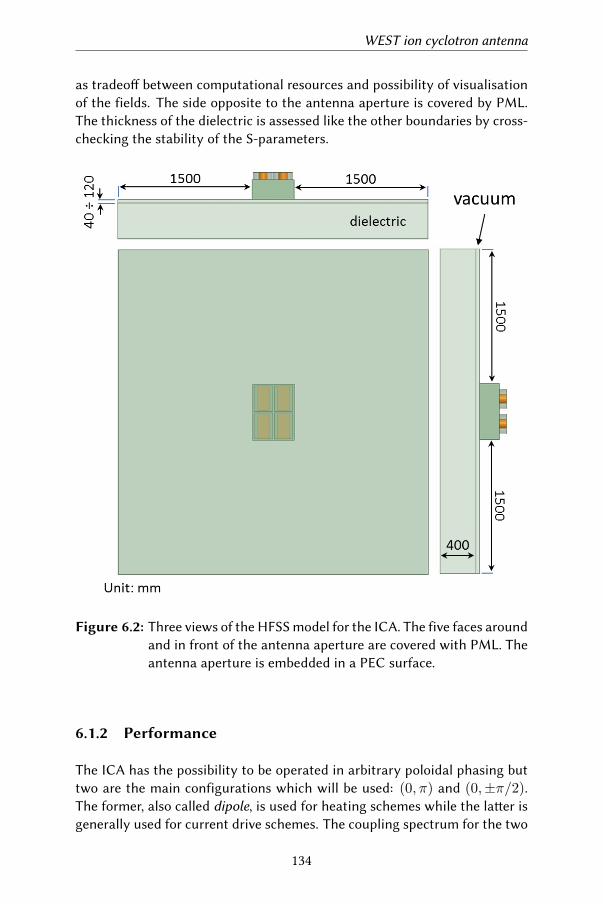
WEST ion cyclotron antenna
as tradeo between computational resources and possibility of visualisationof the fields. The side opposite to the antenna aperture is covered by PML.The thickness of the dielectric is assessed like the other boundaries by cross-checking the stability of the S-parameters.
Figure 6.2: Three views of the HFSS model for the ICA. The five faces aroundand in front of the antenna aperture are covered with PML. Theantenna aperture is embedded in a PEC surface.
6.1.2 Performance
The ICA has the possibility to be operated in arbitrary poloidal phasing buttwo are the main configurations which will be used: (0, π) and (0,±π/2).The former, also called dipole, is used for heating schemes while the laer isgenerally used for current drive schemes. The coupling spectrum for the two
134
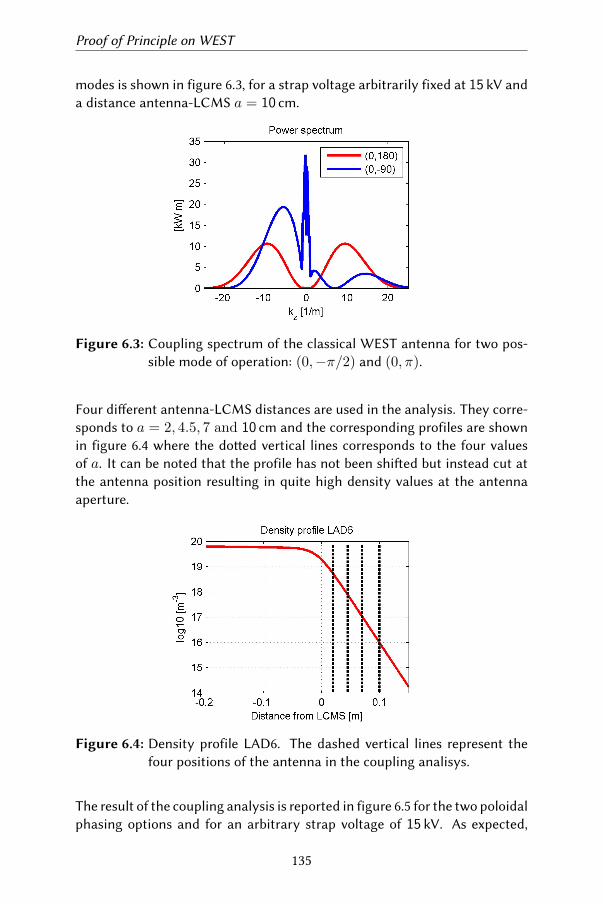
Proof of Principle on WEST
modes is shown in figure 6.3, for a strap voltage arbitrarily fixed at 15 kV anda distance antenna-LCMS a = 10 cm.
Figure 6.3: Coupling spectrum of the classical WEST antenna for two pos-sible mode of operation: (0,−π/2) and (0, π).
Four dierent antenna-LCMS distances are used in the analysis. They corre-sponds to a = 2, 4.5, 7 and 10 cm and the corresponding profiles are shownin figure 6.4 where the doed vertical lines corresponds to the four valuesof a. It can be noted that the profile has not been shied but instead cut atthe antenna position resulting in quite high density values at the antennaaperture.
Figure 6.4: Density profile LAD6. The dashed vertical lines represent thefour positions of the antenna in the coupling analisys.
The result of the coupling analysis is reported in figure 6.5 for the two poloidalphasing options and for an arbitrary strap voltage of 15 kV. As expected,
135
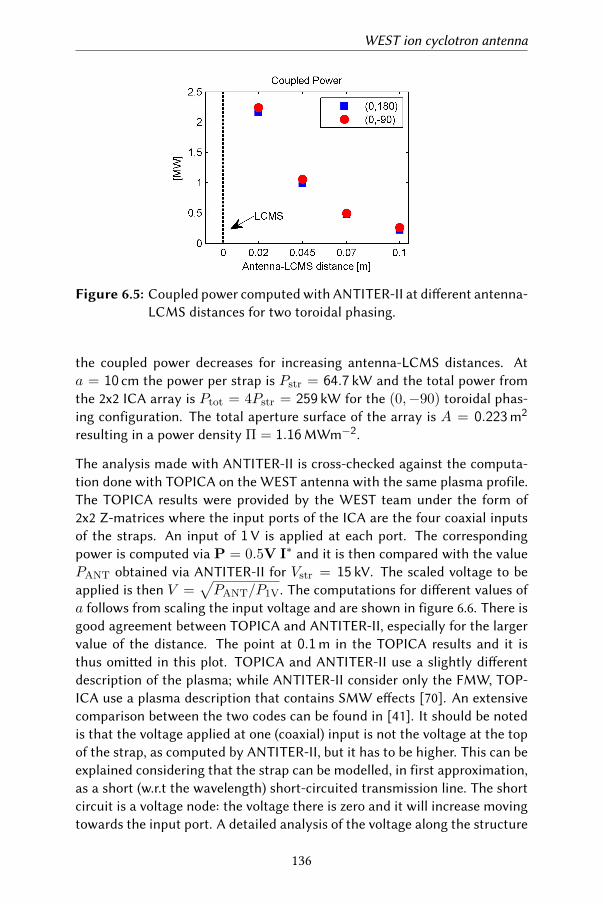
WEST ion cyclotron antenna
Figure 6.5: Coupled power computed with ANTITER-II at dierent antenna-LCMS distances for two toroidal phasing.
the coupled power decreases for increasing antenna-LCMS distances. Ata = 10 cm the power per strap is Pstr = 64.7 kW and the total power fromthe 2x2 ICA array is Ptot = 4Pstr = 259 kW for the (0,−90) toroidal phas-ing configuration. The total aperture surface of the array is A = 0.223m2
resulting in a power density Π = 1.16MWm−2.
The analysis made with ANTITER-II is cross-checked against the computa-tion done with TOPICA on the WEST antenna with the same plasma profile.The TOPICA results were provided by the WEST team under the form of2x2 Z-matrices where the input ports of the ICA are the four coaxial inputsof the straps. An input of 1V is applied at each port. The correspondingpower is computed via P = 0.5V I∗ and it is then compared with the valuePANT obtained via ANTITER-II for Vstr = 15 kV. The scaled voltage to beapplied is then V =
√PANT/P1V. The computations for dierent values of
a follows from scaling the input voltage and are shown in figure 6.6. There isgood agreement between TOPICA and ANTITER-II, especially for the largervalue of the distance. The point at 0.1m in the TOPICA results and it isthus omied in this plot. TOPICA and ANTITER-II use a slightly dierentdescription of the plasma; while ANTITER-II consider only the FMW, TOP-ICA use a plasma description that contains SMW eects [70]. An extensivecomparison between the two codes can be found in [41]. It should be notedis that the voltage applied at one (coaxial) input is not the voltage at the topof the strap, as computed by ANTITER-II, but it has to be higher. This can beexplained considering that the strap can be modelled, in first approximation,as a short (w.r.t the wavelength) short-circuited transmission line. The shortcircuit is a voltage node: the voltage there is zero and it will increase movingtowards the input port. A detailed analysis of the voltage along the structure
136
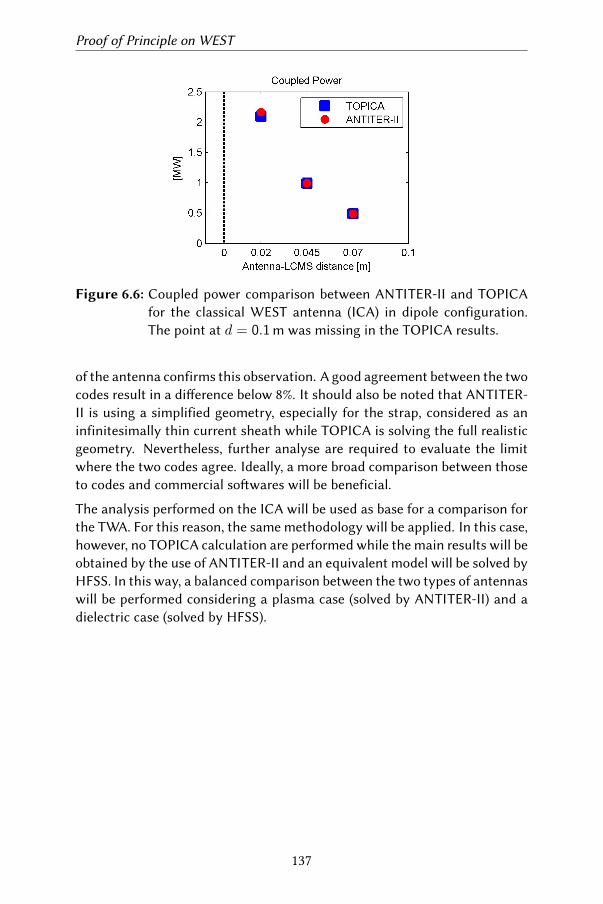
Proof of Principle on WEST
Figure 6.6: Coupled power comparison between ANTITER-II and TOPICAfor the classical WEST antenna (ICA) in dipole configuration.The point at d = 0.1m was missing in the TOPICA results.
of the antenna confirms this observation. A good agreement between the twocodes result in a dierence below 8%. It should also be noted that ANTITER-II is using a simplified geometry, especially for the strap, considered as aninfinitesimally thin current sheath while TOPICA is solving the full realisticgeometry. Nevertheless, further analyse are required to evaluate the limitwhere the two codes agree. Ideally, a more broad comparison between thoseto codes and commercial sowares will be beneficial.
The analysis performed on the ICA will be used as base for a comparison forthe TWA. For this reason, the same methodology will be applied. In this case,however, no TOPICA calculation are performed while the main results will beobtained by the use of ANTITER-II and an equivalent model will be solved byHFSS. In this way, a balanced comparison between the two types of antennaswill be performed considering a plasma case (solved by ANTITER-II) and adielectric case (solved by HFSS).
137
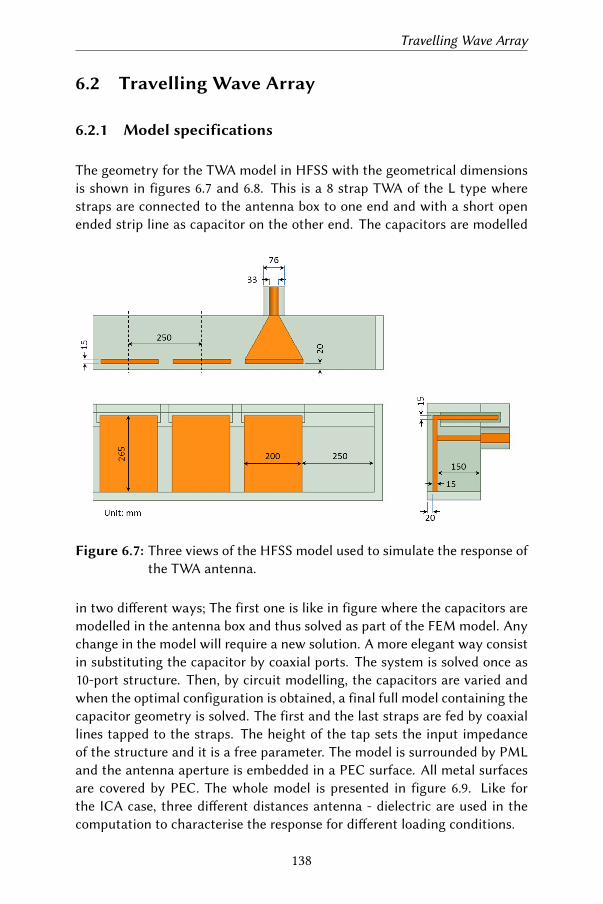
Travelling Wave Array
6.2 Travelling Wave Array
6.2.1 Model specifications
The geometry for the TWA model in HFSS with the geometrical dimensionsis shown in figures 6.7 and 6.8. This is a 8 strap TWA of the L type wherestraps are connected to the antenna box to one end and with a short openended strip line as capacitor on the other end. The capacitors are modelled
Figure 6.7: Three views of the HFSS model used to simulate the response ofthe TWA antenna.
in two dierent ways; The first one is like in figure where the capacitors aremodelled in the antenna box and thus solved as part of the FEM model. Anychange in the model will require a new solution. A more elegant way consistin substituting the capacitor by coaxial ports. The system is solved once as10-port structure. Then, by circuit modelling, the capacitors are varied andwhen the optimal configuration is obtained, a final full model containing thecapacitor geometry is solved. The first and the last straps are fed by coaxiallines tapped to the straps. The height of the tap sets the input impedanceof the structure and it is a free parameter. The model is surrounded by PMLand the antenna aperture is embedded in a PEC surface. All metal surfacesare covered by PEC. The whole model is presented in figure 6.9. Like forthe ICA case, three dierent distances antenna - dielectric are used in thecomputation to characterise the response for dierent loading conditions.
138
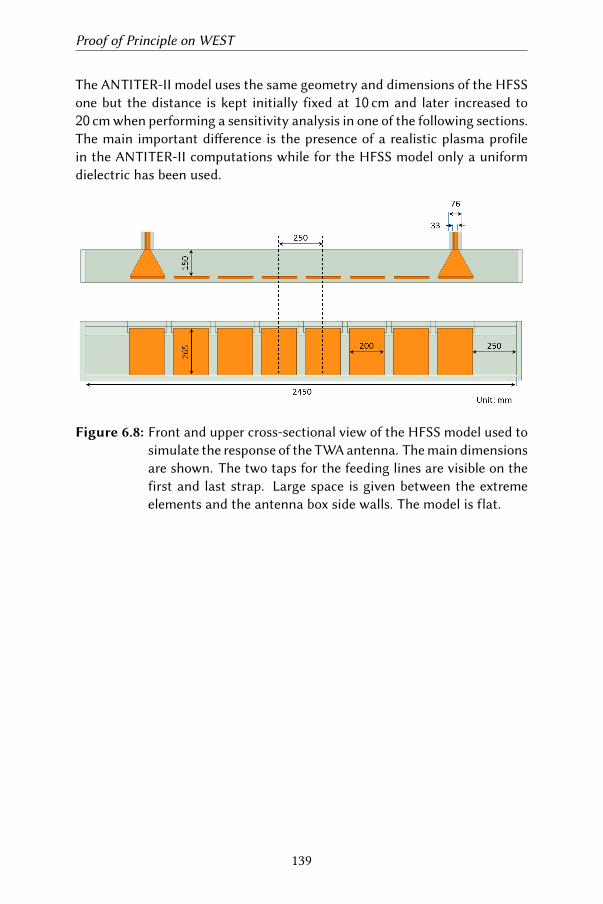
Proof of Principle on WEST
The ANTITER-II model uses the same geometry and dimensions of the HFSSone but the distance is kept initially fixed at 10 cm and later increased to20 cm when performing a sensitivity analysis in one of the following sections.The main important dierence is the presence of a realistic plasma profilein the ANTITER-II computations while for the HFSS model only a uniformdielectric has been used.
Figure 6.8: Front and upper cross-sectional view of the HFSS model used tosimulate the response of the TWA antenna. The main dimensionsare shown. The two taps for the feeding lines are visible on thefirst and last strap. Large space is given between the extremeelements and the antenna box side walls. The model is flat.
139
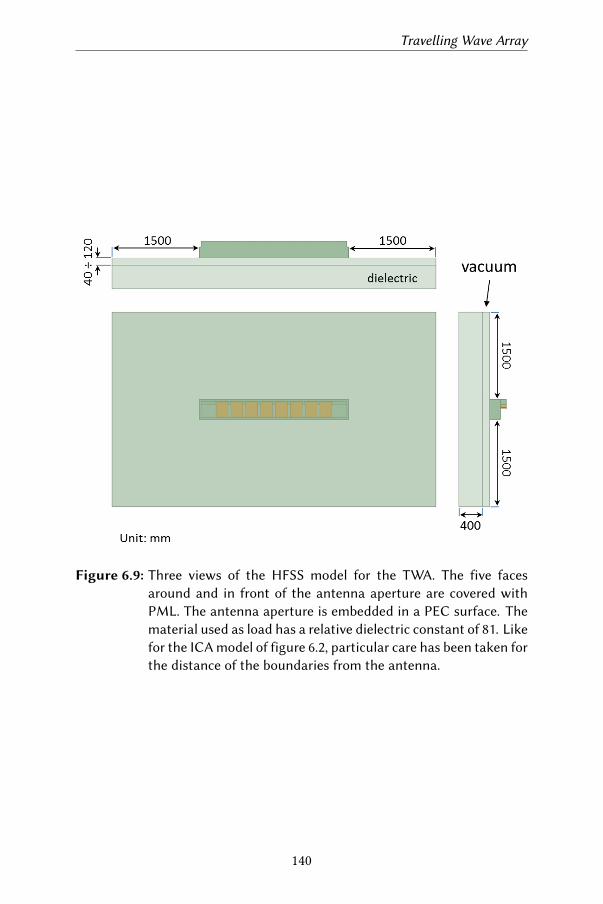
Travelling Wave Array
Figure 6.9: Three views of the HFSS model for the TWA. The five facesaround and in front of the antenna aperture are covered withPML. The antenna aperture is embedded in a PEC surface. Thematerial used as load has a relative dielectric constant of 81. Likefor the ICA model of figure 6.2, particular care has been taken forthe distance of the boundaries from the antenna.
140
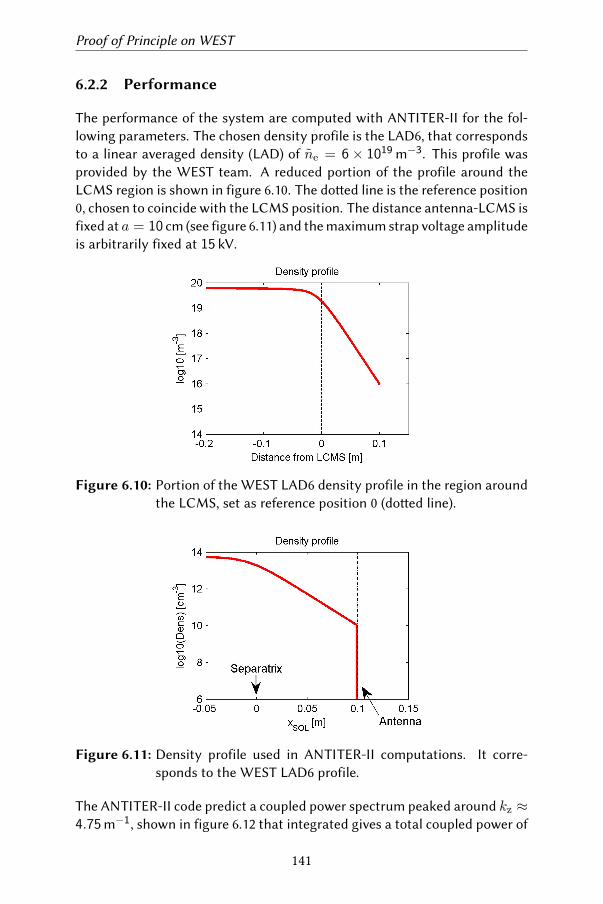
Proof of Principle on WEST
6.2.2 Performance
The performance of the system are computed with ANTITER-II for the fol-lowing parameters. The chosen density profile is the LAD6, that correspondsto a linear averaged density (LAD) of ne = 6× 10¹⁹ m−3. This profile wasprovided by the WEST team. A reduced portion of the profile around theLCMS region is shown in figure 6.10. The doed line is the reference position0, chosen to coincide with the LCMS position. The distance antenna-LCMS isfixed at a = 10 cm (see figure 6.11) and the maximum strap voltage amplitudeis arbitrarily fixed at 15 kV.
Figure 6.10: Portion of the WEST LAD6 density profile in the region aroundthe LCMS, set as reference position 0 (doed line).
Figure 6.11: Density profile used in ANTITER-II computations. It corre-sponds to the WEST LAD6 profile.
The ANTITER-II code predict a coupled power spectrum peaked around kz ≈4.75m−1, shown in figure 6.12 that integrated gives a total coupled power of
141
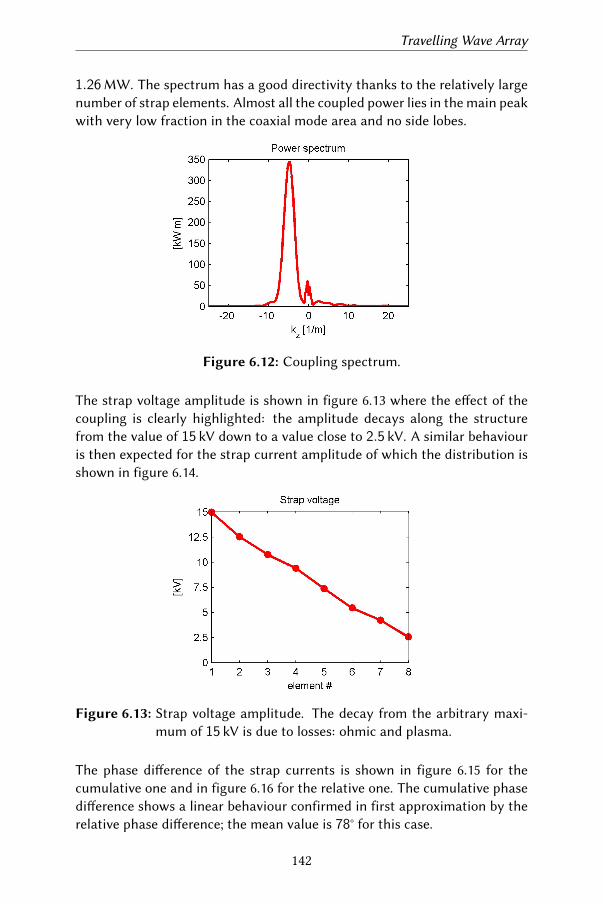
Travelling Wave Array
1.26MW. The spectrum has a good directivity thanks to the relatively largenumber of strap elements. Almost all the coupled power lies in the main peakwith very low fraction in the coaxial mode area and no side lobes.
Figure 6.12: Coupling spectrum.
The strap voltage amplitude is shown in figure 6.13 where the eect of thecoupling is clearly highlighted: the amplitude decays along the structurefrom the value of 15 kV down to a value close to 2.5 kV. A similar behaviouris then expected for the strap current amplitude of which the distribution isshown in figure 6.14.
Figure 6.13: Strap voltage amplitude. The decay from the arbitrary maxi-mum of 15 kV is due to losses: ohmic and plasma.
The phase dierence of the strap currents is shown in figure 6.15 for thecumulative one and in figure 6.16 for the relative one. The cumulative phasedierence shows a linear behaviour confirmed in first approximation by therelative phase dierence; the mean value is 78° for this case.
142
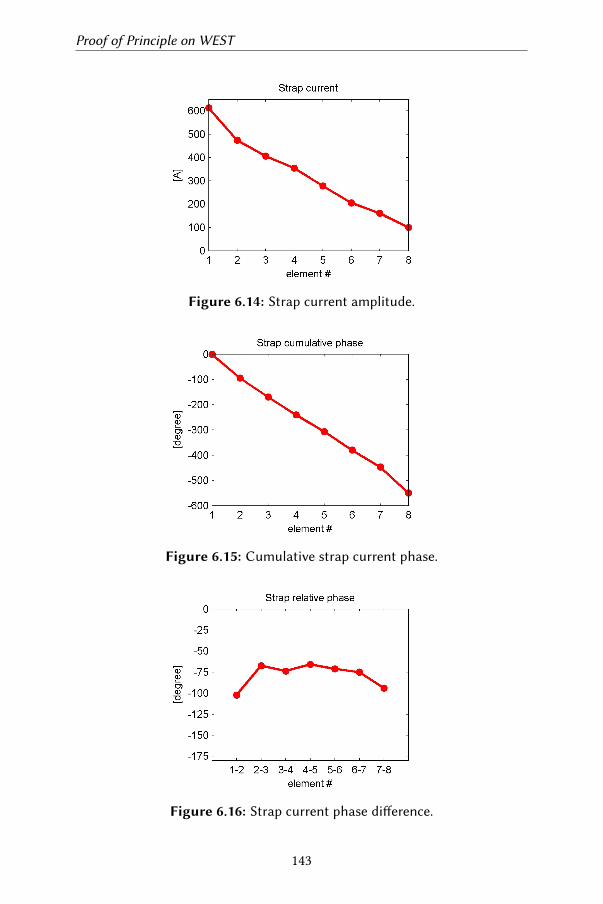
Proof of Principle on WEST
Figure 6.14: Strap current amplitude.
Figure 6.15: Cumulative strap current phase.
Figure 6.16: Strap current phase dierence.
143
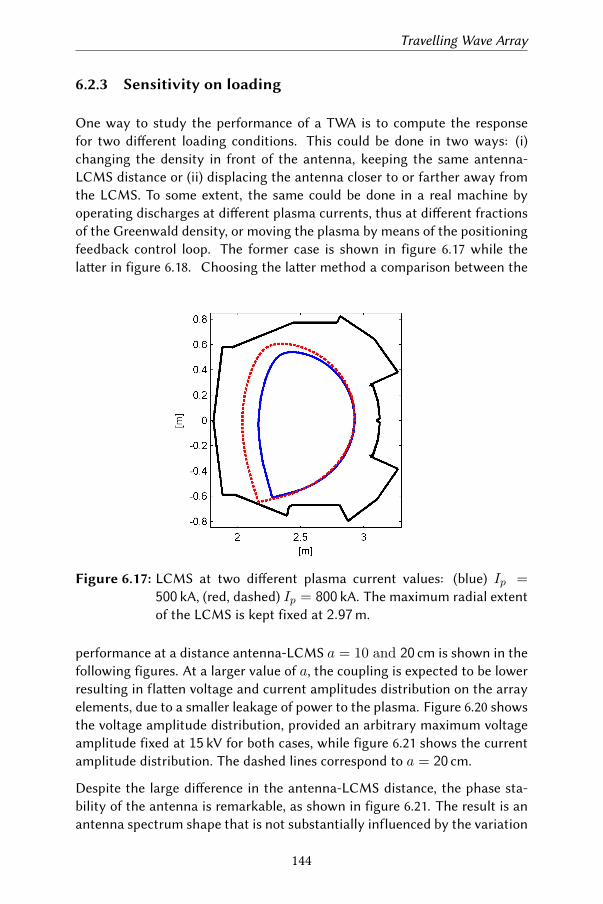
Travelling Wave Array
6.2.3 Sensitivity on loading
One way to study the performance of a TWA is to compute the responsefor two dierent loading conditions. This could be done in two ways: (i)changing the density in front of the antenna, keeping the same antenna-LCMS distance or (ii) displacing the antenna closer to or farther away fromthe LCMS. To some extent, the same could be done in a real machine byoperating discharges at dierent plasma currents, thus at dierent fractionsof the Greenwald density, or moving the plasma by means of the positioningfeedback control loop. The former case is shown in figure 6.17 while thelaer in figure 6.18. Choosing the laer method a comparison between the
Figure 6.17: LCMS at two dierent plasma current values: (blue) Ip =500 kA, (red, dashed) Ip = 800 kA. The maximum radial extentof the LCMS is kept fixed at 2.97m.
performance at a distance antenna-LCMS a = 10 and 20 cm is shown in thefollowing figures. At a larger value of a, the coupling is expected to be lowerresulting in flaen voltage and current amplitudes distribution on the arrayelements, due to a smaller leakage of power to the plasma. Figure 6.20 showsthe voltage amplitude distribution, provided an arbitrary maximum voltageamplitude fixed at 15 kV for both cases, while figure 6.21 shows the currentamplitude distribution. The dashed lines correspond to a = 20 cm.
Despite the large dierence in the antenna-LCMS distance, the phase sta-bility of the antenna is remarkable, as shown in figure 6.21. The result is anantenna spectrum shape that is not substantially influenced by the variation
144
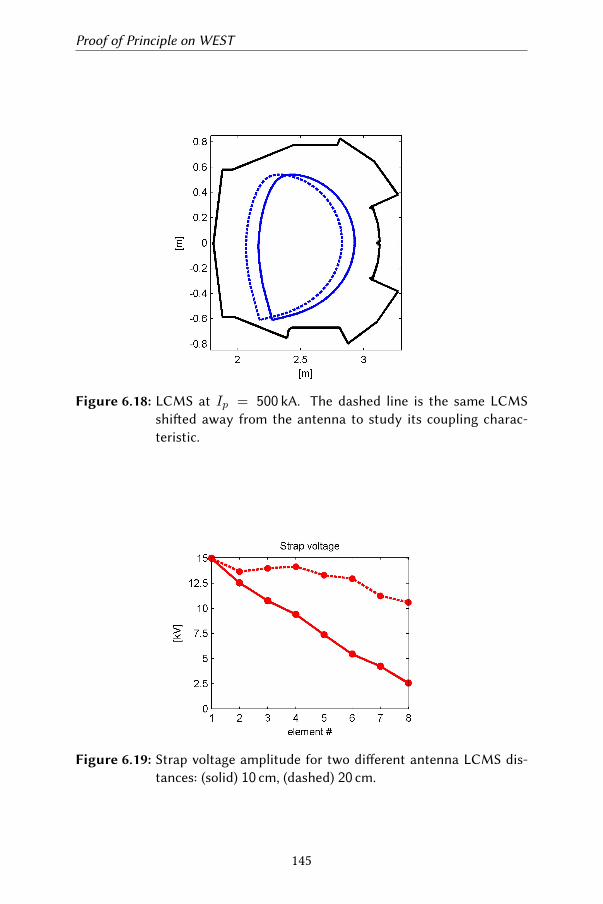
Proof of Principle on WEST
Figure 6.18: LCMS at Ip = 500 kA. The dashed line is the same LCMSshied away from the antenna to study its coupling charac-teristic.
Figure 6.19: Strap voltage amplitude for two dierent antenna LCMS dis-tances: (solid) 10 cm, (dashed) 20 cm.
145
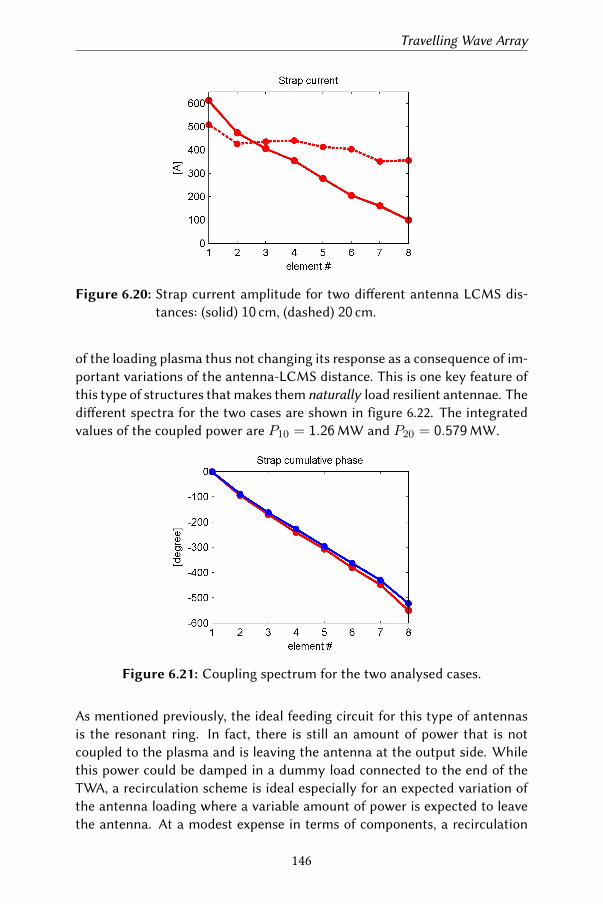
Travelling Wave Array
Figure 6.20: Strap current amplitude for two dierent antenna LCMS dis-tances: (solid) 10 cm, (dashed) 20 cm.
of the loading plasma thus not changing its response as a consequence of im-portant variations of the antenna-LCMS distance. This is one key feature ofthis type of structures that makes them naturally load resilient antennae. Thedierent spectra for the two cases are shown in figure 6.22. The integratedvalues of the coupled power are P10 = 1.26MW and P20 = 0.579MW.
Figure 6.21: Coupling spectrum for the two analysed cases.
As mentioned previously, the ideal feeding circuit for this type of antennasis the resonant ring. In fact, there is still an amount of power that is notcoupled to the plasma and is leaving the antenna at the output side. Whilethis power could be damped in a dummy load connected to the end of theTWA, a recirculation scheme is ideal especially for an expected variation ofthe antenna loading where a variable amount of power is expected to leavethe antenna. At a modest expense in terms of components, a recirculation
146
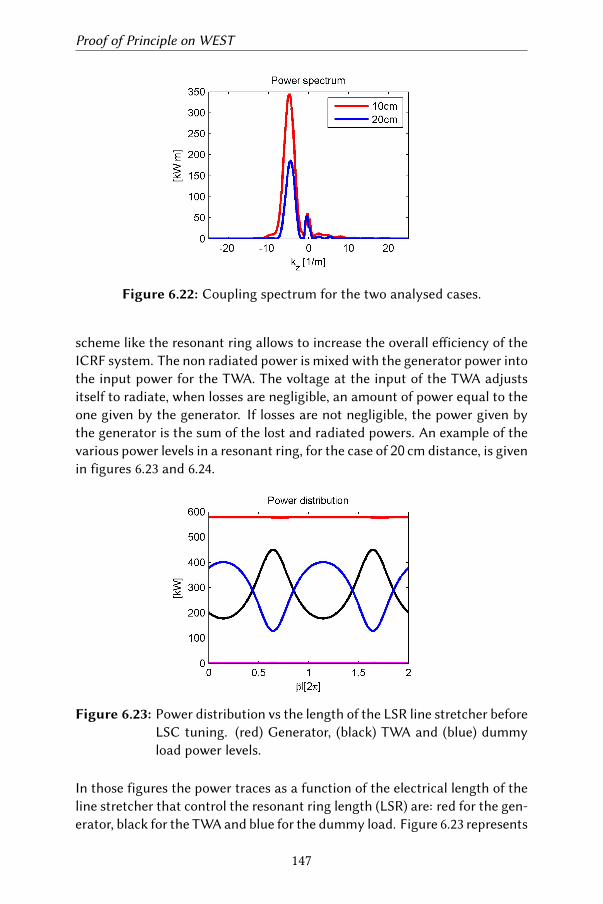
Proof of Principle on WEST
Figure 6.22: Coupling spectrum for the two analysed cases.
scheme like the resonant ring allows to increase the overall eiciency of theICRF system. The non radiated power is mixed with the generator power intothe input power for the TWA. The voltage at the input of the TWA adjustsitself to radiate, when losses are negligible, an amount of power equal to theone given by the generator. If losses are not negligible, the power given bythe generator is the sum of the lost and radiated powers. An example of thevarious power levels in a resonant ring, for the case of 20 cm distance, is givenin figures 6.23 and 6.24.
Figure 6.23: Power distribution vs the length of the LSR line stretcher beforeLSC tuning. (red) Generator, (black) TWA and (blue) dummyload power levels.
In those figures the power traces as a function of the electrical length of theline stretcher that control the resonant ring length (LSR) are: red for the gen-erator, black for the TWA and blue for the dummy load. Figure 6.23 represents
147
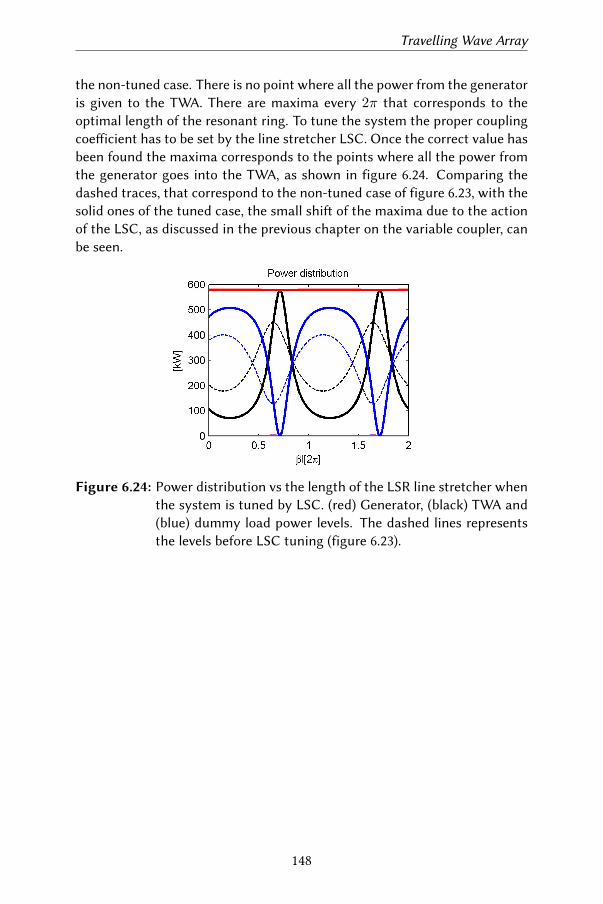
Travelling Wave Array
the non-tuned case. There is no point where all the power from the generatoris given to the TWA. There are maxima every 2π that corresponds to theoptimal length of the resonant ring. To tune the system the proper couplingcoeicient has to be set by the line stretcher LSC. Once the correct value hasbeen found the maxima corresponds to the points where all the power fromthe generator goes into the TWA, as shown in figure 6.24. Comparing thedashed traces, that correspond to the non-tuned case of figure 6.23, with thesolid ones of the tuned case, the small shi of the maxima due to the actionof the LSC, as discussed in the previous chapter on the variable coupler, canbe seen.
Figure 6.24: Power distribution vs the length of the LSR line stretcher whenthe system is tuned by LSC. (red) Generator, (black) TWA and(blue) dummy load power levels. The dashed lines representsthe levels before LSC tuning (figure 6.23).
148
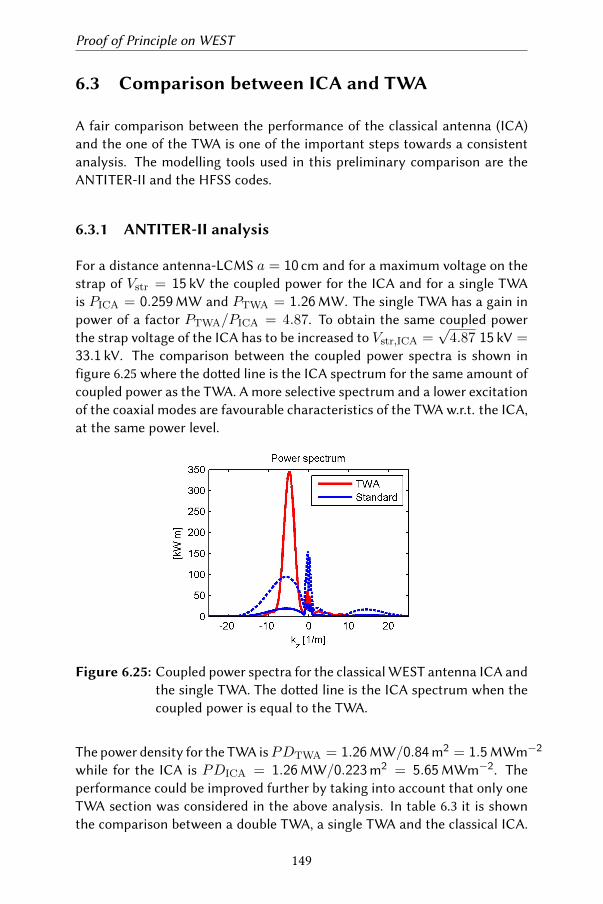
Proof of Principle on WEST
6.3 Comparison between ICA and TWA
A fair comparison between the performance of the classical antenna (ICA)and the one of the TWA is one of the important steps towards a consistentanalysis. The modelling tools used in this preliminary comparison are theANTITER-II and the HFSS codes.
6.3.1 ANTITER-II analysis
For a distance antenna-LCMS a = 10 cm and for a maximum voltage on thestrap of Vstr = 15 kV the coupled power for the ICA and for a single TWAis PICA = 0.259MW and PTWA = 1.26MW. The single TWA has a gain inpower of a factor PTWA/PICA = 4.87. To obtain the same coupled powerthe strap voltage of the ICA has to be increased to Vstr,ICA =
√4.87 15 kV =
33.1 kV. The comparison between the coupled power spectra is shown infigure 6.25 where the doed line is the ICA spectrum for the same amount ofcoupled power as the TWA. A more selective spectrum and a lower excitationof the coaxial modes are favourable characteristics of the TWA w.r.t. the ICA,at the same power level.
Figure 6.25: Coupled power spectra for the classical WEST antenna ICA andthe single TWA. The doed line is the ICA spectrum when thecoupled power is equal to the TWA.
The power density for the TWA isPDTWA = 1.26MW/0.84m2 = 1.5MWm−2
while for the ICA is PDICA = 1.26MW/0.223m2 = 5.65MWm−2. Theperformance could be improved further by taking into account that only oneTWA section was considered in the above analysis. In table 6.3 it is shownthe comparison between a double TWA, a single TWA and the classical ICA.
149
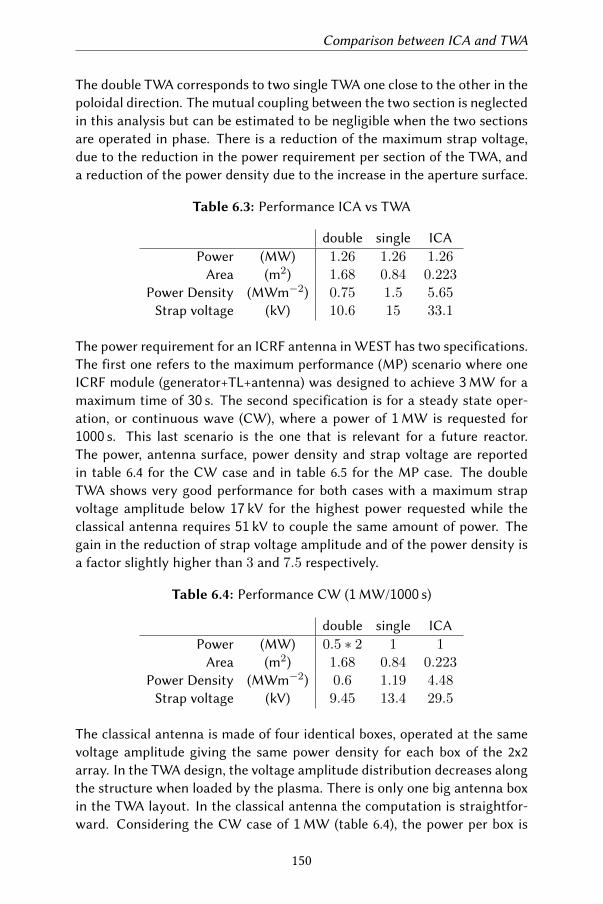
Comparison between ICA and TWA
The double TWA corresponds to two single TWA one close to the other in thepoloidal direction. The mutual coupling between the two section is neglectedin this analysis but can be estimated to be negligible when the two sectionsare operated in phase. There is a reduction of the maximum strap voltage,due to the reduction in the power requirement per section of the TWA, anda reduction of the power density due to the increase in the aperture surface.
Table 6.3: Performance ICA vs TWA
double single ICAPower (MW) 1.26 1.26 1.26
Area (m2) 1.68 0.84 0.223Power Density (MWm−2) 0.75 1.5 5.65
Strap voltage (kV) 10.6 15 33.1
The power requirement for an ICRF antenna in WEST has two specifications.The first one refers to the maximum performance (MP) scenario where oneICRF module (generator+TL+antenna) was designed to achieve 3MW for amaximum time of 30 s. The second specification is for a steady state oper-ation, or continuous wave (CW), where a power of 1MW is requested for1000 s. This last scenario is the one that is relevant for a future reactor.The power, antenna surface, power density and strap voltage are reportedin table 6.4 for the CW case and in table 6.5 for the MP case. The doubleTWA shows very good performance for both cases with a maximum strapvoltage amplitude below 17 kV for the highest power requested while theclassical antenna requires 51 kV to couple the same amount of power. Thegain in the reduction of strap voltage amplitude and of the power density isa factor slightly higher than 3 and 7.5 respectively.
Table 6.4: Performance CW (1MW/1000 s)
double single ICAPower (MW) 0.5 ∗ 2 1 1
Area (m2) 1.68 0.84 0.223Power Density (MWm−2) 0.6 1.19 4.48
Strap voltage (kV) 9.45 13.4 29.5
The classical antenna is made of four identical boxes, operated at the samevoltage amplitude giving the same power density for each box of the 2x2array. In the TWA design, the voltage amplitude distribution decreases alongthe structure when loaded by the plasma. There is only one big antenna boxin the TWA layout. In the classical antenna the computation is straightfor-ward. Considering the CW case of 1MW (table 6.4), the power per box is
150
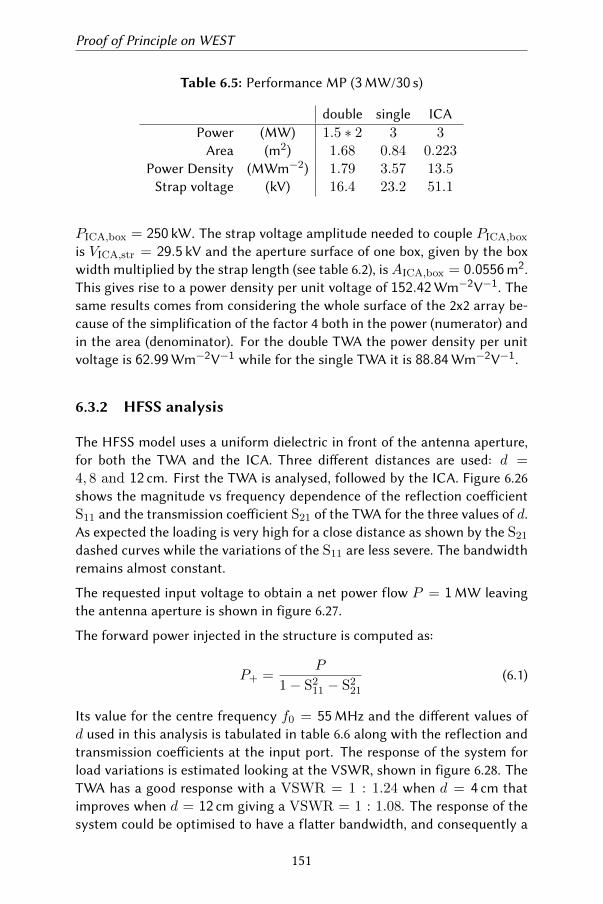
Proof of Principle on WEST
Table 6.5: Performance MP (3MW/30 s)
double single ICAPower (MW) 1.5 ∗ 2 3 3
Area (m2) 1.68 0.84 0.223Power Density (MWm−2) 1.79 3.57 13.5
Strap voltage (kV) 16.4 23.2 51.1
PICA,box = 250 kW. The strap voltage amplitude needed to couple PICA,box
is VICA,str = 29.5 kV and the aperture surface of one box, given by the boxwidth multiplied by the strap length (see table 6.2), isAICA,box = 0.0556m2.This gives rise to a power density per unit voltage of 152.42Wm−2V−1. Thesame results comes from considering the whole surface of the 2x2 array be-cause of the simplification of the factor 4 both in the power (numerator) andin the area (denominator). For the double TWA the power density per unitvoltage is 62.99Wm−2V−1 while for the single TWA it is 88.84Wm−2V−1.
6.3.2 HFSS analysis
The HFSS model uses a uniform dielectric in front of the antenna aperture,for both the TWA and the ICA. Three dierent distances are used: d =4, 8 and 12 cm. First the TWA is analysed, followed by the ICA. Figure 6.26shows the magnitude vs frequency dependence of the reflection coeicientS11 and the transmission coeicient S21 of the TWA for the three values of d.As expected the loading is very high for a close distance as shown by the S21
dashed curves while the variations of the S11 are less severe. The bandwidthremains almost constant.
The requested input voltage to obtain a net power flow P = 1MW leavingthe antenna aperture is shown in figure 6.27.
The forward power injected in the structure is computed as:
P+ =P
1− S211 − S2
21
(6.1)
Its value for the centre frequency f0 = 55MHz and the dierent values ofd used in this analysis is tabulated in table 6.6 along with the reflection andtransmission coeicients at the input port. The response of the system forload variations is estimated looking at the VSWR, shown in figure 6.28. TheTWA has a good response with a VSWR = 1 : 1.24 when d = 4 cm thatimproves when d = 12 cm giving a VSWR = 1 : 1.08. The response of thesystem could be optimised to have a flaer bandwidth, and consequently a
151
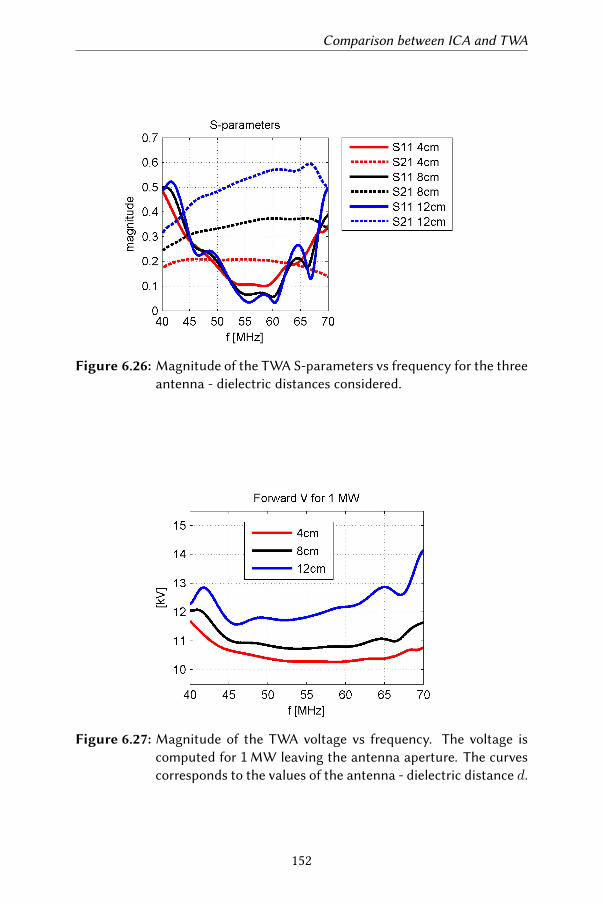
Comparison between ICA and TWA
Figure 6.26: Magnitude of the TWA S-parameters vs frequency for the threeantenna - dielectric distances considered.
Figure 6.27: Magnitude of the TWA voltage vs frequency. The voltage iscomputed for 1MW leaving the antenna aperture. The curvescorresponds to the values of the antenna - dielectric distance d.
152
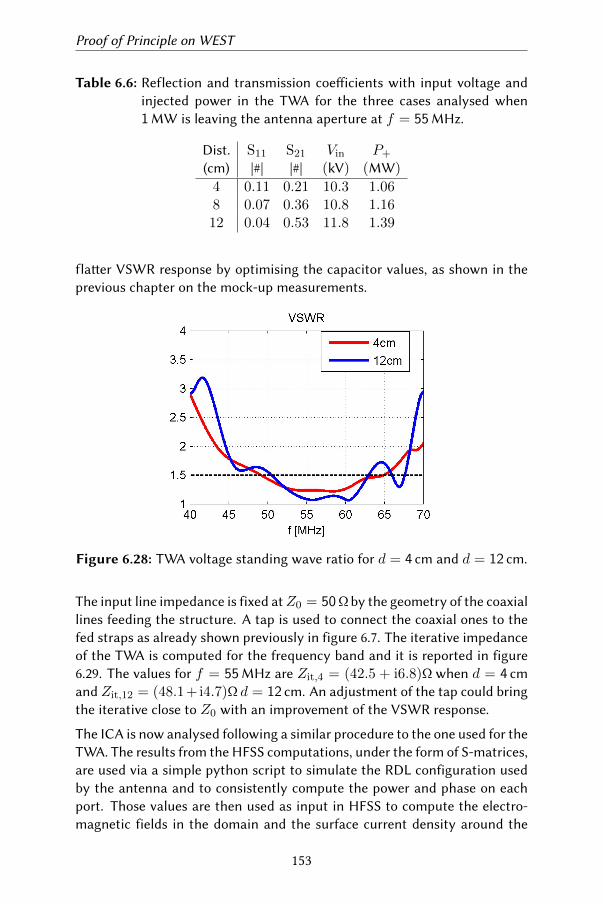
Proof of Principle on WEST
Table 6.6: Reflection and transmission coeicients with input voltage andinjected power in the TWA for the three cases analysed when1MW is leaving the antenna aperture at f = 55MHz.
Dist. S11 S21 Vin P+
(cm) |#| |#| (kV) (MW)
4 0.11 0.21 10.3 1.068 0.07 0.36 10.8 1.1612 0.04 0.53 11.8 1.39
flaer VSWR response by optimising the capacitor values, as shown in theprevious chapter on the mock-up measurements.
Figure 6.28: TWA voltage standing wave ratio for d = 4 cm and d = 12 cm.
The input line impedance is fixed atZ0 = 50Ω by the geometry of the coaxiallines feeding the structure. A tap is used to connect the coaxial ones to thefed straps as already shown previously in figure 6.7. The iterative impedanceof the TWA is computed for the frequency band and it is reported in figure6.29. The values for f = 55MHz are Zit,4 = (42.5 + i6.8)Ω when d = 4 cmand Zit,12 = (48.1+i4.7)Ω d = 12 cm. An adjustment of the tap could bringthe iterative close to Z0 with an improvement of the VSWR response.
The ICA is now analysed following a similar procedure to the one used for theTWA. The results from the HFSS computations, under the form of S-matrices,are used via a simple python script to simulate the RDL configuration usedby the antenna and to consistently compute the power and phase on eachport. Those values are then used as input in HFSS to compute the electro-magnetic fields in the domain and the surface current density around the
153
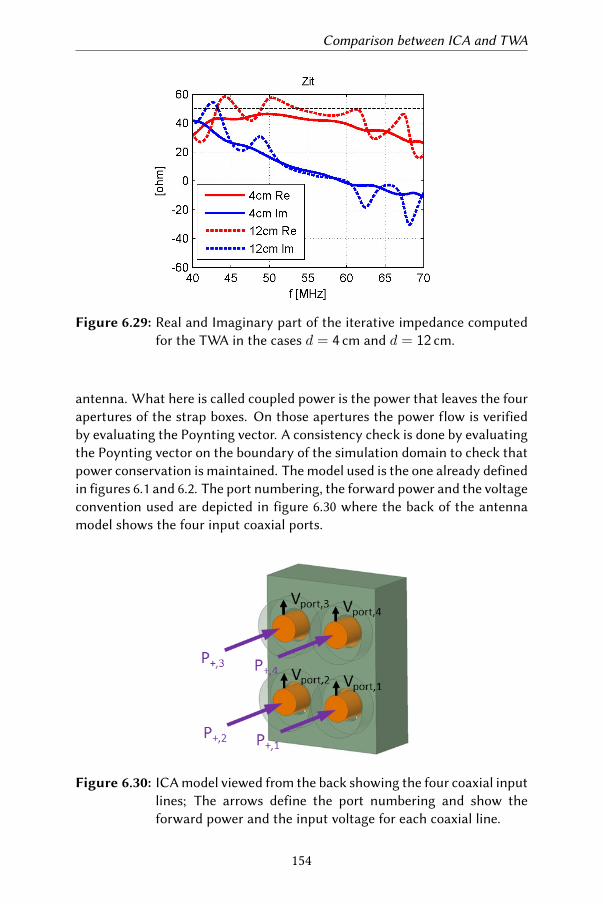
Comparison between ICA and TWA
Figure 6.29: Real and Imaginary part of the iterative impedance computedfor the TWA in the cases d = 4 cm and d = 12 cm.
antenna. What here is called coupled power is the power that leaves the fourapertures of the strap boxes. On those apertures the power flow is verifiedby evaluating the Poynting vector. A consistency check is done by evaluatingthe Poynting vector on the boundary of the simulation domain to check thatpower conservation is maintained. The model used is the one already definedin figures 6.1 and 6.2. The port numbering, the forward power and the voltageconvention used are depicted in figure 6.30 where the back of the antennamodel shows the four input coaxial ports.
Figure 6.30: ICA model viewed from the back showing the four coaxial inputlines; The arrows define the port numbering and show theforward power and the input voltage for each coaxial line.
154
Proof of Principle on WEST
The procedure used to compute the quantities of interest from the modelresults S-matrices is as follows. The phasor convention used is exp(iωt) to beconsistent with the one used in the HFSS code. The current per unit voltageexcitation on each port is computed from
I = Y · U (6.2)
where Y is the admiance matrix computed from the given S-matrix and
U = [exp(iφ1), exp(iφ2), exp(iφ3), exp(iφ4)]T (6.3)
is a unit voltage excitation vector that contains the phasing information
φ1 =1
2(−φt − φp)
φ2 =1
2(−φt + φp)
φ3 =1
2(+φt + φp)
φ4 =1
2(+φt − φp)
(6.4)
with φt and φp respectively the toroidal and poloidal phases. The voltage tobe applied on the ports to obtain a given power P is computed as kU with kbeing the voltage scaling factor defined as
k =
√P/P (6.5)
and where the total power P is given by
P =1
2Re(UT · I∗) (6.6)
Two quantities of particular interest are the forward and reflected powers.The strap are short w.r.t. to the wavelength; ≈ λ/16 at 70MHz, the highside of the frequency band. Thus poor matching with the characteristicimpedance of the ports is expected, resulting in moderately large values ofthe forward and reflected waves. The forward power and the reflected powerare computed respectively as
P+ =1
2Z0
(kU + Z0I
2
)2
P− =1
2Z0
(kU − Z0I
2
)2(6.7)
155
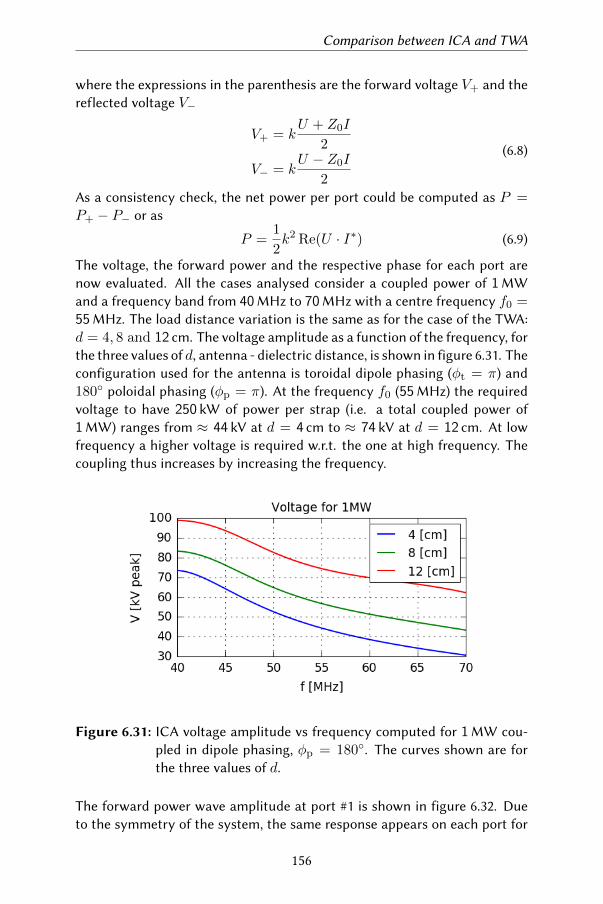
Comparison between ICA and TWA
where the expressions in the parenthesis are the forward voltage V+ and thereflected voltage V−
V+ = kU + Z0I
2
V− = kU − Z0I
2
(6.8)
As a consistency check, the net power per port could be computed as P =P+ − P− or as
P =1
2k2 Re(U · I∗) (6.9)
The voltage, the forward power and the respective phase for each port arenow evaluated. All the cases analysed consider a coupled power of 1MWand a frequency band from 40MHz to 70MHz with a centre frequency f0 =55MHz. The load distance variation is the same as for the case of the TWA:d = 4, 8 and 12 cm. The voltage amplitude as a function of the frequency, forthe three values of d, antenna - dielectric distance, is shown in figure 6.31. Theconfiguration used for the antenna is toroidal dipole phasing (φt = π) and180 poloidal phasing (φp = π). At the frequency f0 (55MHz) the requiredvoltage to have 250 kW of power per strap (i.e. a total coupled power of1MW) ranges from ≈ 44 kV at d = 4 cm to ≈ 74 kV at d = 12 cm. At lowfrequency a higher voltage is required w.r.t. the one at high frequency. Thecoupling thus increases by increasing the frequency.
Figure 6.31: ICA voltage amplitude vs frequency computed for 1MW cou-pled in dipole phasing, φp = 180. The curves shown are forthe three values of d.
The forward power wave amplitude at port #1 is shown in figure 6.32. Dueto the symmetry of the system, the same response appears on each port for
156
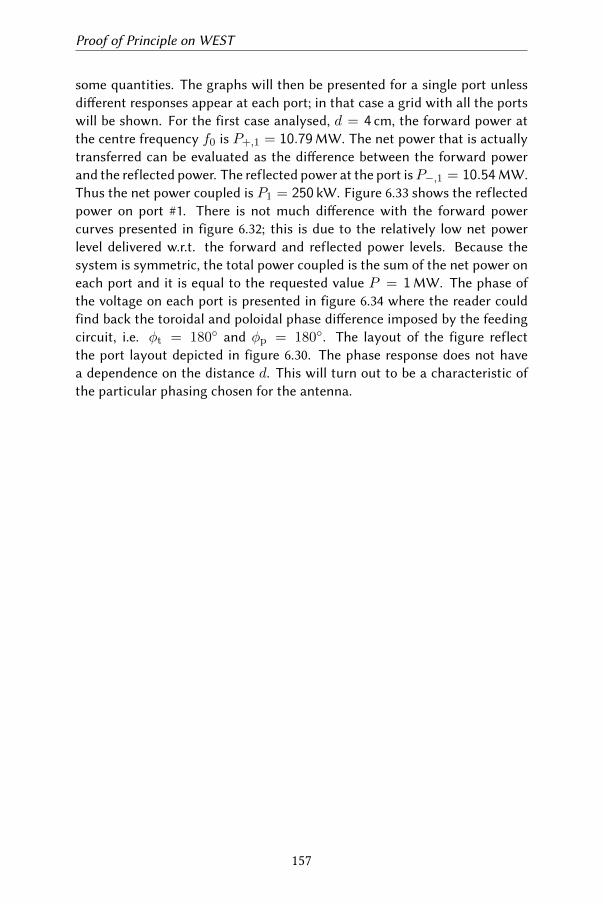
Proof of Principle on WEST
some quantities. The graphs will then be presented for a single port unlessdierent responses appear at each port; in that case a grid with all the portswill be shown. For the first case analysed, d = 4 cm, the forward power atthe centre frequency f0 is P+,1 = 10.79MW. The net power that is actuallytransferred can be evaluated as the dierence between the forward powerand the reflected power. The reflected power at the port isP−,1 = 10.54MW.Thus the net power coupled is P1 = 250 kW. Figure 6.33 shows the reflectedpower on port #1. There is not much dierence with the forward powercurves presented in figure 6.32; this is due to the relatively low net powerlevel delivered w.r.t. the forward and reflected power levels. Because thesystem is symmetric, the total power coupled is the sum of the net power oneach port and it is equal to the requested value P = 1MW. The phase ofthe voltage on each port is presented in figure 6.34 where the reader couldfind back the toroidal and poloidal phase dierence imposed by the feedingcircuit, i.e. φt = 180 and φp = 180. The layout of the figure reflectthe port layout depicted in figure 6.30. The phase response does not havea dependence on the distance d. This will turn out to be a characteristic ofthe particular phasing chosen for the antenna.
157
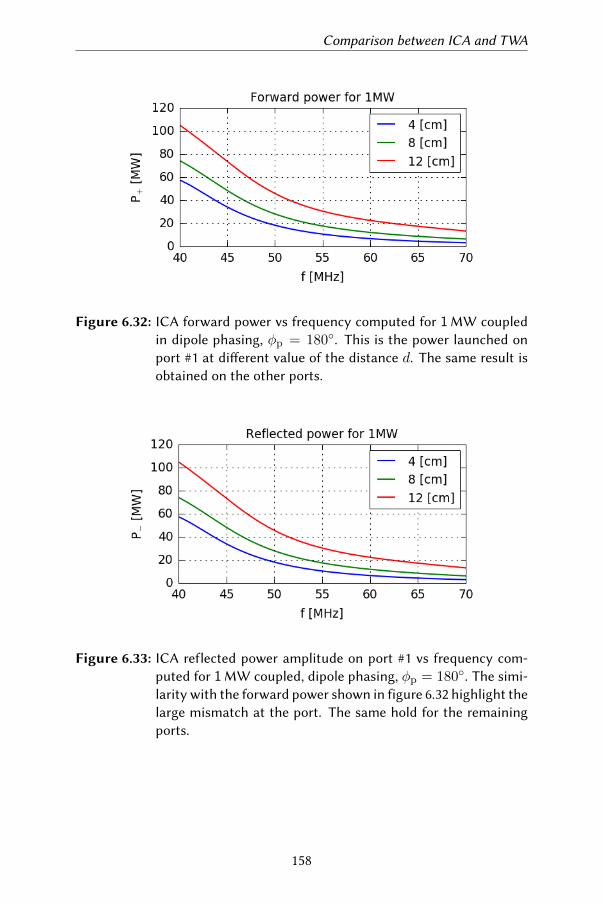
Comparison between ICA and TWA
Figure 6.32: ICA forward power vs frequency computed for 1MW coupledin dipole phasing, φp = 180. This is the power launched onport #1 at dierent value of the distance d. The same result isobtained on the other ports.
Figure 6.33: ICA reflected power amplitude on port #1 vs frequency com-puted for 1MW coupled, dipole phasing, φp = 180. The simi-larity with the forward power shown in figure 6.32 highlight thelarge mismatch at the port. The same hold for the remainingports.
158
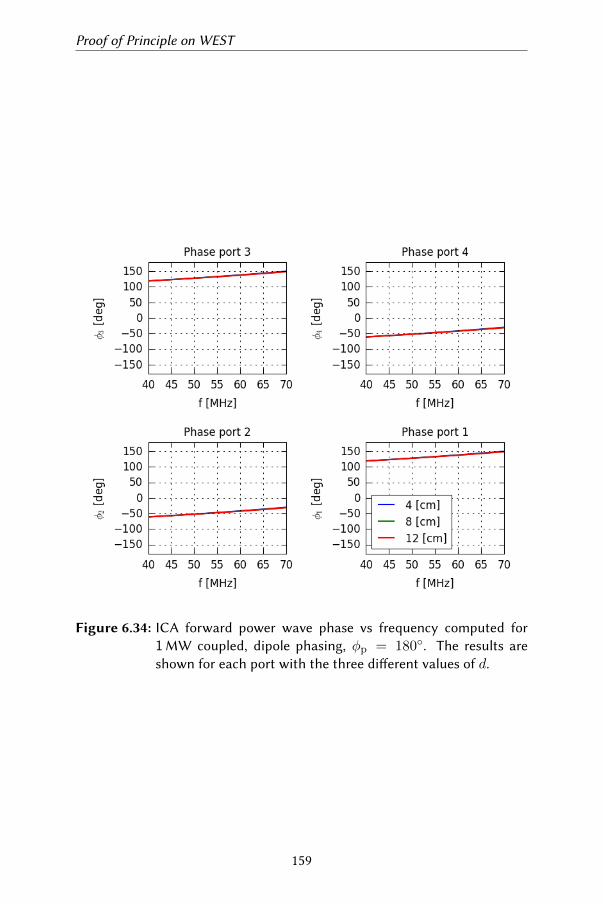
Proof of Principle on WEST
Figure 6.34: ICA forward power wave phase vs frequency computed for1MW coupled, dipole phasing, φp = 180. The results areshown for each port with the three dierent values of d.
159
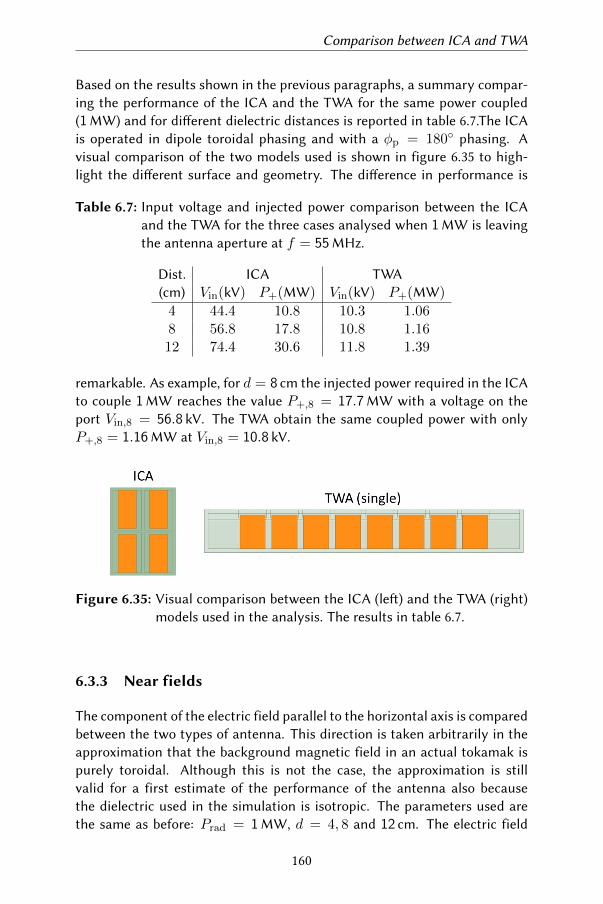
Comparison between ICA and TWA
Based on the results shown in the previous paragraphs, a summary compar-ing the performance of the ICA and the TWA for the same power coupled(1MW) and for dierent dielectric distances is reported in table 6.7.The ICAis operated in dipole toroidal phasing and with a φp = 180 phasing. Avisual comparison of the two models used is shown in figure 6.35 to high-light the dierent surface and geometry. The dierence in performance is
Table 6.7: Input voltage and injected power comparison between the ICAand the TWA for the three cases analysed when 1MW is leavingthe antenna aperture at f = 55MHz.
Dist. ICA TWA(cm) Vin(kV) P+(MW) Vin(kV) P+(MW)
4 44.4 10.8 10.3 1.068 56.8 17.8 10.8 1.1612 74.4 30.6 11.8 1.39
remarkable. As example, for d = 8 cm the injected power required in the ICAto couple 1MW reaches the value P+,8 = 17.7MW with a voltage on theport Vin,8 = 56.8 kV. The TWA obtain the same coupled power with onlyP+,8 = 1.16MW at Vin,8 = 10.8 kV.
Figure 6.35: Visual comparison between the ICA (le) and the TWA (right)models used in the analysis. The results in table 6.7.
6.3.3 Near fields
The component of the electric field parallel to the horizontal axis is comparedbetween the two types of antenna. This direction is taken arbitrarily in theapproximation that the background magnetic field in an actual tokamak ispurely toroidal. Although this is not the case, the approximation is stillvalid for a first estimate of the performance of the antenna also becausethe dielectric used in the simulation is isotropic. The parameters used arethe same as before: Prad = 1MW, d = 4, 8 and 12 cm. The electric field
160
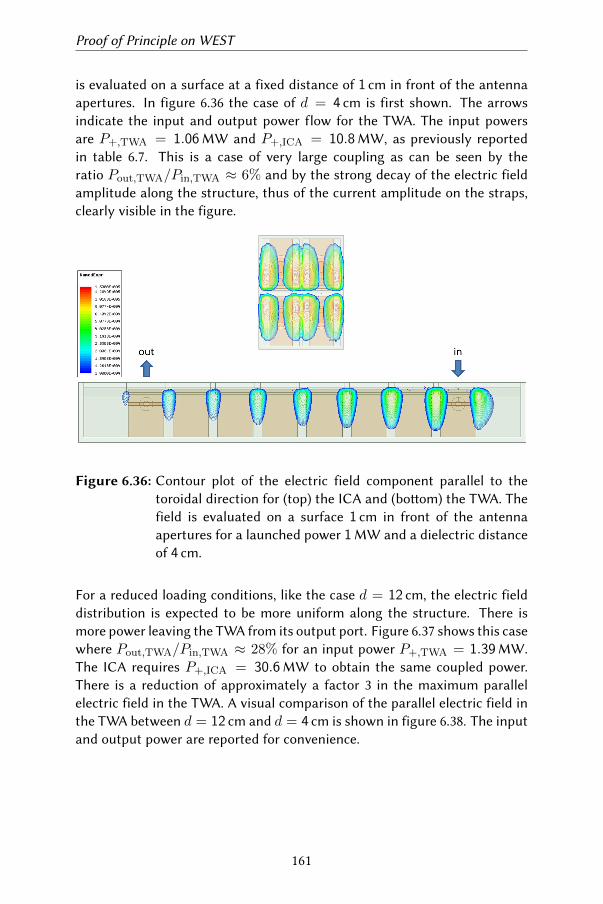
Proof of Principle on WEST
is evaluated on a surface at a fixed distance of 1 cm in front of the antennaapertures. In figure 6.36 the case of d = 4 cm is first shown. The arrowsindicate the input and output power flow for the TWA. The input powersare P+,TWA = 1.06MW and P+,ICA = 10.8MW, as previously reportedin table 6.7. This is a case of very large coupling as can be seen by theratio Pout,TWA/Pin,TWA ≈ 6% and by the strong decay of the electric fieldamplitude along the structure, thus of the current amplitude on the straps,clearly visible in the figure.
Figure 6.36: Contour plot of the electric field component parallel to thetoroidal direction for (top) the ICA and (boom) the TWA. Thefield is evaluated on a surface 1 cm in front of the antennaapertures for a launched power 1MW and a dielectric distanceof 4 cm.
For a reduced loading conditions, like the case d = 12 cm, the electric fielddistribution is expected to be more uniform along the structure. There ismore power leaving the TWA from its output port. Figure 6.37 shows this casewhere Pout,TWA/Pin,TWA ≈ 28% for an input power P+,TWA = 1.39MW.The ICA requires P+,ICA = 30.6MW to obtain the same coupled power.There is a reduction of approximately a factor 3 in the maximum parallelelectric field in the TWA. A visual comparison of the parallel electric field inthe TWA between d = 12 cm and d = 4 cm is shown in figure 6.38. The inputand output power are reported for convenience.
161
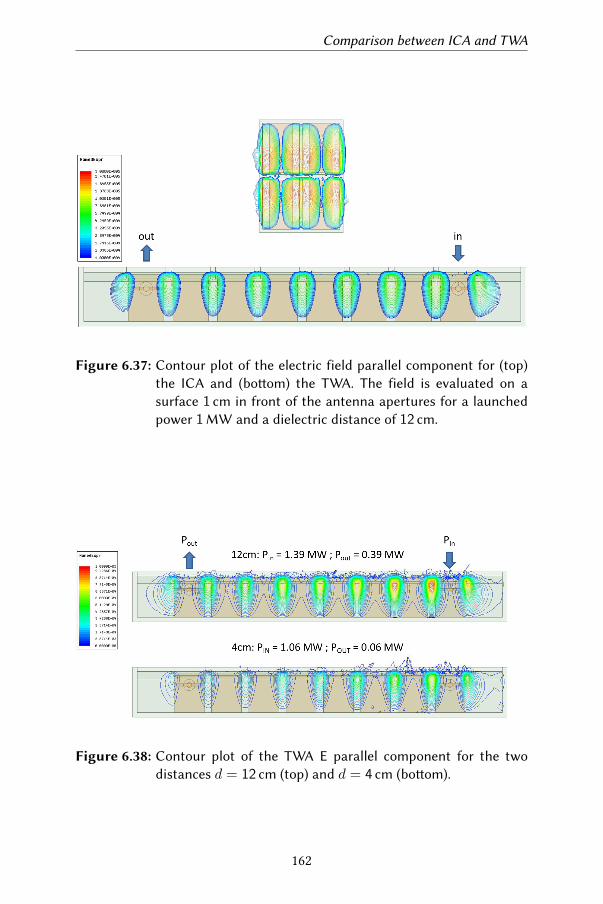
Comparison between ICA and TWA
Figure 6.37: Contour plot of the electric field parallel component for (top)the ICA and (boom) the TWA. The field is evaluated on asurface 1 cm in front of the antenna apertures for a launchedpower 1MW and a dielectric distance of 12 cm.
Figure 6.38: Contour plot of the TWA E parallel component for the twodistances d = 12 cm (top) and d = 4 cm (boom).
162
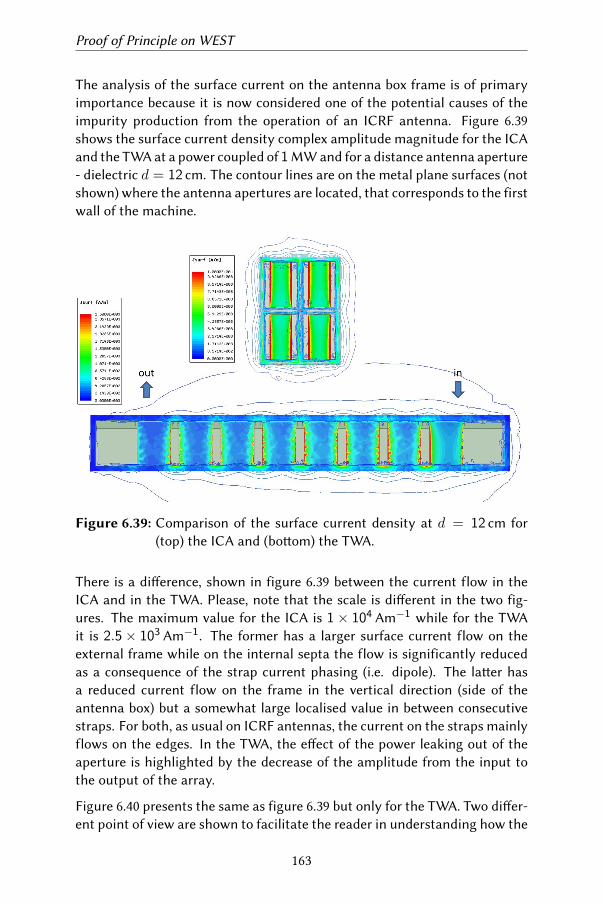
Proof of Principle on WEST
The analysis of the surface current on the antenna box frame is of primaryimportance because it is now considered one of the potential causes of theimpurity production from the operation of an ICRF antenna. Figure 6.39shows the surface current density complex amplitude magnitude for the ICAand the TWA at a power coupled of 1MW and for a distance antenna aperture- dielectric d = 12 cm. The contour lines are on the metal plane surfaces (notshown) where the antenna apertures are located, that corresponds to the firstwall of the machine.
Figure 6.39: Comparison of the surface current density at d = 12 cm for(top) the ICA and (boom) the TWA.
There is a dierence, shown in figure 6.39 between the current flow in theICA and in the TWA. Please, note that the scale is dierent in the two fig-ures. The maximum value for the ICA is 1× 10⁴ Am−1 while for the TWAit is 2.5× 10³ Am−1. The former has a larger surface current flow on theexternal frame while on the internal septa the flow is significantly reducedas a consequence of the strap current phasing (i.e. dipole). The laer hasa reduced current flow on the frame in the vertical direction (side of theantenna box) but a somewhat large localised value in between consecutivestraps. For both, as usual on ICRF antennas, the current on the straps mainlyflows on the edges. In the TWA, the eect of the power leaking out of theaperture is highlighted by the decrease of the amplitude from the input tothe output of the array.
Figure 6.40 presents the same as figure 6.39 but only for the TWA. Two dier-ent point of view are shown to facilitate the reader in understanding how the
163
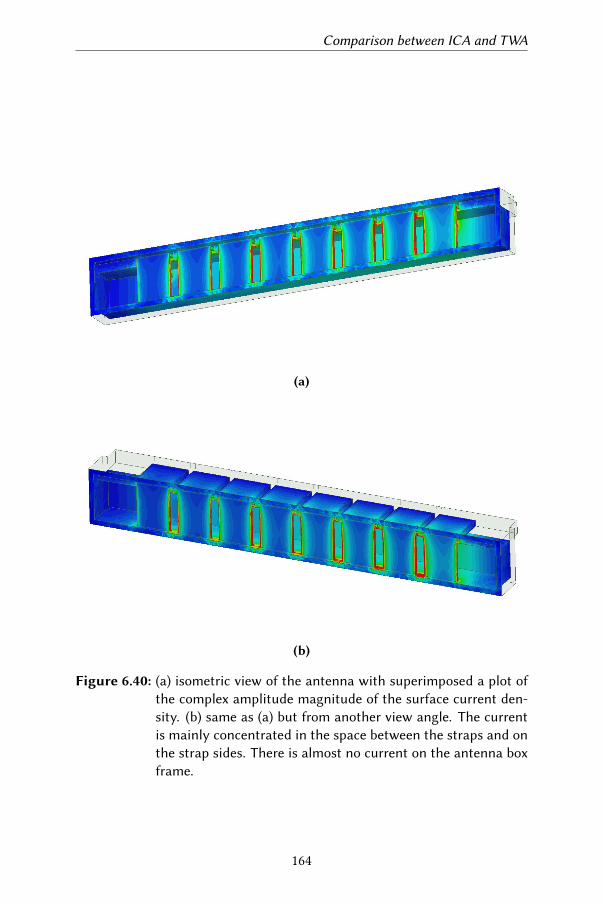
Comparison between ICA and TWA
(a)
(b)
Figure 6.40: (a) isometric view of the antenna with superimposed a plot ofthe complex amplitude magnitude of the surface current den-sity. (b) same as (a) but from another view angle. The currentis mainly concentrated in the space between the straps and onthe strap sides. There is almost no current on the antenna boxframe.
164
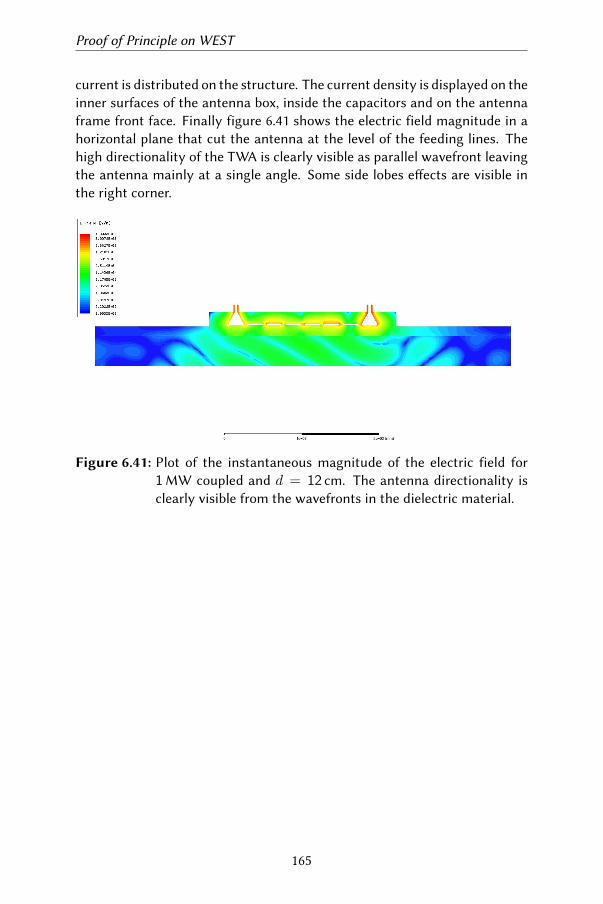
Proof of Principle on WEST
current is distributed on the structure. The current density is displayed on theinner surfaces of the antenna box, inside the capacitors and on the antennaframe front face. Finally figure 6.41 shows the electric field magnitude in ahorizontal plane that cut the antenna at the level of the feeding lines. Thehigh directionality of the TWA is clearly visible as parallel wavefront leavingthe antenna mainly at a single angle. Some side lobes eects are visible inthe right corner.
Figure 6.41: Plot of the instantaneous magnitude of the electric field for1MW coupled and d = 12 cm. The antenna directionality isclearly visible from the wavefronts in the dielectric material.
165
Capacitor sensitivity
6.4 Capacitor sensitivity
It is performed an evaluation of the TWA antenna sensitivity to variations ofthe capacitor values due to thermal dilatation of the straps or accuracy in themanufacturing and assembly phases. Both cases with simple and optimisedcapacitor sets are analysed. For a given set of capacitance values, a variationof ±1 pF is added to each capacitor. The variation is generated by extractinga random number from a uniform distribution, rescaling it to the interval[−1, 1] and multiplying it to the capacitance overhead (e.g. 1 pF). Figure6.42 shows the result for the simple capacitor set. As a reminder, this set isconstructed as
ZC = i Im(Zs) · I (6.10)
where Zs is the strap impedance matrix and I is the identity matrix. Theresponse with the nominal values is drawn in black. The nominal centre-band frequency is f0 = 55MHz. The random perturbation is computed 500times and it is represented by the blue curves. Panel (b) shows the voltage andcurrent amplitude for 1MW of coupled power at the centre of the band (f0).The transmission coeicient remains largely unaected by the perturbationkeeping its value close to −10 dB. The reflection coeicient, however, showsa noticeable sensitivity. The centre-band frequency remains below the limitof −20 dB but the bandwidth experiences a slight shi depending on thedistribution of the variation. Nevertheless, the main characteristics of thestructure are not severely perturbed. The variation of±1 pF could be used asupper limit with some safety margin.
Figure 6.43 presents the case when the same random perturbation is appliedto the optimised capacitor set. Also in this case the transmission coeicientis largely unaected. Its behaviour, slightly increasing with frequency, ismaintained around −10 dB, similar to figure 6.42. Also in this case, thereflection coeicient shows the major impact. Nevertheless the bandwidthis only marginally reduced. Thus, like for the simple capacitor set, it could beassumed that the system could tolerate a variation of ±1 pF on the nominalcapacitor values. The impact of this perturbation on the voltage amplitude(6.43(b)) suggests that a safety margin for this uncertainty on the capacitorvalue should be taken into account during the design of the capacitor itself.The current amplitude does not show any important eect. However, theantenna-lcms distance and plasma profile used in this example result in amoderately loaded antenna, The consequence is that the voltage and currentamplitudes decrease considerably along the structure, as also shown by thetransmission coeicient (around−10 dB). A dierent loading of the antennawill result in a dierent voltage and current paern. A more detailed analysisof the dierent cases will be performed during the capacitor design.
166
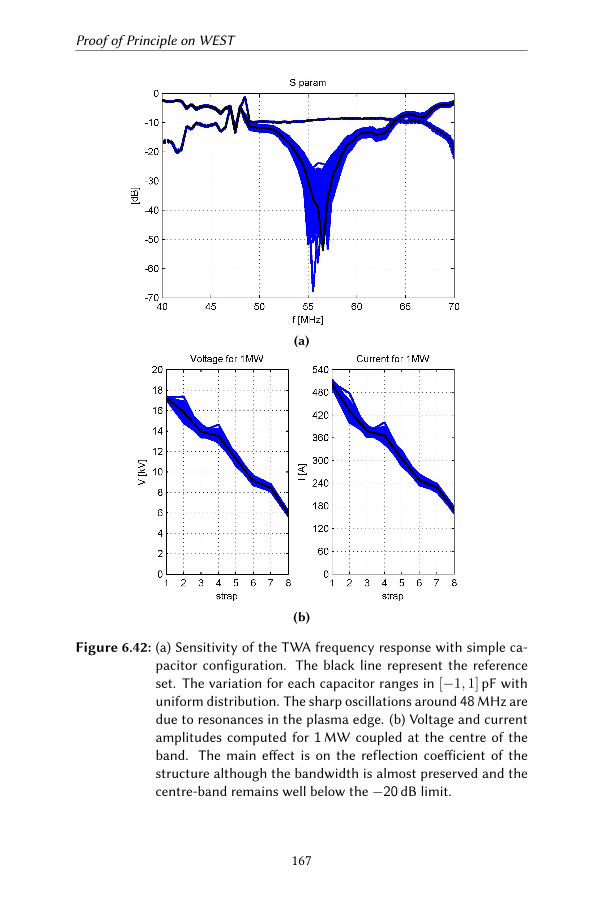
Proof of Principle on WEST
(a)
(b)
Figure 6.42: (a) Sensitivity of the TWA frequency response with simple ca-pacitor configuration. The black line represent the referenceset. The variation for each capacitor ranges in [−1, 1] pF withuniform distribution. The sharp oscillations around 48MHz aredue to resonances in the plasma edge. (b) Voltage and currentamplitudes computed for 1MW coupled at the centre of theband. The main eect is on the reflection coeicient of thestructure although the bandwidth is almost preserved and thecentre-band remains well below the −20 dB limit.
167
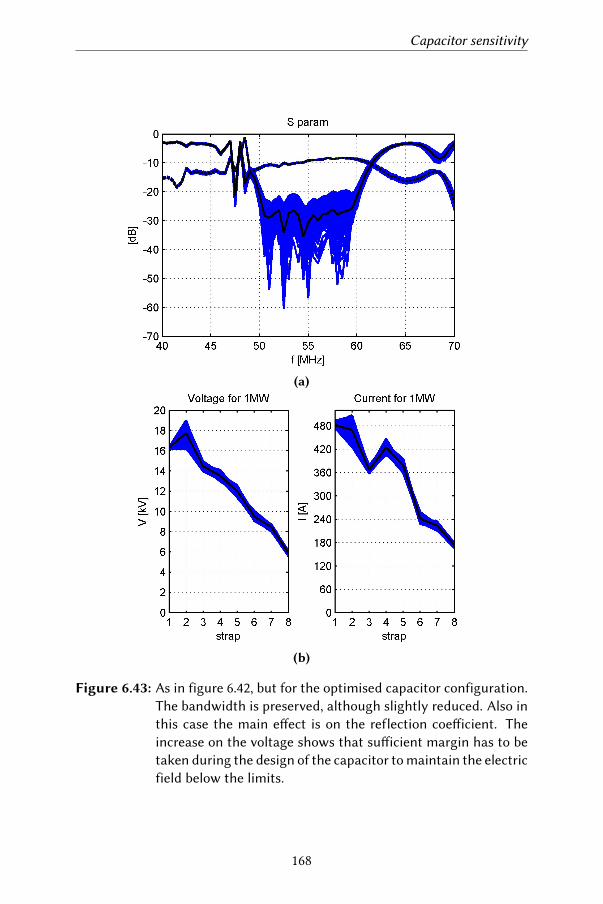
Capacitor sensitivity
(a)
(b)
Figure 6.43: As in figure 6.42, but for the optimised capacitor configuration.The bandwidth is preserved, although slightly reduced. Also inthis case the main eect is on the reflection coeicient. Theincrease on the voltage shows that suicient margin has to betaken during the design of the capacitor to maintain the electricfield below the limits.
168
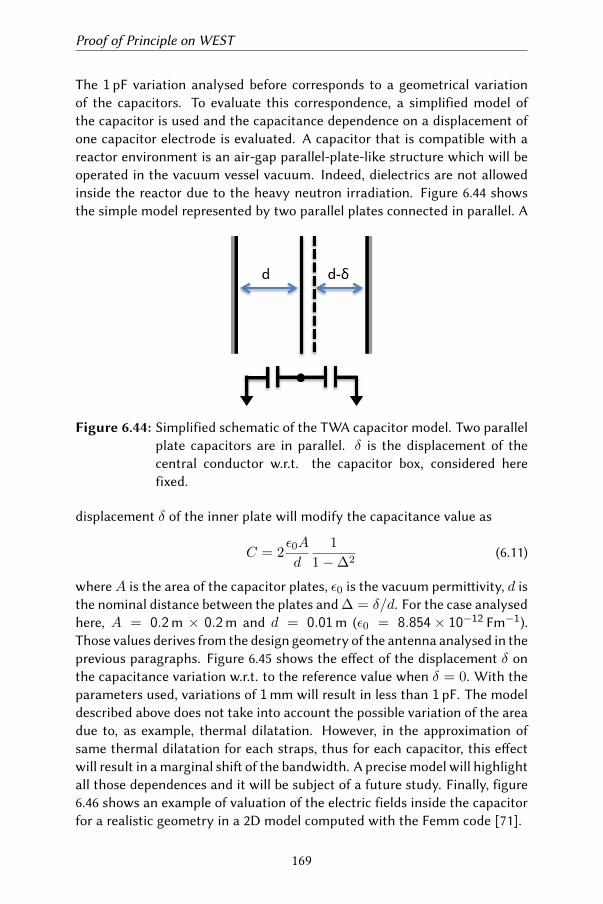
Proof of Principle on WEST
The 1 pF variation analysed before corresponds to a geometrical variationof the capacitors. To evaluate this correspondence, a simplified model ofthe capacitor is used and the capacitance dependence on a displacement ofone capacitor electrode is evaluated. A capacitor that is compatible with areactor environment is an air-gap parallel-plate-like structure which will beoperated in the vacuum vessel vacuum. Indeed, dielectrics are not allowedinside the reactor due to the heavy neutron irradiation. Figure 6.44 showsthe simple model represented by two parallel plates connected in parallel. A
Figure 6.44: Simplified schematic of the TWA capacitor model. Two parallelplate capacitors are in parallel. δ is the displacement of thecentral conductor w.r.t. the capacitor box, considered herefixed.
displacement δ of the inner plate will modify the capacitance value as
C = 2ε0A
d
1
1−∆2(6.11)
whereA is the area of the capacitor plates, ε0 is the vacuum permiivity, d isthe nominal distance between the plates and ∆ = δ/d. For the case analysedhere, A = 0.2m × 0.2m and d = 0.01m (ε0 = 8.854× 10⁻¹² Fm−1).Those values derives from the design geometry of the antenna analysed in theprevious paragraphs. Figure 6.45 shows the eect of the displacement δ onthe capacitance variation w.r.t. to the reference value when δ = 0. With theparameters used, variations of 1mm will result in less than 1 pF. The modeldescribed above does not take into account the possible variation of the areadue to, as example, thermal dilatation. However, in the approximation ofsame thermal dilatation for each straps, thus for each capacitor, this eectwill result in a marginal shi of the bandwidth. A precise model will highlightall those dependences and it will be subject of a future study. Finally, figure6.46 shows an example of valuation of the electric fields inside the capacitorfor a realistic geometry in a 2D model computed with the Femm code [71].
169
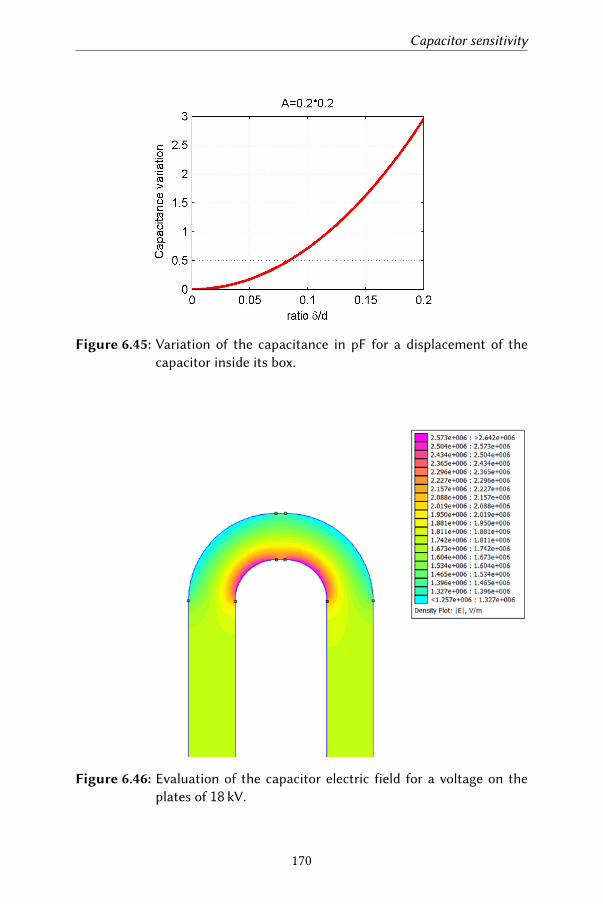
Capacitor sensitivity
Figure 6.45: Variation of the capacitance in pF for a displacement of thecapacitor inside its box.
Figure 6.46: Evaluation of the capacitor electric field for a voltage on theplates of 18 kV.
170
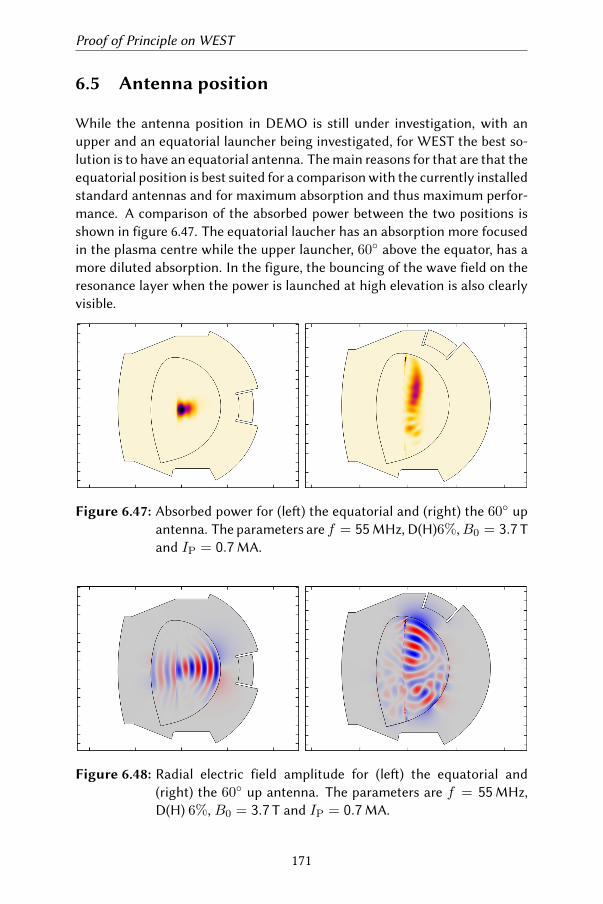
Proof of Principle on WEST
6.5 Antenna position
While the antenna position in DEMO is still under investigation, with anupper and an equatorial launcher being investigated, for WEST the best so-lution is to have an equatorial antenna. The main reasons for that are that theequatorial position is best suited for a comparison with the currently installedstandard antennas and for maximum absorption and thus maximum perfor-mance. A comparison of the absorbed power between the two positions isshown in figure 6.47. The equatorial laucher has an absorption more focusedin the plasma centre while the upper launcher, 60 above the equator, has amore diluted absorption. In the figure, the bouncing of the wave field on theresonance layer when the power is launched at high elevation is also clearlyvisible.
Figure 6.47: Absorbed power for (le) the equatorial and (right) the 60 upantenna. The parameters are f = 55MHz, D(H)6%,B0 = 3.7 Tand IP = 0.7MA.
Figure 6.48: Radial electric field amplitude for (le) the equatorial and(right) the 60 up antenna. The parameters are f = 55MHz,D(H) 6%, B0 = 3.7 T and IP = 0.7MA.
171
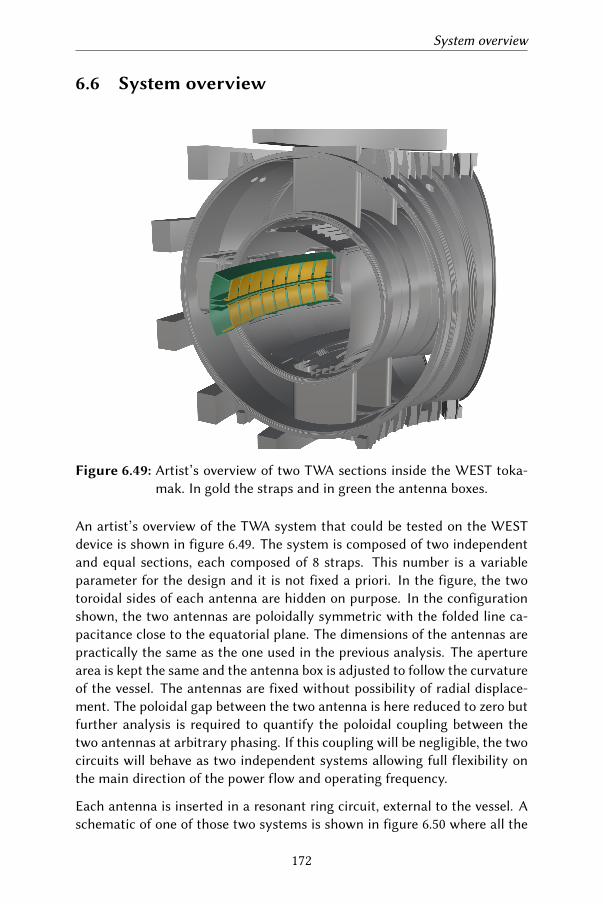
System overview
6.6 System overview
Figure 6.49: Artist’s overview of two TWA sections inside the WEST toka-mak. In gold the straps and in green the antenna boxes.
An artist’s overview of the TWA system that could be tested on the WESTdevice is shown in figure 6.49. The system is composed of two independentand equal sections, each composed of 8 straps. This number is a variableparameter for the design and it is not fixed a priori. In the figure, the twotoroidal sides of each antenna are hidden on purpose. In the configurationshown, the two antennas are poloidally symmetric with the folded line ca-pacitance close to the equatorial plane. The dimensions of the antennas arepractically the same as the one used in the previous analysis. The aperturearea is kept the same and the antenna box is adjusted to follow the curvatureof the vessel. The antennas are fixed without possibility of radial displace-ment. The poloidal gap between the two antenna is here reduced to zero butfurther analysis is required to quantify the poloidal coupling between thetwo antennas at arbitrary phasing. If this coupling will be negligible, the twocircuits will behave as two independent systems allowing full flexibility onthe main direction of the power flow and operating frequency.
Each antenna is inserted in a resonant ring circuit, external to the vessel. Aschematic of one of those two systems is shown in figure 6.50 where all the
172
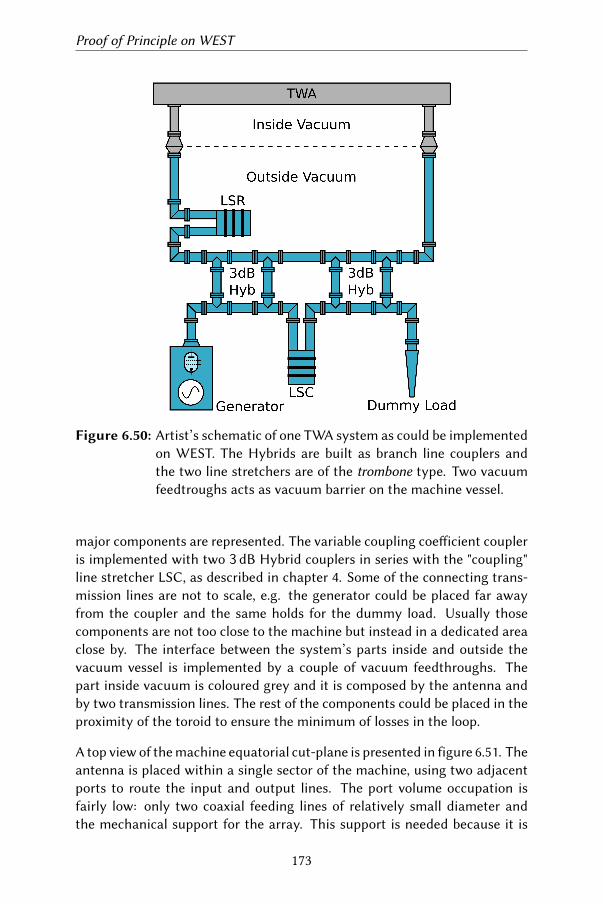
Proof of Principle on WEST
Figure 6.50: Artist’s schematic of one TWA system as could be implementedon WEST. The Hybrids are built as branch line couplers andthe two line stretchers are of the trombone type. Two vacuumfeedtroughs acts as vacuum barrier on the machine vessel.
major components are represented. The variable coupling coeicient coupleris implemented with two 3 dB Hybrid couplers in series with the "coupling"line stretcher LSC, as described in chapter 4. Some of the connecting trans-mission lines are not to scale, e.g. the generator could be placed far awayfrom the coupler and the same holds for the dummy load. Usually thosecomponents are not too close to the machine but instead in a dedicated areaclose by. The interface between the system’s parts inside and outside thevacuum vessel is implemented by a couple of vacuum feedthroughs. Thepart inside vacuum is coloured grey and it is composed by the antenna andby two transmission lines. The rest of the components could be placed in theproximity of the toroid to ensure the minimum of losses in the loop.
A top view of the machine equatorial cut-plane is presented in figure 6.51. Theantenna is placed within a single sector of the machine, using two adjacentports to route the input and output lines. The port volume occupation isfairly low: only two coaxial feeding lines of relatively small diameter andthe mechanical support for the array. This support is needed because it is
173
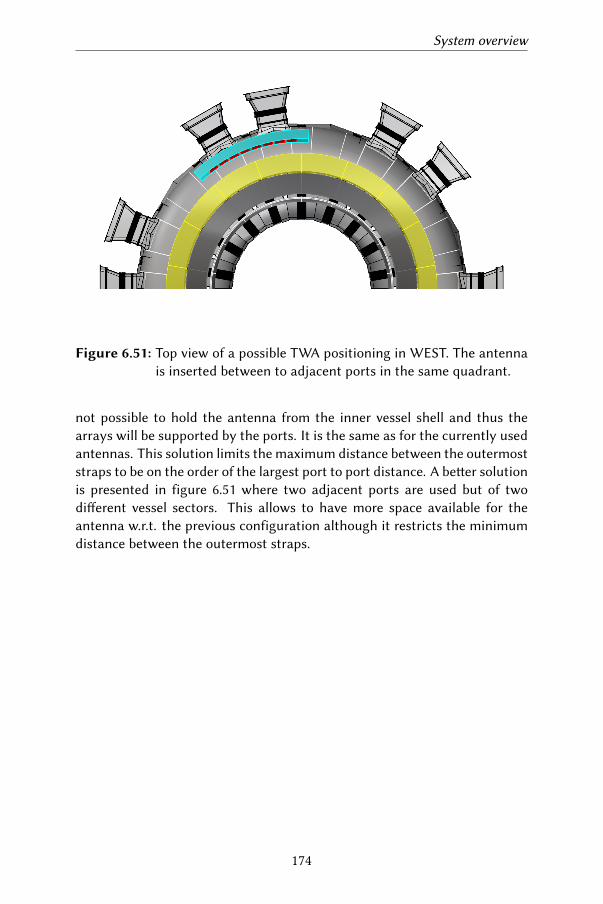
System overview
Figure 6.51: Top view of a possible TWA positioning in WEST. The antennais inserted between to adjacent ports in the same quadrant.
not possible to hold the antenna from the inner vessel shell and thus thearrays will be supported by the ports. It is the same as for the currently usedantennas. This solution limits the maximum distance between the outermoststraps to be on the order of the largest port to port distance. A beer solutionis presented in figure 6.51 where two adjacent ports are used but of twodierent vessel sectors. This allows to have more space available for theantenna w.r.t. the previous configuration although it restricts the minimumdistance between the outermost straps.
174
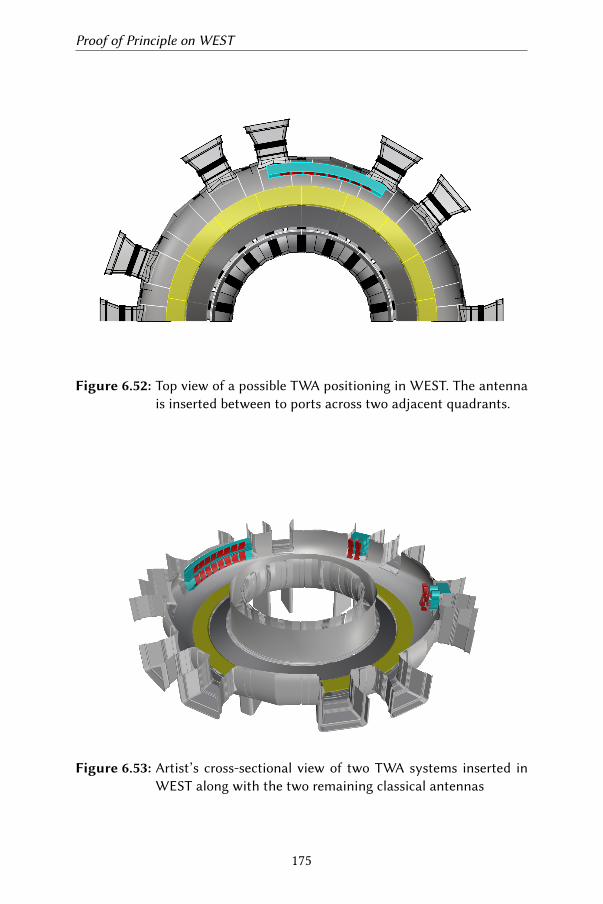
Proof of Principle on WEST
Figure 6.52: Top view of a possible TWA positioning in WEST. The antennais inserted between to ports across two adjacent quadrants.
Figure 6.53: Artist’s cross-sectional view of two TWA systems inserted inWEST along with the two remaining classical antennas
175


Chapter 7
Overview and conclusions
7.1 Overview
This work is done in the context of controlled thermonuclear fusion research,for which heating methods allowing to reach fusion-relevant temperaturesare some of the main fields of research. The world’s population is expectedto grow to 9 billion by 2040, driving global demand for electricity up by 45%.Meeting this demand with the technologies available today will require thatfossil fuels remain a primary means of electricity generation. Our industrialsociety critically depends on the availability of cheap energy. To sustain eco-nomic growth while at the same time overcoming climate change, we needto develop sources of energy that are emission-free, safe, globally availableand economically viable. It is widely believed that renewables alone willsuice. But this could be questionable. Fusion has the unique capability toprovide utility-scale energy on-demand wherever it is needed, making it anexcellent complement for intermient renewables and baery storage. Com-bined, these technologies make for a practical energy portfolio that mitigatesclimate change while driving economic prosperity.
A number of dierent types of experimental fusion reactors relying on mag-netic confinement exist. The tokamak is one of them and is the only config-uration considered in this work; it is presently the configuration selected forthe demonstration reactor. All experimental fusion devices have 1 key aspectin common: To ensure the plasmas can reach temperatures high enough forspontaneous fusion to set in, an eicient heating scheme is required. This hasbeen briefly discussed in the background chapter. Electromagnetic wavesthat are excited in the low density, low temperature edge region of suchdevices but that carry wave energy to the hot plasma core where they aresubsequently absorbed, have proven experimentally to reach that goal. Dif-
177
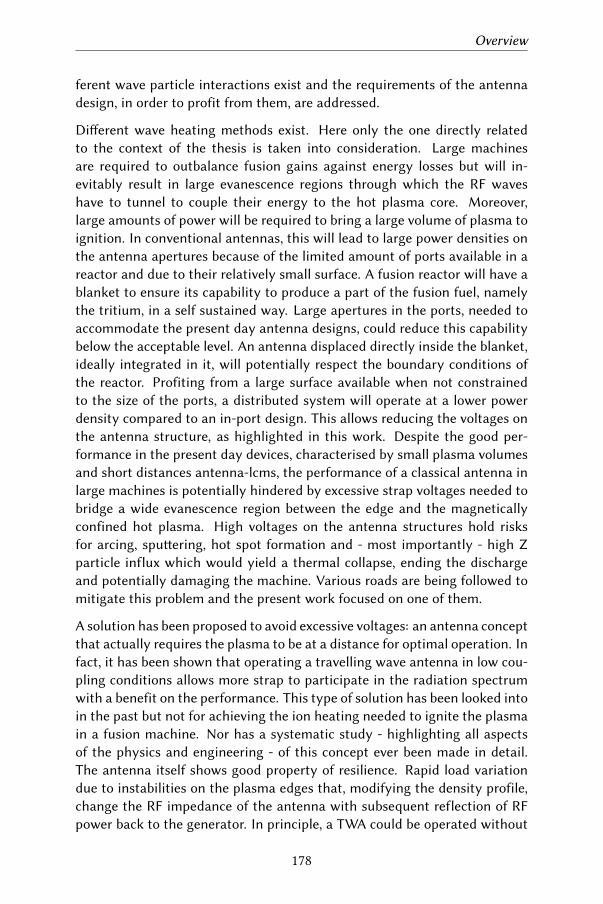
Overview
ferent wave particle interactions exist and the requirements of the antennadesign, in order to profit from them, are addressed.
Dierent wave heating methods exist. Here only the one directly relatedto the context of the thesis is taken into consideration. Large machinesare required to outbalance fusion gains against energy losses but will in-evitably result in large evanescence regions through which the RF waveshave to tunnel to couple their energy to the hot plasma core. Moreover,large amounts of power will be required to bring a large volume of plasma toignition. In conventional antennas, this will lead to large power densities onthe antenna apertures because of the limited amount of ports available in areactor and due to their relatively small surface. A fusion reactor will have ablanket to ensure its capability to produce a part of the fusion fuel, namelythe tritium, in a self sustained way. Large apertures in the ports, needed toaccommodate the present day antenna designs, could reduce this capabilitybelow the acceptable level. An antenna displaced directly inside the blanket,ideally integrated in it, will potentially respect the boundary conditions ofthe reactor. Profiting from a large surface available when not constrainedto the size of the ports, a distributed system will operate at a lower powerdensity compared to an in-port design. This allows reducing the voltages onthe antenna structure, as highlighted in this work. Despite the good per-formance in the present day devices, characterised by small plasma volumesand short distances antenna-lcms, the performance of a classical antenna inlarge machines is potentially hindered by excessive strap voltages needed tobridge a wide evanescence region between the edge and the magneticallyconfined hot plasma. High voltages on the antenna structures hold risksfor arcing, spuering, hot spot formation and - most importantly - high Zparticle influx which would yield a thermal collapse, ending the dischargeand potentially damaging the machine. Various roads are being followed tomitigate this problem and the present work focused on one of them.
A solution has been proposed to avoid excessive voltages: an antenna conceptthat actually requires the plasma to be at a distance for optimal operation. Infact, it has been shown that operating a travelling wave antenna in low cou-pling conditions allows more strap to participate in the radiation spectrumwith a benefit on the performance. This type of solution has been looked intoin the past but not for achieving the ion heating needed to ignite the plasmain a fusion machine. Nor has a systematic study - highlighting all aspectsof the physics and engineering - of this concept ever been made in detail.The antenna itself shows good property of resilience. Rapid load variationdue to instabilities on the plasma edges that, modifying the density profile,change the RF impedance of the antenna with subsequent reflection of RFpower back to the generator. In principle, a TWA could be operated without
178
Overview and conclusions
matching networks. It has also been shown here that there exists a beerconfiguration in which all the power launched by the generator is deliveredto the antenna and that the generator remains matched even for very largevariations of the plasma edge.
A detailed study of the concept for the reactor was provided: its main featuressummed up and discussed one by one. Integration in the reactor was onlypartially addressed, being out of the scope of this work. Future work in thisrespect will be needed to ensure that the RF capabilities of the antenna willnot be degraded during the integration. The feeding concept, based on theresonant ring, was discussed in detail. A strategy valid for a simple controlalgorithm was derived. Although a direct comparison was not made in thiswork, it appears from the description given in the dedicated chapter thatthe system should perform beer than a conventional one, especially for areactor, when subjected to a RAMI analysis.
The available experimental results, both in vacuum and when using a di-electric, are discussed confirming the solidity of the design strategy and thereliability of the modelling tools developed. The mock-ups built and used inthe experimental phase have shown where to improve the design of the nextstep testbeds.
7.2 Summary and discussion
The manuscript firstly describe in details the methodology used to create themodels for analysing the performance of a Traveling Wave Array antenna infront of a realistic plasma profile. Simplified models based on the assumptionthat the mutual coupling acts only on the nearest neighbouring straps wereused previously in the literature. The eect of the plasma has been consideredbased on some simplifications or asymptotic behaviours. We have taken an-other perspective. The use of a specific coupling code allows to compute thearray impedance matrix with a realistic plasma profile in front of the array.The results show that, in the usual ICRF domain and for realistic antennageometries compatible with a reactor, the mutual coupling between strapsextends to several neighbouring elements. A customisation of the couplingcode ANTITER-II allows to compute the array matrix for arbitrary plasmaprofiles and arbitrary array geometry. To validate the results obtained by thecode, a comparison was made by means of commercial full-wave EM solvers.Those codes are based on a dierent method (i.e. finite element method,FEM) w.r.t. the one used by ANTITER-II (mainly spectral). Unfortunatelythe commercial codes are unable to properly model the plasma response.To overcome this limitation, based on the results available in literature and
179
Summary and discussion
the specific experience developed inside my research group, an equivalentmodel based on dielectric material is used for the comparison. Numericalmodelling of the response of an array were performed and compared val-idating the method. An experimental validation of both commercial codeand ANTITER-II was performed by comparing the numerical results againstthe measurements in a dedicated mock-up. The dielectric material chosen toload the antenna was water, mainly because it is inexpensive and very easyto manipulate. A dierent dielectric with a higher dielectric constant (e.g.barium titanate) is a valid alternative but the costs are higher and the safetyrules for its use are more restrictive.
One main limitation of the procedure described above comes from the spe-cific method used to solve the EM problem in ANTITER-II. The straps aredescribed as infinitely thin (in the radial direction) current sheaths. In realitythey have a finite thickness and they are metal structures. The boundaryconditions are thus quite dierent between ANTITER-II and a FEM solver. Acomparison of the results between ANTITER-II and a full-wave solver, wherethe straps are modelled in a more consistent way, showed slightly dierentvalues in the relative values of the strap self- and mutual impedance. Despitethe dierences are small, a further investigation is ongoing to rule out anypossible discrepancy between the models. We have seen no major dierencesfor what concerns the TWA response when computed by the two codes forthe same dielectric loading. Only a small dierence exists for the value of thetuning capacitors because of its dependence on the array impedance matrix.This small dierence shows up also in the frequency response. To investigatethe dierences, a more precise mock-up is under design. Indeed the com-parison between the numerical model and the mock-up is more qualitativethan quantitative due to severe imperfections in the fabrication. Although areconstruction of the mock-up in a numerical model was possible, the satis-fying agreement between the response of the perfect numerical model andthe approximative physical realisation guided us to the conclusion that thedesign of a new mock-up is the next step to pursue. The new design willallow direct comparison between the experimental measurements and thenumerical model.
Another limitation is that only flat models can be analysed with a realisticplasma profile using the ANTITER-II code. FEM codes (like HFSS) insteadcould analyse arbitrary geometries but, as mentioned above, lack a realis-tic antenna loading description. Several models were created and analysedshowing lile dierence w.r.t. the flat one. Further analysis are requiredbut a limitation arises due to the demanding computational resources whendetailed geometries and large volumes are modelled. Those limitations arelikely to be removed in the near future due to the constant increase in com-
180
Overview and conclusions
puting performance and advances in the computational electromagnetismdomain. Moreover several researchers are active in the topic of ICRF mod-elling and new solutions are expected in the near future. Curved or flatmodels should also be analysed by dierent codes.
A particular aspect that emerge form this work is the sensitivity of the ca-pacitor in determining the response of the TWA. There several options forthe values of the capacitor. This flexibility allows tailoring the design of theTWA to the specifications that are a moving target in the case of the reactor.The analysis presented here compared to possibilities: a simple configura-tion where the capacitor values are, in first approximation, the same andan optimised configuration where the capacitors are optimised in order toobtain a large bandwidth. This optimisation results in capacitor with quitedierent values. This could represent a diiculty in the practical realisationof the capacitors themselves, especially for the large values of the capaci-tance. Further analysis will clear this important point. Another eect of theoptimised capacitor set is the large fluctuation of the voltage and current onthe straps when compared to the simple configuration. This aspect shouldbe taken into account in the next designs and further investigated. A positiveaspect is an increased variation of the peak position as a function of thefrequency. This input should be used when core physic aspects are treatedand when the TWA is compared against conventional antennas. Indeed aremark is the lack of flexibility of the TWA design when compared to theclassical one. It is true that frequency and spectrum are tightly connected ina TWA, however classical designs have some practical limitations reducingthe flexibility of tailoring the spectrum independently form the frequency.Moreover, when design guidelines on impurity reduction are followed, a clas-sical antenna faces severe limitations on the possible phasing of its elements,reducing drastically its flexibility. On a TWA, only part of those guidelines areapplicable. Further specific analysis should be performed to fairly compare aTWA and its corresponding classical counterpart when designed for a reactoruse.
The procedure discussed here forms the basic tool for the design of a TWA.The numerical codes are used to compute the array impedance matrix. Thismatrix is then used to construct the comb-line structure by adding capacitorsto the open-ended lines. The resulting structure forms a TWA that can bedescribed as a 2-port network. This network is then connected to dierentfeeding circuits in order to evaluate the best choice in view of its use as ICRFsystem in a future reactor. The TWA is equivalent to a lossy transmission linewhen operated inside its bandwidth. The losses are due to power that leaksto the plasma while travelling downward on the structure. If the structureis long enough, no power will reach the end being all coupled to the plasma.
181
Summary and discussion
Unfortunately this represents an non optimal use of the space inside the toka-mak vessel. Practically the length of a realistic antenna has to be constrained.Depending on the plasma loading, a dierent amount of power reaches theend of the array and has to be removed. Otherwise it will be reflected andconsequently travels upward on the structure. This reflection could give riseto standing-wave paerns that will increase the voltage and the current ina localised and unwanted way on the structure. For this reason, the TWAhas two feeding lines (indeed it is a 2-port network). One line is used tofeed the antenna while the other is used to evacuate the remaining powerout of the structure. To avoid further reflections, this draining line has to bematched by a load where the leaving power is dissipated. Because the TWAis a internally match structure, the generator could be connected directly toit. The TWA system is then much more simple than a conventional antennawhere a matching (and oen also a decoupling) network is absolutely needed.However, the eiciency of the TWA system is reduced and depends on theloading condition of the antenna. Indeed the amount of power that is dissi-pated in the dummy load varies with the load. Moreover, the power radiatedto the plasma is the dierence between the power that enters the TWA andthe power that leaves the TWA at its output, when losses are neglected. Thismeans that for a fixed generator power the radiated power, that depends onthe loading, is always smaller than the available power at the generator. Thispower should instead be recovered and recirculated back to the input of theantenna.
A solution to overcome to this problem exists: use a resonant ring as feed-ing circuit. The principles behind a resonant ring circuit and its practicalimplementation are extensively discussed in this manuscript. The main ad-vantage of the use of the resonant ring is that all the available generatorpower is radiated to the plasma, when losses in the circuit are negligible. Adisadvantage is that the resonant ring circuit required a variable couplingcoeicient coupler (VCCC) to deal with the expected variation of the plasmaload. The VCCC is formed by two hybrid couplers and one line-stretcher. Anadditional line-stretcher is required in one feeding line to tune, along with theVCCC, the resonant ring. The number of components is increased w.r.t. thesimple direct feeding circuit. However, those components are commerciallyavailable components at the typical frequencies for ICRH and rated for thehigh power level required in fusion reactors. Another positive aspects is thatall those components are outside the critical areas (i.e. a cryostat for a reactoror the machine vessel for a current days plasma experimental device) withbeneficial impact on the availability of the system. The control system ofsuch a resonant ring is also described in this manuscript. The behaviourof the ring and of its control strategy was experimentally validated at low
182
Overview and conclusions
power on a test bench and subsequently used as feeding circuit for the TWAmock-up. A realistic controller considering the response delay due to themechanical actuators is available in the TWA system simulator developedbut an experimental validation test is still required.
The array could be of any shape and number of straps. Dierent config-urations (like a ring structure) are analysed. The best configuration turnsout being a system made by independent sections fed by resonant rings. Asystem is proposed for DEMO based on the laer configuration. In order todecrease the power density, a large number of sections is used. The maximumlevel of voltage allowed on the structure was arbitrarily set to the value of15 kV. This value has no particular reason apart being clearly lower than fora classical antenna. The trade o is between the available space (thus thenumber of sections), the maximal voltage and the power target. The mainlimitation of the TWA in this respect appears to be the maximum voltagetolerable in the structure. An aspect that is not treated in detail in this workis indeed the design of the capacitors. The voltage stand-o of the capacitoris directly related to the maximum voltage allowable on the strap of a TWA.The work is in progress on this particular topic. It appears not to be a criticalissue but it requires a good RF design and optimisation. The capacitors areopen-ended strip lines that could be modelled as parallel plate capacitors inparallel. Being short w.r.t. the wavelength, the voltage distribution will notchange considerably from the end of the strap (i.e. the beginning of the stripline) to the end of the strip line. In this respect, the voltage computed by theANTITER-II code is a good indication of the voltage in the capacitor plates.The corresponding electric field could be calculated from a simple analyticalformula. Nevertheless, a detail model was built and analysed in HFSS andthe result were compared with the one obtained by ANTITER-II giving a verygood agreement. A high power mock up of the antenna will address directlythe capacitor issue.
The details of the strap configuration is another aspect that requires furtherdevelopment. The two models cited, L-type and the T-type, will performdierently from the circuital point of view. Indeed the impedance of thestructure will be dierent. The T-type was already analysed in the literature,so no major issues are expected in its realisation. The main constraint arisesfor the natural resonances of the T-types that require some aention duringthe design. The analyse done in this manuscript considered the simplifiedantenna model allowed by ANTITER-II. The main dierence between the L-type and the T-type is that the second allows a longer antenna doubling thevoltage dierence thus resulting in a higher coupling capability. No T-typemodels were analysed with the FEM code. This is le for a future work. Itis indeed important to confirm the response of this structure computed by
183
Summary and discussion
ANTITER-II.
In the proposal for DEMO, the analysis was done without considering themutual coupling eect of poloidally displaced sections. The code ANTITER-II has been recently modified to allow computing this aspect for an arbitrarynumber of sections arbitrarily positioned in the vessel. The same analysisdone in this manuscript will be performed considering this important aspectto evaluate the impact on the performance of the arrays and of the feedingcircuits. The eect of the tilting of the background magnetic field was alsodisregarded in the analysis and will be added in the future review. A prelim-inary analysis showed that although the eect is not deleterious, it shouldnot be neglected. This eect will not be disregarded especially in the WESTdesign where a high power mock-up is under design and it will be tested inthe forthcoming years.
The topology of the near EM fields of the TWA is analysed in comparisonwith the conventional antenna designed (and in operation) on WEST. Thepreliminary analysis presented here shows a positive reduction of the fieldcomponents parallel to the background magnetic field lines. This specificaspect of the antenna design is an active topic that started with the analysisreported in this manuscript but that requires a dedicated study. In particular,while the reduction of the field amplitude is mainly related to the decreasedpower density allowed by a TWA, the eect of the dierent (w.r.t. the one ofa conventional antenna) field distribution is not clearly understood. Severalmodels are available in the research community to study this particular eectand the activity will require a dedicated eort hopefully complemented byexperimental activity. Indeed the TWA antenna presents new challenges notfaced with the conventional antennas. The proposal for testing a TWA onWEST goes in this direction. If validated, the results extrapolation to a futurereactor will guide the design of a TWA system on DEMO.
One aspect that was not in the scope of this work, but that is closely relatedto it, is the integration of a TWA system in a future reactor like DEMO. Thedesign proposed for such a machine will require an iterative procedure toalign the RF performance with the thermo-mechanical requirements of theblanket where the antenna will be located. An example of integration isproposed. The methodology developed here will facilitate this interactionallowing a flexibility in the analysis while preserving key factors like theplasma response and the RF performances. Variations in the parameter spaceare possible without requiring extensive computational resources. Design ofspecific components (i.e. capacitors, straps, feeding connections, antennabox) are easily possible by the interaction between the dedicated codes. Anassessment of the compatibility of the RF design proposed for DEMO is stillrequired. Nevertheless the performance obtained showed that the antenna
184
Overview and conclusions
could deliver the required amount of power at a low voltage and electric fieldon the antenna structure. Several dierent antenna configurations couldbe analysed varying the number of elements per sections, the number ofsections, their location inside the machine and their phasing.
7.3 Final conclusion
A practical proposal for the DEMO machine is the first main outcome fromthis work. It has been shown that the concept satisfies the needs. Althoughthe design and construction of DEMO will probably occur in the next coupleof decades, being the first of its kind, its conceptual design is already ongoingto ensure that no showstoppers appear. This thesis addresses one of thesepotential showstoppers and oers a solution with improved performancewhen compared to its classical counterpart.
The design strategy is based on a solid theoretical basis. An experimentalverification of the derived properties has been carried out as support for theconceptual design of the antenna.
A proof of principle in a tokamak environment, to ensure that the theoreticalpredictions in presence of a magnetised plasma are correct, is the secondmain outcome of this thesis. So far, the only experimental evidence is notin a fusion-relevant environment. A new test that can benefit from the newunderstanding developed in recent years is required to proceed with confi-dence toward the integration in the reactor. A detailed description of theperformance of an antenna + feeding system was carried out. This is onlythe first step for a complete design that will follow in the forthcoming year.
185


Appendices
187

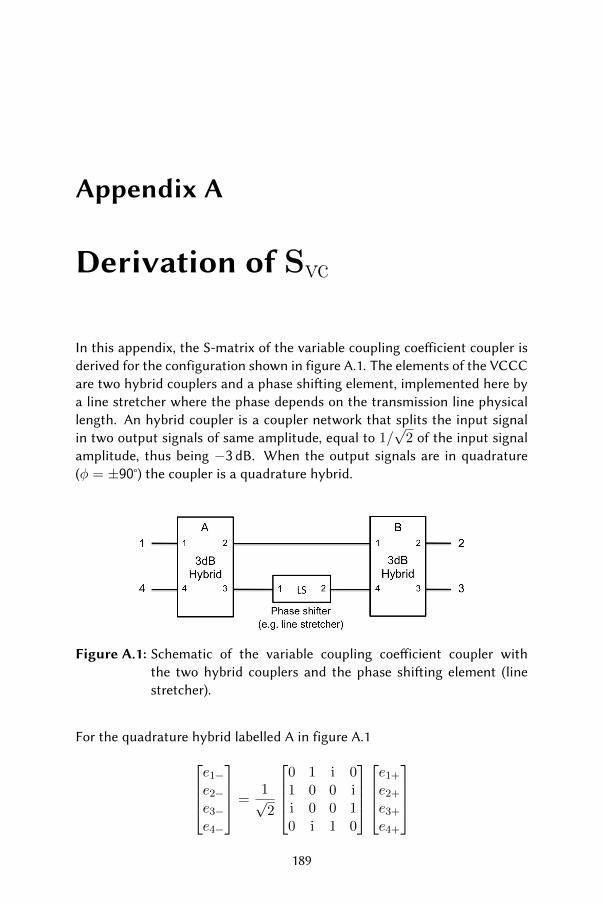
Appendix A
Derivation of Svc
In this appendix, the S-matrix of the variable coupling coeicient coupler isderived for the configuration shown in figure A.1. The elements of the VCCCare two hybrid couplers and a phase shiing element, implemented here bya line stretcher where the phase depends on the transmission line physicallength. An hybrid coupler is a coupler network that splits the input signalin two output signals of same amplitude, equal to 1/
√2 of the input signal
amplitude, thus being −3 dB. When the output signals are in quadrature(φ = ±90°) the coupler is a quadrature hybrid.
Figure A.1: Schematic of the variable coupling coeicient coupler withthe two hybrid couplers and the phase shiing element (linestretcher).
For the quadrature hybrid labelled A in figure A.1e1−e2−e3−e4−
=1√2
0 1 i 01 0 0 ii 0 0 10 i 1 0
e1+
e2+
e3+
e4+
189

with ep− and ep+ respectively the reflected and forward voltages at the p-port. In a similar way, for the quadrature hybrid B
f1−f2−f3−f4−
=1√2
0 1 i 01 0 0 ii 0 0 10 i 1 0
f1+
f2+
f3+
f4+
and for the line stretcher LS[
g1−g2−
]=
[0 δδ 0
] [g1+
g2+
]As show in figure, the corresponding connections gives:
e2+ = f1− f1+ = e2− g1+ = e3−
e3+ = g1− f4+ = g2− g2+ = f4−
Combining the previous equations
e1− =1
2f2+(1− δ) + i
1
2f3+(1 + δ)
f2− =1
2e1+(1− δ) + i
1
2e4+(1 + δ)
f3− = i1
2e1+(1 + δ)− 1
2e4+(1− δ)
e4− = i1
2f2+(1 + δ)− 1
2f3+(1− δ)
Noting that e1± = h1±, f2± = h2±, f3± = h3± and e4± = h4± with hp+ andhp− the forward and reversed voltages at the p-port of the variable couplingcoupler, the previous system of equations can be rearranged in matrix formas
h1−h2−h3−h4−
=1
2
0 (1− δ) i(1 + δ) 0
(1− δ) 0 0 i(1 + δ)i(1 + δ) 0 0 −(1− δ)
0 i(1 + δ) −(1− δ) 0
h1+
h2+
h3+
h4+
and the Svc matrix can be defined
Svc =
0 a ib 0a 0 0 ibib 0 0 −a0 ib −a 0
a =1
2(1− δ) b =
1
2(1 + δ)
190
Appendix B
Ohmic loss estimation
In all the analysis presented in the main text, the ohmic losses were assumedto be negligible when compared to the radiation losses. In order to evaluatethe ohmic losses a TWA structure of eight straps embedded in a infinite metalwall is analysed by a full-wave code in two dierent configurations: a vacuumcase where the antenna aperture is facing an open radiation boundary, asshown in figure B.1, and a dielectric loaded case where the aperture is facinga dielectric slab at dierent distances in front of it. The eect of this dielectricmaterial on the TWA structure mimics the one of the plasma, at least fromthe engineering point of view [42, 62].
The geometrical parameters of the model are: strap width 200mm, straplength 270mm, strap inter-distance 250mm, strap recess 20mm, strap thick-ness 15mm, antenna box aperture height 275mm, antenna box depth 185mmand antenna box aperture length 2450mm as shown in figure B.2. The eightstraps are fed by lumped ports for which the characteristic impedance is setat a value close to the expected one. The use of this type of port allows keep-ing the tuning capacitors outside of the simulation domain by decreasingthe complexity of the model, thus the solution time and the computationrequirements. The boundary conditions for the full-wave analysis are: per-fect electric conductor (PEC) for the first wall and perfectly matched layer(PML) for all the other open boundaries. The response of the TWA structurein vacuum condition is computed to evaluate the eect of losses in threedierent cases: PEC, copper (Cu) and stainless steel (SS). A finite conductivityboundary condition is assigned to all surfaces inside the antenna box witha conductivity σ as tabulated in table B.1. The eect of losses is extrapo-lated taking as reference the PEC response and evaluating the dierence intransmission coeicient with Cu and SS.
Each strap of the array is connected to a capacitor of suitable value in order
191
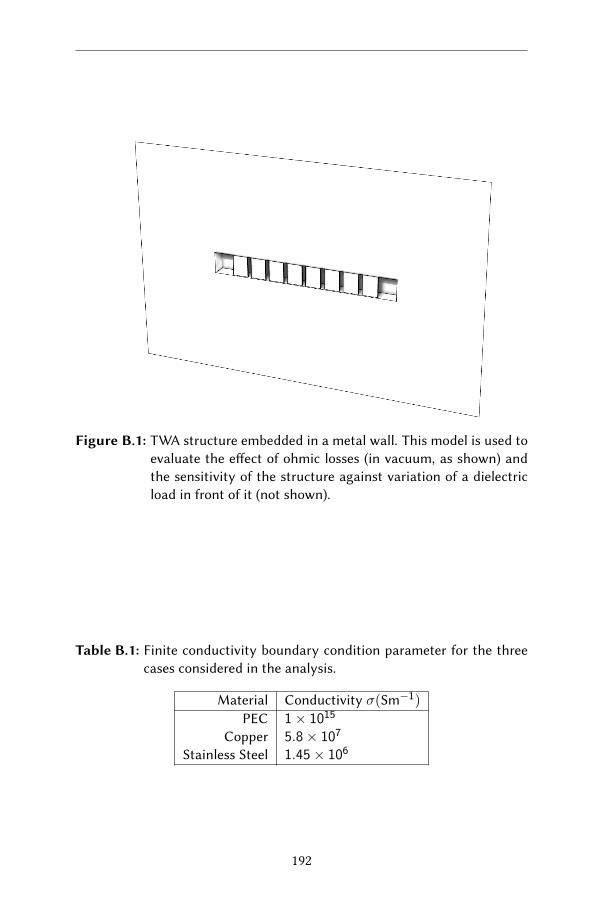
Figure B.1: TWA structure embedded in a metal wall. This model is used toevaluate the eect of ohmic losses (in vacuum, as shown) andthe sensitivity of the structure against variation of a dielectricload in front of it (not shown).
Table B.1: Finite conductivity boundary condition parameter for the threecases considered in the analysis.
Material Conductivity σ(Sm−1)PEC 1× 10¹⁵
Copper 5.8× 10⁷
Stainless Steel 1.45× 10⁶
192
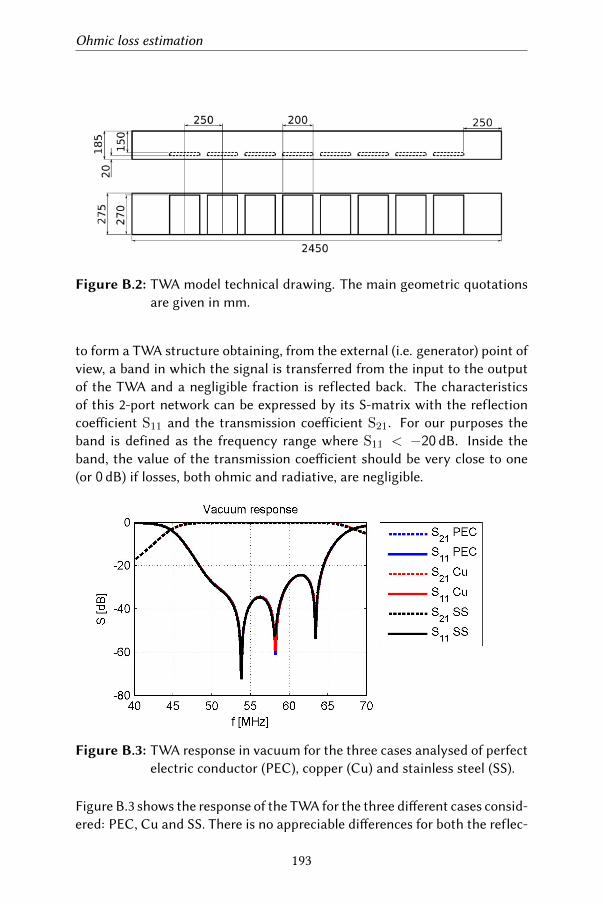
Ohmic loss estimation
Figure B.2: TWA model technical drawing. The main geometric quotationsare given in mm.
to form a TWA structure obtaining, from the external (i.e. generator) point ofview, a band in which the signal is transferred from the input to the outputof the TWA and a negligible fraction is reflected back. The characteristicsof this 2-port network can be expressed by its S-matrix with the reflectioncoeicient S11 and the transmission coeicient S21. For our purposes theband is defined as the frequency range where S11 < −20 dB. Inside theband, the value of the transmission coeicient should be very close to one(or 0 dB) if losses, both ohmic and radiative, are negligible.
Figure B.3: TWA response in vacuum for the three cases analysed of perfectelectric conductor (PEC), copper (Cu) and stainless steel (SS).
Figure B.3 shows the response of the TWA for the three dierent cases consid-ered: PEC, Cu and SS. There is no appreciable dierences for both the reflec-
193
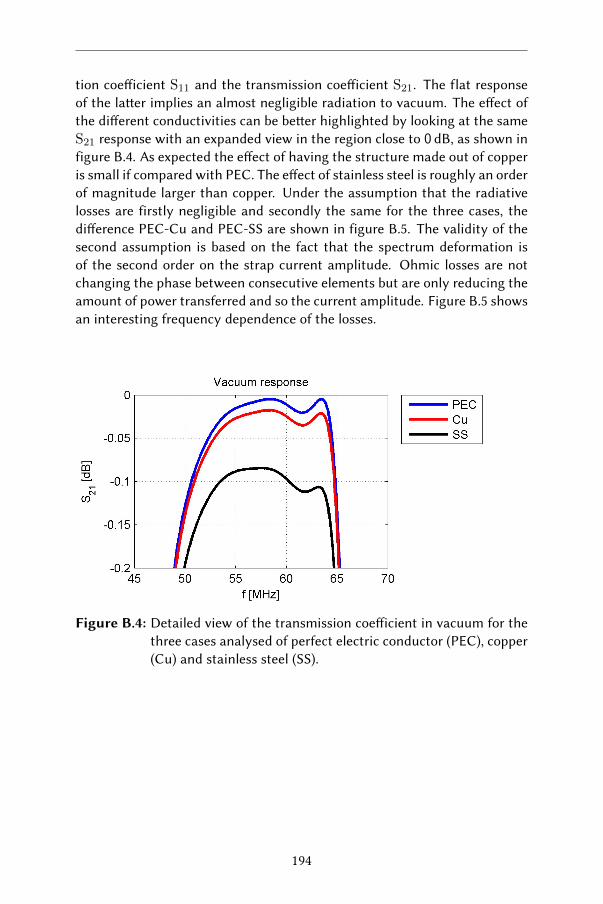
tion coeicient S11 and the transmission coeicient S21. The flat responseof the laer implies an almost negligible radiation to vacuum. The eect ofthe dierent conductivities can be beer highlighted by looking at the sameS21 response with an expanded view in the region close to 0 dB, as shown infigure B.4. As expected the eect of having the structure made out of copperis small if compared with PEC. The eect of stainless steel is roughly an orderof magnitude larger than copper. Under the assumption that the radiativelosses are firstly negligible and secondly the same for the three cases, thedierence PEC-Cu and PEC-SS are shown in figure B.5. The validity of thesecond assumption is based on the fact that the spectrum deformation isof the second order on the strap current amplitude. Ohmic losses are notchanging the phase between consecutive elements but are only reducing theamount of power transferred and so the current amplitude. Figure B.5 showsan interesting frequency dependence of the losses.
Figure B.4: Detailed view of the transmission coeicient in vacuum for thethree cases analysed of perfect electric conductor (PEC), copper(Cu) and stainless steel (SS).
194
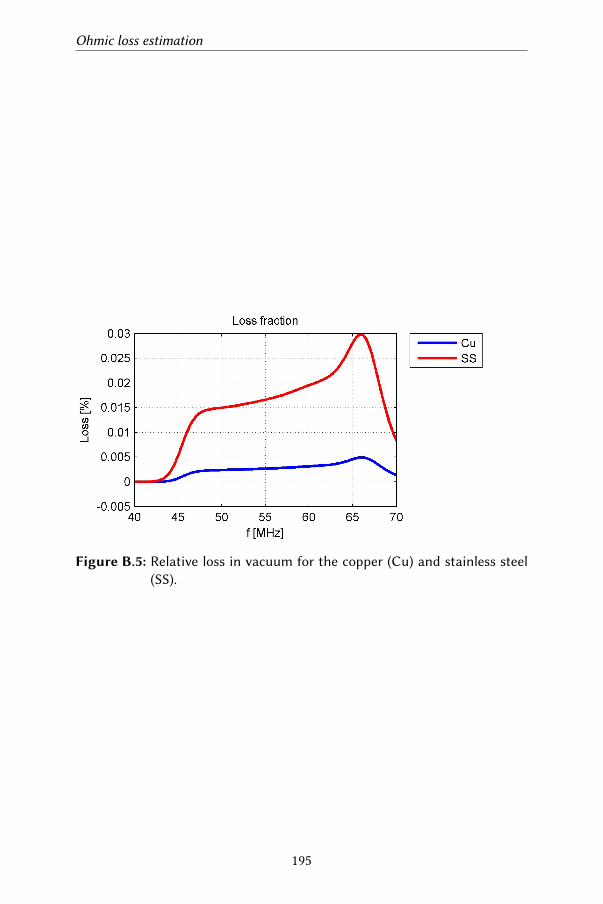
Ohmic loss estimation
Figure B.5: Relative loss in vacuum for the copper (Cu) and stainless steel(SS).
195
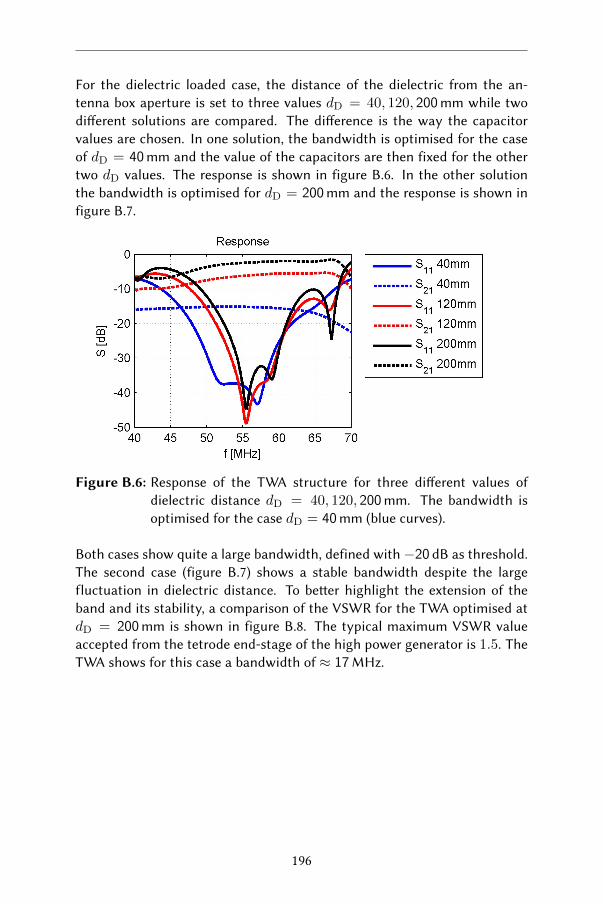
For the dielectric loaded case, the distance of the dielectric from the an-tenna box aperture is set to three values dD = 40, 120, 200mm while twodierent solutions are compared. The dierence is the way the capacitorvalues are chosen. In one solution, the bandwidth is optimised for the caseof dD = 40mm and the value of the capacitors are then fixed for the othertwo dD values. The response is shown in figure B.6. In the other solutionthe bandwidth is optimised for dD = 200mm and the response is shown infigure B.7.
Figure B.6: Response of the TWA structure for three dierent values ofdielectric distance dD = 40, 120, 200mm. The bandwidth isoptimised for the case dD = 40mm (blue curves).
Both cases show quite a large bandwidth, defined with−20 dB as threshold.The second case (figure B.7) shows a stable bandwidth despite the largefluctuation in dielectric distance. To beer highlight the extension of theband and its stability, a comparison of the VSWR for the TWA optimised atdD = 200mm is shown in figure B.8. The typical maximum VSWR valueaccepted from the tetrode end-stage of the high power generator is 1.5. TheTWA shows for this case a bandwidth of ≈ 17MHz.
196
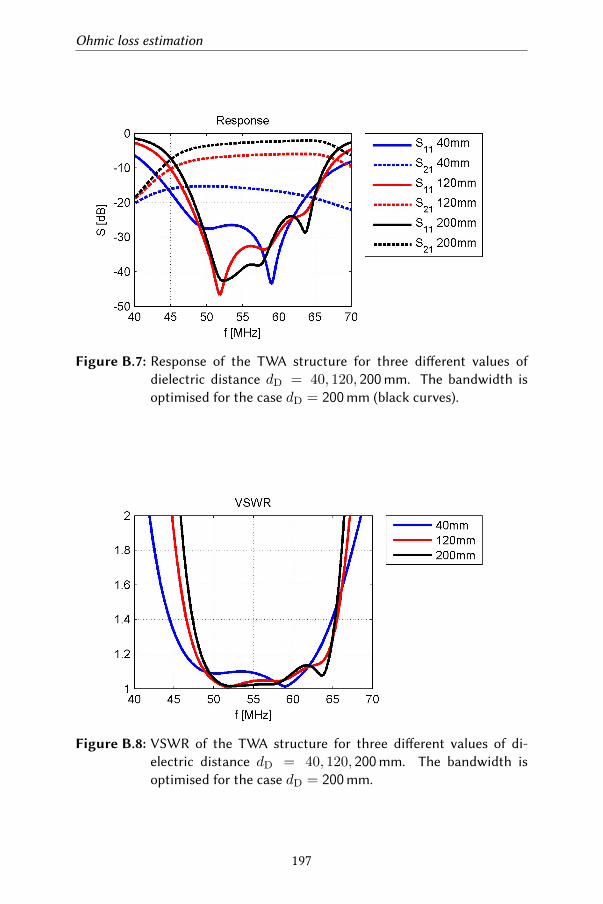
Ohmic loss estimation
Figure B.7: Response of the TWA structure for three dierent values ofdielectric distance dD = 40, 120, 200mm. The bandwidth isoptimised for the case dD = 200mm (black curves).
Figure B.8: VSWR of the TWA structure for three dierent values of di-electric distance dD = 40, 120, 200mm. The bandwidth isoptimised for the case dD = 200mm.
197
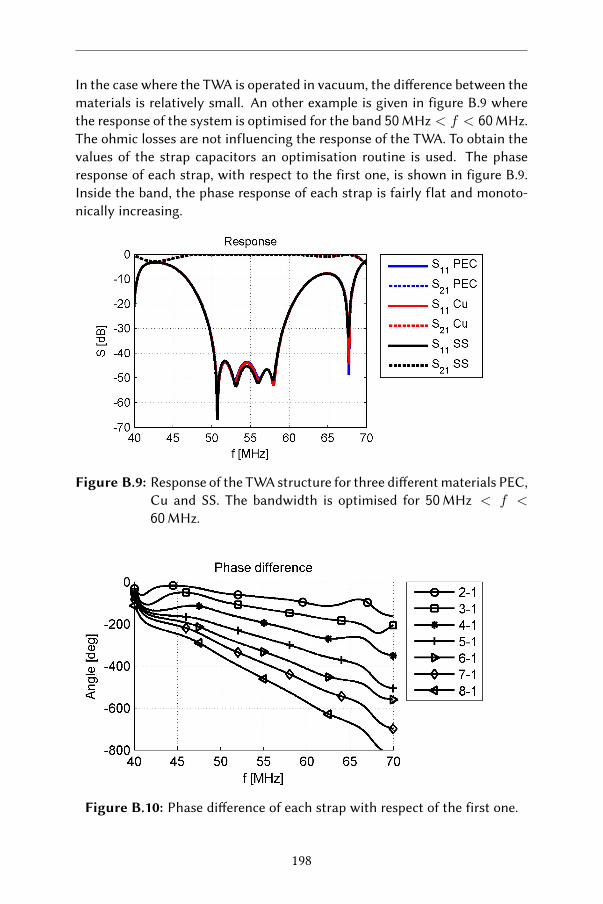
In the case where the TWA is operated in vacuum, the dierence between thematerials is relatively small. An other example is given in figure B.9 wherethe response of the system is optimised for the band 50MHz < f < 60MHz.The ohmic losses are not influencing the response of the TWA. To obtain thevalues of the strap capacitors an optimisation routine is used. The phaseresponse of each strap, with respect to the first one, is shown in figure B.9.Inside the band, the phase response of each strap is fairly flat and monoto-nically increasing.
Figure B.9: Response of the TWA structure for three dierent materials PEC,Cu and SS. The bandwidth is optimised for 50MHz < f <60MHz.
Figure B.10: Phase dierence of each strap with respect of the first one.
198

Appendix C
ICA performance
The response of the WEST ion cyclotron antenna (ICA) is analysed here fordierent poloidal phasing configurations. Only the two values d = 4 cmand 12 cm are considered for this analysis. The poloidal phasing used areφp = 90, 135 and 180. The last value was already used in the previousanalysis. The voltage required at f0 to couple 1MW in the three dierentconfigurations is shown in figure C.1 for the first case d = 4 cm. The forwardpower on port #1 is shown in figure C.2 but this time the value of the poweris slightly dierent on each port for the two cases φp = 90, 135. Thevalues are tabulated in table C.1. For completeness, the triplet for φp = 180
that was computed previously is here repeated: P+ = 10.79MW, P− =10.54MW, P+ = 0.25MW and it is the same on each port.
Table C.1: ICA forward, reflected and net power per port at f0 = 55MHz tohave 1MW coupled.
φp = 90
Port P+ P− Pnet
(MW) (MW) (MW)
#1 17.146 16.973 0.173#2 17.137 16.963 0.174#3 17.057 16.730 0.327#4 17.057 16.732 0.325
φp = 135
P+ P− Pnet
(MW) (MW) (MW)
12.115 11.903 0.21212.109 11.896 0.21312.070 11.781 0.28812.069 11.782 0.287
The net power per port as a function of the frequency for all the three casesof φp is shown in figure C.3.
Figure C.3 shows two interesting facts: there is strong mutual coupling be-tween the straps and the response at φp = 180 is immune to that. While the
199
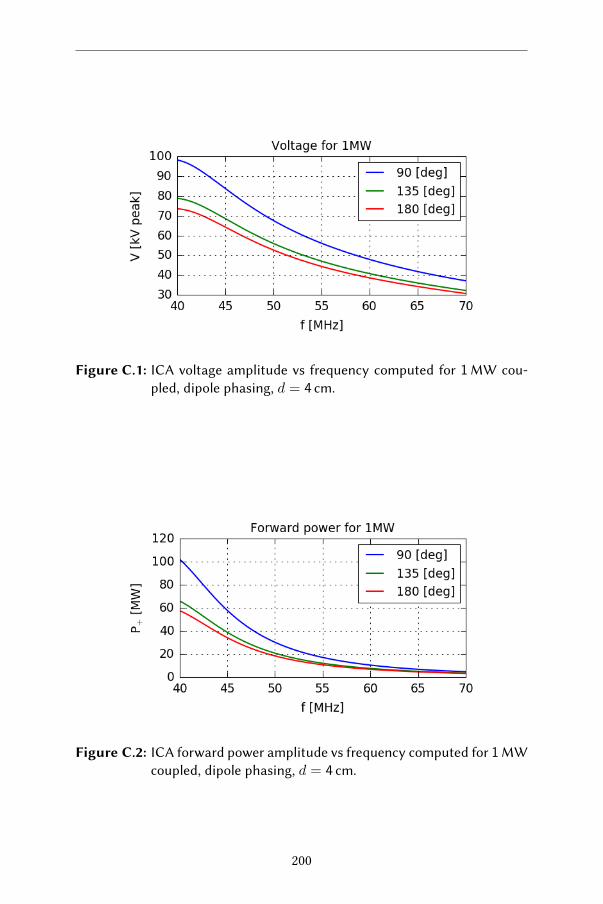
Figure C.1: ICA voltage amplitude vs frequency computed for 1MW cou-pled, dipole phasing, d = 4 cm.
Figure C.2: ICA forward power amplitude vs frequency computed for 1MWcoupled, dipole phasing, d = 4 cm.
200
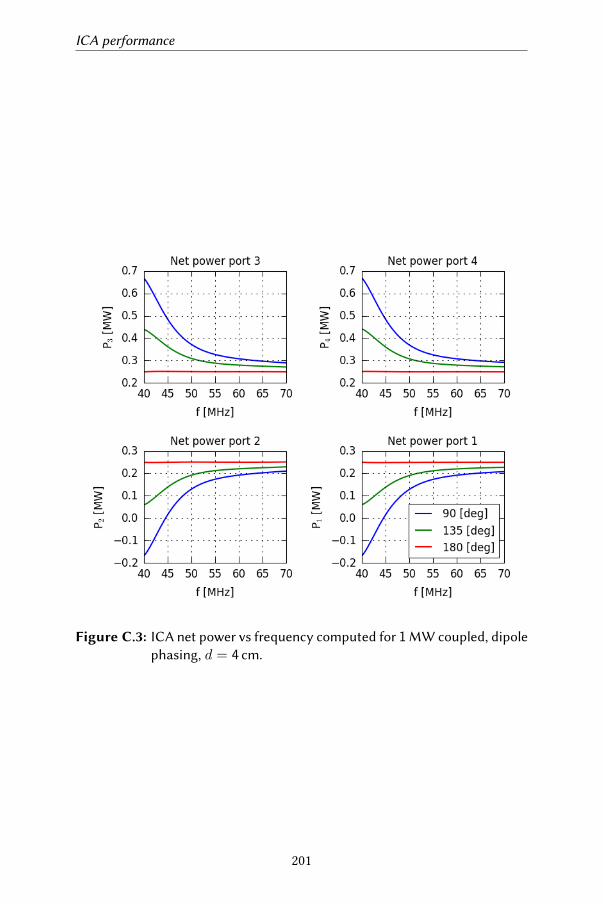
ICA performance
Figure C.3: ICA net power vs frequency computed for 1MW coupled, dipolephasing, d = 4 cm.
201
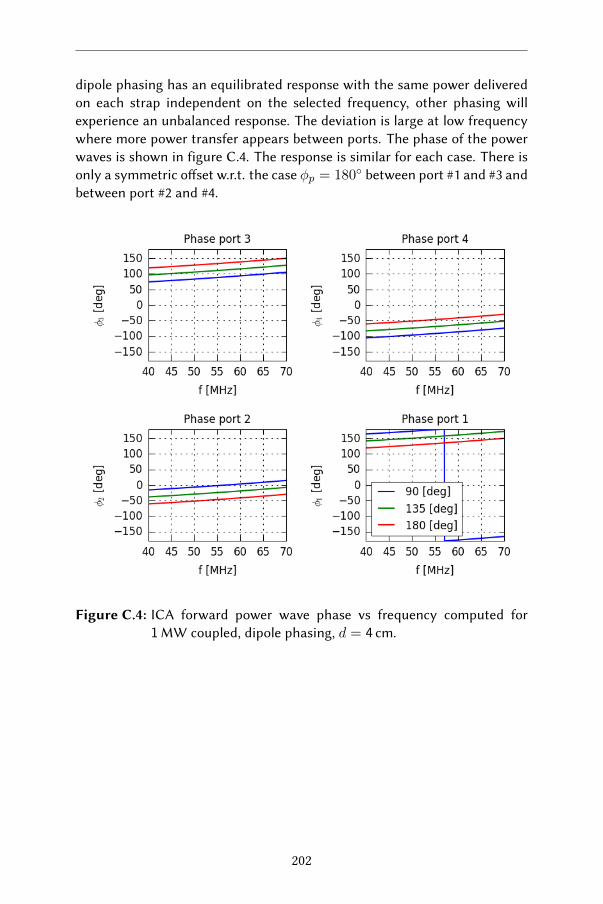
dipole phasing has an equilibrated response with the same power deliveredon each strap independent on the selected frequency, other phasing willexperience an unbalanced response. The deviation is large at low frequencywhere more power transfer appears between ports. The phase of the powerwaves is shown in figure C.4. The response is similar for each case. There isonly a symmetric oset w.r.t. the case φp = 180 between port #1 and #3 andbetween port #2 and #4.
Figure C.4: ICA forward power wave phase vs frequency computed for1MW coupled, dipole phasing, d = 4 cm.
202
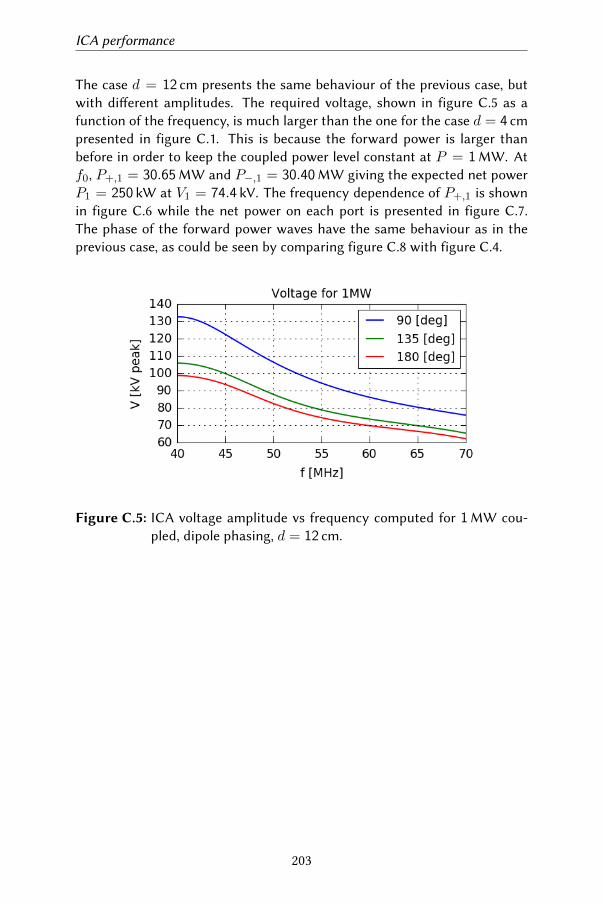
ICA performance
The case d = 12 cm presents the same behaviour of the previous case, butwith dierent amplitudes. The required voltage, shown in figure C.5 as afunction of the frequency, is much larger than the one for the case d = 4 cmpresented in figure C.1. This is because the forward power is larger thanbefore in order to keep the coupled power level constant at P = 1MW. Atf0, P+,1 = 30.65MW and P−,1 = 30.40MW giving the expected net powerP1 = 250 kW at V1 = 74.4 kV. The frequency dependence of P+,1 is shownin figure C.6 while the net power on each port is presented in figure C.7.The phase of the forward power waves have the same behaviour as in theprevious case, as could be seen by comparing figure C.8 with figure C.4.
Figure C.5: ICA voltage amplitude vs frequency computed for 1MW cou-pled, dipole phasing, d = 12 cm.
203
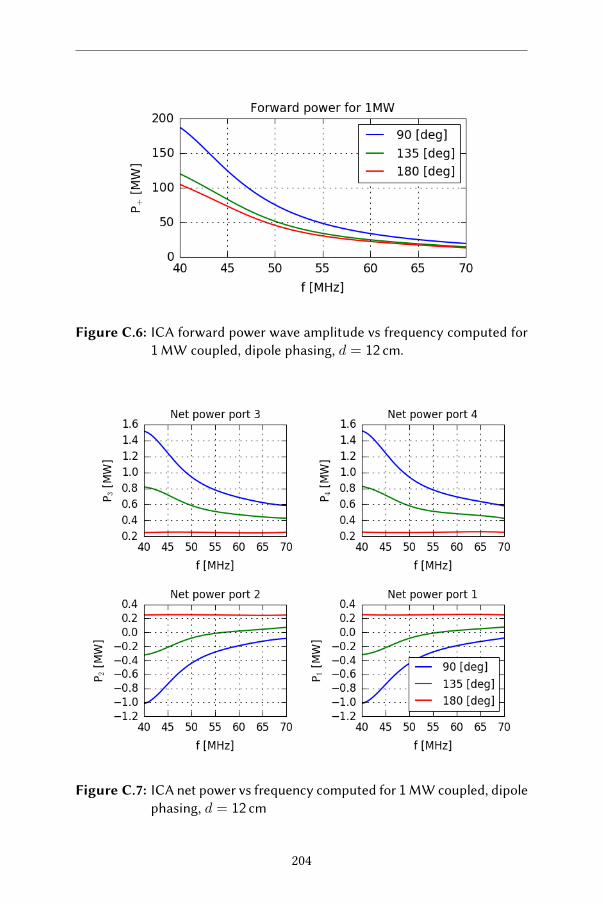
Figure C.6: ICA forward power wave amplitude vs frequency computed for1MW coupled, dipole phasing, d = 12 cm.
Figure C.7: ICA net power vs frequency computed for 1MW coupled, dipolephasing, d = 12 cm
204
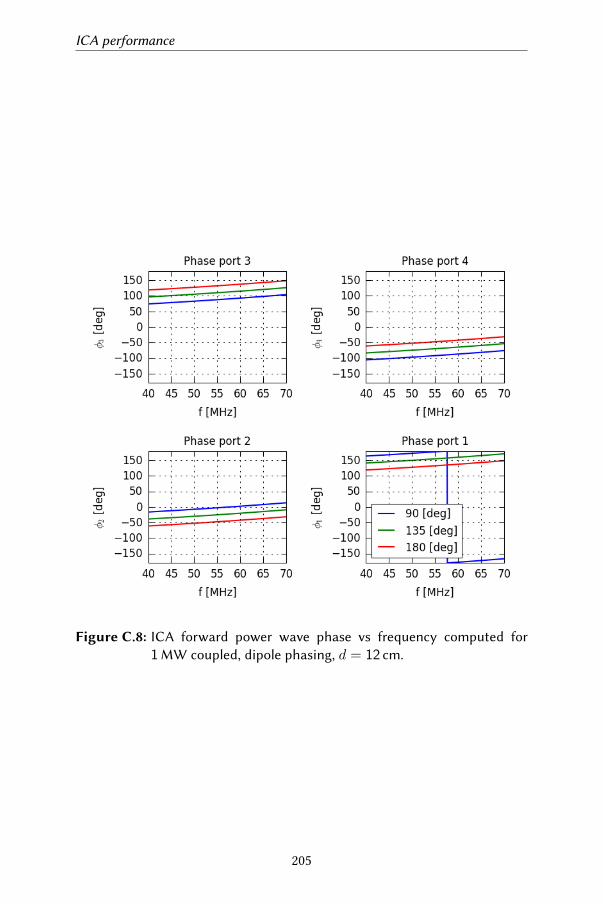
ICA performance
Figure C.8: ICA forward power wave phase vs frequency computed for1MW coupled, dipole phasing, d = 12 cm.
205


Bibliography
[1] International Energy Agency. URL www.iea.org/weo2017/.
[2] F. Chen. An Indispensable Truth: How Fusion Power Can Save the Planet.Springer New York, 2011. ISBN 9781441978202.
[3] J. Ongena and G. Van Oost. Energy for Future Centuries: Will FusionBe an Inexhaustible, Safe, and Clean Energy Source? Fusion Science andTechnology, 45(2T):3–14, mar 2004. ISSN 1536-1055. doi:10.13182/FST04-A464.
[4] European Physical Society. URL www.eps.org/page/policy_energy_env.
[5] ITER Organization. URL www.iter.org.
[6] Sir Crookes, William. On radiant maer a lecture delivered to the BritishAssociation for the Advancement of Science, at Sheield, Friday, August22, 1879. URL hps://www.biodiversitylibrary.org/item/77297.
[7] R.J. Goldston and P.H. Rutherford. Introduction to Plasma Physics. CRCPress, 1995. ISBN 9781439822074.
[8] Irving Langmuir. Oscillations in ionized gases. Proceedings of theNational Academy of Sciences, 14(8):627–637, 1928. ISSN 0027-8424.doi:10.1073/pnas.14.8.627.
[9] NewScientists, 2009. URL www.newscientist.com/article/dn17952-iter-a-brief-history-of-fusion/.
[10] Wikipedia contributors. Fusion power — Wikipedia, the free encyclo-pedia, 2018. URL hps://en.wikipedia.org/w/index.php?title=Fusion_power&oldid=855912472. [Online; accessed 19-August-2018].
[11] Englen A. Azizov. Tokamaks: from A D Sakharov to the present (the 60-year history of tokamaks). Uspekhi Fizicheskih Nauk, 182(2):202, 2012.ISSN 0042-1294. doi:10.3367/UFNr.0182.201202j.0202.
207
BIBLIOGRAPHY
[12] K. Miyamoto. Plasma Physics and Controlled Nuclear Fusion. Atomic,Optical, and Plasma Physics. Springer, 2005. ISBN 9783540242178.
[13] J. Wesson and D.J. Campbell. Tokamaks. International Series of Monogr.OUP Oxford, 2011. ISBN 9780199592234.
[14] J.P. Freidberg. Plasma Physics and Fusion Energy. Cambridge UniversityPress, 2008. ISBN 9781139462150.
[15] R Koch. Wave–particle interactions in plasmas. Plasma Physics andControlled Fusion, 48(12B):B329, 2006.
[16] T.H. Stix. Waves in Plasmas. American Institute of Physics, 1992. ISBN9780883188583.
[17] D.G. Swanson. Plasma Waves, 2nd Edition. Series in Plasma Physics.Taylor & Francis, 2003. ISBN 9780750309271.
[18] F W Perkins. Heating tokamaks via the ion-cyclotron and ion-ion hybridresonances. Nuclear Fusion, 17(6):1197–1224, 1977. ISSN 17414326.doi:10.1088/0029-5515/17/6/008.
[19] J. Ongena, A. Messiaen, Y. Kazako, et al. Recent advances in physicsand technology of Ion Cyclotron Resonance Heating in view of futurefusion reactors. IAEA conference proceedings, 2016. ISSN 0741-3335.doi:10.1088/1361-6587/aa5a62.
[20] Yevgen O Kazakov. Progress in theoretical models of the ICRF modeconversion. Nukleonika, 57(January):31–35, 2012.
[21] R. Koch, P. Dumortier, F. Durodié, et al. Ion cyclotron resonanceheating on TEXTOR. Fusion Science and Technology, 47:97, 2005.doi:10.13182/FST05-A691.
[22] D Van Eester, E Lerche, T J Johnson, et al. Minority and mode conversionheating in ( <sup>3</sup> He)–H JET plasmas. Plasma Physics andControlled Fusion, 54(7):074009, 2012. ISSN 0741-3335. doi:10.1088/0741-3335/54/7/074009.
[23] R. Koch and D. Van Eester. FAST PARTICLE HEATING. volume 298of Schrien des Forschungszentrums Jülich Reihe Energie & Umwelt /Energy & Environment, pages 355–365, Jülich, Aug 2015. 12th CarolusMagnus Summer School on Plasma and Fusion Energy Physics, Leuven(Belgium), 24 Aug 2015 - 4 Sep 2015, Forschungszentrum Jülich GmbHZentralbibliothek, Verlag. URL hps://juser.fz-juelich.de/record/283662.
208
BIBLIOGRAPHY
[24] Y. Kazakov, D. Van Eester, and J. Ongena. PLASMA HEATING INPRESENT-DAY AND FUTURE FUSION MACHINES. volume 298 ofSchrien des Forschungszentrums Jülich Reihe Energie & Umwelt / Energy& Environment, pages 290–297, Jülich, Aug 2015. 12th Carolus MagnusSummer School on Plasma and Fusion Energy Physics, Leuven (Bel-gium), 24 Aug 2015 - 4 Sep 2015, Forschungszentrum Jülich GmbHZentralbibliothek, Verlag. URL hps://juser.fz-juelich.de/record/283655.
[25] F. Durodié, Ph Chappuis, J Fanthome, et al. Main design features andchallenges of the ITER-like ICRF antenna for JET. Fusion Engineering andDesign, 74(2005):223–228, 2008. doi:10.1016/j.fusengdes.2005.08.019.
[26] K. Vulliez, Z. Chen, F. Ferlay, et al. The mechanical structureof the WEST Ion Cyclotron Resonant Heating launchers. Fu-sion Engineering and Design, 96-97:611–615, 2015. ISSN 09203796.doi:10.1016/j.fusengdes.2015.06.050.
[27] Giuseppe Bosia. High power density Ion Cyclotron Antennas for NextStep Device ( Applications ). Fusion Science and Technology, 43(2):153–160, 2003. ISSN 1536-1055. doi:10.13182/FST03-A256.
[28] F. Durodié, P. Dumortier, M. Vrancken, et al. Design, performance,and grounding aspects of the international thermonuclear experimentalreactor ion cyclotron range of frequencies antenna. Physics of Plasmas,21(6):061512, 2014. doi:10.1063/1.4884379.
[29] T. Mutoh, R. Kumazawa, T. Seki, et al. Development of steady-stateICRF heating for LHD. Fusion Engineering and Design, 26(1-4):387–394,jan 1995. ISSN 09203796. doi:10.1016/0920-3796(94)00205-L.
[30] H. Kasahara, T. Seki, K. Saito, et al. Development of steady-state opera-tion using ion cyclotron heating in the Large Helical Device. Physics ofPlasmas, 21(6):2–8, 2014. ISSN 10897674. doi:10.1063/1.4884363.
[31] Y. T. Song, C. H. Wang, Q. Yang, et al. Design and modification ofEAST new-type ICRF antenna. Proceedings - Symposium on FusionEngineering, pages 1–5, 2011. doi:10.1109/SOFE.2011.6052331.
[32] F. W. Baity, D. B. Batchelor, K. C. Bills, et al. Design of long pulse fastwave current drive antennas for diiid. AIP Conference Proceedings, 289(1):343–346, 1994. doi:10.1063/1.44956.
[33] F.W. Baity, R. H. Goulding, D. J. Homan, et al. The technology of fastwave current drive antennas. Fusion Engineering and Design, 24(1994):91–102, 2009. doi:doi.org/10.1016/0920-3796(94)90040-X.
209
BIBLIOGRAPHY
[34] R.H. Goulding, D.J. Homan, D.L. Conner, et al. The ORNLfast-wave ICRF antenna for Alcator C-MOD. In IEEE Thir-teenth Symposium on Fusion Engineering, pages 215–220. IEEE, 2009.doi:10.1109/FUSION.1989.102211.
[35] Y. Takase, S. Golovato, M Porkolab, et al. Alcator C-MOD ICRF antennadesign and analysis. In IEEE Thirteenth Symposium on Fusion Engineer-ing, pages 211–214. IEEE, 1989. doi:10.1109/FUSION.1989.102210.
[36] J. R. Wilson, J. Bialek, P. Bonanos, et al. Tr icrf antenna design. AIPConference Proceedings, 159(1):294–297, 1987. doi:10.1063/1.36697.
[37] T.J. Wade, Jean Jacquinot, G Bosia, A. Sibley, and M Schmid. High power(22 MW) ICRH at JET and developments for next step devices. In [Pro-ceedings] The 14th IEEE/NPSS Symposium Fusion Engineering, pages 902–907. IEEE, 1991. ISBN 0-7803-0132-3. doi:10.1109/FUSION.1991.218703.
[38] A. Kaye, T. Brown, V. Bhatnagar, et al. Present and future JET ICRFantennae. Fusion Engineering and Design, 24(1-2):1–21, 1994. ISSN09203796. doi:10.1016/0920-3796(94)90034-5.
[39] J.-M. Noterdaeme, F. Wesner, M. Brambilla, et al. The ASDEX upgradeICRH antenna. Fusion Engineering and Design, 24(1-2):65–74, feb 1994.ISSN 09203796. doi:10.1016/0920-3796(94)90037-X.
[40] M. L. Garre and S. J. Wukitch. Mitigation of radio frequencysheaths through magnetic field-aligned ICRF antenna design. Fu-sion Engineering and Design, 87(9):1570–1575, 2012. ISSN 09203796.doi:10.1016/j.fusengdes.2012.04.011.
[41] a. Messiaen, R. Koch, R.R. Weynants, et al. Performance of the ITERICRH system as expected from TOPICA and ANTITER II modelling.Nuclear Fusion, 50(2):025026, 2010. ISSN 0029-5515. doi:10.1088/0029-5515/50/2/025026.
[42] A. Messiaen and R Weynants. ICRH antenna coupling physics andoptimum plasma edge density profile. Application to ITER. PlasmaPhysics and Controlled Fusion, 53:085020, 2011. ISSN 0741-3335.doi:10.1088/0741-3335/53/8/085020.
[43] A B Murphy. Waves in the edge plasma during ion cyclotron res-onance heating. Fusion Engineering and Design, 12(1-2):79–92, 1990.doi:10.1016/0920-3796(90)90067-G.
[44] J. WILLARD GIBBS. Fourier's series. Nature, 59:200 EP –, Dec 1898.URL hps://doi.org/10.1038/059200b0.
210
BIBLIOGRAPHY
[45] I Monakhov, M Graham, T Blackman, et al. Design and operations of aload-tolerant external conjugate-T matching system for the A2 ICRHantennas at JET. Nucl. Fusion, 53(8):083013, 2013. doi:10.1088/0029-5515/53/8/083013.
[46] C P Moeller, R W Gould, D A Phelps, and R I Pinsker. Comb lineAntennas for Launching Traveling Fast Waves. In Proceedings of theIAEA technical commiee meeting on RF launchers for plasma heatingand current drive, Naka, JP, 1994. URL hps://inis.iaea.org/collection/NCLCollectionStore/_Public/27/003/27003788.pdf.
[47] H Ikezi and D A Phelps. Traveling-Wave Antenna for Fast-Wave Heatingand Current Drive in Tokamaks. Fusion Technology, 31(1):106–117, jan1997. ISSN 0748-1896. doi:10.13182/FST97-A30782.
[48] T. Ogawa, K. Hoshino, S. Kanazawa, et al. Radiofrequency experimentsin JFT-2M: Demonstration of innovative applications of a travellingwave antenna. Nuclear Fusion, 41(12):1767–1775, 2001. ISSN 00295515.doi:10.1088/0029-5515/41/12/304.
[49] R Prater, C.P. Moeller, R.I. Pinsker, et al. Application of very highharmonic fast waves for o-axis current drive in the DIII-D and FNSF-AT tokamaks. Nuclear Fusion, 54(8):083024, aug 2014. ISSN 0029-5515.doi:10.1088/0029-5515/54/8/083024.
[50] S. J. Wang, J. Kim, J. H. Jeong, et al. Recent experimental results ofKSTAR RF heating and current drive. volume 030014, page 030014, 2015.ISBN 9780735413368. doi:10.1063/1.4936479.
[51] S.J. Wang, H.H. Wi, H.J. Kim, et al. Helicon wave coupling in KSTARplasmas for o-axis current drive in high electron pressure plasmas. Nu-clear Fusion, 57(4):046010, apr 2017. ISSN 0029-5515. doi:10.1088/1741-4326/aa5b42.
[52] R. Ragona and A. Messiaen. Conceptual study of an ICRH traveling-wave antenna system for low-coupling conditions as expected inDEMO. Nuclear Fusion, 56(7):076009, jul 2016. ISSN 0029-5515.doi:10.1088/0029-5515/56/7/076009.
[53] Andre Messiaen and Riccardo Ragona. Modeling of the Traveling WaveAntenna in view of the ICRF heating of DEMO. EPJ Web of Conferences,157:03033, 2017. ISSN 2100-014X. doi:10.1051/epjconf/201715703033.
[54] Riccardo Ragona and André Messiaen. Study of a distributed ICRFantenna system in DEMO. EPJ Web of Conferences, 157:03044, 2017.ISSN 2100-014X. doi:10.1051/epjconf/201715703044.
211
BIBLIOGRAPHY
[55] C.G. Montgomery, R.H. Dicke, E.M. Purcell, and Massachuses In-stitute of Technology. Radiation Laboratory. Principles of MicrowaveCircuits. Mass. inst. of technology,: Radiation laboratory. Dover Publi-cations, 1948.
[56] D.M. Pozar. Microwave Engineering. Wiley, 2004. ISBN 9780471448785.
[57] F. Durodié, P. Dumortier, T. Blackman, et al. ITER-like antennafor JET first results of the advanced matching control algorithms.Fusion Engineering and Design, 123:253–258, 2016. ISSN 09203796.doi:10.1016/j.fusengdes.2017.05.113.
[58] Rohde & Schwarz GmbH. URL www.rohde-schwarz.com.
[59] Innovative Power Products. URL innovativepp.com.
[60] P Dumortier, F Louche, A Messiaen, P Tamain, and M Vervier. RFoptimization of the ITER ICRF antenna plug including its broad bandingby a service stub. Fusion Engineering and Design, 84:707–711, 2009.doi:10.1016/j.fusengdes.2008.11.101.
[61] M. Vervier, A. Messiaen, and P. Dumortier. Technical optimiza-tion of the ITER ICRH decoupling and matching system. FusionEngineering and Design, 88(6-8):1030–1033, 2013. ISSN 09203796.doi:10.1016/j.fusengdes.2013.01.025.
[62] A Messiaen, P Dumortier, V Kyrytsya, F Louche, and M Vervier. Simu-lation of ICRF antenna plasma loading by a dielectric dummy load. Ap-plication to the ITER case. In Fusion Engineering and Design, volume 86,pages 855–859. Elsevier B.V., 2011. doi:10.1016/j.fusengdes.2011.01.035.
[63] Y. Takase, C. P. Moeller, T. Seki, et al. Development of a fishbonetravelling wave antenna for LHD. Nuclear Fusion, 44(2):296–302, 2004.ISSN 00295515. doi:10.1088/0029-5515/44/2/011.
[64] ANSYS inc. URL www.ansys.com.
[65] Julien Hillairet, Patrick Mollard, Yanping Zhao, et al. Ion cyclotronresonance heating systems upgrade toward high power and CW opera-tions in WEST. AIP Conference Proceedings, 1689, 2015. ISSN 15517616.doi:10.1063/1.4936512.
[66] K. Vulliez, A. Argouarch, G. Bosia, et al. Validation of the load-resilient ion cyclotron resonance frequency antenna concept on ToreSupra plasmas. Nuclear Fusion, 48(6):065007, jun 2008. ISSN 0029-5515.doi:10.1088/0029-5515/48/6/065007.
212
BIBLIOGRAPHY
[67] A. Argouarch, K. Vulliez, P. Mollard, et al. ICRH ITER-like antennatested on TS commissioning, electrical modeling and load resiliencestudies. Fusion Engineering and Design, 84(2-6):275–278, 2009. ISSN09203796. doi:10.1016/j.fusengdes.2009.01.018.
[68] Walid Helou, Laurent Colas, Julien Hillairet, et al. Radio-frequency elec-trical design of the WEST long pulse and load-resilient ICRH launchers.Fusion Engineering and Design, 96-97:473–476, 2015. ISSN 09203796.doi:10.1016/j.fusengdes.2015.01.005.
[69] Gian Luca Ravera, Silvio Ceccuzzi, Francesco Mirizzi, Angelo A. Tuccillo,and Riccardo Maggiora. Analysis of the FAST ICRH antenna with saltedwater load using HFSS code. European Microwave Week 2012: "Space forMicrowaves", EuMW 2012, Conference Proceedings - 9th European RadarConference, EuRAD 2012, pages 496–499, 2012.
[70] D Milanesio and R Maggiora. Evaluation of the influence of the mainplasma density parameters on antenna coupling and radio frequencypotentials with TOPICA code. Plasma Physics and Controlled Fusion, 55:045010, 2013. doi:10.1088/0741-3335/55/4/045010.
[71] Ph.D. David Meeker. URL www.femm.info.
213
Related Documents