Image Anal Stereol 2018;37:249-275 doi: 105566/ias.1865 Original Article 249 NEW BACTERIA FORAGING AND PARTICLE SWARM HYBRID ALGORITHM FOR MEDICAL IMAGE COMPRESSION G. VIMALA KUMARI ,1 , G. SASIBHUSHANA RAO 2 , B. PRABHAKARA RAO 3 1 Department of Electronics and Communication Engineering, M.V.G.R.College of Engineering, Vizianagaram- 535005, India; 2 Andhra University College of Engineering, Visakhapatnam-530003, India; 3 Jawaharlal Nehru Technological University, Kakinada, Kakinada-533003, Andhra Pradesh, India e-mail: [email protected], [email protected], [email protected] (Received November 25, 2017; revised May 29; 2018; accepted September 9, 2018) ABSTRACT For perfect diagnosis of brain tumour, it is necessary to identify tumour affected regions in the brain in Magnetic Resonance Imaging (MRI) images effectively and compression of these images for transmission over a communication channel at high speed with better visual quality to the experts. An attempt has been made in this paper for identifying tumour regions with optimal thresholds which are optimized with the proposed Hybrid Bacteria Foraging Optimization Algorithm (BFOA) and Particle Swarm Optimization (PSO) named (HBFOA-PSO) by maximizing the Renyi’s entropy and Kapur’s entropy. BFOA may be trapped into local optimal problem and delay in execution time (convergence time) because of random chemotaxis steps in the procedure of algorithm and to get global solution, a theory of swarming is com- menced in the structure of HBFOA-PSO. Effectiveness of this HBFOA-PSO is evaluated on six different MRI images of brain with tumours and proved to be better in Peak Signal to Noise Ratio (PSNR), Mean Square Error (MSE) and Fitness Function. Keywords: Bacteria Foraging Optimization Algorithm (BFOA), Grey Wolf Optimization (GWO), Kapur’s entropy, Moth-flame Optimization (MFO) Algorithm, Particle Swarm Optimization (PSO), Renyi’s entropy. INTRODUCTION In this modern world human beings are very much busy with their personal and professional life and undisciplined food and sleeping timings and busy life style which are causing health disorders. Brain tumour is one such dangerous health disorder and it is due to growth of cells abnormally in the tissues of the brain and can directly destroy or damage brain cells by producing inflammation. Brain tumours are classified by their size and type of tissue involved. In the areas of human brain image analysis, recognition of tumour region and segmentation of tissue organization tend to be a demanding task. Computerized segmentation of Magnetic Resonance (MR) brain images would be of immense help to radiologists, as they reduce the difficulties developed due to human interface and offer quicker segmentation results. Computerized algorithms offer negligible time duration and slighter manual involvement to a radiologist during clinical diagnosis. In addition, huge volumes of patients’ information can be evaluated by computerization. For this purpose one algorithm called Hybrid Bacteria Foraging Optimization Algorithm and Particle Swarm Optimization (HBFOA– PSO) is proposed for effective and efficient image segmentation for identification of the brain tumour and segmented image is transmitted over a communication channel after successful compression and is received at the receiver section by a radiologist for diagnosis of brain tumour and for necessary action. This process is called telemedicine and its main objective is to provide clinical care from a distance. This benefits many rural areas and also at times of emergencies when doctor’s presence is essential. But further development of this technology is becoming slow due to the limited narrow transmission bandwidths. As the presence and development of such technologies are crucial, a lot of research is being carried out for further improvement in effective usage of such technology. So in this paper, an HBFOA–PSO based image thresholding by maximizing Renyi’s entropy and Kapur’s entropy is proposed for efficient and effective results of image thresholding in better image compression, which helps reduce the Bit rate for transmission as well as maintains an appreciable amount of quality or fidelity of the image. Image thresholding is a process of optimizing similar regions

Welcome message from author
This document is posted to help you gain knowledge. Please leave a comment to let me know what you think about it! Share it to your friends and learn new things together.
Transcript
Image Anal Stereol 2018;37:249-275 doi: 105566/ias.1865 Original Article
249
NEW BACTERIA FORAGING AND PARTICLE SWARM HYBRID ALGORITHM FOR MEDICAL IMAGE COMPRESSION
G. VIMALA KUMARI,1, G. SASIBHUSHANA RAO
2, B. PRABHAKARA RAO3
1Department of Electronics and Communication Engineering, M.V.G.R.College of Engineering, Vizianagaram-535005, India; 2Andhra University College of Engineering, Visakhapatnam-530003, India; 3Jawaharlal Nehru Technological University, Kakinada, Kakinada-533003, Andhra Pradesh, India e-mail: [email protected], [email protected], [email protected]
(Received November 25, 2017; revised May 29; 2018; accepted September 9, 2018)
ABSTRACT
For perfect diagnosis of brain tumour, it is necessary to identify tumour affected regions in the brain in Magnetic Resonance Imaging (MRI) images effectively and compression of these images for transmission over a communication channel at high speed with better visual quality to the experts. An attempt has been made in this paper for identifying tumour regions with optimal thresholds which are optimized with the proposed Hybrid Bacteria Foraging Optimization Algorithm (BFOA) and Particle Swarm Optimization (PSO) named (HBFOA-PSO) by maximizing the Renyi’s entropy and Kapur’s entropy. BFOA may be trapped into local optimal problem and delay in execution time (convergence time) because of random chemotaxis steps in the procedure of algorithm and to get global solution, a theory of swarming is com-menced in the structure of HBFOA-PSO. Effectiveness of this HBFOA-PSO is evaluated on six different MRI images of brain with tumours and proved to be better in Peak Signal to Noise Ratio (PSNR), Mean Square Error (MSE) and Fitness Function.
Keywords: Bacteria Foraging Optimization Algorithm (BFOA), Grey Wolf Optimization (GWO), Kapur’s entropy, Moth-flame Optimization (MFO) Algorithm, Particle Swarm Optimization (PSO), Renyi’s entropy.
INTRODUCTION
In this modern world human beings are very much busy with their personal and professional life and undisciplined food and sleeping timings and busy life style which are causing health disorders. Brain tumour is one such dangerous health disorder and it is due to growth of cells abnormally in the tissues of the brain and can directly destroy or damage brain cells by producing inflammation. Brain tumours are classified by their size and type of tissue involved. In the areas of human brain image analysis, recognition of tumour region and segmentation of tissue organization tend to be a demanding task. Computerized segmentation of Magnetic Resonance (MR) brain images would be of immense help to radiologists, as they reduce the difficulties developed due to human interface and offer quicker segmentation results. Computerized algorithms offer negligible time duration and slighter manual involvement to a radiologist during clinical diagnosis. In addition, huge volumes of patients’ information can be evaluated by computerization. For this purpose one algorithm called Hybrid Bacteria Foraging Optimization
Algorithm and Particle Swarm Optimization (HBFOA–PSO) is proposed for effective and efficient image segmentation for identification of the brain tumour and segmented image is transmitted over a communication channel after successful compression and is received at the receiver section by a radiologist for diagnosis of brain tumour and for necessary action. This process is called telemedicine and its main objective is to provide clinical care from a distance. This benefits many rural areas and also at times of emergencies when doctor’s presence is essential. But further development of this technology is becoming slow due to the limited narrow transmission bandwidths. As the presence and development of such technologies are crucial, a lot of research is being carried out for further improvement in effective usage of such technology. So in this paper, an HBFOA–PSO based image thresholding by maximizing Renyi’s entropy and Kapur’s entropy is proposed for efficient and effective results of image thresholding in better image compression, which helps reduce the Bit rate for transmission as well as maintains an appreciable amount of quality or fidelity of the image. Image thresholding is a process of optimizing similar regions

VIMALA KUMARI G ET AL: Hybrid Algorithm for Medical Image Compression
250
in an image which results in effective clustering of image, hence better image compression is achieved by running cascaded runlength coding and arithmetic coding on cluster image. Performance of the runlength coding and arithmetic coding depends upon the number of similar clusters and probability occurrence of same cluster centroids in an image respectively. So, its performance depends upon effective clustering technique.
MATERIAL AND METHODS
CONTRIBUTION
In this section a detailed description is given about the methods of MRI image tumour recognitions and methods to compress the identified regions at high bit rate with better reconstructed image quality. In first section, methods of MRI image segmentation are explained and in second section methods of image compression are explained.
RELATED WORK IN TUMOUR IDENTIFICATION
Stochastic threshold of MRI image for tumour identification is done by combining region based level sets globally and three established energies (uniform, separation, and histogram) in a local framework (Lubna et al., 2017). An automated brain tumour threshold model based on maximum a posteriori probabilistic (MAP) estimation and likelihood probability of the model is estimated by sparse coding and dictionary learning. The Markov random field (MRF) is introduced into the prior probability. The MAP is converted into a minimum energy optimization problem and graph cuts are used to find its solution (Yuhong et al., 2016). Irem et al., proposed a Principal Component Analysis (PCA) based K-means and fuzzy C-means (FCM) clustering for MRI image thresholding and results are compared with five PCA algorithms such as PCA, Probabilistic Principal Component Analysis (PPCA), Expectation Maximization Based PCA (EM-PCA), Generalize Hebbian Algorithm (GHA), and Adaptive Principal Component Extraction (APEX) and proved EM-PCA and PPCA results are effective with the two clustering algorithms (Irem et al., 2017). The brain tumours are identified and marked with a novel technique which is proposed by solmaz (Solmaz and Farshad, 2017). The 3D images are pre-processed with the help of cascaded histogram matching and bias field correction. After this the required areas are extracted from background. Local binary pattern and orientation gradients are used for learning. Potential Field Clustering (PFS) is one which is based on concept of potential field and evaluates the
performance of the different methods on the brain tumour MRI benchmark database (Ivan and Iker, 2017). Statistical fusion based image thresholding is proposed for identification of abnormalities in MRI images by seed selection, region growing and image fusion. The proposed technique is tested for performance analysis on different data base and different tumour effected images (Badri et al., 2016). Nooshin and Miroslav proposed automatic tumour thresholding in single-spectral MRI using a texture-based and contour-based algorithm (Nooshin and Miroslav, 2017).
Sudip et al., proposed a conditional spatial fuzzy C-means (csFCM) clustering algorithm for thresholding of MRI images by incorporating local and global spatial information into a weighted membership function and results are compared and proved better than K-means and FCM algorithms in terms of validity functions, threshold accuracy, tissue threshold accuracy, and receiver operating characteristic (ROC) curve (Sudip et al., 2015). Edge detection of X-ray images using Multiresolution Analysis (MRA) based biorthogonal wavelets is more preferable when compared with orthogonal wavelets because of more flexibility (GS Rao et al., 2016). Brain tumour is identified with efficient thresholding of MRI images by Bacteria Foraging Optimization (BFO) with modified fuzzy K-means algorithm (MFKM) and results are compared with Particle Swarm Optimization (PSO) based fuzzy C-means algorithm (PSO based FCM), MFKM and conventional FCM and proved better in terms of sensitivity, specificity, Jaccard Tanimoto Co-efficient index (TC) and Dice Overlap Index (DOI), computational time and memory requirement (Anitha et al., 2017). Computed Tomography (CT) images are classified by Support Vector Machine (SVM) with different kernel functions and Sequential Minimal Optimization (SMO) and segmented classification is further performed by the Modified Region Growing (MRG) with threshold optimization. These thresholds are optimized with Harmony Search (HS), Evolutionary Programming, (EP) and Grey Wolf Optimization (GWO). In terms of sensitivity, specificity, and accuracy GWO is better compared to others (Ramakrishnan and Sankaragomathi, 2017). MRI images are segmented with Teaching Learning Based Optimization (TLBO), entropy value, and level set/active contour and TLBO achieved better values in Jaccard index, dice co-efficient, precision, sensitivity, specificity, and accuracy (Rajinikanth et al., 2017). Crow Search Algorithm (CSA) based image thresholding by maximizing cross entropy for MRI image threshold and proved better with other techniques in terms of quality and consistency (Diego et al., 2017).
Image Anal Stereol 2018;37:249-275
251
Sathya and Kayalvizhi took Kapur’s and Otsu’s entropies as an objective functions and which are optimized with Bacterial Foraging Optimization Algorithm (BFOA) for effective and efficient image thresholding (Sathya and Kayalvizhi, 2011). Further, in order to improve the convergence speed and global searching ability of BFOA, they modify the swarming step and reproduction step, thereby improving the robustness of bacterial foraging (BF) and achieved fast convergence. Same authors employed few modifications to BF for threshold of brain magnetic resonance images by adaptively varying the step size of bacteria instead of fixed step size followed by ordinary bacterial foraging (Sathya and Kayalvizhi, 2011).
RELATED WORK IN IMAGE COMPRES-SION
Image compression is achieved by appropriate image thresholding and these thresholds are obtained with a principal of moment preserving and was proposed by Chen and Wen (1998) (Chen-Kuei and Wen-Hsiang, 2015). The proposed method achieved a high compression ratio with better reconstructed image quality. An image compression method which consumes less time and follows a strategy where thresholds are optimized with optimization techniques for which objective function is distortion (Kaur et al., 2007). Birge–Massart thresholding is inbuilt thresholding technique which is used for image compression and obtained results are compared with the uni-modal thresholding in terms of reconstructed image quality and compression ratio (Siraj, 2015). In (Tahere and Mohammad, 2009) Electrocardiography (ECG) signals are compressed by transforming the signal with the help of discrete wavelet transform. Another kind of image compression where image to be compressed is transformed to frequency domain with the help of bandlet and required bandlet coefficients are obtained with type II Fuzzy thresholding and results are compared with the ordinary thresholding (Rajeswari, 2012). Prashant and Ioana proposed a non-uniform thresholding and observed the effects of thresholding on reconstructed image quality (Prashant and Ioana, 2003). Tony and Zhou proposed a technique for noise removal and image compression in wavelet domain thresholding which is based on Partial Differential Equation (PDE) and it takes the advantage of variations in framework (Tony and Zhou, 2007). Image compression can also be performed with Multistage Lattice Vector Quantization (MLVQ) and by thresholding of Discrete Wavelet Transform (DWT) coefficients. Proposed combination tries to minimize the quantization error and its computational complexity is less compared to ordinary
VQ (Salleh and Soraghan, 2007). Kaveh et al., proposed a 2-D discrete wavelet transform based image thresholding by optimal thresholding the DWT coefficients with Particle Swarm Optimization (PSO) for image compression. They did three level decomposition of DWT and 62.5% of thresholds are assigned and optimized for the approximation coefficients and the remaining 37.5% equally assigned to horizontal, vertical, and diagonal coefficients (Kaveh et al., 2015). They compared the results with the Set Partition in Hierarchical Tree (SPHIT), Chrysafis, JPEG and JPEG-2000 and proved better in Peak Signal to Noise Ratio (PSNR) and Bits per Pixel (BPP).
In this paper, HBFOA-PSO based brain MRI image thresholding is proposed for image compression by optimizing the Renyi's entropy and Kapur’s entropy for the first time and obtained results are compared with other optimization techniques such as BFOA, PSO, Moth-flame Optimization (MFO) Algorithm and GWO. Compressed image is further coded with runlength coding followed by arithmetic coding. Objective function value, standard deviation, Structural Similarity Index Measure (SSIM), PSNR, Weighted Peak Signal to Noise Ratio (WPSNR) and computational complexity are considered for the performance evaluation of proposed HBFOA-PSO based image thresholding. In all parameters the proposed algorithm performance is better as compared to other BFOA, PSO, MFO and GWO.
PROBLEM FORMULATION OF OPTIMUM THRESHOLDING METHODS
Initially all the required thresholds are selected randomly and these thresholds are optimized with the help of optimization techniques. In this paper, the objective function to be maximized with the optimization techniques is entropy techniques. The entropy techniques which are used in this paper are Renyi's entropy and Kapur’s entropy. After successful optimization of thresholds, image is partitioned into object and background. Assume gray scale image which contains L gray levels with range between 0 to L-1(0, 1, 2, . . . , (L - 1)). Then probability occurrence of pixel Pi = h(i)/N (0 <i< (L - 1)), where h(i) is number of pixels corresponding to gray-level L and N is total number of pixels which is equal to ∑ ℎ 𝑖 .
CONCEPT OF RENYI'S ENTROPY
Renyi's entropy is proposed by Sahoo in 1997 and it uses two probability distribution functions (pdf) one for object and another for background for thresholding of a gray level image (image contains 0 to 255 levels)

VIMALA KUMARI G ET AL: Hybrid Algorithm for Medical Image Compression
252
(Prasanna et al., 1997). Let G is the gray levels of image and the range of these levels are {1,2, …G}. Let pi = p1, p2… pG is the probability distribution function (pdf) of corresponding gray levels. Among available pdfs some represents background (class A) and remaining represents object (class B). The probability distributions of the foreground and background classes are given in (Yudong and Lenan, 2011).
1 2, ,...... tA A A A
pp pp
p p p and
1 2, ,......t t GB B B B
p p pp
p p p (1)
Where1
tA
ii
p p
,
1
GB
ii t
p p
, and
1A Bp p
Renyi's entropy of a grayscale image with order α is given as
255
0
1ln ( )
1T kk
H p
(2)
Where parameter α is a real positive constant. Form above equation when α→1, Renyi's entropy
TH becomes Shannon entropy HT i.e1
lim T TH H
The Renyi's entropy for background and object is given in Eq. (3) and Eq. (4) respectively
0
1( ) ln ( )
1A
tiAp
i
pH t
p
(3)
255
1
1( ) ln ( )
1B
iBp
i t
pH t
p
(4)
Let ( )ApH t + ( )Bp
H t is maximum at t*(α) then
*( ) max{ ( ) ( )}A Bp pt Gt Arg H t H t
(5)
From Eq. 5 it is observed that t*(α) depends upon α. From computer simulations
*1
* *2*3
0 1
( ) 1
1
t if
t t if
t if
(6)
Where *1t , *
2t and *3t are different gray values.
When α move towards 1, then the optimal threshold *2t obtained with Renyi's entropy is equal to threshold
obtained with the maximum entropy sum method and
when α > 1, optimal threshold *3t with Renyi's entropy
is equal to threshold with the entropic correlation method. The optimal threshold value of the Renyi's entropy is calculated by the following formula with
*1t ,
*2t , and *
3t .
*[1] [1] 1 [2] 2 [3] [3] 3
1 1 1[ ( ) ] [1 ( ) ]
4 4 4ct t p t w t w t p t w
(7)
Where t[1], t[2] and t[3] are order statistics of the
gray values *1 ,t *
2t and *3t ,
[3] [1]1
( ) , ( ) ( )t
ii
p t p w p t p t
, and
[1] [2] [2] [3]
[1] [2] [2] [3]
1 2 3
[1] [2] [2] [3]
[1] [2] [2] [3]
(1,2,1) 5 5,
(1,2,1) 5 5,( , , )
(0,1,3) 5 5,
(3,1,0) 5 5.
if t t and t t
if t t and t t
if t t and t t
if t t and t t
(8)
The optimal threshold value *ct can be viewed as
an image dependent weighted average of *1t , *
2t and *3t and thus * * * * * * *
1 2 3 1 2 3min{ , , } max{ , , }ct t t t t t t that
is, *[1] [3]ct t t . This shows that the maximum
entropy sum method or the entropic correlation method does not succeed in providing a good threshold value for a gray scale image but the Renyi's entropy provides a better threshold value.
CONCEPT OF KAPUR’S ENTROPY
Kapur developed an algorithm for bi-level thresh-olding which is as follows: The objective function is
J(t) = H0 + H1 (9)
Where1
00 0 0
lnt
i i
i
p pH
w w
, 1
00
t
ii
w p
1
11 1
lnL
i i
i t
p pH
w w
, 1
1
L
ii t
w p
When objective function Eq. (9) is maximum then thresholds are optimal threshold. For multi-level thresholding Eq. (9) becomes
J(t0, t1,……. tm) = H0 + H1 + H2 + …… + Hm (10)
Where m is number of thresholds to be optimized and

Image Anal Stereol 2018;37:249-275
253
1 1
00 0 0
lnt
i i
i
p pH
w w
, 1 1
00
t
ii
w p
2
1
1
11 1
lnt
i i
i t
p pH
w w
, 2
1
1
1
t
ii t
w p
3
2
1
22 2
lnt
i i
i t
p pH
w w
, 3
2
1
2
t
ii t
w p
1
lnm
Li i
mi t m m
p pH
w w
, 1
m
L
m ii t
w p
Image compression with the Renyi’s entropy and Kapur entropy with two level thresholding proved efficient, but when threshold levels are increasing (multilevel thresholding) Renyi’s entropy and Kapur’s entropy takes much time for simulation and time increases exponential with levels. To improve the performance of Renyi’s entropy and Kapur’s entropy and to reduce the simulation time, few applications of soft computing techniques such as BFOA, PSO, MFO, and GWO for image thresholding are proposed, hence effective image compression. These techniques are to maximize the Renyi’s entropy and Kapur entropy as given in Eq. (5) and Eq. (9).
PROPOSED HBFOA-PSO
The main objective of this paper is to get optimal thresholds which leads to a better reconstructed image quality at high compression ratio. The optimal thresholds are obtained by cascaded combination of bacterial foraging optimization algorithm and particle swam optimization. The bacterial foraging optimization algorithm is global search algorithm but it may be trapped into local optimal problem and delay in execution time (convergence time) because of random chemotaxis steps in the procedure of algorithm and to get global solution, a theory of swarming is commenced in the structure of HBFOA-PSO. In order to find the advantage of proposed HBFOA-PSO approach, the results are compared with individual BFOA and PSO approaches. Each of algorithms is explained below.
OVERVIEW OF BACTERIA FORAGING OPTIMIZATION ALGORITHM
In 2002, a new optimization technique is proposed by Passino which is based on the foraging behavior of bacteria called Bacteria Foraging Optimization Technique (BFOA) (Passino, 2002). E.Coli bacteria always searches for nutrients to enhance the energy levels per unit time. Some of the bacteria search for nutrients by communicating with each other. In general, bacteria search for nutrients with the help of tumbling or
swarming and chemotaxis step. The BFOA performance is better than other optimization techniques because of its advanced algorithm structure. In BFOA step of walk follows a Gaussian distribution function in searching food instead of Levy flight which is used in cuckoo search algorithm.
In this paper the objective function which is optimized with BFOA is entropy (Renyi's or Kapur’s entropy). The bacteria moves in such a way that in each iteration the objective function is maximum. Because of this, each bacterium carries different objective function value in each iteration. Among all the objective function values of bacteria, the highest value is carried to next iteration. The remaining bacteria always try to move towards the highest objective function value bacteria and attain further highest values after successful final iteration. In this way all the bacteria attain global optimal solution. The BFOA attain this optimal solution with four cascaded steps: 1. Chemotaxis, 2. Swarming, 3. Reproduction and 4. Elimination-dispersal. The four steps in BFOA are explained below.
1. Chemotaxis: Chemotaxis step is a crucial step in BFOA while searching for food and it illustrates intelligence applied by the bacteria while searching for food. The bacteria try to move towards the better solution by taking either thumbling or swimming. In BFOA, each bacteria move to its better position by taking 8-neighbourhood positions derivative. After derivative, it finds which bacteria has maximum objective function and remaining bacteria follow the maximum objective function bacteria. The steps of Chemotaxis are as follow:
Tumbling: In this step bacteria moves randomly in a particular direction where high nutrients are available in the search space. Initially all the bacteria are having natural nutrients. This process is known as tumbling and is shown in Fig. 1.
Fig. 1. Tumbling of bacterium
Swimming up: After successful and sufficient nutrient from tumbling, the bacteria move in the same direction if nutrients are further increasing or else it take
Counter clockwise rotation
TUMBLE

VIMALA KUMARI G ET AL: Hybrid Algorithm for Medical Image Compression
254
swimming step. This swimming movement is called swimming up.
Swimming down: If the direction of movement decrease the bacteria nutrients then movement is called swimming down. When bacteria experience swimming down then immediately it changes its direction. This process is shown in Fig. 2.
Fig. 2. Bacterial swim
The chemotactic step of bacteria is mentioned in Eq. (11).
θ j 1, k, l θ j, k, l C i .∆ ∆
(11)
Where C (i) is step size and Δ (i) is the random number lying between [0,1].
2. Swarming: The collection of bacteria which are at higher nutrients will send information through signal to other bacteria. So rest of the bacteria will try to move towards the higher nutrients direction and avoids the direction of movement towards the lower nutrients. This step of process is called swarming and is described in below equation.
𝐽 𝜃, 𝑃 𝑗, 𝑘, 𝑙 ∑ 𝐽 𝜃, 𝜃 𝑃 𝑗, 𝑘, 𝑙
∑ 𝑑 exp 𝑊 ∑ 𝜃 𝜃
∑ ℎ exp 𝑊 ∑ 𝜃 𝜃 (12)
3. Reproduction: All the bacteria fitness values are shortlisted ascending or descending based on maximization problem or minimization problem respectively. In this paper, the objective function is to be maximized so, all the bacteria are arranged in ascending order based on their fitness values or objective function value. In this step the bacteria with lowest nutrients would die. In general, around half of bacteria die in this step and new bacteria is generated by asexual between two highest nutrients bacteria. Indirectly in this step among the available bacteria, half
of bacteria die and these are replaced with newly generated bacteria to always maintain constant bacteria in search space. The process of new bacteria generation is called conjugation.
4. Elimination-dispersal: In some cases bacteria may experience a sudden change in environmental conditions like hike in temperature or in humidity. Then bacteria undergoes third step i.e. reproduction where bacteria may die because of sudden changes and new bacteria are generated by a sexual relation between two bacteria. Some bacteria may move to the nearest safest place.
BFOA algorithm:
For l = 1:Ned
For k = 1:Nre
For j = 1:Nc
For i = 1:S
J(i, j, k, l) = J(i, j, k, l)+Jcc[𝜃 𝑗, 𝑘, 𝑙 , 𝑃 𝑗, 𝑘, 𝑙
∆ 𝑖 , 𝑚 1,2, … … … , 𝑝
𝜃 𝑗 1, 𝑘, 𝑙 𝜃 𝑗, 𝑘, 𝑙 𝐶 𝑖 .𝛥 𝑖
∆ 𝑖 ∆ 𝑖
Calculate J (i, j+1, k, l)
m = 0
While m<Ns
m = m+1
If J (i, j, k, l) >𝐽
Update 𝐽
𝜃 𝑗 1, 𝑘, 𝑙 𝜃 𝑗, 𝑘, 𝑙 𝐶 𝑖 .𝛥 𝑖
∆ 𝑖 ∆ 𝑖
else m = Ns
End if
End while
End i-for
End j-for
End k-for
For i =1:S
𝐽 =∑ 𝐽 𝑖, 𝑗, 𝑘, 𝑙
End i-for
End k –for
For i = 1:S
SWIM
Clockwise rotation

Image Anal Stereol 2018;37:249-275
255
If rand () < Ped
Eliminate bacterium and initialize randomly its replacement
End if
End i-for
End l-for
End BFOA
OVERVIEW OF PARTICLE SWARM OPTIMIZATION
PSO is proposed by Kennedy and Eberhart in the year 1995 and it is a stochastic approach under swarm intelligence that mimics how the particles are flying to get the best food location (Kennedy and Eberhart, 1995). Each individual particle adaptively updates their velocity and position within the search depends on the previous experience of its own search and the experiences of other particles in the population. Each particle is assigned with a memory by which it can store the best food location it ever visited during its journey. Its best food location is named as Pbest and the best food location of the group taken as one is stored as Gbest. The initial positions for Pbest and Gbest are different. It is proved to give the best results in obtaining the global minima or maxima. However, obtaining the global minima about the optimum value is a challenging issue, whenever multiple minima exist. This algorithm does not involve cross-over or mutation operators. It only depends on the initialization of the control parameters, the size of the swarm, the objective function and the maximum number of iteration. It does not depend on the initial conditions and the gradient values.
The advantages of using PSO are computationally less expensive, much simple to implement, Less CPU time and memory requirement. The modified velocity of each particle is given by
𝑣 𝑡 1 𝑣 𝑡 𝑐 𝑟 𝑃𝑏𝑒𝑠𝑡 𝑥 𝑡𝑐 𝑟 𝐺𝑏𝑒𝑠𝑡 𝑥 𝑡 (13)
The modified position of each particle is given by
𝑥 𝑡 1 𝑥 𝑡 𝑣 𝑡 1 (14)
PSO Algorithm:
Step 1: Initialization of each individual particle in the population with random position and random velocity.
Step 2: Calculate the objective function of each particle with Eq. (5) and Eq. (9). If the current cost is higher than the best value so far calculated, then it is stored in Pbest.
Step 3: Choose the particle with the highest objective function value of all particles. The position of this particle is Gbest.
Step 4: Calculate the new velocity and position of each particle according to the Eq. (13) and Eq. (14).
Step 5: Repeat the above steps from 2-4 until maximum iterations or maximum criteria is not attained.
HBFOA–PSO ALGORITHM
The HBFOA–PSO algorithm combines BFOA and PSO algorithms, so it takes the advantages and disadvantages of both techniques. The aim is to share information between PSO and BFOA that leads to generation of healthy bacteria by dispersal and elimination. The major drawback with the BFOA is, step of tumbling is random so achieving a global solution is difficult. Where as in the proposed hybrid BFOA-PSO, the step of tumbling is not random and these tumbling steps are optimized with the PSO. The global best solution or better suitable tumbling step from the PSO is given as input to BFOA. Tumbling step is updated when BFOA is in first step. The parameters required for hybrid BFOA-PSO are given below.
Step 1: Initialization of parameters for both BFOA and PSO:
p = Dimensions of the problem;
S = population size or number of particle in case of PSO and number of bacteria in case of BFOA;
Ns = swimming length after tumbling operation when bacteria is in chemotaxis loop;
Nc = stopping criteria or maximum iterations of the algorithm;
Nre = Maximum number of reproduction steps;
Ned = Maximum number of steps in elimination and dispersal loop;
Ped = the probability of elimination and dispersal;
C(i) =step of walk in tumbling stage and is random in BFOA algorithm;
𝑑 , 𝑤 , ℎ , 𝑤 = Bacteria attractive and repellent coefficients;
Δ (p, i) = Bacteria direction in current iteration;
P (i, j) = Bacteria position in current iteration;
𝑐 , acceleration
r1, r2 = Ran
PSO;
Step 2: Elim
Step 3: Repr
Step 4: Chem
Substep a: Fstep which i
Calculate all
Then new fit
J(i, j, k, l) =
Assign J_las
Substeptake either tugenerated nuthe bacteria onwards tumwith PSO. B
𝜃 𝑗 1, 𝑘,
Where j, kreproduction
Which leadsin tumbling
Calculate J (Jcc[𝜃 𝑗, 𝑘, 𝑙
Swimming s
i. Assume m
ii. While m
Let m=
If J(i, j+
and 𝜃 𝑗
Use this
𝜃 (j +
iii. Else, lestatement fo
Substepgo to substep
Step 5: Evbacterium an
𝑐 = PSO coefficient r
ndom number
mination and d
roduction loo
motaxis loop:
For i = 1, 2, s as follows
l bacteria obj
tness function
= J(i, j, k, l) +
st = J (i, j, k, l
p b: For i = 1umbling or swumber betweeor for all pop
mbling positiBacteria move
𝑙 𝜃 𝑗, 𝑘,
k and l aren & Eliminati
s ith bacteria wstage
(i, j, k, l) = J(𝑙 , 𝑃 𝑗, 𝑘, 𝑙
stage
m = 0 (counte
< Ns
m + 1
+1, k, l) >𝐽
𝑗 1, 𝑘, 𝑙
s new
1, k, l) to com
et m = Ns. or swim.
p c: Go to nexp b to proces
valuate the nd global bes
VIMA
cognitive coespectively;
s between 0 t
dispersal loop
op: k = k + 1.
: j = j + 1.
. . . , S, ith b
ective value,
n
Jcc (𝜃 𝑗, 𝑘, 𝑙
l).
1, 2, . . . , S bwimming Δ(ien 0 to 1 in fpulations. Froon and direces towards be
𝑙 𝐶 𝑖 .∆
e index of ion and dispe
will move w
i, j, k, l)+
er for swim le
, let 𝐽 = | J
𝜃 𝑗, 𝑘, 𝑙
mpute new J (
This is the
xt bacterium (s the next bac
local best pst position.
ALA KUMARI
onstant and
to 1 in case of
p: l = l + 1.
bacteria move
J(i, j, k, l);
, 𝑃 𝑗, 𝑘, 𝑙 );
bacteria decidi), that is randfirst iteration om second itection are optietter direction
∆
Chemotaxis ersal respectiv
ith a step siz
ength).
J(i, j+1, k, l)|
𝐶 𝑖 .∆ ∆
(i, j + 1, k, l).
end of the
(i + 1) if i Scterium)
position for
G ET AL: Hyb
256
social
f
e with
;
ded to domly for all
eration imized n with
step, vely.
ze C(i)
.
while
S (i.e.,
each
Stus
Stun
St
2. ∑
nuwchva
𝑗bepl
St
Stwba
FiCoPN
sizA“Mreareqth1.teAdiag
brid Algorithm
tep 6: Updatsing PSO. Up
tep 7: If j < Nntil life of the
tep 8: Reprod
Substep a: . . S, find
∑ 𝑗 𝑖, 𝑗, 𝑘,
utrients it goas at avoidin
hemotactic paalue (Lower 𝑗
Substep b values are
est 𝑗 value laced at the sa
tep 9: If k < N
tep 10: Elimiith probabilacterium.
ig. 3: Test oronary T1 ANET f) Menin
RESUL
For evaluaze 256x256;strocytoma”,
Meningioma’esolution are re captured quipment, in hickness 1mm5 Tesla machnology usvanto-Tim teiagnosis of brge 3, 32, 35
m for Medical I
e the velocitpdate the vect
Nc, go to stepe bacteria is o
duction:
For the gived health of
𝑙 . 𝑗 give
t over its lifng noxious suarameters C 𝑗 value me
: The Sr = Sremoved ansplit. New
ame location
Nre, go to step
ination and dity 𝑃 , eli
images (clocAstrocytoma ngioma
LTS
ation of expenamely “A“Glioma”,
’ with a 8taken as sho
from Siewhich imag
m×1mm×1mmagnetic fieldsed in this
echnology. Exrain tumour o5, and 42. T
Image Compr
ty and positiotor ∆(p, i).
p 4 and contover.
en k and l, anbacterium i,
es a measure
fetime and hosubstances. S(i) in order o
eans lower he
S/2, bacteria nd other Sr b
bacteria thaas their paren
p 3.
dispersal: Foiminate and
ckwise) a) c) Glioma d
eriments, sixAstrocytoma”,
“Metastatic”8 bits per pown in Fig. 3emens-Area age is capturm by 48 muld intensity. equipment xperiments aron four differThe program
ression
on of bacteri
inue chemota
nd for each i =, 𝑗 as 𝑗e of how m
ow successfuort bacteria of ascending alth).
with the lowbacteria with at are made nt.
r i = 1, 2. . d disperse e
Astrocytomad) Metastatic
x still images, “Coronary ”, “PNET”, pixel amplit3. These ima
MRI scanred on sliceti channels wThe advanis Magnet
re conducted ent patients w
m is written
ium
axis
= 1,
many
ul it and 𝑗
west the are
. S each
a b) c e)
s of T1
and tude ages nner e of with nced tom for
with on

Image Anal Stereol 2018;37:249-275
257
Matlab15a software tool for execution of five algorithms. The number of solutions assigned initially is 100 and the maximum iteration number is assumed as 20.
DISCUSSION
In this paper, the performance of the proposed algorithm is explained in three sections: Evaluation of Algorithm performance, performance evaluation of proposed method in identifying tumour region and performance evaluation of proposed method for image compression.
EVALUATION OF ALGORITHM PER-FORMANCE
This section explains the performance of proposed method against other algorithms in terms of objective/maximum fitness function, mean value, standard deviation, and elapsed time or computational time.
FITNESS FUNCTION: It explains how best a solution is fit to the problem. In this paper, Kapur’s entropy and Renyi’s entropy are considered as fitness function for effective and efficient image thresholding. Here the number of thresholds are 5 and are optimized with the proposed HBFOA-PSO. Table 1 shows the fitness value obtained with the proposed HBFOA-PSO is larger when compared with the other algorithms.
MEAN AND STANDARD DEVIATION: All the optimization techniques are run more than 20 times and some randomness is involved in the execution process of the algorithm. Because of randomness, the algorithm never generates the same solution all times. The stability measuring parameter of the algorithm is mean and standard deviation. Mean value is the ratio of sum of maximum fitness value obtained with each run to total number of runs. Standard deviation is defined as a quantity expressing by how much the members of maximum fitness value differ from the mean value. From Table 1 it is clear that mean value and standard deviation of the proposed method is better than other algorithms.
COMPUTATIONAL TIME
It is measured in seconds and is total time taken by the algorithm to produce outcome or results. The proposed HBFOA-PSO algorithm computational time is little bit higher as compared with others because of cascading BFOA and PSO and is illustrated in Table 1. In comparison with the Renyi’s entropy and Kapur’s
entropy, computational time of Renyi’s entropy is a little higher.
PERFORMANCE EVALUATION OF PROPOSED METHOD IN IDENTIFYING TUMOUR REGION
As disused in introduction section, in this section first it is explained how the proposed HBFOA-PSO is better in identification of brain tumour area as compared with other optimization techniques with maximizing Renyi’s entropy and Kapur’s entropy. This section explains visual clarity of tumour regions with the proposed method and other algorithms. For testing of HBFOA-PSO six images of different tumours in brain are chosen and all the images are in .jpg format. Fig. 4 to Fig. 9 show the optimal threshold images with optimized thresholds and which partition the image into clusters/groups and from these clusters one can clearly distinguish the tumour area and edema area in tumour affected brain image.
Fig. 4 illustrates the threshold image of a female patient of age 42 and she is suffering with metastatic bronchogenic carcinoma brain tumour. From Fig. 4 it is observed that, visually tumour area and edema area are clearly partitioned with the proposed HBFOA-PSO compared with other algorithms. Input image shows that tumour is affected in left temporal region of the brain (high intensity region) but left hemisphere of the patient brain is totally inflamed as consequences of the all-encompassing surgery. For surgery radiologist may confuse in identifying the exact tumour location and it is possible with the HBFOA-PSO.
Proposed HBFOA-PSO efficiency is tested on low grade Glioma brain tumour image and proved better compared to other algorithms and shown in Fig. 5. This Glioma brain tumour image is obtained from a patient of age 35 and tumour is identified in the left occipital area. Visual identification of tumour area and edema area are very clear with the proposed HBFOA-PSO.
Fig. 6 shows the threshold image of patient of age 35 and was suffering with meningioma tumour. Reasonable occurrence of calcified pathology is reported in the right parietal convexity with a dural tail. The proposed HBFOA-PSO clearly identifies area of tumour in meningioma tumour image and this demonstrates the toughness and competence of the proposed HBFOA-PSO in identifying the tumour area of demanding clinical data.
Fig.7 and Fig. 8 shows the threshold image of patient of age 32 and was suffering with high grade Astrocytoma tumour and these figures demonstrate the

efficiency aPSO. The Hbetween righrest area. Iventricular sof intense successfully
In generthe patient when this learound six mis a difficultintensity levimages also as compared
Primitivmassive tum
Kapur’s Ent Input image
Renyi’s Entr
Fig. 4. Metaalgorithms
and effectivenHBFOA-PSO
ht ganglio caIn spite of system, whicedema, the
y identified th
ral tumour bdepends on
evel is above months. Identt task becausevel as shown i
proposed HBd to other algo
ve Neuro Ectmour which
tropy MFO
ropy
astatic Bronc
VIMA
ness of the pvisually show
apsular regionthe effacem
ch occurred dsuggested
he tumour reg
ecomes cancthe stage of four then liftifying the tume there is no min Fig. 9. EveBFOA-PSO sorithms.
todermal Tumis mostly
G
chogenic Car
ALA KUMARI
proposed HBws the tumoun and thalamument of ipsildue to the preHBFOA-PSOion.
cer and life tif tumour levefetime of patimour at earlymuch differeen with this kshows better r
mour (PNETappearing i
GWO
cinoma affec
G ET AL: Hyb
258
BFOA-ur area us and lateral esence O has
ime of el and tient is y stage ence in kind of results
T) is a in the
chprceThcodeunmcepaposuHidot
PSO
cted brain im
brid Algorithm
hildren at agrimitive or uells try to exthey appear sonsidered a sead cells andnequally. As
massive aggreerebral hemisatient brain imost radio therupratentorial tBFOA-PSO
dentifying PNther state-of-a
B
mage and opti
m for Medical I
ge of below undeveloped end to entire imilar to medsingle tumouaround the tcompared to
essive tumouspheres of thmage of age 3rapeutic diagntumour. The e
algorithm NET tumour aart algorithms
FOA
imal threshol
Image Compr
25 years ancells in the nervous syst
duloblastomaur. PNET cotumour fluido medulloblaur which mohe brain. Fi3 and is obtainosis and waeffectivenessis that it
at early stages.
HBFOA
ld images ob
ression
nd it is duebrain and th
tem of the bra and were oontain cysts s are distribustoma, PNET
ostly affects g. 9 shows ined while doas suffering ws of the propoworks well
e as compared
-PSO
btained with f
e to hese ain.
once and
uted T is the the
oing with osed
in d to
five

Image Anal S
Kapur’s EntInput image
Renyi’s Entr
Fig. 5. Gliom Kapur’s Ent Input imag
Renyi’s Entr
Fig. 6. Meni
Stereol 2018;3
tropy MFO
ropy
ma affected b
tropy ge MFO
ropy
ingioma affec
37:249-275
G
brain image an
GW
cted brain ima
GWO
nd optimal th
O
age and optim
259
PSO
hreshold imag
PSO
mal threshold
B
ges obtained w
BFO
d images obta
FOA
with five algo
OA
ined with five
HBFOA
orithms
HBFOA-P
ve algorithms
A-PSO
SO

Kapur’s Ent Input image
Renyi'sEntr
Fig. 7. Astro Kapur’s EntInput image
Renyi’s Entr
Fig. 8. Coroalgorithms
tropy MFO
ropy
ocytoma tumo
tropy MFO
ropy
onary T1 As
VIMA
O G
our affected b
G
strocytoma tu
ALA KUMARI
GWO
brain image a
GWO
umour affecte
G ET AL: Hyb
260
PSO
and optimal th
PSO
ed brain ima
brid Algorithm
BFO
hreshold imag
BF
age and optim
m for Medical I
OA
gesobtained w
FOA
mal threshold
Image Compr
HBFOA-P
with five algo
HBFOA-
d images obt
ression
SO
orithms
PSO
tained with ffive

Image Anal S
Kapur’s Ent Input image
Renyi’s Entr
Fig. 9. Primalgorithms
PERFOPROPOCOMP
This sePSO is effePSNR, MSE
PEAK S
Peak signated in recshows that elittle low. Tlevel MRI symbol MAMSE and in 20dB to 40d
𝑃𝑆𝑁𝑅 1
From thincreased wi
The bitsimage size pixels in combpp and nuoriginal imanumber of t
Stereol 2018;3
tropy MFO
ropy
mitive Neuro
ORMANCEOSED MET
PRESSION
ection explainfective in imE, SSIM and W
SIGNAL TO
gnal to noise constructed ieffect of noi
The highest inbrain image
AX. PSNR vageneral the r
dB and is calc
0𝑙𝑜𝑔
he above equaith the decrem
s per pixel (b(in terms ofmpressed ima
umber of thrage are replathresholds Th
37:249-275
G
Ectodermal t
E EVALUATTHOD FOR
ns how the pmage compre
WPSNR.
NOISE RAT
ratio shows image. A higse on reconsntensity level
is 255 and alue is inversrange of PSNculated using
ation it is cleament in MSE
bpp) is the raf bits) (Ĩ) anage (ĨT). Beloresholds. All ced with opth=2, then 2
GWO
tumour affec
TION OF R IMAGE
proposed HBssion in term
TIO
the noise congh value of Pstructed imagl of the inpu
is indicatedely proportioR value is bethe Eq. (15).
ar that PSNRvalue.
atio of comprnd total numbow table show
the pixels itimal threshobits are enou
261
PSO
cted brain im
BFOA-ms of
ntami-PSNR
ge is a ut gray d with onal to etween
(15)
R value
ressed ber of ws the in the
olds, if ugh to
rete25
PSavHbeis KthHalthm
BFO
mage and opti
epresent 2 thrms of bits) i56*256). The
Fig. 22 anSNR and biverage peak BFOA-PSO etter when cohigher with
apur’s entrophat reconstruBFOA-PSO gorithms and
hresholds obtamarked on hist
OA
imal threshol
resholds. So is 256*256*2refore bpp =
d Fig. 23 shoits per pixel
signal to nis around 32
ompared to otRenyi’s entro
py. From Figucted image
is better d Fig. 16 toained with diftogram of resp
Number of thresholds
(Th)
2
3
4
5
HBFOA-P
ld images ob
compressed2 (since origin256*256*Th
ows the bar chl (bpp), fromnoise ratio o
decibels andther algorithmopy when co
g. 10 to Fig. 1quality of
as comparo Fig. 21 shfferent algori
spective brain
bpp
0.25
0.375
0.5
0.625
SO
btained with f
d image size nal image siz
h/256*256*8.
hart between m these figuof the propod this value isms and its vampared with 15 it is obserf the propoed with ot
how the optimithms and all
n tumour imag
= Ĩ / ĨT
5
5
five
(in ze is
the ures osed s far alue the
rved osed ther mal are
ges.

VIMALA KUMARI G ET AL: Hybrid Algorithm for Medical Image Compression
262
MEAN SQUARE ERROR: It is the procedure of squaring the predictable quantities. It is the average error between the input and reconstructed image and the result is squared and is calculated using Eq. (16).
𝑀𝑆𝐸
∑ ∑ 𝐼 𝐼 (16)
The algorithm which gives lower value of mean squared error is the best algorithm. Lower value of MSE shows less difference between the input image and reconstructed image. In above equation M is size of the input image, I is original input image and Ĩ is reconstructed image or decompressed image. With the proposed method the value of MSE is lesser when compared to other algorithms.
Fig. 24 and Fig. 25 show the rate distortion curve drawn between different images on x-axis and MSE on y-axis by considering bits per pixel (bpp) 0.625. These figures show the comparison of various MSE obtained with the various algorithms. MSE values are image compression measuring parameter which measures the deformation levels in the reconstructed image and this deformation levels are treated as error and is measured by taking pixel wise difference between input brain image and reconstructed image. As a whole proposed HBFOA-PSO has lower value of MSE when compared with others.
STRUCTURAL SIMILARITY INDEX MEAS-URE (SSIM)
PSNR and MSE values are measured with respect to intensity level of the input image and reconstructed image. Sometimes these two fail in measuring the reconstructed image visual quality. Sometimes PSNR value obtained with the technique may be high but visual quality is poor, so SSIM is introduced in this paper.The SSIM measures the similarity between input image and reconstructed image with separate luminance (L), contrast (C) and structure (S) components. SSIM of y and 𝑦 is calculated using following equation
IISIICIILyySSIM~
,~
,~
,,
(17)
α, β and γ are the adjustable parameters which gives the relative importance of the three components and are equal to one in this paper for effortless calculation of SSIM.
21
22122~
22
~
2
~~
CC
CCSSIM
IIII
IIII
(18)
Where µI and µĨ are the mean value of the original image I and reconstructed image Ĩ, σI and σĨ are the standard deviation of original image I and reconstructed image Ĩ, σIĨ is the cross-correlation and C1 & C2 are constants which are equal to 0.065. The range of SSIM is -1 to +1 and SSIM value equal to one shows original image and reconstructed image is similar. The algorithm is said to be good if SSIM value is near around +1. Table 2 shows the SSIM of various methods with Renyi’s entropy and Kapur’s entropy and it shows proposed method SSIM is higher than other methods.
1
1 N
I ii
IN
(19)
Ii
N
iIiII IIN
ncorrelatioCross ~1
~~
1
1
(20)
WEIGHTED PSNR (WPSNR)
The major advantage of PSNR is its simplicity in the calculation while major disadvantage is that it does not consider any of the human visual system (HVS) attributes. So there is need of WPSNR which incorporate HVS parameters. WPSNR is HVS-based method and more accurate than PSNR. The WPSNR uses the principle of redundancy of the human eye toward high frequency components in images. The human perception of vision is less sensitive to edges than smooth areas. The WPSNR is nothing but PSNR weighted by the HVS parameter (Navas et al., 2011). The WPSNR in dB is expressed as
WPSNR 10log (21)
Where NVF is noise visibility function and defined as
NVF norm (22)
Where, δblock is the standard deviation of pixels having a specific size (8×8). In smooth regions, the value of NVF is near to zero and in the regions with edges and texture it is near to unity. From Table 2 it is observed that proposed method is better in WPSNR compared to other methods.

Image Anal S
Kapur’s Ent Input image
Renyi’s Entr
Fig. 10. Astr
Kapur’s EntInput image
Renyi’s Entr
Fig. 11. Co
Stereol 2018;3
tropy MFO
ropy
rocytoma tum
tropy MFO
ropy
oronary T1 As
37:249-275
G
mour affected
GW
strocytoma tum
GWO
d brain image
WO
mour affected
263
PSO
and decompr
PSO
d brain image a
BF
ressed image
BFO
and decompre
FOA
obtained wit
A
essed images o
HBFOA-P
th five algorit
HBFOA-PSO
obtained with
PSO
thms
O
five algorithmms

Kapur’s EntInput image
Renyi’s Entr
Fig. 12. Glio Kapur’s EntInput image
Renyi’s Entr
Fig. 13. Met
tropy MFO
ropy
oma affected
tropy MFO
ropy
tastatic Bronch
VIMA
GW
brain image
G
hogenic Carci
ALA KUMARI
WO
and decompr
GWO
inoma affected
G ET AL: Hyb
264
PSO
ressed images
PSO
d brain image
brid Algorithm
BFO
s obtained wi
BF
e and decompr
m for Medical I
OA
th five algori
FOA
ressed images
Image Compr
HBFOA-PS
ithms
HBFOA-PS
s obtained with
ression
SO
SO
h five algorithhms
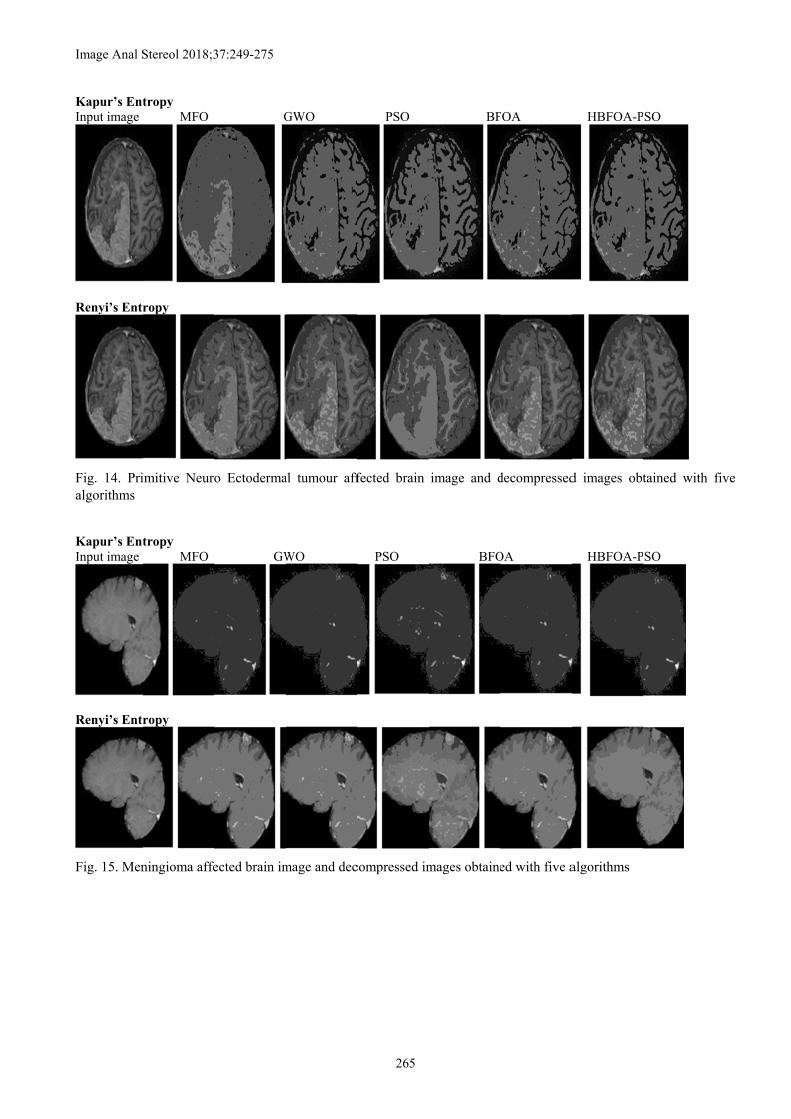
Image Anal S
Kapur’s EntInput image
Renyi’s Entr
Fig. 14. Prialgorithms Kapur’s EntInput image
Renyi’s Entr
Fig. 15. Men
Stereol 2018;3
tropy MFO
ropy
imitive Neuro
tropy MFO
ropy
ningioma affe
37:249-275
G
o Ectoderma
GW
ected brain im
GWO
al tumour aff
WO
mage and dec
265
PSO
fected brain
PSO
compressed im
BF
image and d
BFO
mages obtaine
FOA
decompressed
OA
ed with five a
HBFOA-P
d images obt
HBFOA-P
algorithms
SO
tained with f
SO
five

VIMALA KUMARI G ET AL: Hybrid Algorithm for Medical Image Compression
266
Kapur’s Entropy MFO GWO PSO BFOA HBFOA-PSO
Renyi’s Entropy
Fig. 16. Optimal thresholds on Histogram of Astrocytoma tumour affected brain image with five algorithms Kapur’s Entropy
MFO GWO PSO BFOA HBFOA-PSO
Renyi’s Entropy
Fig. 17. Optimal thresholds on Histogram of Coronary T1 Astrocytoma tumour affected brain image with five algorithms
0 50 100 150 200 250 3000
0.2
0.4
0.6
0.8
1
1.2
1.4
1.6
1.8
2x 10
4
hist
ogra
m,T
hres
hold
s
histogrm
Thresholds
0 50 100 150 200 250 3000
0.2
0.4
0.6
0.8
1
.2
.4
.6
.8
2x 10
4
histogrm
Thresholds
0 50 100 150 200 250 3000
2
4
6
8
1
2
4
6
8
2x 10
4
histogrm
Thresholds
0 50 100 150 200 250 3000
0.2
0.4
0.6
0.8
1
1.2
1.4
1.6
1.8
2x 10
4
g
histogrm
Thresholds
0 50 100 150 200 250 3000
0.2
0.4
0.6
0.8
1
1.2
1.4
1.6
1.8
2x 10
4
histogrm
Thresholds
0 50 100 150 200 250 3000
2
4
6
8
1
2
4
6
8
2x 10
4
histogrm
Thresholds
0 50 100 150 200 250 3000
0.2
0.4
0.6
0.8
1
1.2
1.4
1.6
1.8
2x 10
4
g,
histogrm
Thresholds
0 50 100 150 200 250 3000
0.2
0.4
0.6
0.8
1
1.2
1.4
1.6
1.8
2x 10
4
g,
histogrm
Thresholds
0 50 100 150 200 250 3000
0.2
0.4
0.6
0.8
1
1.2
1.4
1.6
1.8
2x 10
4
g,
histogrm
Thresholds
0 50 100 150 200 250 3000
0.2
0.4
0.6
0.8
1
1.2
1.4
1.6
1.8
2x 10
4
g,
histogrm
Thresholds
0 50 100 150 200 250 3000
0.5
1
1.5
2
2.5x 10
4
i l i t it
histogrm
Thresholds
0 50 100 150 200 250 3000
0.5
1
1.5
2
2.5x 10
4
histogrm
Thresholds
0 50 100 150 200 250 3000
0.5
1
1.5
2
2.5x 10
4
histogrm
Thresholds
0 50 100 150 200 250 3000
0.5
1
.5
2
2.5x 10
4
histogrm
Thresholds
0 50 100 150 200 250 3000
0.5
1
1.5
2
2.5x 10
4
histogrm
Thresholds
0 50 100 150 200 250 3000
0.5
1
1.5
2
2.5x 10
4
g
histogrm
Thresholds
0 50 100 150 200 250 3000
0.5
1
1.5
2
2.5x 10
4
histogrm
Thresholds
0 50 100 150 200 250 3000
0.5
1
1.5
2
2.5x 10
4
histogrm
Thresholds
0 50 100 150 200 250 3000
0.5
1
1.5
2
2.5x 10
4
histogrm
Thresholds
0 50 100 150 200 250 3000
0.5
1
1.5
2
2.5x 10
4
histogrm
Thresholds
His
togr
am, T
hres
hold
s
Pixel Intensity
His
togr
am, T
hres
hold
s
Pixel Intensity
His
togr
am, T
hres
hold
s H
isto
gram
, Thr
esho
lds
Pixel Intensity
Pixel Intensity

Image Anal Stereol 2018;37:249-275
267
Kapur’s Entropy MFO GWO PSO BFOA HBFOA-PSO
Renyi’s Entropy
Fig. 18. Optimal thresholds on Histogram of Glioma affected brain image with five algorithms
Kapur’s Entropy
MFO GWO PSO BFOA HBFOA-PSO
Renyi’s Entropy
Fig. 19. Optimal thresholds on Histogram of Metastatic Bronchogenic Carcinoma affected brain image with five algorithms
0 50 100 150 200 250 3000
2000
4000
6000
8000
10000
12000
14000
16000
histogrm
Thresholds
0 50 100 150 200 250 3000
2000
4000
6000
8000
10000
12000
14000
16000
histogrm
Thresholds
0 50 100 150 200 250 3000
2000
4000
6000
8000
10000
12000
14000
16000
histogrm
Thresholds
0 50 100 150 200 250 3000
2000
4000
6000
8000
10000
12000
14000
16000
g
histogrm
Thresholds
0 50 100 150 200 250 3000
2000
4000
6000
8000
0000
2000
4000
6000
histogrm
Thresholds
0 50 100 150 200 250 3000
000
000
000
000
000
000
000
000
histogrm
Thresholds
0 50 100 150 200 250 3000
000
000
000
000
000
000
000
000
histogrm
Thresholds
0 50 100 150 200 250 3000
2000
4000
6000
8000
10000
12000
14000
16000
histogrm
Thresholds
0 50 100 150 200 250 3000
2000
4000
6000
8000
10000
12000
14000
16000
histogrm
Thresholds
0 50 100 150 200 250 3000
2000
4000
6000
8000
10000
12000
14000
16000
histogrm
Thresholds
0 50 100 150 200 250 3000
000
000
000
000
000
000
000
000
000
histogrm
Thresholds
0 50 100 150 200 250 3000
2000
4000
6000
8000
10000
12000
14000
16000
18000
histogrm
Thresholds
0 50 100 150 200 250 3000
2000
4000
6000
8000
10000
12000
14000
16000
18000
histogrm
Thresholds
0 50 100 150 200 250 3000
2000
4000
6000
8000
0000
2000
4000
6000
8000
histogrm
Thresholds
0 50 100 150 200 250 3000
000
000
000
000
000
000
000
000
000
histogrm
Thresholds
0 50 100 150 200 250 3000
2000
4000
6000
8000
0000
2000
4000
6000
8000
histogrm
Thresholds
0 50 100 150 200 250 3000
2000
4000
6000
8000
0000
2000
4000
6000
8000
histogrm
Thresholds
0 50 100 150 200 250 3000
2000
4000
6000
8000
0000
2000
4000
6000
8000
histogrm
Thresholds
0 50 100 150 200 250 3000
2000
4000
6000
8000
0000
2000
4000
6000
8000
histogrm
Thresholds
0 50 100 150 200 250 3000
2000
4000
6000
8000
10000
12000
14000
16000
18000
histogrm
Thresholds
His
togr
am, T
hres
hold
s H
isto
gram
, Thr
esho
lds
His
togr
am, T
hres
hold
s H
isto
gram
, Thr
esho
lds
Pixel Intensity
Pixel Intensity
Pixel Intensity
Pixel Intensity
VIMALA KUMARI G ET AL: Hybrid Algorithm for Medical Image Compression
268
Kapur’s Entropy MFO GWO PSO BFOA HBFOA-PSO
Renyi’s Entropy
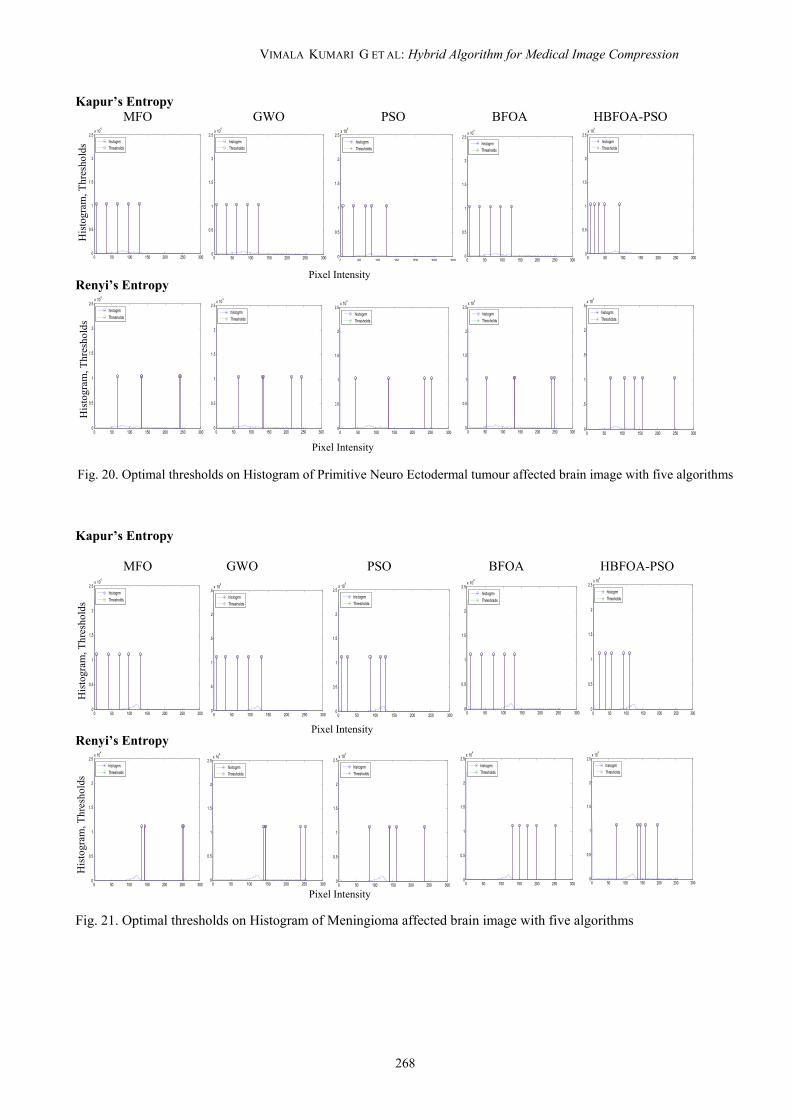
Fig. 20. Optimal thresholds on Histogram of Primitive Neuro Ectodermal tumour affected brain image with five algorithms
Kapur’s Entropy
MFO GWO PSO BFOA HBFOA-PSO
Renyi’s Entropy
Fig. 21. Optimal thresholds on Histogram of Meningioma affected brain image with five algorithms
0 50 100 150 200 250 3000
0.5
1
1.5
2
2.5x 10
4
histogrm
Thresholds
0 50 100 150 200 250 3000
0.5
1
1.5
2
2.5x 10
4
g
histogrm
Thresholds
0 50 100 150 200 250 3000
0.5
1
1.5
2
2.5x 10
4
histogrm
Thresholds
0 50 100 150 200 250 3000
0.5
1
1.5
2
2.5x 10
4
histogrm
Thresholds
0 50 100 150 200 250 3000
0.5
1
1.5
2
2.5x 10
4
histogrm
Thresholds
0 50 100 150 200 250 3000
0.5
1
1.5
2
2.5x 10
4
histogrm
Thresholds
0 50 100 150 200 250 3000
0.5
1
1.5
2
2.5x 10
4
histogrm
Thresholds
0 50 100 150 200 250 3000
0.5
1
1.5
2
2.5x 10
4
histogrm
Thresholds
0 50 100 150 200 250 3000
0.5
1
1.5
2
2.5x 10
4
histogrm
Thresholds
0 50 100 150 200 250 3000
.5
1
.5
2
.5x 10
4
histogrm
Thresholds
0 50 100 150 200 250 3000
0.5
1
1.5
2
2.5x 10
4
histogrm
Thresholds
0 50 100 150 200 250 3000
.5
1
.5
2
.5x 10
4
histogrm
Thresholds
0 50 100 150 200 250 3000
0.5
1
1.5
2
2.5x 10
4
histogrm
Thresholds
0 50 100 150 200 250 3000
0.5
1
1.5
2
2.5x 10
4
histogrm
Thresholds
0 50 100 150 200 250 3000
0.5
1
1.5
2
2.5x 10
4
histogrm
Thresholds
0 50 100 150 200 250 3000
0.5
1
1.5
2
2.5x 10
4
histogrm
Thresholds
0 50 100 150 200 250 3000
0.5
1
1.5
2
2.5x 10
4
g
histogrm
Thresholds
0 50 100 150 200 250 3000
0.5
1
1.5
2
2.5x 10
4
histogrm
Thresholds
0 50 100 150 200 250 3000
0.5
1
1.5
2
2.5x 10
4
histogrm
Thresholds
0 50 100 150 200 250 3000
0.5
1
1.5
2
2.5x 10
4
g,
histogrm
Thresholds
His
togr
am, T
hres
hold
s H
isto
gram
, Thr
esho
lds
His
togr
am, T
hres
hold
s H
isto
gram
, Thr
esho
lds
Pixel Intensity
Pixel Intensity
Pixel Intensity
Pixel Intensity

Image Anal Stereol 2018;37:249-275
269
Table 1. Evaluation of Fitness, Mean, Standard deviation and Elapsed time of five methods for brain images
Image
Optimization Technique
Fitness value Mean Standard deviation Elapsed time
(sec) Kapur Renyi Kapur Renyi Kapur Renyi Kapur Renyi
Meningioma
GWO 9.8524 16.172 10.465 16.904 0.08711 0.117654 28.931 10.809 MFO 10.391 16.631 10.483 16.922 0.0001 3.61E-15 9.0867 7.2405 PSO 10.483 16.913 10.055 15.99 0.19127 0.410305 19.165 9.2245
BFOA 10.485 16.922 10.485 16.913 5.42E-15 1.45E-14 8.0601 7.0205 HBFOA-PSO 10.537 16.968 9.8524 16.172 3.61E-15 3.61E-15 39.543 57.999
PNET
GWO 10.81 15.971 10.81 15.971 0.03428 0.144739 20.027 16.979 MFO 11.149 16.912 11.088 16.122 5.42E-15 3.61E-15 10.23 7.1725 PSO 11.176 17.015 11.149 17.015 0.0982 0.569382 55.656 9.8013
BFOA 11.183 17.075 11.172 17.02 5.42E-15 1.08E-14 13.103 7.6018 HBFOA-PSO 11.187 17.086 11.176 17.075 5.42E-15 7.23E-15 40.608 59.407
Metastatic
GWO 12.191 19.011 12.191 19.011 0.03701 0.038206 18.119 15.381 MFO 12.518 19.704 12.518 19.419 9.03E-15 1.08E-14 21.278 10.68 PSO 12.546 19.711 12.34 19.711 0.12774 0.22731 19.185 94.153
BFOA 12.55 19.762 12.535 19.762 9.03E-15 0.0909 9.7452 9.4357 HBFOA-PSO 12.551 19.765 12.551 19.749 1.81E-15 0.09090 38.520 48.261
Glioma
GWO 12.002 19.041 12.002 19.041 0.03799 0.05544 17.759 12.135 MFO 12.36 19.634 12.159 19.634 5.42E-15 1.08E-14 12.25 7.8565 PSO 12.363 19.658 12.368 19.658 0.12408 0.20444 38.2 9.9885
BFOA 12.394 19.824 12.36 19.501 9.03E-15 3.61E-15 9.8131 17.692 HBFOA-PSO 12.395 19.835 12.363 19.805 0.0909 3.61E-15 45.879 52.848
Coronary T1 Astrocytoma
GWO 10.881 16.965 10.881 16.965 0.03465 0.063441 25.367 16.936 MFO 11.027 18.248 10.953 18.248 0.0075 3.61E-15 8.4109 9.0397 PSO 11.102 18.268 11.027 18.268 0.12238 0.341585 17.462 10.561
BFOA 11.156 18.273 11.102 17.681 3.61E-15 7.23E-15 12.135 8.3687
HBFOA-PSO 11.165 18.348 11.136 18.3 1.81E-15 3.61E-15 36.64 58.186
Astrocytoma
GWO 10.736 17.244 11.011 18.052 0.02483 0.078797 17.74 21.74 MFO 11.022 17.635 11.024 17.825 1.81E-15 3.61E-15 7.577 8.0546 PSO 11.024 17.825 10.861 17.543 0.13426 0.424639 16.351 13.634
BFOA 11.024 18.04 11.024 17.635 3.61E-15 3.61E-15 14.347 7.9109 HBFOA-PSO 11.025 18.091 10.736 17.244 1.81E-15 7.23E-15 50.755 65.194

VIMALA KUMARI G ET AL: Hybrid Algorithm for Medical Image Compression
270
Table 2. Evaluation of SSIM and WPSNR of five methods for brain images Image
Optimization
Technique SSIM WPSNR (dB)
Kapur Renyi Kapur Renyi
Meningioma
GWO 0.658670 0.886195 32.04823 15.609031 MFO 0.667427 0.904109 32.058787 15.937439 PSO 0.667626 0.904584 32.063169 16.052494
BFOA 0.667959 0.904651 32.069061 18.125513 HBFOA-PSO 0.667986 0.910922 32.108383 19.708357
PNET
GWO 0.6827744 0.832106 19.053239 18.153405 MFO 0.7056383 0.8752121 23.705779 18.531831 PSO 0.7226091 0.8762945 24.686436 18.943262
BFOA 0.7412038 0.8776707 27.591976 19.081611 HBFOA-PSO 0.7586052 0.8814224 27.983886 20.746489
Metastatic
GWO 0.6717987 0.7295003 27.416015 17.666669 MFO 0.6747454 0.7368438 27.788892 26.471868 PSO 0.6803707 0.7369216 27.863482 26.496026
BFOA 0.6814665 0.740371 28.048519 26.500085 HBFOA-PSO 0.6953937 0.8511379 28.21856 26.725894
Glioma
GWO 0.5983156 0.6936872 22.066536 16.974562 MFO 0.6161177 0.6949095 27.936855 17.619167 PSO 0.6312582 0.8396407 28.838197 18.795318
BFOA 0.6353784 0.841043 29.477103 28.513004 HBFOA-PSO 0.7363141 0.8439056 30.557768 28.723952
Coronary T1 Astrocytoma
GWO 0.6350157 0.8571572 22.77016 17.628194 MFO 0.6386655 0.8581259 29.271111 17.852049 PSO 0.6450002 0.8588663 29.412006 18.156052
BFOA 0.6486089 0.8625398 29.809665 19.952415 HBFOA-PSO 0.8092489 0.8648337 30.562705 20.525345
Astrocytoma
GWO 0.6304807 0.7852364 22.866723 17.079014 MFO 0.6307575 0.7952396 24.701479 17.632169 PSO 0.6566649 0.8541937 27.212897 18.608922
BFOA 0.7165008 0.8649524 29.294284 19.586243 HBFOA-PSO 0.7276255 0.8665126 29.294394 19.822887

Image Anal Stereol 2018;37:249-275
271
Fig. 22. Peak Signal-to-Noise Ratio of brain images obtained with five algorithms using Renyi Entropy
0
5
10
15
20
25
30
35
bpp=0.25 bpp=0.375 bpp=0.5 bpp=0.625
PSN
R (dB)
PNET
GWO MFO PSO BFOA HBFOA‐PSO
0
5
10
15
20
25
30
bpp=0.25 bpp=0.375 bpp=0.5 bpp=0.625
PSN
R (dB)
Meningioma
GWO MFO PSO BFOA HBFOA‐PSO
0
5
10
15
20
25
30
35
bpp=0.25 bpp=0.375 bpp=0.5 bpp=0.625
PSN
R (dB)
Metastatic
GWO MFO PSO BFOA HBFOA‐PSO
0
5
10
15
20
25
30
35
bpp=0.25 bpp=0.375 bpp=0.5 bpp=0.625
PSN
R (dB)
Glioma
GWO MFO PSO BFOA HBFOA‐PSO
0
5
10
15
20
25
30
35
bpp=0.25 bpp=0.375 bpp=0.5 bpp=0.625
PSN
R (dB)
Coronary T1 Astrocytoma
GWO MFO PSO BFOA HBFOA‐PSO
0
5
10
15
20
25
30
35
bpp=0.25 bpp=0.375 bpp=0.5 bpp=0.625
PSN
R (dB)
Astrocytoma
GWO MFO PSO BFOA HBFOA‐PSO

VIMALA KUMARI G ET AL: Hybrid Algorithm for Medical Image Compression
272
Fig. 23. Peak Signal-to-Noise Ratio of MRI brain images obtained with five algorithms using Kapur’s Entropy
0
10
20
30
40
bpp=0.25 bpp=0.375 bpp=0.5 bpp=0.625
PSN
R (dB)
PNET
GWO MFO PSO BFOA HBFOA‐PSO
0
10
20
30
40
bpp=0.25 bpp=0.375 bpp=0.5 bpp=0.625
PSN
R (dB)
Coronary T1 Astrocytoma
GWO MFO PSO BFOA HBFOA‐PSO
0
10
20
30
40
bpp=0.25 bpp=0.375 bpp=0.5 bpp=0.625
PSN
R (dB)
Astrocytoma
GWO MFO PSO BFOA HBFOA‐PSO
0
10
20
30
40
bpp=0.25 bpp=0.375 bpp=0.5 bpp=0.625
PSN
R (dB)
Metastatic
GWO MFO PSO BFOA HBFOA‐PSO
0
10
20
30
40
bpp=0.25 bpp=0.375 bpp=0.5 bpp=0.625
PSN
R (dB)
Glioma
GWO MFO PSO BFOA HBFOA‐PSO
0
5
10
15
20
25
30
bpp=0.25 bpp=0.375 bpp=0.5 bpp=0.625
PSN
R (dB)
Meningioma
GWO MFO PSO BFOA HBFOA‐PSO
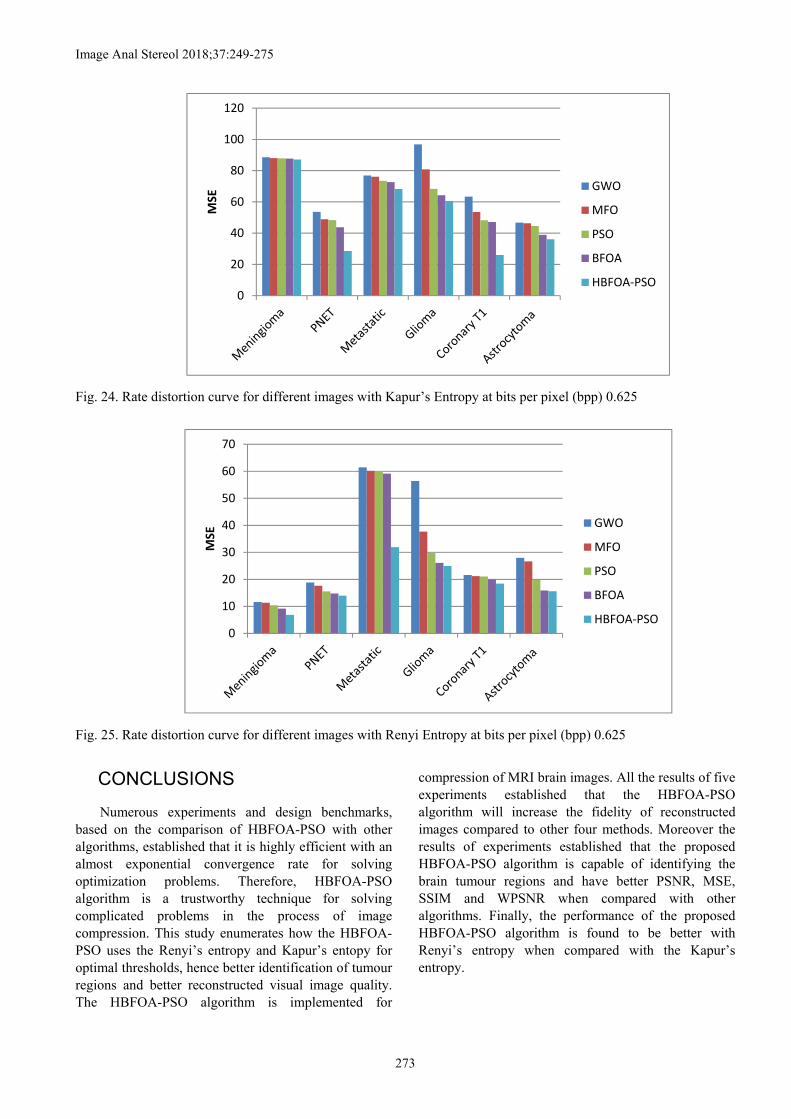
Image Anal Stereol 2018;37:249-275
273
Fig. 24. Rate distortion curve for different images with Kapur’s Entropy at bits per pixel (bpp) 0.625
Fig. 25. Rate distortion curve for different images with Renyi Entropy at bits per pixel (bpp) 0.625
CONCLUSIONS
Numerous experiments and design benchmarks, based on the comparison of HBFOA-PSO with other algorithms, established that it is highly efficient with an almost exponential convergence rate for solving optimization problems. Therefore, HBFOA-PSO algorithm is a trustworthy technique for solving complicated problems in the process of image compression. This study enumerates how the HBFOA-PSO uses the Renyi’s entropy and Kapur’s entopy for optimal thresholds, hence better identification of tumour regions and better reconstructed visual image quality. The HBFOA-PSO algorithm is implemented for
compression of MRI brain images. All the results of five experiments established that the HBFOA-PSO algorithm will increase the fidelity of reconstructed images compared to other four methods. Moreover the results of experiments established that the proposed HBFOA-PSO algorithm is capable of identifying the brain tumour regions and have better PSNR, MSE, SSIM and WPSNR when compared with other algorithms. Finally, the performance of the proposed HBFOA-PSO algorithm is found to be better with Renyi’s entropy when compared with the Kapur’s entropy.
0
20
40
60
80
100
120
MSE
GWO
MFO
PSO
BFOA
HBFOA‐PSO
0
10
20
30
40
50
60
70
MSE
GWO
MFO
PSO
BFOA
HBFOA‐PSO

VIMALA KUMARI G ET AL: Hybrid Algorithm for Medical Image Compression
274
REFERENCES
Anitha V, Pallikonda R, Vishnuvarthanan G, Yudong Z, Arunprasath T (2017). An automated hybrid approach using clustering and nature inspired optimization technique for improved tumour and tissue segmenta-tion in magnetic resonance brain images, Appl Soft Comput, 57: 399–26.
Badri NS, Veerakumar T, Esakkirajan SA (2016). Tumour or abnormality identification from magnetic resonance images using statistical region fusion based segmenta-tion, Magn Reson Imaging, 34(9): 1292-304.
Chen-Kuei Y, Wen-Hsiang. T (2015). Color image compression using quantization, thresholding, and edge detection techniques all based on the moment-preserving principle, Pattern Recog Lett, 19: 205-15.
Diego O, Salvador H, Erik C, Gonzalo P, Omar A, Jorge G (2017). Cross entropy based thresholding for magnetic resonance brain images using Crow Search Algorithm, Expert Syst Appl, 79: 164–80
GS Rao, PMK Prasad, DYV Prasad (2016). Performance Analysis of orthogonal and Biorthogonal wavelets for Edge detection of X-ray Images, Procedia Comput Sci, 87:116-21.
Irem EK, Ayca Çi, Emine GS, Turgay I (2017). PCA based clustering for brain tumour segmentation of T1W MRI images, Comput Meth Prog Bio, 140: 19-28.
Ivan C, Iker G (2017). MRI segmentation fusion for brain tumour detection, Inform Fusion, 36: 1–9.
Kaur LS Gupta RC, Chauhan SCS (2007) Medical ultrasound image compression using joint optimization of thresholding quantization and best-basis selection of wavelet packets, Digit Signal Process, 17: 189-98.
Kaveh Ahmadi, Ahmad YJ, Ezzatollah S (2015). An efficient compression scheme based on adaptive thresholding in wavelet domain using particle swarm optimization, Signal Process-Image, 32: 33–39.
Kennedy J, Eberhart RC (1995). A new Optimizer using Particle Swarm Theory, in Proceedings of Sixth International Symposium on Micro Machine and Human Science, Nagoya, Japan, 6: 39-43.
Lubna F, Adeel Y and Rana HR (2017). Adaptive stochastic segmentation via energy-convergence for brain tumour in MR image., J Vis Commun Image R, 46: 303–11.
Navas KA, Gayathri Devi KG, Athulya MS, Anjali V (2011). MWPSNR: A new image fidelity metric, IEEE Recent Advances in Intelligent Computational Systems (RAICS), 627-32.
Nooshin N, Miroslav K (2017). Automatic tumour segmentation in single-spectral MRI using a texture-based and contour-based algorithm, Expert Syst Appl, 77: 1–10.
Passino KM (2002). Biomimicry of bacterial foraging for distributed optimization and control, IEEE Control Systems Magazine, 22: 52–67.
Prasanna S, Carrye W, Jerry Y (1997). Threshold Selection Using Renyi's Entropy, Pattern Recogn, 30(1): 71-84.
Prashant S, Ioana M (2003). Selective Thresholding in Wavelet Image Compression, Wavelets and Signal Processing Part of the series Applied and Numerical Harmonic Analysis, 2: 377-81.
Rajeswari R (2012). Type-2 Fuzzy Thresholded Bandlet Transform for Image Compression, Procedia Engineer, 38: 385-90.
Rajinikanth V, Suresh CS, Steven LF, Nachiappan S (2017). Entropy based segmentation of tumour from brain MR images – a study with teaching learning based optimization, Pattern Recog Lett, 94: 87–95.
Ramakrishnan T, Sankaragomathi B (2017). A professional estimate on the computed tomography brain tumour images using SVM-SMO for classifica-tion and MRG-GWO for segmentation, ttern Recog Lett, 15:163–71.
Salleh. MFM, Soraghan J (2007). A New Multistage Lattice Vector Quantization with Adaptive Subband Thresholding for Image Compression, EURASIP Journal on Advances in Signal Processing December, 2: 23-34.
Sathya PD, Kayalvizhi R (2011). Optimal multilevel thresholding using bacterial foraging algorithm, Expert Syst Appl, 38: 15549–64.
Sathya PD, Kayalvizhi. R (2011). Amended bacterial foraging algorithm for multilevel thresholding of magnetic resonance brain images, Measurement, 44: 1828–48.
Siraj. S (2015). Comparative study of Birge–Massart strategy and unimodalthresholding for image compression using wavelet transform, Optik, 126: 5952-55.
Solmaz A, Farshad T (2017). Detection of brain tumour in 3D MRI images using local binary patterns and histogram orientation gradient. Neurocomputing, 219: 526–35.
Sudip Kumar A, Jamuna KS, Dipak K, Basu MN (2015). Conditional spatial fuzzy C-means clustering algorithm for segmentation of MRI images, Appl Soft Comput, 34: 758-69.
Tahere IM, Mohammad RKM (2009). ECG Compression with Thresholding of 2-D Wavelet Transform Coefficients and Run Length Coding, Eur J Sci Res, 27: 248-57.
Tony FC, Zhou H (2007). Total Variation Wavelet Thresholding, J Sci Comput, 32(2): 315-41.

Image Anal Stereol 2018;37:249-275
275
Yudong Z, Lenan W (2011). Optimal multi-level thresholding based on maximum Tsallis entropy via an artificial bee colony approach, Entropy, 13(4): 841–59.
Yuhong L, Fucang J, Jing Q (2016). Brain tumour segmentation from multimodal magnetic resonance images via sparse representation, Artif Intell Med, 73: 1-13.
Related Documents