HAL Id: hal-02522280 https://hal.archives-ouvertes.fr/hal-02522280 Submitted on 27 Mar 2020 HAL is a multi-disciplinary open access archive for the deposit and dissemination of sci- entific research documents, whether they are pub- lished or not. The documents may come from teaching and research institutions in France or abroad, or from public or private research centers. L’archive ouverte pluridisciplinaire HAL, est destinée au dépôt et à la diffusion de documents scientifiques de niveau recherche, publiés ou non, émanant des établissements d’enseignement et de recherche français ou étrangers, des laboratoires publics ou privés. New Approach in Application of the AHP–Fuzzy TOPSIS Method in Mineral Potential Mapping of the Natural Bitumen (Gilsonite): A Case Study from the Gilan-e-Gharb Block, the Kermanshah, West of Iran Elham Rahimi, younes Shekarian, Salman Mastri Farahani, G H Reza Asgari, Ali Nakini To cite this version: Elham Rahimi, younes Shekarian, Salman Mastri Farahani, G H Reza Asgari, Ali Nakini. New Approach in Application of the AHP–Fuzzy TOPSIS Method in Mineral Potential Mapping of the Natural Bitumen (Gilsonite): A Case Study from the Gilan-e-Gharb Block, the Kermanshah, West of Iran. American Journal of Engineering and Applied Sciences, Science Publications, 2020, 13 (1), pp.96-110. 10.3844/ajeassp.2020.96.110. hal-02522280

Welcome message from author
This document is posted to help you gain knowledge. Please leave a comment to let me know what you think about it! Share it to your friends and learn new things together.
Transcript
HAL Id: hal-02522280https://hal.archives-ouvertes.fr/hal-02522280
Submitted on 27 Mar 2020
HAL is a multi-disciplinary open accessarchive for the deposit and dissemination of sci-entific research documents, whether they are pub-lished or not. The documents may come fromteaching and research institutions in France orabroad, or from public or private research centers.
L’archive ouverte pluridisciplinaire HAL, estdestinée au dépôt et à la diffusion de documentsscientifiques de niveau recherche, publiés ou non,émanant des établissements d’enseignement et derecherche français ou étrangers, des laboratoirespublics ou privés.
New Approach in Application of the AHP–FuzzyTOPSIS Method in Mineral Potential Mapping of theNatural Bitumen (Gilsonite): A Case Study from theGilan-e-Gharb Block, the Kermanshah, West of Iran
Elham Rahimi, younes Shekarian, Salman Mastri Farahani, G H Reza Asgari,Ali Nakini
To cite this version:Elham Rahimi, younes Shekarian, Salman Mastri Farahani, G H Reza Asgari, Ali Nakini. NewApproach in Application of the AHP–Fuzzy TOPSIS Method in Mineral Potential Mapping of theNatural Bitumen (Gilsonite): A Case Study from the Gilan-e-Gharb Block, the Kermanshah, Westof Iran. American Journal of Engineering and Applied Sciences, Science Publications, 2020, 13 (1),pp.96-110. �10.3844/ajeassp.2020.96.110�. �hal-02522280�
© 2020 Elham Rahimi, Younes Shekarian, Salman Mastri Farahani, G.h. Reza Asgari and Ali Nakini. This open access
article is distributed under a Creative Commons Attribution (CC-BY) 3.0 license.
American Journal of Engineering and Applied Sciences
Original Research Paper
New Approach in Application of the AHP–Fuzzy TOPSIS
Method in Mineral Potential Mapping of the Natural Bitumen
(Gilsonite): A Case Study from the Gilan-e-Gharb Block, the
Kermanshah, West of Iran
1Elham Rahimi,
1Younes Shekarian,
2Salman Mastri Farahani,
2G.h. Reza Asgari and
2Ali Nakini
1Department of Mineral Engineering, New Mexico Institute of Mining and Technology, Socorro, NM, USA 2Department of Exploration, AMMCO Mining Company, Tehran, Iran
Article history
Received: 13-01-2020
Revised: 10-02-2020
Accepted: 29-02-2020
Corresponding Author:
Younes Shekarian
Department of Mineral
Engineering, New Mexico
Institute of Mining and
Technology, Socorro, NM,
USA Email: [email protected]
Abstract: The Gilan-e-Gharb block is known as a prospective area for
hydrocarbon resources in the form of oil, gas in deep potential and natural
bitumen (Gilsonite) on the surface. Natural bitumen is not clearly
detectable by geochemical or geophysical methods. Hereupon, identifying
high potential areas for further exploration, attempted with the help of
AHP-Fuzzy and TOPSIS methods. The comprehensive database of
geological and geostructural records, satellite imagery analysis by remote
sensing and mine indexes counted as the inputs for this method. First, the
lithological unit as the main mineralization hosts determined with respect to
the dominant geological structures as a factor of controlling natural bitumen
placement (fold, fracture and faults) in the Gilan-e-Gharb block. The
Gachsaran, Asmari, Pabdeh and Gurpi Formations identified as the most
important lithological units for mineralization. Placement and distribution
of natural bitumen mineralization in the form of mine indexes are added to
the geology database. Finally, we assigned appropriate weights to applied
information layers using Analytical Hierarchy Processing (AHP) based on
knowledgeable information and field studies to synthesize exploratory data.
Then, we used the FTOPSIS method to define the Positive Ideal Solution
(FPIS, A+) that allows maximizing the beneficial characteristics and
minimizing the impediment characteristics and the Negative Ideal Solution
(FNIS, A-) that minimizes the beneficial characteristics and maximizes the
impediment characteristics. This method, as a new approach in the exploration
of minerals with a shortage of data, is applicable to other mineral deposits.
Keywords: AHP-Fuzzy, MPM Hierarchy, TOPSIS, Natural Bitumen,
Gilan-e-Gharb Block
Introduction
When crude oil escapes from the depths of the earth
over time and evaporates because of exposure to the
atmosphere, the black mineral known as natural bitumen
or Gilsonite is remained (Pruitt, 1961; Meyer et al.,
2007; Akbari Nasrekani et al., 2018; Rahimi et al.,
2019). This heavy hydrocarbon material is classified into
various groups, such as asphaltic pyrobitumen, non-
asphaltic pyrobitumen, asphaltites, etc. These groups are
divided into different subgroups based on formation,
physical properties, solubility in carbon tetrachloride and
chemical composition. Asphaltites are categorized into
three groups of Gilsonite, Grahamite and Glance pitch
(Rahimi et al., 2019). Gilsonite is one of the highest
qualities and the most desirable type of bitumen, which
is observed in terms of liquid, semi-solid and solid
according to its purity and life span. Based on the
aforementioned features of this mineral, many industries
benefit by the use of natural bitumen in the fields of
asphalt binder, road paving, pigment, waterproof
coating, etc. (Joseph, 1961). Moreover, there are some
elements like trace and rare earth elements into the
natural bitumen and oil sands, which makes them more
valuable as a by-product (Tsoy, 2015; Rahimi et al.,
2016; Shekarian et al., 2017).

Elham Rahimi et al. / American Journal of Engineering and Applied Sciences 2020, 13 (1): 96.110 DOI: 10.3844/ajeassp.2020.96.110
97
The largest reserves of natural bitumen mines are
located in the United States, Canada, Iran, Iraq, Russia,
Venezuela, China, Australia, Mexico, Albania and the
Philippines, respectively (Pruitt, 1961; Meyer et al.,
2007). In the US, the largest Gilsonite reserves have
been found in Utah and Colorado and are estimated to
have a reserve of 45 million tons, according to the US
Geological Survey (Pruitt, 1961). Iran seems to be the
third-largest natural bitumen reserve in the world, with
around 15% of these reserves (Meyer et al., 2007;
Rahimi et al., 2019).
Delineating prospective zones within an area of
interest as the main purpose of mineral exploration is the
initial step of discovering minable deposits in the
development process (Parsa et al., 2017; Ghezelbash et al.,
2019). Numerous spatial datasets compiled, analyzed
and integrated into a geographic information system in
order to provide a model of mineralization in an area
(Abedi et al., 2012a). A predictive model of prospective
zones is resulted by using Mineral Prospectivity
Modeling (MPM), which is a representative Multiple
Criterion Decision-Making (MCDM) function in the area
of interest (Zuo and Carranza, 2011; Abedi et al., 2012b;
Karbalaei Ramezanali et al., 2020).
MCDM is defined as a combination of values that
figured out by researchers in order to decide close to the
actual outcomes. Analytical Hierarchy Process (AHP) is
one of the popular methods of multiple criteria decision-
making for mineral prospectivity modeling (Geranian et al.,
2015; Pazand and Hezarkhani, 2015; Abedi and Norouzi,
2016). The typical of AHP is to make a set of criteria
and weight methodically based on their importance. In
this procedure, parameters measured according to the
aforementioned produced criteria and a final score is
attributed based on the weight (Abedi and Norouzi,
2016; Asadi et al., 2016; Feizi et al., 2017a).
Fuzzy Technique for Order Preference by Similarity
to Ideal Solution (FTOPSIS) is another method that is
usually used as a comparing approach in parameters
(Dagdeviren et al., 2009; Awasthi et al., 2010; Abedi and
Norouzi, 2016; Asadi et al., 2016; Feizi et al., 2017b).
To achieve the advantages of these two methods, this
paper applies a combination of both AHP-FTOPSIS with
a focus on mapping the high-potential zones of natural
bitumen mineralization in the Zagros fold-thrust belt,
which is a few known for natural bitumen deposit
occurrences. The process of evaluation in this research is
shown in Fig. 1. This diagram illustrates how to reach a
final decision gradually by defining a problem,
introducing choices, determining evaluation criteria and
collecting data to analyze different processing methods
for natural bitumen resources. In the following, the
criteria weight vector is obtained from the AHP method
and for integrating different data sets, the FTOPSIS
algorithm is used in the final steps. TOPSIS operates in
terms of pixels considered as attributed distances to
positive (best alternative) and negative (the worst
alternative) ideal solution (Chen, 2000; Kahraman et al.,
2003; Abedi et al., 2012b). The user chooses ideal
solutions based on the evaluation of existing data. The
simplicity of this method and more importantly, no need
of prior knowledge by the decision-maker considered as
the most significant advantages of this method when
comparing to other MCDM algorithms, such as
ELECTRE (Abedi et al., 2012a) and PROMETHEE
(Abedi and Norouzi, 2016). TOPSIS method requires
the only criteria of the weight vector, unlike other
knowledge-driven algorithms that are determined by
the AHP method. Fuzzy set the theory combined with
the MCDM method that has been extensively used
when dealing with variables (Lee, 2009; Abedi et al.,
2012a; Chai et al., 2013). This methodology provides
a suitable language to manage imprecise criteria that
will be able to integrate the analysis of qualitative and
quantitative factors (Chen et al., 2006; Liao and Kao,
2011; Zouggari and Benyoucef, 2012; Abedi and
Norouzi, 2016).
Fig. 1: Research procedure stages of finding the best evaluation of criteria (Chen, 2000).
Defining problem Introducing choices Determining evaluation criteria
Using AHP to calculate criteria weights Collecting data
Final sorting Using MCDM for FTOPSIS ranking
Elham Rahimi et al. / American Journal of Engineering and Applied Sciences 2020, 13 (1): 96.110 DOI: 10.3844/ajeassp.2020.96.110
98
The integration of AHP and TOPSIS in a fuzzy
environment has not been studied in the field of mineral
prospectivity modeling in the initial exploration of the
natural bitumen deposits. However, there have been
several studies on implementing these methods and their
combination for exploration of ore deposits such as
copper, gold, iron, etc., (Pazand and Hezarkhani, 2015;
Asadi et al., 2016; Feizi et al., 2017a; 2017b). This paper
presents a new technique of combining the proposed
methods using MPM in a fuzzy environment and
examines this method in this case study. The rest of this
paper is organized as follows: In section 2, the
geological setting of the Gilan-e-Gharb block is
provided, especially from the tectonic viewpoint, since
the outcrop of the natural bitumen occurs with structural
geology exposures. In addition, the mining and
mineralization indexes are defined. Moreover, remote
sensing as an important tool for satellite images processing
represents the distinction of stratigraphy and also help to
indicate key beds and lineaments for exploration of this
mineral. In section 3, all the data layers are presented in the
hierarchical structure of the proposed mineral potential
mapping model. In this section, evaluations are made by
different groups of DNs for all data layers, which contain
lithology, mineralization and remote sensing using Expert
Choice Software. For running the AHP analyses, a tool was
written in Excel (Oztaysi et al., 2017) that the linguistic
variables from the Excel-based investigations were
converted into TFNs. Based on these numbers, the priority
weights for the evaluation DNs were derived. The outputs
of the AHP are used as inputs for the Fuzzy TOPSIS
analysis procedure to calculate the CCi values for MPM.
The sensitivity analysis is the last step is also implemented
in Excel. For the different steps of the MCDM process, the
results can be illustrated graphically or in the form of tables.
Finally, based on the priority in criteria weighting, the
Mineral Potential Mapping (MPM) for natural bitumen is
presented. This approach can be developed in the
exploration of a new mineral deposit with a limited
database. In this study, the result of potential natural
bitumen map in the Gilan-e-Gharb block is reported. This
area is one of the most promising zones that has been
studied for natural bitumen a few decades ago. The
objective of this paper is to show AHP-Fuzzy TOPSIS
ability to process relevant data and produce a prospective
map of natural bitumen, thereby, can be used for further
exploration in a mine developing area.
Materials and Methods
Case Study
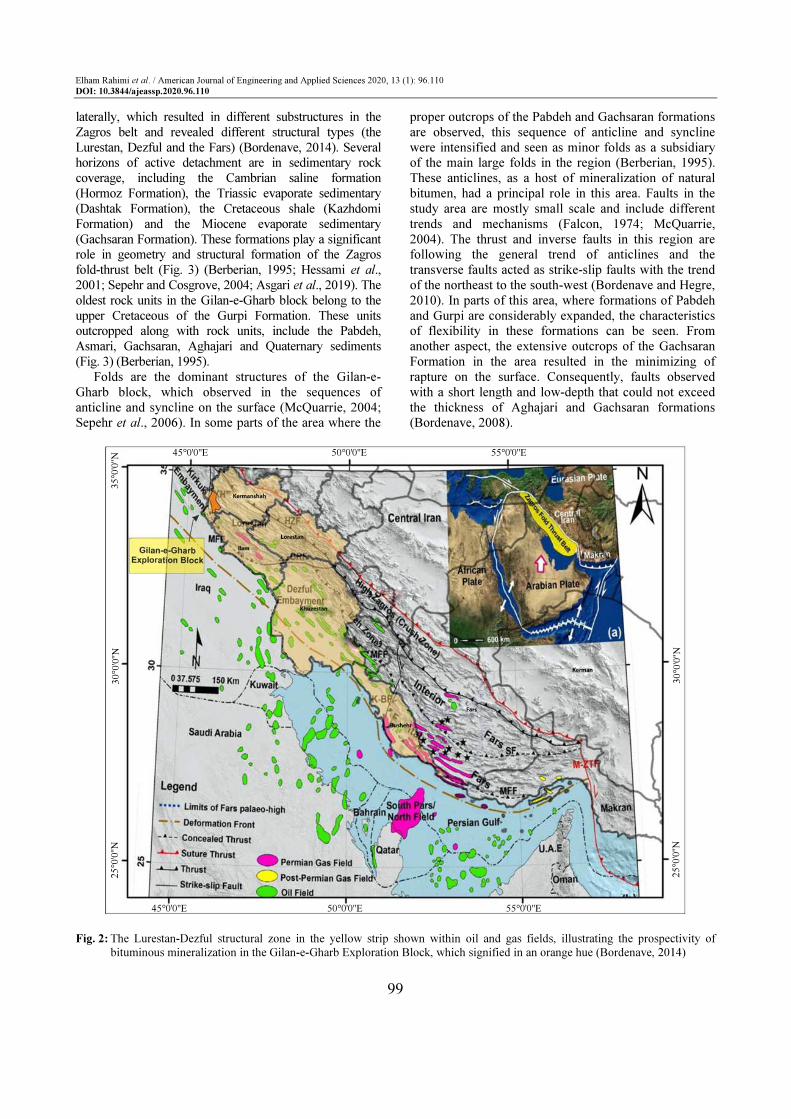
The Gilan-e-Gharb block is located structurally on
the Zagros fold-thrust belt, which includes the east
Lurestan sedimentary basin and the west part of the
Northern Dezful sedimentary basin (Fig. 2) (Rahimi et al.,
2019). This block has an area of 1277 square kilometers
in the Kermanshah province, located between the Qasr-e
Shirin and the Gilan-e-Gharb towns and to the city of the
Sumar southward near to the border of the Ilam province
(Fig. 2). This zone of study includes hydrocarbon
potential surface and deep anomalies, with the
superficial potential, mainly consisted of natural
bitumen, Gilsonite in particular (Rahimi et al., 2019).
The studied area was considered as a part of the
Zagros fold-thrust belt. The bituminous outcrops
demonstrate that this area is affected by structural and
stratigraphical factors. Hydrocarbon materials moved
through the seams and gaps from the bottom to the
surface, which leads to forming oil and bitumen basin
(Meyer et al., 2007; Akbari Nasrekani et al., 2018).
More than 90% of the natural bitumen accumulation
areas are located in the Gilan-e-Gharb block, which
shows the bituminous prospectivity of this zone
(Rahimi et al., 2019).
Geology and Stratigraphy
The Zagros fold-thrust belt is classified into five
tectonic fault zones from northeast to south-west based
on topography and structural morphology, deformation,
evidence, geostructural and regional seismology
(Bordenave, 2014; Asgari et al., 2019). Five tectonic
zones are the high-Zagros thrust belt, folded belt, the
Dezful embayment, the Zagros coastal plain, Persian
Gulf low land and Mesopotamian, which are separated
by deep and discontinuous thrusts (Hessami et al., 2001;
Asgari et al., 2019). The only possibility of exposing
hydrocarbon minerals to the surface is provided with a
folded belt of these five tectonic zones (Sepehr and
Cosgrove, 2004). Fault severity of the high-Zagros
deteriorated formation of the reservoir and buried them
with a thick covering of sediments in the Dezful
embayment, the Zagros coastal plain, the Persian Gulf
low land and Mesopotamian. This impeded hydrocarbon
mineral to be outcropped on the surface, especially
natural bitumen (Falcon, 1974). The Zagros fold-thrust
belt is also divided into various geological regions from
the north-west to south-east: The Lurestan, the Dezful
embayment and the Fars region (Fig. 3) (Sepehr et al.,
2006; Asgari et al., 2019). The stratigraphic and
structural properties in these three geologic regions are
different from each other and created a distinct folding
and structural type (Sepehr and Cosgrove, 2004).
The stratigraphy of the Zagros plays an important role in
the morphology and the main development of the Zagros
structures. Moreover, the thickness of the sedimentary
sequences presents the complexity of its tectonic history.
Major changes can be seen from the sideways in the belt
area which indicates the mechanical stratigraphy is not the
same throughout the Zagros. Hereupon, the physical
properties of the sedimentary rock coverage change
Elham Rahimi et al. / American Journal of Engineering and Applied Sciences 2020, 13 (1): 96.110 DOI: 10.3844/ajeassp.2020.96.110
99
laterally, which resulted in different substructures in the
Zagros belt and revealed different structural types (the
Lurestan, Dezful and the Fars) (Bordenave, 2014). Several
horizons of active detachment are in sedimentary rock
coverage, including the Cambrian saline formation
(Hormoz Formation), the Triassic evaporate sedimentary
(Dashtak Formation), the Cretaceous shale (Kazhdomi
Formation) and the Miocene evaporate sedimentary
(Gachsaran Formation). These formations play a significant
role in geometry and structural formation of the Zagros
fold-thrust belt (Fig. 3) (Berberian, 1995; Hessami et al.,
2001; Sepehr and Cosgrove, 2004; Asgari et al., 2019). The
oldest rock units in the Gilan-e-Gharb block belong to the
upper Cretaceous of the Gurpi Formation. These units
outcropped along with rock units, include the Pabdeh,
Asmari, Gachsaran, Aghajari and Quaternary sediments
(Fig. 3) (Berberian, 1995).
Folds are the dominant structures of the Gilan-e-
Gharb block, which observed in the sequences of
anticline and syncline on the surface (McQuarrie, 2004;
Sepehr et al., 2006). In some parts of the area where the
proper outcrops of the Pabdeh and Gachsaran formations
are observed, this sequence of anticline and syncline
were intensified and seen as minor folds as a subsidiary
of the main large folds in the region (Berberian, 1995).
These anticlines, as a host of mineralization of natural
bitumen, had a principal role in this area. Faults in the
study area are mostly small scale and include different
trends and mechanisms (Falcon, 1974; McQuarrie,
2004). The thrust and inverse faults in this region are
following the general trend of anticlines and the
transverse faults acted as strike-slip faults with the trend
of the northeast to the south-west (Bordenave and Hegre,
2010). In parts of this area, where formations of Pabdeh
and Gurpi are considerably expanded, the characteristics
of flexibility in these formations can be seen. From
another aspect, the extensive outcrops of the Gachsaran
Formation in the area resulted in the minimizing of
rapture on the surface. Consequently, faults observed
with a short length and low-depth that could not exceed
the thickness of Aghajari and Gachsaran formations
(Bordenave, 2008).
Fig. 2: The Lurestan-Dezful structural zone in the yellow strip shown within oil and gas fields, illustrating the prospectivity of
bituminous mineralization in the Gilan-e-Gharb Exploration Block, which signified in an orange hue (Bordenave, 2014)
45°0'0''E 50°0'0''E 55°0'0''E
25
°0
'0''N
3
0°0
'0''N
3
5°0
'0''N
45°0'0''E 50°0'0''E 55°0'0''E
25
°0
'0''N
3
0°0
'0''N
Elham Rahimi et al. / American Journal of Engineering and Applied Sciences 2020, 13 (1): 96.110 DOI: 10.3844/ajeassp.2020.96.110
100
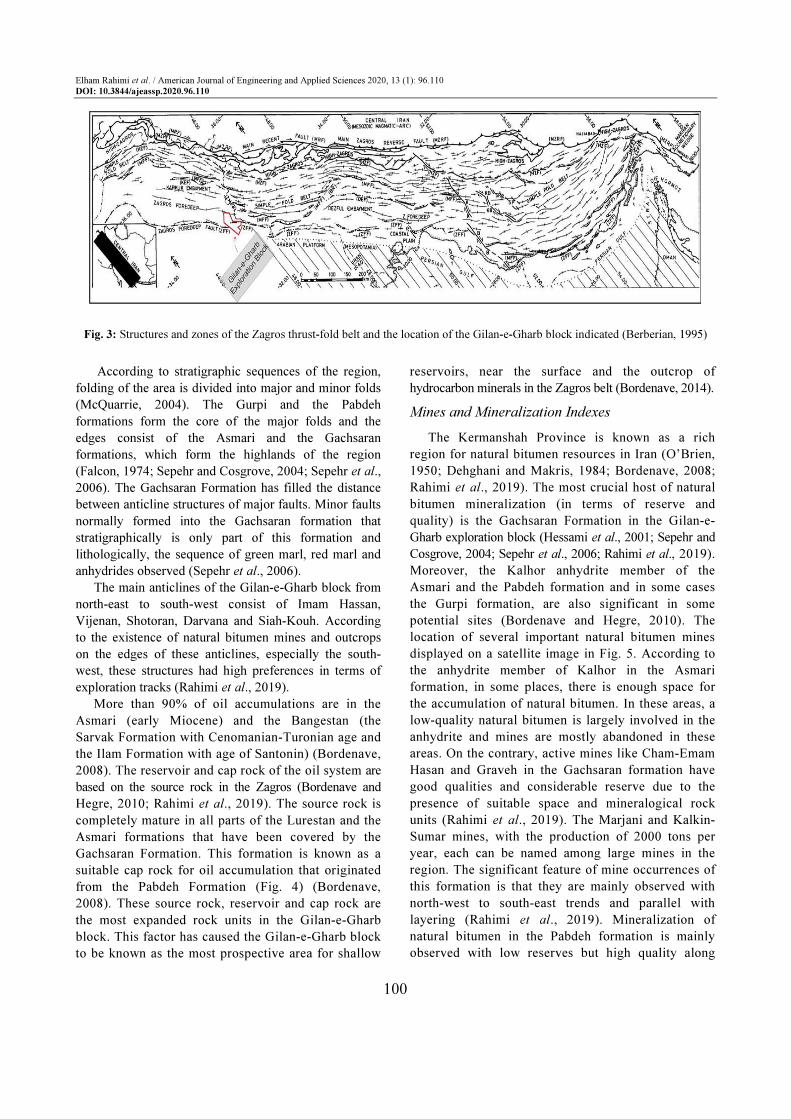
Fig. 3: Structures and zones of the Zagros thrust-fold belt and the location of the Gilan-e-Gharb block indicated (Berberian, 1995)
According to stratigraphic sequences of the region,
folding of the area is divided into major and minor folds
(McQuarrie, 2004). The Gurpi and the Pabdeh
formations form the core of the major folds and the
edges consist of the Asmari and the Gachsaran
formations, which form the highlands of the region
(Falcon, 1974; Sepehr and Cosgrove, 2004; Sepehr et al.,
2006). The Gachsaran Formation has filled the distance
between anticline structures of major faults. Minor faults
normally formed into the Gachsaran formation that
stratigraphically is only part of this formation and
lithologically, the sequence of green marl, red marl and
anhydrides observed (Sepehr et al., 2006).
The main anticlines of the Gilan-e-Gharb block from
north-east to south-west consist of Imam Hassan,
Vijenan, Shotoran, Darvana and Siah-Kouh. According
to the existence of natural bitumen mines and outcrops
on the edges of these anticlines, especially the south-
west, these structures had high preferences in terms of
exploration tracks (Rahimi et al., 2019).
More than 90% of oil accumulations are in the
Asmari (early Miocene) and the Bangestan (the
Sarvak Formation with Cenomanian-Turonian age and
the Ilam Formation with age of Santonin) (Bordenave,
2008). The reservoir and cap rock of the oil system are
based on the source rock in the Zagros (Bordenave and
Hegre, 2010; Rahimi et al., 2019). The source rock is
completely mature in all parts of the Lurestan and the
Asmari formations that have been covered by the
Gachsaran Formation. This formation is known as a
suitable cap rock for oil accumulation that originated
from the Pabdeh Formation (Fig. 4) (Bordenave,
2008). These source rock, reservoir and cap rock are
the most expanded rock units in the Gilan-e-Gharb
block. This factor has caused the Gilan-e-Gharb block
to be known as the most prospective area for shallow
reservoirs, near the surface and the outcrop of
hydrocarbon minerals in the Zagros belt (Bordenave, 2014).
Mines and Mineralization Indexes
The Kermanshah Province is known as a rich
region for natural bitumen resources in Iran (O’Brien,
1950; Dehghani and Makris, 1984; Bordenave, 2008;
Rahimi et al., 2019). The most crucial host of natural
bitumen mineralization (in terms of reserve and
quality) is the Gachsaran Formation in the Gilan-e-
Gharb exploration block (Hessami et al., 2001; Sepehr and
Cosgrove, 2004; Sepehr et al., 2006; Rahimi et al., 2019).
Moreover, the Kalhor anhydrite member of the
Asmari and the Pabdeh formation and in some cases
the Gurpi formation, are also significant in some
potential sites (Bordenave and Hegre, 2010). The
location of several important natural bitumen mines
displayed on a satellite image in Fig. 5. According to
the anhydrite member of Kalhor in the Asmari
formation, in some places, there is enough space for
the accumulation of natural bitumen. In these areas, a
low-quality natural bitumen is largely involved in the
anhydrite and mines are mostly abandoned in these
areas. On the contrary, active mines like Cham-Emam
Hasan and Graveh in the Gachsaran formation have
good qualities and considerable reserve due to the
presence of suitable space and mineralogical rock
units (Rahimi et al., 2019). The Marjani and Kalkin-
Sumar mines, with the production of 2000 tons per
year, each can be named among large mines in the
region. The significant feature of mine occurrences of
this formation is that they are mainly observed with
north-west to south-east trends and parallel with
layering (Rahimi et al., 2019). Mineralization of
natural bitumen in the Pabdeh formation is mainly
observed with low reserves but high quality along
Elham Rahimi et al. / American Journal of Engineering and Applied Sciences 2020, 13 (1): 96.110 DOI: 10.3844/ajeassp.2020.96.110
101
with the transverse fractures. Among mines mentioned
in Fig. 5, the Babre-soukhteh mine found in the
Pabdeh formation.
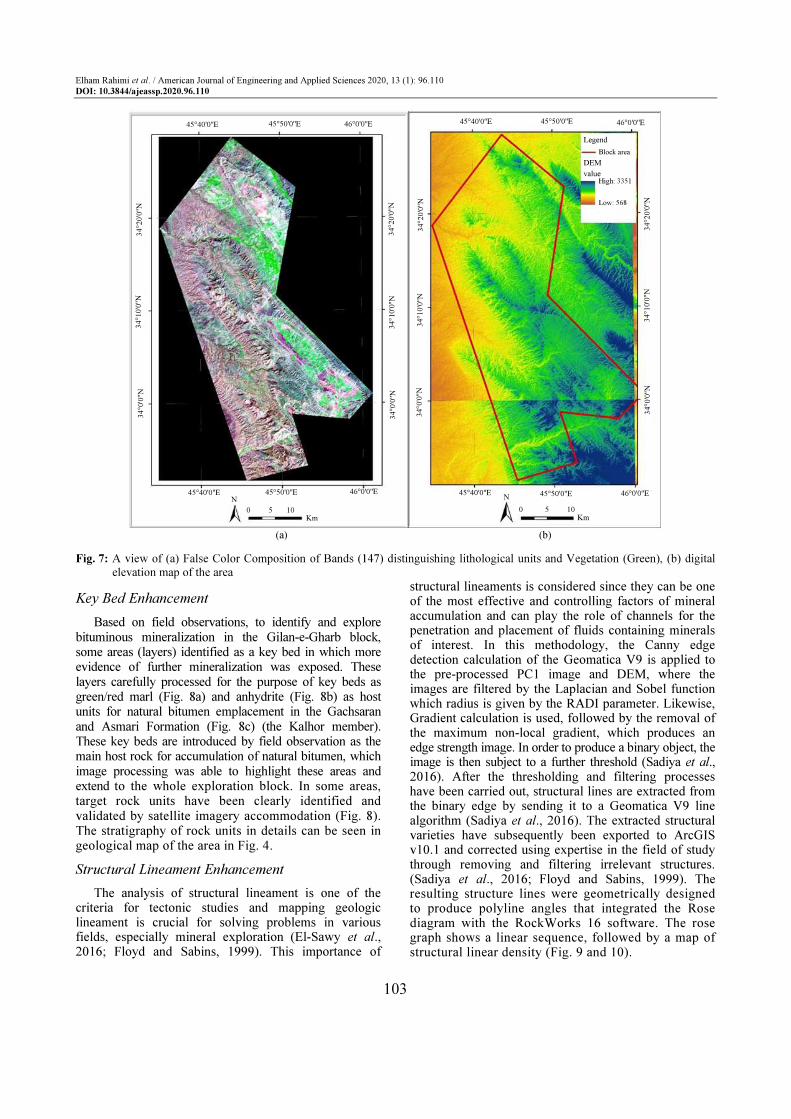
Remote Sensing Processing
One of the challenges in natural bitumen
exploration is having no outcrops and located in the
lower layers, which, if there are fractures and related
structures, can reach the surface. According to field
observations, most of these natural bitumen mines are
located mainly in the Gachsaran Formation, the
anhydritic part of the Asmari Formation (Kalhor
member), the boundary of Asmari and Gachsaran
Formations and to a smaller extent in the Pabdeh,
Gurpi and Aghajari Formations. Many fractures are
observed in the above-mentioned units, while the
major mines of the region have been developed and
exploited along with these fractures. In this section,
the determination of the range and extension of these
susceptible units are considered. In addition, the
identification of structural factors, including faults
and fractures as structural controllers of bituminous
mineralization, is presented as a result of satellite
image processing using ENVI 4.3 software (Fig. 6).
The philosophy utilized in this part is shown in the
above flowchart. This provides a well-ordered
breakdown of the stages needed to achieve the desired
outcome. To process satellite images using ENVI 4.3
software, Landsat 7 ETM+ containing six bands and
10m DEM was obtained from the GSI (Fig. 7). The
image was geometrically projected to UTM Zone 38N
and WGS-84 in order to avoid distortion and then
converted to radiance from Digital value (DN). The
view of the geological rock unit boundaries, such as
the Gachsaran and Asmari Formation, are recognized
and differentiated by the composition of bands. It
should be noted that validation of results from remote
sensing processing was carried out by 1: 100,000
geologic maps of the exploration area provided by the
GSI (Fig. 7).
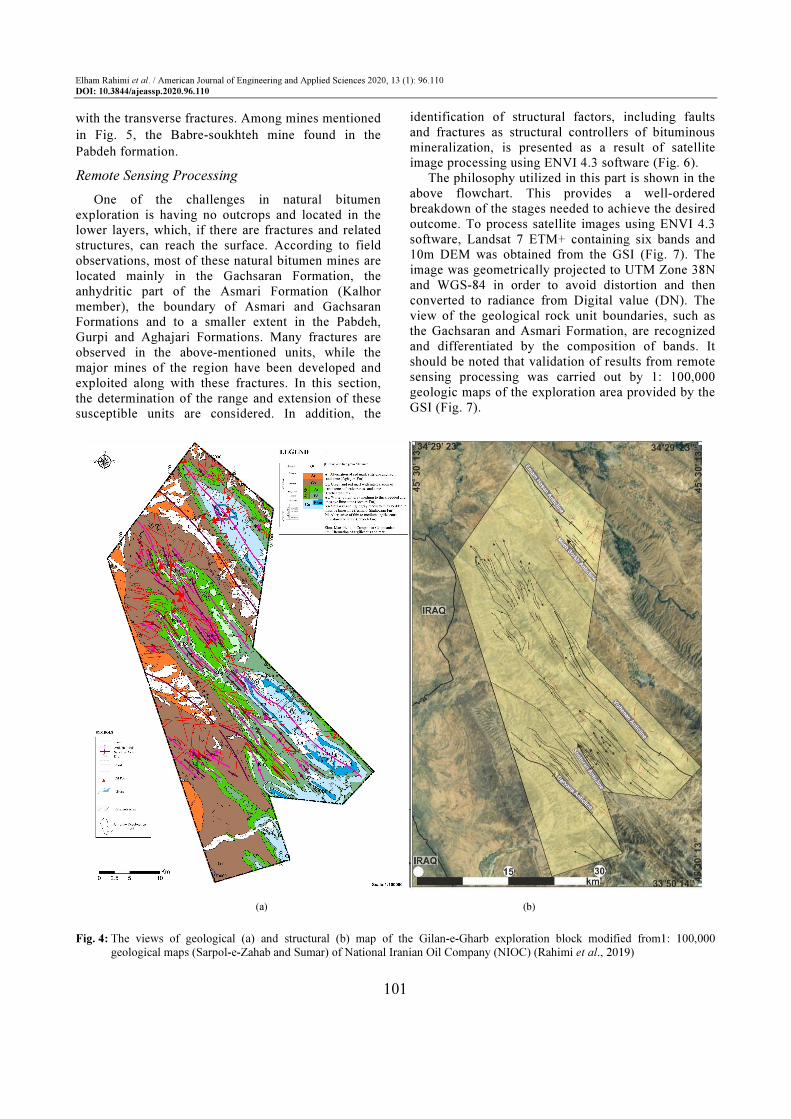
(a) (b)
Fig. 4: The views of geological (a) and structural (b) map of the Gilan-e-Gharb exploration block modified from1: 100,000
geological maps (Sarpol-e-Zahab and Sumar) of National Iranian Oil Company (NIOC) (Rahimi et al., 2019)
Elham Rahimi et al. / American Journal of Engineering and Applied Sciences 2020, 13 (1): 96.110 DOI: 10.3844/ajeassp.2020.96.110
102
Fig. 5: The biggest major natural bitumen mines in the Gilan-e-Gharb Block listed on the right top that roughly produce more than
30,000 tons per year (Rahimi et al., 2019)
Fig. 6: Flow chart of lineament and bands combination analysis by remote sensing processing
Classification of
lineament by
density
ArcMap10.6.1 Geomatica ENVI 4.3
Edge detection
(thresholding)
Lineament
extraction
Correction and
computation
Pre-processing
(landsat 7
ETM+)
Band
combinations
(RGB)
Key bed
detection
Line
filtering
Elham Rahimi et al. / American Journal of Engineering and Applied Sciences 2020, 13 (1): 96.110 DOI: 10.3844/ajeassp.2020.96.110
103
(a) (b) Fig. 7: A view of (a) False Color Composition of Bands (147) distinguishing lithological units and Vegetation (Green), (b) digital
elevation map of the area
Key Bed Enhancement
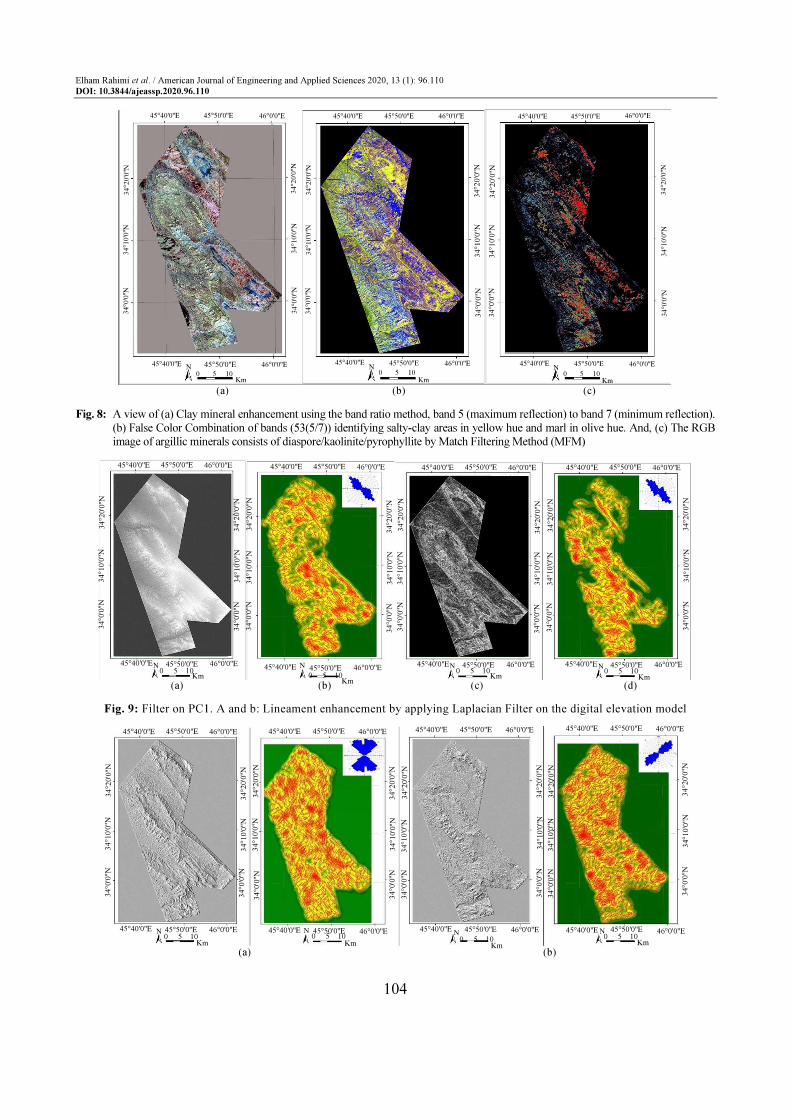
Based on field observations, to identify and explore bituminous mineralization in the Gilan-e-Gharb block, some areas (layers) identified as a key bed in which more evidence of further mineralization was exposed. These layers carefully processed for the purpose of key beds as green/red marl (Fig. 8a) and anhydrite (Fig. 8b) as host units for natural bitumen emplacement in the Gachsaran and Asmari Formation (Fig. 8c) (the Kalhor member). These key beds are introduced by field observation as the main host rock for accumulation of natural bitumen, which image processing was able to highlight these areas and extend to the whole exploration block. In some areas, target rock units have been clearly identified and validated by satellite imagery accommodation (Fig. 8). The stratigraphy of rock units in details can be seen in geological map of the area in Fig. 4.
Structural Lineament Enhancement
The analysis of structural lineament is one of the criteria for tectonic studies and mapping geologic lineament is crucial for solving problems in various fields, especially mineral exploration (El-Sawy et al., 2016; Floyd and Sabins, 1999). This importance of
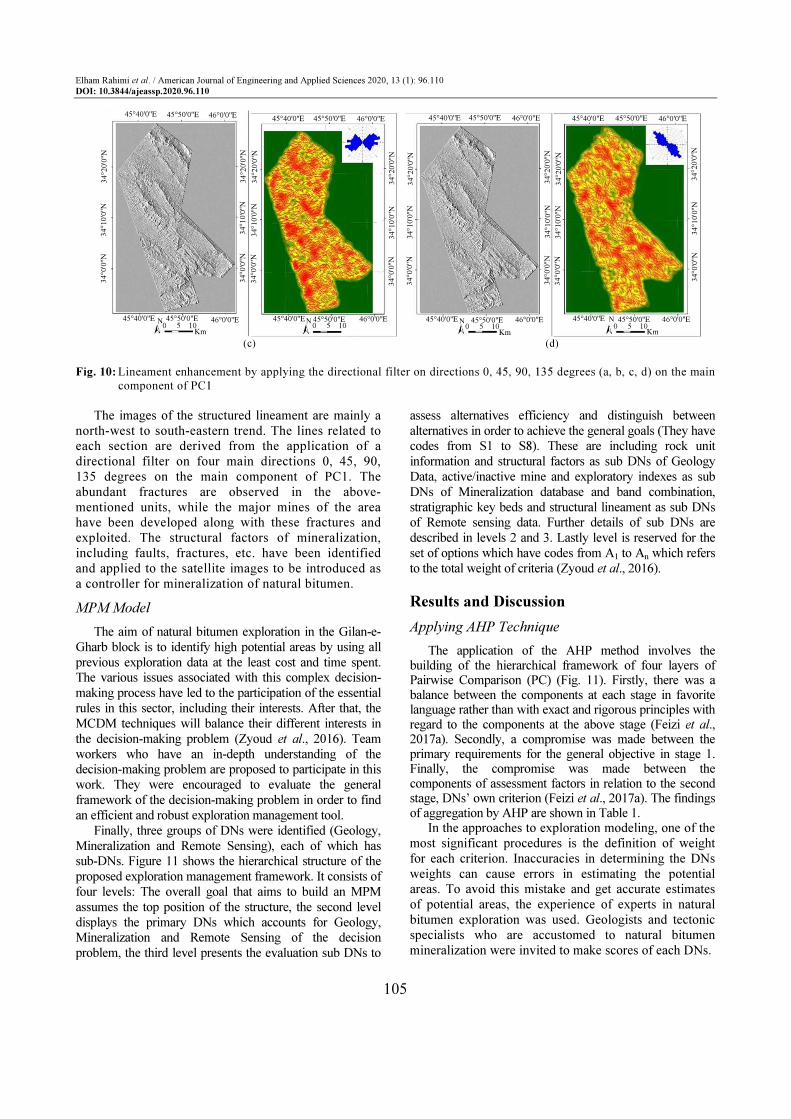
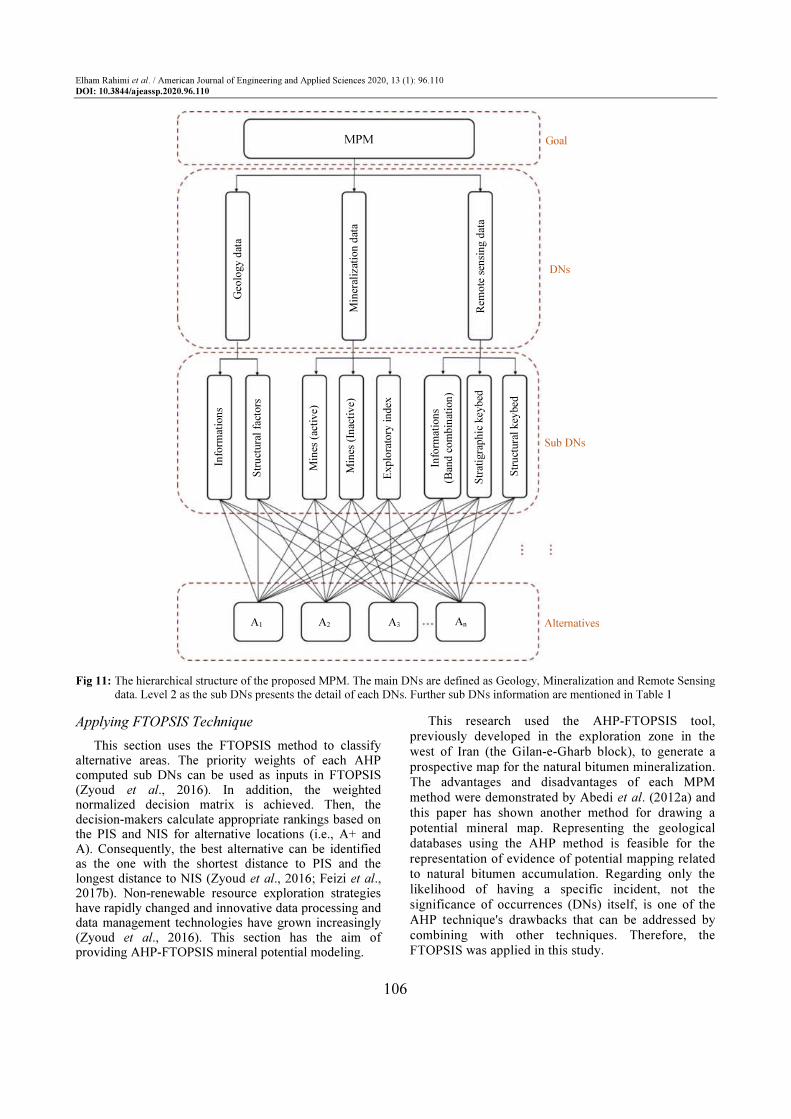
structural lineaments is considered since they can be one of the most effective and controlling factors of mineral accumulation and can play the role of channels for the penetration and placement of fluids containing minerals of interest. In this methodology, the Canny edge detection calculation of the Geomatica V9 is applied to the pre-processed PC1 image and DEM, where the images are filtered by the Laplacian and Sobel function which radius is given by the RADI parameter. Likewise, Gradient calculation is used, followed by the removal of the maximum non-local gradient, which produces an edge strength image. In order to produce a binary object, the image is then subject to a further threshold (Sadiya et al., 2016). After the thresholding and filtering processes have been carried out, structural lines are extracted from the binary edge by sending it to a Geomatica V9 line algorithm (Sadiya et al., 2016). The extracted structural varieties have subsequently been exported to ArcGIS v10.1 and corrected using expertise in the field of study through removing and filtering irrelevant structures. (Sadiya et al., 2016; Floyd and Sabins, 1999). The resulting structure lines were geometrically designed to produce polyline angles that integrated the Rose diagram with the RockWorks 16 software. The rose graph shows a linear sequence, followed by a map of structural linear density (Fig. 9 and 10).
0 5 10
34°0'0
''N
34°10'0
''N
34°20'0
''N
34°0'0
''N
34°10'0
''N
34°20'0
''N
45°40'0''E 46°0'0''E 45°50'0''E
Km
46°0'0''E 45°40'0''E 45°50'0''E
34°0'0
''N
34°10'0
''N
34°20'0
''N
34°0'0
''N
34°10'0
''N
34°20'0
''N
45°40'0''E 46°0'0''E 45°50'0''E
46°0'0''E 45°40'0''E 45°50'0''E
0 5 10 Km
N N
Legend
DEM
value
Block area
High: 3351
Low: 568
Elham Rahimi et al. / American Journal of Engineering and Applied Sciences 2020, 13 (1): 96.110 DOI: 10.3844/ajeassp.2020.96.110
104
(a) (b) (c)
Fig. 8: A view of (a) Clay mineral enhancement using the band ratio method, band 5 (maximum reflection) to band 7 (minimum reflection).
(b) False Color Combination of bands (53(5/7)) identifying salty-clay areas in yellow hue and marl in olive hue. And, (c) The RGB
image of argillic minerals consists of diaspore/kaolinite/pyrophyllite by Match Filtering Method (MFM)
(a) (b) (c) (d)
Fig. 9: Filter on PC1. A and b: Lineament enhancement by applying Laplacian Filter on the digital elevation model
(a) (b)
46°0'0''E 45°40'0''E 45°50'0''E 46°0'0''E 45°50'0''E 45°40'0''E
34°0'0
''N
34°10'0
''N
34°20'0
''N
45°40'0''E 46°0'0''E 45°50'0''E 0 5 10
Km
34°0'0
''N
34°10'0
''N
34°20'0
''N
46°0'0''E 45°50'0''E 45°40'0''E 46°0'0''E 45°50'0''E 45°40'0''E
45°40'0''E 46°0'0''E 45°50'0''E 0 5 10
Km
34°0'0
''N
34°10'0
''N
34°20'0
''N
34°0'0
''N
34°10'0
''N
34°20'0
''N
34°0'0
''N
34°10'0
''N
34°20'0
''N
34°0'0
''N
34°10'0
''N
34°20'0
''N
34°0'0
''N
34°10'0
''N
34°20'0
''N
34°0'0
''N
34°10'0
''N
34°20'0
''N
Km 0 5 10
45°40'0''E 46°0'0''E 45°50'0''E 45°40'0''E 46°0'0''E 45°50'0''E
Km 0 5 10
46°0'0''E 45°40'0''E 45°50'0''E
34°0'0
''N
34°10'0
''N
34°20'0
''N
45°40'0''E 46°0'0''E 45°50'0''E 0 5 10
Km
34°0'0
''N
34°10'0
''N
34°20'0
''N
46°0'0''E 45°40'0''E 45°50'0''E
34°0'0
''N
34°10'0
''N
34°20'0
''N
45°40'0''E 46°0'0''E 45°50'0''E 0 5 10
Km
34°0'0
''N
34°10'0
''N
34°20'0
''N
46°0'0''E 45°40'0''E 45°50'0''E
34°0'0
''N
34°10'0
''N
34°20'0
''N
45°40'0''E 46°0'0''E 45°50'0''E 0 5 10
Km
34°0'0
''N
34°10'0
''N
34°20'0
''N
46°0'0''E 45°40'0''E 45°50'0''E
34°0'0
''N
34°10'0
''N
34°20'0
''N
45°40'0''E 46°0'0''E 45°50'0''E 0 5 10
Km 34°0'0
''N
34°10'0
''N
34°20'0
''N
46°0'0''E 45°40'0''E 45°50'0''E
34°0'0
''N
34°10'0
''N
34°20'0
''N
45°40'0''E 46°0'0''E 45°50'0''E
0 5 10
Km
34°0'0
''N
34°10'0
''N
34°20'0
''N
0 5 10 0 5 10
46°0'0''E 45°40'0''E 45°50'0''E
45°40'0''E 46°0'0''E 45°50'0''E
34°0'0
''N
34°10'0
''N
34°20'0
''N
34°0'0
''N
34°10'0
''N
34°20'0
''N
34°0'0
''N
34°10'0
''N
34°20'0
''N
34°0'0
''N
34°10'0
''N
34°20'0
''N
45°40'0''E 46°0'0''E 45°50'0''E
Km Km Km
46°0'0''E 45°40'0''E 45°50'0''E
N N N
N N N N
N N N N
Elham Rahimi et al. / American Journal of Engineering and Applied Sciences 2020, 13 (1): 96.110 DOI: 10.3844/ajeassp.2020.96.110
105
(c) (d)
Fig. 10: Lineament enhancement by applying the directional filter on directions 0, 45, 90, 135 degrees (a, b, c, d) on the main
component of PC1
The images of the structured lineament are mainly a
north-west to south-eastern trend. The lines related to
each section are derived from the application of a
directional filter on four main directions 0, 45, 90,
135 degrees on the main component of PC1. The
abundant fractures are observed in the above-
mentioned units, while the major mines of the area
have been developed along with these fractures and
exploited. The structural factors of mineralization,
including faults, fractures, etc. have been identified
and applied to the satellite images to be introduced as
a controller for mineralization of natural bitumen.
MPM Model
The aim of natural bitumen exploration in the Gilan-e-
Gharb block is to identify high potential areas by using all
previous exploration data at the least cost and time spent.
The various issues associated with this complex decision-
making process have led to the participation of the essential
rules in this sector, including their interests. After that, the
MCDM techniques will balance their different interests in
the decision-making problem ( Zyoud et al., 2016). Team
workers who have an in-depth understanding of the
decision-making problem are proposed to participate in this
work. They were encouraged to evaluate the general
framework of the decision-making problem in order to find
an efficient and robust exploration management tool.
Finally, three groups of DNs were identified (Geology,
Mineralization and Remote Sensing), each of which has
sub-DNs. Figure 11 shows the hierarchical structure of the
proposed exploration management framework. It consists of
four levels: The overall goal that aims to build an MPM
assumes the top position of the structure, the second level
displays the primary DNs which accounts for Geology,
Mineralization and Remote Sensing of the decision
problem, the third level presents the evaluation sub DNs to
assess alternatives efficiency and distinguish between
alternatives in order to achieve the general goals (They have
codes from S1 to S8). These are including rock unit
information and structural factors as sub DNs of Geology
Data, active/inactive mine and exploratory indexes as sub
DNs of Mineralization database and band combination,
stratigraphic key beds and structural lineament as sub DNs
of Remote sensing data. Further details of sub DNs are
described in levels 2 and 3. Lastly level is reserved for the
set of options which have codes from A1 to An which refers
to the total weight of criteria ( Zyoud et al., 2016).
Results and Discussion
Applying AHP Technique
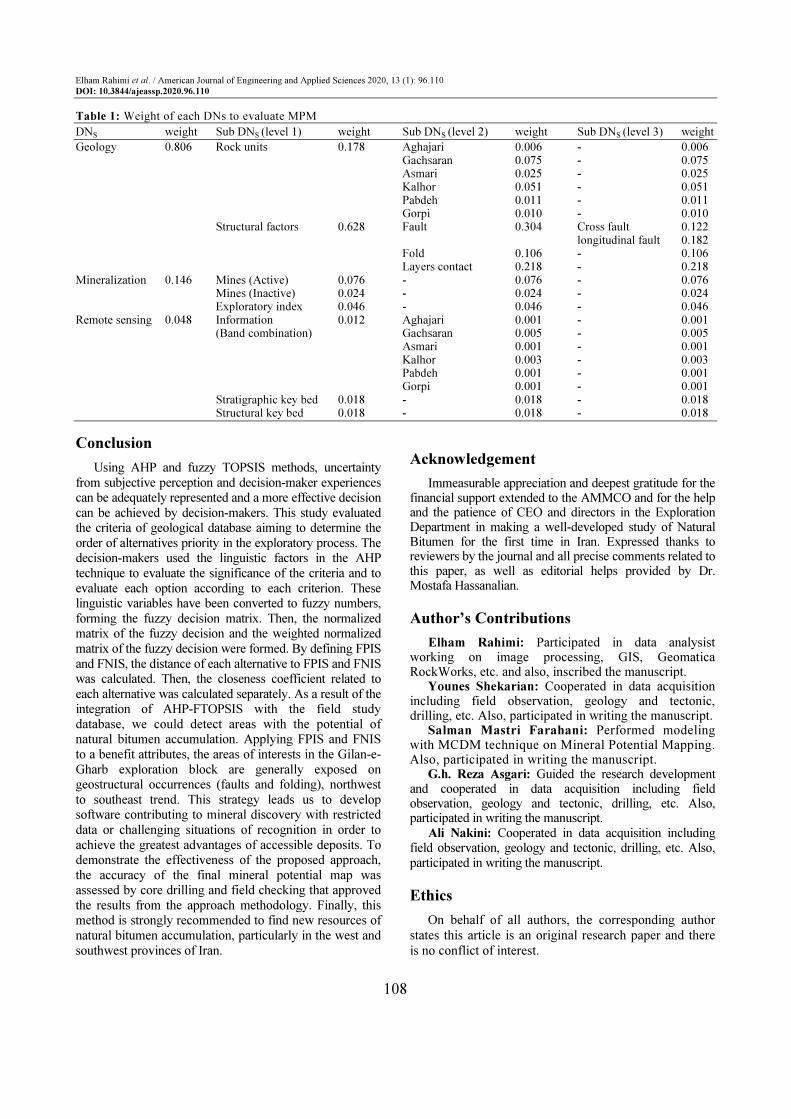
The application of the AHP method involves the building of the hierarchical framework of four layers of Pairwise Comparison (PC) (Fig. 11). Firstly, there was a balance between the components at each stage in favorite language rather than with exact and rigorous principles with regard to the components at the above stage (Feizi et al., 2017a). Secondly, a compromise was made between the primary requirements for the general objective in stage 1. Finally, the compromise was made between the components of assessment factors in relation to the second stage, DNs’ own criterion (Feizi et al., 2017a). The findings of aggregation by AHP are shown in Table 1.
In the approaches to exploration modeling, one of the
most significant procedures is the definition of weight
for each criterion. Inaccuracies in determining the DNs
weights can cause errors in estimating the potential
areas. To avoid this mistake and get accurate estimates
of potential areas, the experience of experts in natural
bitumen exploration was used. Geologists and tectonic
specialists who are accustomed to natural bitumen
mineralization were invited to make scores of each DNs.
45°50'0''E 46°0'0''E
0 5 10 Km
34°0'0
''N
34°10'0
''N
34°20'0
''N
45°40'0''E
46°0'0''E 45°40'0''E 45°50'0''E
34°0'0
''N
34°10'0
''N
34°20'0
''N
46°0'0''E 45°40'0''E
34°20'0
''N
45°50'0''E
34°0'0
''N
34°10'0
''N
34°0'0
''N
34°10'0
''N
34°20'0
''N
45°40'0''E 46°0'0''E 45°50'0''E 0 5 10
Km
46°0'0''E 45°40'0''E
34°20'0
''N
45°50'0''E
34°0'0
''N
34°10'0
''N
45°40'0''E 0 5 10
46°0'0''E 45°50'0''E
34°0'0
''N
34°10'0
''N
34°20'0
''N
45°40'0''E 46°0'0''E 45°50'0''E 0 5 10
Km
46°0'0''E 45°40'0''E 45°50'0''E
34°20'0
''N
34°0'0
''N
34°10'0
''N
34°0'0
''N
34°10'0
''N
34°20'0
''N
N N N N
Elham Rahimi et al. / American Journal of Engineering and Applied Sciences 2020, 13 (1): 96.110 DOI: 10.3844/ajeassp.2020.96.110
106
Fig 11: The hierarchical structure of the proposed MPM. The main DNs are defined as Geology, Mineralization and Remote Sensing
data. Level 2 as the sub DNs presents the detail of each DNs. Further sub DNs information are mentioned in Table 1
Applying FTOPSIS Technique
This section uses the FTOPSIS method to classify alternative areas. The priority weights of each AHP computed sub DNs can be used as inputs in FTOPSIS (Zyoud et al., 2016). In addition, the weighted normalized decision matrix is achieved. Then, the decision-makers calculate appropriate rankings based on the PIS and NIS for alternative locations (i.e., A+ and A). Consequently, the best alternative can be identified as the one with the shortest distance to PIS and the longest distance to NIS (Zyoud et al., 2016; Feizi et al., 2017b). Non-renewable resource exploration strategies have rapidly changed and innovative data processing and data management technologies have grown increasingly (Zyoud et al., 2016). This section has the aim of providing AHP-FTOPSIS mineral potential modeling.
This research used the AHP-FTOPSIS tool,
previously developed in the exploration zone in the
west of Iran (the Gilan-e-Gharb block), to generate a
prospective map for the natural bitumen mineralization.
The advantages and disadvantages of each MPM
method were demonstrated by Abedi et al. (2012a) and
this paper has shown another method for drawing a
potential mineral map. Representing the geological
databases using the AHP method is feasible for the
representation of evidence of potential mapping related
to natural bitumen accumulation. Regarding only the
likelihood of having a specific incident, not the
significance of occurrences (DNs) itself, is one of the
AHP technique's drawbacks that can be addressed by
combining with other techniques. Therefore, the
FTOPSIS was applied in this study.
A1 A2 A3 An
Inform
ations
Structural factors
Mines (active)
Mines (Inactive)
Exploratory index
Inform
ations
(Ban
d combination)
Stratigraphic key
bed
Structural key
bed
Alternatives
Sub DNs
Geo
logy data
Mineralization data
Rem
ote sen
sing data
DNs
MPM Goal
Elham Rahimi et al. / American Journal of Engineering and Applied Sciences 2020, 13 (1): 96.110 DOI: 10.3844/ajeassp.2020.96.110
107
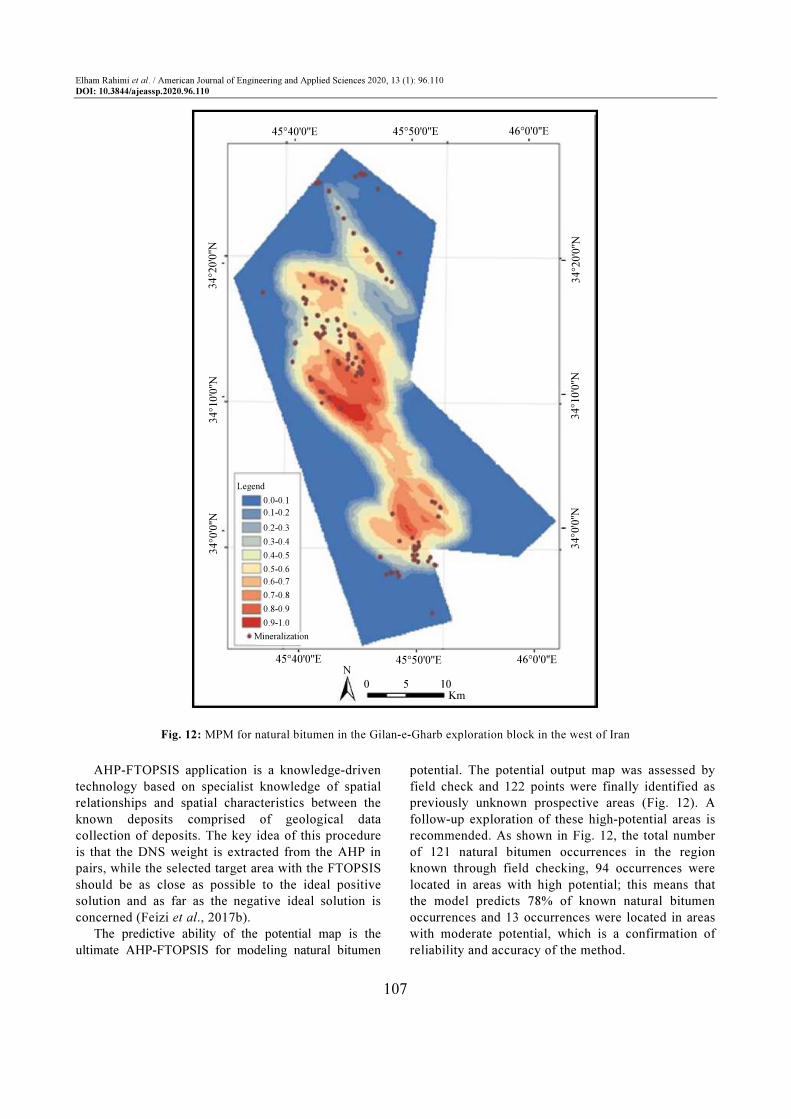
Fig. 12: MPM for natural bitumen in the Gilan-e-Gharb exploration block in the west of Iran
AHP-FTOPSIS application is a knowledge-driven
technology based on specialist knowledge of spatial
relationships and spatial characteristics between the
known deposits comprised of geological data
collection of deposits. The key idea of this procedure
is that the DNS weight is extracted from the AHP in
pairs, while the selected target area with the FTOPSIS
should be as close as possible to the ideal positive
solution and as far as the negative ideal solution is
concerned (Feizi et al., 2017b).
The predictive ability of the potential map is the
ultimate AHP-FTOPSIS for modeling natural bitumen
potential. The potential output map was assessed by
field check and 122 points were finally identified as
previously unknown prospective areas (Fig. 12). A
follow-up exploration of these high-potential areas is
recommended. As shown in Fig. 12, the total number
of 121 natural bitumen occurrences in the region
known through field checking, 94 occurrences were
located in areas with high potential; this means that
the model predicts 78% of known natural bitumen
occurrences and 13 occurrences were located in areas
with moderate potential, which is a confirmation of
reliability and accuracy of the method.
45°40'0''E 45°50'0''E 46°0'0''E N
0 5 10 Km
Mineralization
0.0-0.1
0.1-0.2
0.2-0.3
0.3-0.4
0.4-0.5
0.5-0.6
0.6-0.7
0.7-0.8
0.8-0.9
0.9-1.0
Legend
34°0'0''N
34°10'0''N
34°20'0''N
45°40'0''E 45°50'0''E 46°0'0''E
34°0'0''N
34°10'0''N
34°20'0''N
Elham Rahimi et al. / American Journal of Engineering and Applied Sciences 2020, 13 (1): 96.110 DOI: 10.3844/ajeassp.2020.96.110
108
Table 1: Weight of each DNs to evaluate MPM
DNS weight Sub DNS (level 1) weight Sub DNS (level 2) weight Sub DNS (level 3) weight
Geology 0.806 Rock units 0.178 Aghajari 0.006 - 0.006 Gachsaran 0.075 - 0.075 Asmari 0.025 - 0.025 Kalhor 0.051 - 0.051 Pabdeh 0.011 - 0.011 Gorpi 0.010 - 0.010 Structural factors 0.628 Fault 0.304 Cross fault 0.122 longitudinal fault 0.182 Fold 0.106 - 0.106 Layers contact 0.218 - 0.218 Mineralization 0.146 Mines (Active) 0.076 - 0.076 - 0.076 Mines (Inactive) 0.024 - 0.024 - 0.024 Exploratory index 0.046 - 0.046 - 0.046 Remote sensing 0.048 Information 0.012 Aghajari 0.001 - 0.001 (Band combination) Gachsaran 0.005 - 0.005 Asmari 0.001 - 0.001 Kalhor 0.003 - 0.003 Pabdeh 0.001 - 0.001 Gorpi 0.001 - 0.001 Stratigraphic key bed 0.018 - 0.018 - 0.018 Structural key bed 0.018 - 0.018 - 0.018
Conclusion
Using AHP and fuzzy TOPSIS methods, uncertainty
from subjective perception and decision-maker experiences can be adequately represented and a more effective decision
can be achieved by decision-makers. This study evaluated the criteria of geological database aiming to determine the
order of alternatives priority in the exploratory process. The decision-makers used the linguistic factors in the AHP
technique to evaluate the significance of the criteria and to
evaluate each option according to each criterion. These linguistic variables have been converted to fuzzy numbers,
forming the fuzzy decision matrix. Then, the normalized matrix of the fuzzy decision and the weighted normalized
matrix of the fuzzy decision were formed. By defining FPIS
and FNIS, the distance of each alternative to FPIS and FNIS was calculated. Then, the closeness coefficient related to
each alternative was calculated separately. As a result of the integration of AHP-FTOPSIS with the field study
database, we could detect areas with the potential of natural bitumen accumulation. Applying FPIS and FNIS
to a benefit attributes, the areas of interests in the Gilan-e-
Gharb exploration block are generally exposed on geostructural occurrences (faults and folding), northwest
to southeast trend. This strategy leads us to develop software contributing to mineral discovery with restricted
data or challenging situations of recognition in order to
achieve the greatest advantages of accessible deposits. To demonstrate the effectiveness of the proposed approach,
the accuracy of the final mineral potential map was assessed by core drilling and field checking that approved
the results from the approach methodology. Finally, this method is strongly recommended to find new resources of
natural bitumen accumulation, particularly in the west and
southwest provinces of Iran.
Acknowledgement
Immeasurable appreciation and deepest gratitude for the financial support extended to the AMMCO and for the help and the patience of CEO and directors in the Exploration Department in making a well-developed study of Natural Bitumen for the first time in Iran. Expressed thanks to reviewers by the journal and all precise comments related to this paper, as well as editorial helps provided by Dr. Mostafa Hassanalian.
Author’s Contributions
Elham Rahimi: Participated in data analysist working on image processing, GIS, Geomatica RockWorks, etc. and also, inscribed the manuscript. Younes Shekarian: Cooperated in data acquisition
including field observation, geology and tectonic, drilling, etc. Also, participated in writing the manuscript. Salman Mastri Farahani: Performed modeling
with MCDM technique on Mineral Potential Mapping. Also, participated in writing the manuscript. G.h. Reza Asgari: Guided the research development
and cooperated in data acquisition including field observation, geology and tectonic, drilling, etc. Also, participated in writing the manuscript. Ali Nakini: Cooperated in data acquisition including
field observation, geology and tectonic, drilling, etc. Also, participated in writing the manuscript.
Ethics
On behalf of all authors, the corresponding author
states this article is an original research paper and there
is no conflict of interest.
Elham Rahimi et al. / American Journal of Engineering and Applied Sciences 2020, 13 (1): 96.110 DOI: 10.3844/ajeassp.2020.96.110
109
References
Abedi, M. and G.H. Norouzi, 2016. A general
framework of TOPSIS method for integration of
airborne geophysics, satellite imagery, geochemical
and geological data. Int. J. Applied Earth Observ.
Geoinform., 46: 31-44.
DOI: 10.1016/j.jag.2015.11.016
Abedi, M., G.H. Norouzi and N. Fathianpour, 2012a.
Fuzzy outranking approach: A knowledge-driven
method for mineral prospectivity mapping. Int. J.
Applied Earth Observ. Geoinform., 21: 556-567.
DOI: 10.1016/j.jag.2012.07.012
Abedi, M., S.A. Torabi, G.H. Norouzi and G.R.
HamzehElyasi, 2012b. PROMETHEE II: A
knowledge-driven method for copper exploration. J.
Comput. Geosci., 46: 255-263.
DOI: 10.1016/j.cageo.2011.12.012
Akbari Nasrekani, A., M. Nakhaei, K. Naderi, T. Abu-
Lebdeh and E.H. Fini et al., 2018. Gilsonite
modified asphalt for use in pavement construction.
Am. J. Eng. Applied Sci., 11: 444-454.
DOI: 10.3844/ajeassp.2018.444.454
Asadi, H.H., A. Sansoleimani, M. Fatehi and EM.
Carranza, 2016. An AHP–TOPSIS predictive model
for district-scale mapping of Porphyry Cu-Au
potential: A case study from Salafchegan Area
(Central Iran). Natural Resour. Res., 25: 417-429.
DOI: 10.1007/s11053-016-9290-7
Asgari, G.R., F. Ghaemi, B. Soleimany, B. Rahimi and
Y. Shekarian, 2019. Role of incompetent strata and
geometry of faults on the folding mechanism, a case
study: The Karun oil field in the Dezful
Embayment, Iran. Model. Earth Syst. Environ., 5:
1781-1800. DOI: 10.1007/S40808-019-00636-5
Awasthi, A., S.S. Chauhan and S.K. Goyal, 2010. A
fuzzy multicriteria approach for evaluating the
environmental performance of suppliers. Int. J.
Produt. Econ., 126: 370-378.
DOI: 10.1016/J.IJPE.2010.04.029
Berberian, M., 1995. Master “blind” thrust faults hidden
under the Zagros folds active basement tectonics
and surface morphotectonics. Tectonophysics, 241:
193-224. DOI: 10.1016/0040-1951(94)00185-C
Bordenave, M.L. and J.A. Hegre, 2010. Current
distribution of oil and gas fields in the Zagros Fold
Belt of Iran and contiguous offshore as the result of the
petroleum systems. Geol. Society London Special
Public., 330: 291-353. DOI: 10.1144/SP330.14
Bordenave, M.L., 2008. The origin of the Permo-Triassic
gas accumulations in the Iranian Zagros Foldbelt
and contiguous offshore areas: A review of the
Paleozoic petroleum system. J. Petroleum Geol., 31:
3-42. DOI: 10.1111/J.1747-5457.2008.00405.X
Bordenave, M.L., 2014. Petroleum Systems and
Distribution of the Oil and Gas Fields in the Iranian
Part of the Tethyan Region. In: Petroleum Systems
of the Tethyan Region, Marlow, L., C. Kendall and
L. Yose (Eds.), American Association of Petroleum
Geologists, ISBN-13: 9781629812663, pp: 106-106.
Chai, J., N.K. Liu and W.T. Ngai, 2013. Application of
decision-making techniques in supplier selection: A
systematic review of the literature. J. Exp. Syst.
Applic., 40: 3872-3885.
DOI: 10.1016/j.eswa.2012.12.040
Chen, C., 2000. Extensions of the TOPSIS for group
decision-making under fuzzy environment. Fuzzy
Sets Syst. J., 114: 1-9.
DOI: 10.1016/S0165-0114(97)00377-1
Chen, C., C. Lin and S. Huang, 2006. A fuzzy approach for
supplier evaluation and selection. Int. J. Produt. Econ.,
102: 289-301. DOI: 10.1016/J.IJPE.2005.03.009
Dagdeviren, M., S. Yavuz and N. Kilinc, 2009. Weapon
selection using the AHP and TOPSIS methods under
fuzzy environment. Exp. Syst. Applic., 36:
8143-8151. DOI: 10.1016/j.eswa.2008.10.016
Dehghani, G.A. and J. Makris, 1984. The Gravity field
and crustal structure of Iran. Neues Jahrbuch für
Geologie und Paläontologie, 168: 215-229.
DOI: 10.1127/njgpa/168/1984/215
El-Sawy, K., A.M. Ibrahim, M.A. El-Bastawesy and
W.A. El-Saud, 2016. Automated, manual lineaments
extraction and geospatial analysis for Cairo-Suez
district (Northeastern Cairo-Egypt), using remote
sensing and GIS. Int. J. Innov. Sci. Eng. Technol., 3:
2348-7968.
Falcon, N.L., 1974. Southern Iran: The zagros
mountains. Geol. Society London Special Public., 4:
199-211. DOI: 10.1144/GSL.SP.2005.004.01.11
Feizi, F., A. Karbalaei Ramezanali and E. Mansouri,
2017a. Calcic iron skarn prospectivity mapping
based on fuzzy AHP method, a case Study in Varan
area, Markazi province. Iran Geosci. J., 21: 123-136.
DOI: 10.1007/S12303-016-0042-9 Feizi, F., A. Karbalaei Ramezanali and H. Tusi,
2017b. Mineral potential mapping via TOPSIS with hybrid AHP-Shannon entropy weighting of evidence: A case study for porphyry-Cu, farmahin area, markazi province, Iran. Natural Resour. R., 26: 553-570. DOI: 10.1007/S11053-017-9338-3
Floyd, F. and Z. Sabins, 1999. Remote sensing for mineral exploration. Ore Geol. Rev., 14: 157-183. DOI: 10.1016/S0169-1368(99)00007-4
Geranian, H., S.H. Tabatabaei, H.H. Asadi and E.M. Carranza, 2015. Application of discriminant analysis and support vector machine in mapping gold potential areas for further drilling in the Sari-Gunay gold deposit, NW Iran. Natural Resour. Res., 25: 145-159.
DOI: 10.1007/S11053-015-9271-2
Elham Rahimi et al. / American Journal of Engineering and Applied Sciences 2020, 13 (1): 96.110 DOI: 10.3844/ajeassp.2020.96.110
110
Ghezelbash, R., A. Maghsoudi and M. Daviran, 2019.
Prospectivity modeling of porphyry copper deposits:
Recognition of efficient mono-and multi-element
geochemical signatures in the Varzaghan district,
NW Iran. Acta Geochim., 38: 131-144.
DOI: 10.1007/s11631-018-0289-0
Hessami, K., H.A. Koyi, C.J. Talbot, H. Tabasi and E.
Shabanian, 2001. Progressive unconformities within
an evolving foreland fold-thrust belt, the Zagros
Mountains. J. Geol. Society, 158: 969-981.
DOI: 10.1144/0016-764901-007
Joseph, H.B., 1961. Geochemical Exploration for
Gilsonite. 1st Edn., Department of Mining and
Geological Engineering, University of Utah, pp: 84.
Kahraman, C., U. Cebeci and Z. Ulukan, 2003. Multi-
criteria supplier selection using fuzzy. Int. J. Logist.
Manage., 16: 382-394.
DOI: 10.1108/09576050310503367
Karbalaei Ramezanali, A., F. Feizi, A. Jafarirad and M.
Lotfi, 2020. Application of best-worst method and
additive ratio assessment in mineral prospectivity
mapping: A case study of vein-type copper
mineralization in the Kuhsiah-e-Urmak Area, Iran.
Ore Geol. Rev., 117: 103268-103268.
DOI: 10.1016/J.OREGEOREV.2019.103268
Lee, A.H.I., 2009. A fuzzy supplier selection model with
the consideration of benefits, opportunities, costs
and risks. J. Exp. Syst. Applic., 36: 2879-2893.
DOI: 10.1016/J.ESWA.2008.01.045
Liao, C. and H. Kao, 2011. An integrated fuzzy-
TOPSIS and MCGP approach to supplier
selection in supply chain management. J. Exp.
Syst. Applic., 38: 10803-10811.
DOI: 10.1016/J.ESWA.2011.02.031
McQuarrie, N., 2004. Crust scale geometry of the Zagros
fold-thrust belt, Iran. J. Structural Geol., 26:
519-535. DOI: 10.1016/j.jsg.2003.08.009
Meyer, R.F., E.D. Attanasi and P.A. Freeman, 2007.
Heavy oil and natural bitumen resources in
geological basins of the world: U.S. Geol. Survey
Open-File Report.
O’Brien, C.A.E., 1950, Tectonic problems of the oil field
belt of Southwest Iran. Proceedings of 18th
International of Geological Congress, (IGC’ 50),
Great Britain, pp: 45-58. Oztaysi, B., S.C. Onar, K. Goztepe and C. Kahraman,
2017. Evaluation of research proposals for grant funding using interval-valued intuitionistic fuzzy sets. Soft Comput. J., 21: 1203-1218.
DOI: 10.1007/s00500-015-1853-8 Parsa, M., A. Maghsoudi and M. Yousefi, 2017. An
improved data-driven fuzzy mineral prospectivity mapping procedure; cosine amplitude-based similarity approach to delineate exploration targets. Int. J. Applied Earth Observ. Geoinform., 58: 157-167. DOI: 10.1016/j.jag.2017.02.006
Pazand, K. and A. Hezarkhani, 2015. Porphyry Cu
potential area selection using the combine AHP-
TOPSIS methods: A case study in Siahrud area
(NW, Iran). Earth Sci. Inform., 8: 207-220.
DOI: 10.1007/S12145-014-0153-7
Pruitt, RE., 1961. The mineral resources of Uintah
county. Salt Lake City: Utah geological and
mineralogical survey. Bulletin, 71: 1-105.
Rahimi, E., A. Maghsoudi and A. Hezarkhani, 2016.
Geochemical investigation and statistical analysis
on rare earth elements in Lakeh Siyah deposit,
Bafq District. J. Afr. Earth Sci., 124: 139-150.
DOI: 10.1016/j.jafrearsci.2016.09.001
Rahimi, E., G.H.R. Asgari, Y. Shekarian and A. Nakini,
2019. Investigations of natural bitumen
mineralization in the Gilan-e-Gharb exploration
block, Iran. Int. J. Eng. Sci., 8: 55-68.
DOI: 10.9790/1813-0805015568.
Sadiya, T.B., A. Abdulrahman, A. Sadiq, H.M. Vaatyough
and A.T. Ibrahim et al., 2016. Lineaments extraction
from remote sensing data for detection of hydrothermal
alteration zones in Northern Nigeria. IOSR J. Environ.
Sci. Toxicol. Food Technol., 10: 17-22.
DOI: 10.9790/2402-1004031722
Sepehr, M. and J.W. Cosgrove, 2004. Structural
framework of the Zagros fold-thrust Belt, Iran. J.
Marine Petroleum Geol., 21: 829-843.
DOI: 10.1016/j.marpetgeo.2003.07.006
Sepehr, M., J. Cosgrove and M. Moieni, 2006. The impact
of cover rock rheology on the style of folding in the
Zagros fold-thrust belt. Tectonophysics, 427: 265-281.
DOI: 10.1016/j.tecto.2006.05.021
Shekarian, Y., A. Hezarkhani, N.N. Anaraki and A.N.
Hassani, 2017. Geochemistry and petrography of
REE-bearing Fe-oxide assemblages in Choghart
iron deposit, Yazd, Iran. Arab J. Geosci., 10:
1866-7538. DOI: 10.1007/S12517-017-2986-0
Tsoy, K.S., 2015. Rare earth elements and high molecular
weight oil compounds. Modern Applied Sci., 9:
211-222. DOI: 10.5539/mas.v9n1p211
Zouggari, A. and L. Benyoucef, 2012. Simulation-based
fuzzy TOPSIS approach for group multi-criteria
supplier selection. J. Eng. Applic. Artificial Intell., 25:
507-519. DOI: 10.1016/J.ENGAPPAI.2011.10.012
Zuo, R. and E.M. Carranza, 2011. Support vector
machine: A tool for mapping mineral prospectivity.
Comput. Geosci., 37: 1967-1975.
DOI: 10.1016/j.cageo.2010.09.014
Zyoud, S.H., L.G. Kaufmann, H. Shaheen, S. Samhan
and DF. Hanusch, 2016. A framework for water loss
management in developing countries under fuzzy
environment: Integration of Fuzzy AHP with Fuzzy
TOPSIS. Exp. Syst. Applic., 61: 86-105.
DOI: 10.1016/j.eswa.2016.05.016
Related Documents


![An Integrated Fuzzy AHP and Fuzzy TOPSIS Approach for ... · MCDM problems, such as AHP, TOPSIS, ELECTRE, rough sets theory and Multi-objective programming [8]. In comparison with](https://static.cupdf.com/doc/110x72/5cd05a1688c993480d8d8cac/an-integrated-fuzzy-ahp-and-fuzzy-topsis-approach-for-mcdm-problems-such.jpg)