Journal of Theoretical and Applied Information Technology 10 th February 2015. Vol.72 No.1 © 2005 - 2015 JATIT & LLS. All rights reserved . ISSN: 1992-8645 www.jatit.org E-ISSN: 1817-3195 40 NEW APPROACH FOR IMBALANCED BIOLOGICAL DATASET CLASSIFICATION 1 SEYYEDALI FATTAHI, 2 ZALINDA OTHMAN , 3 ZULAIHA ALI OTHMAN 1,2,3 Data mining and Optimization Research Group, Centre for Artificial Intelligence, Faculty of Information Science and Technology, University KEBANGSAAN MALAYSIA,UKM BANGI, 43600 Selangor, E-mail: 1 [email protected], [email protected], 2 [email protected], 3 [email protected] ABSTRACT This paper presents a new ensemble classifier for class imbalance problem with the emphasis on two -class (binary) classification. This novel method is a combination of SMOTE (Synthetic Minority Over-sampling Technique), Rotation Forest, and AdaBoostM1 algorithms. SMOTE was employed for the over-sampling of the minority samples at 100%, 200%, 300%, 400%, and 500% of the initial sample size, with attribute selection being conducted in order to prevent the classification from being over-fitted. The ensemble classifier method was presented to solve the problem of imbalanced biological datasets classification by obtaining a low prediction error and raising the prediction performance. The Rotation Forest algorithm was used to produce an ensemble classifier with a lower prediction error, while the AdaBoostM1 algorithm was used to enhance the performance of the classifier. All the tests were carried out using the java-based WEKA (Waikato Environment for Knowledge Analysis) and Orange canvas data mining systems for training datasets. The performances of three types of classifiers on imbalanced biomedical datasets were assessed. This paper explores the efficiency of this new method in producing an accurate overall classifier and in lowering the error rate in the overall performance of the classifier. Tests were carried out on three actual imbalanced biomedical datasets, which were obtained from the KEEL dataset repository. These imbalanced datasets were divided into ten categories according to their imbalance ratios (IR) which ranged from 1.86 to 41.40. The results indicated that the proposed method, which used a combination of three methods and various evaluation metrics in its assessments, was effective. In practical terms, the use of the SMOTE- RotBoost for the classification of biological datasets results in a low mean absolute error rate as well as high accuracy and precision. The values of the Kappa Coefficient were close to 1, thus indicating that all the rates in every classification were the same even though the false negative rates, which were close to 0, showed the reliability of the measurements. The SMOTE-RotBoost has useful AUC-ROC outputs that characterise the wider area under the curve compared to other classifiers and is a vital method for the assessment of diagnostic tests. Keywords: SMOTE, Rotation Forest, Random Subspace, Bagging, Boosting 1 INTRODUCTION The most interesting objective of using binary classifications for class predictions is the classification of imbalanced datasets. Recently, researchers tried to come up with a training set rule- based algorithm to allocate new samples. Datasets are said to be imbalanced when the classes are unequally distributed. This means that there are fewer samples in the minority class (rare class) than in the majority class [1-5]. In reality, most training sets are imbalanced, and data mining and machine learning methods are focussing more and more on the problem of gaining information from these datasets. The class imbalance problem is due to the impact of class distribution in imbalanced datasets on classifiers [6-15]. When the datasets are imbalanced, the learning classifiers that are produced have poor predictive accuracy and performance [15-18]. Examples of popular learning methods that are often employed to overcome this problem with various datasets are Bagging [19-24], Boosting [25-29], re-sampling [1], and Support Vector Machine (SVM) [30-35]. An important ingredient to have for learning methods is an ensemble classifier, which is a combination of several classifiers in order to have better

Welcome message from author
This document is posted to help you gain knowledge. Please leave a comment to let me know what you think about it! Share it to your friends and learn new things together.
Transcript
Journal of Theoretical and Applied Information Technology 10
th February 2015. Vol.72 No.1
© 2005 - 2015 JATIT & LLS. All rights reserved.
ISSN: 1992-8645 www.jatit.org E-ISSN: 1817-3195
40
NEW APPROACH FOR IMBALANCED BIOLOGICAL
DATASET CLASSIFICATION
1SEYYEDALI FATTAHI,
2ZALINDA OTHMAN
, 3ZULAIHA ALI OTHMAN
1,2,3Data mining and Optimization Research Group, Centre for Artificial Intelligence, Faculty of
Information Science and Technology, University KEBANGSAAN MALAYSIA,UKM BANGI, 43600
Selangor,
E-mail: [email protected], [email protected], [email protected], [email protected]
ABSTRACT
This paper presents a new ensemble classifier for class imbalance problem with the emphasis on two -class (binary) classification. This novel method is a combination of SMOTE (Synthetic Minority Over-sampling Technique), Rotation Forest, and AdaBoostM1 algorithms. SMOTE was employed for the over-sampling of the minority samples at 100%, 200%, 300%, 400%, and 500% of the initial sample size, with attribute selection being conducted in order to prevent the classification from being over-fitted. The ensemble classifier method was presented to solve the problem of imbalanced biological datasets classification by obtaining a low prediction error and raising the prediction performance. The Rotation Forest algorithm was used to produce an ensemble classifier with a lower prediction error, while the AdaBoostM1 algorithm was used to enhance the performance of the classifier. All the tests were carried out using the java-based WEKA (Waikato Environment for Knowledge Analysis) and Orange canvas data mining systems for training datasets. The performances of three types of classifiers on imbalanced biomedical datasets were assessed. This paper explores the efficiency of this new method in producing an accurate overall classifier and in lowering the error rate in the overall performance of the classifier. Tests were carried out on three actual imbalanced biomedical datasets, which were obtained from the KEEL dataset repository. These imbalanced datasets were divided into ten categories according to their imbalance ratios (IR) which ranged from 1.86 to 41.40. The results indicated that the proposed method, which used a combination of three methods and various evaluation metrics in its assessments, was effective. In practical terms, the use of the SMOTE-RotBoost for the classification of biological datasets results in a low mean absolute error rate as well as high accuracy and precision. The values of the Kappa Coefficient were close to 1, thus indicating that all the rates in every classification were the same even though the false negative rates, which were close to 0, showed the reliability of the measurements. The SMOTE-RotBoost has useful AUC-ROC outputs that characterise the wider area under the curve compared to other classifiers and is a vital method for the assessment of diagnostic tests.
Keywords: SMOTE, Rotation Forest, Random Subspace, Bagging, Boosting
1 INTRODUCTION
The most interesting objective of using binary
classifications for class predictions is the classification of imbalanced datasets. Recently, researchers tried to come up with a training set rule-based algorithm to allocate new samples. Datasets are said to be imbalanced when the classes are unequally distributed. This means that there are fewer samples in the minority class (rare class) than in the majority class [1-5]. In reality, most training sets are imbalanced, and data mining and machine learning methods are focussing more and more on
the problem of gaining information from these datasets. The class imbalance problem is due to the impact of class distribution in imbalanced datasets on classifiers [6-15]. When the datasets are imbalanced, the learning classifiers that are produced have poor predictive accuracy and performance [15-18]. Examples of popular learning methods that are often employed to overcome this problem with various datasets are Bagging [19-24], Boosting [25-29], re-sampling [1], and Support Vector Machine (SVM) [30-35]. An important ingredient to have for learning methods is an ensemble classifier, which is a combination of several classifiers in order to have better
Journal of Theoretical and Applied Information Technology 10
th February 2015. Vol.72 No.1
© 2005 - 2015 JATIT & LLS. All rights reserved.
ISSN: 1992-8645 www.jatit.org E-ISSN: 1817-3195
41
performance and greater accuracy than a single classifier [36-41]. Among the many ensembles, bagging, boosting, random subspace, random forest and rotation forest are more frequently combined to make use of the same learning algorithm for base classifier [20, 36, 42-54]. The main aims of the ensemble learning and classification tasks are to improve the accuracy and reduce the error rate of the classifiers [40, 55-57]. Ensemble methods, which are a combination of various models and methods, are meant to improve the accuracy of the classifier [40]. Various classification models are integrated into these ensemble methods and as such, this lowers the possibility of over-fitting occurring in the training data [54, 57, 58]. Several ensemble methods have been used on biological data sets [35, 44, 59-62]. Ensemble learning methods are being increasingly used in bioinformatics and computational biology in view of their classification benefits [44, 63-67]. This paper presents a new ensemble method, which is described in the Methods section, for solving the binary imbalanced classification problem encountered in bioinformatics.
2 MOTIVATION AND SCOPE
The objective of this paper is to come up with a new ensemble classifier to enhance the prediction accuracy of the classifier and to lower the error rate in the performance of the classifier as a whole. The main motivation this study is to add to the list of ensemble methods and to attain better predictions for classifications in bioinformatics.
3 METHODS
The SMOTE-RotBoost ensemble is a combination of three methods: SMOTE, Rotation Forest algorithm and AdaBoostM1 algorithm.
3.1 SMOTE
SMOTE or the Synthetic Minority Over-sampling Technique, which was introduced by [1], is the most renowned over-sampling method used for the balancing of imbalanced datasets. In this method, synthetic (artificial) minority samples are created. In the field of bioinformatics, SMOTE is used, for example, to identify the binding specificity of regulatory proteins [66, 68]; predict proteins [33, 46, 65, 67, 69]; predict Glycosylation sites [34]; predict miRNA genes [70-74]; as the LVQ-SMOTE (Learning Vector Quantization SMOTE) for biomedical datasets [75]; for histopathology annotations [76]; classification of
high dimensional biomedical datasets [77]; regulatory binding sites on mRNA [78]; and for the identification of bioinformatics class imbalance ncRNA [79]. SMOTE is useful for datasets with low dimensions, but if it is to be used for high-dimensional datasets, then the variable selection before SMOTE must be described [80] and the setting must be only that of the K-Nearest Neighbour (K-NN) classifier according to the Euclidean distance provided. Therefore, according to [77, 80], variable selection was used to solve the problem of over-fitting through over-sampling of the minority class. By using variable selection, the SMOTE-RotBoost method can be employed for high-dimensional datasets in the future. In this study, the SMOTE-RotBoost was tested on low-dimensional imbalanced bioinformatics datasets.
3.2 Rotation Forest
The Rotation Forest was suggested by [81, 82] as an ensemble method for classification. In this method, each classifier is constructed with characteristics which are obtained by rotating subspaces of the original dataset. At the same time, this rotation increases the diversity and the accuracy provided by a PCA (Principle Component Analysis), which is employed for each base classifier by all the training datasets. The Rotation Forest has more advantages in terms of effectiveness compared to the other ensemble methods, namely the Bagging, Boosting, and Random subspace methods. While each base classifier is being constructed, all information is held as the same information in the original dataset since all occurrences are taken into consideration in the rotated dataset. This technique is appropriate for datasets, such as decision trees, which are influenced by rotation [83, 84]. The Rotation Forest gains new characteristics through the use of the PCA. The Rotation Forest algorithm is an important application for the improvement of regression [85, 86] and it is being increasingly used in the medical and biological science fields [87-92]. This ensemble method was employed so as not to overlook the information on the samples from the initial dataset during the construction of the base classifier. The major advantages of the Rotation Forest algorithm over Boosting and Bagging are the construction of accurate and diverse classifiers. This is because the Rotation Forest extracts features from subsets of features and then rebuilds a complete set of features for the ensemble classifiers (so as to rotate the input data for the training base classifier). Other reasons why the Rotation Forest is preferred are given by [93-95]. [93, 95] stated that
Journal of Theoretical and Applied Information Technology 10
th February 2015. Vol.72 No.1
© 2005 - 2015 JATIT & LLS. All rights reserved.
ISSN: 1992-8645 www.jatit.org E-ISSN: 1817-3195
42
the Rotation Forest increased the accuracy of classifiers when it comes to the designing of computer-aided diagnosis (CADx) systems. [94] describes the benefits of employing ensemble methods (such as the Rotation Forest) in DNA microarray gene expression data by enhancing the accuracy of the base classifier when it is used in the Kent Ridge Biomedical Dataset repository [96].
3.3 AdaBoostM1
The AdaBoostM1 (Adaptive Boosting), which was introduced by [28, 97], is an efficient ensemble method of classification. The base classifier, be it a new or weak classifier, is constructed at each iteration by means of the base learning methods. When the original weights of all the samples are the same, then the samples are categorised by the AdaBoostM1 according to the following steps in order to generate the final classifier:
•Each sample is assigned a weight (the distribution of the dataset is changed)
•The weight is adjusted based on the accuracy of the prediction for each sample
•The final classifier is obtained from a weighted vote of the base classifier (the performance function of a classifier is used as a weight for voting)
The AdaBoostM1 was employed because it is less prone to the risk of over-fitting and it can be modified by adjusting the weak classifier depending on which samples were wrongly classified by earlier classifiers [58, 98].
3.4 RotBoost and SMOTE-RotBoost
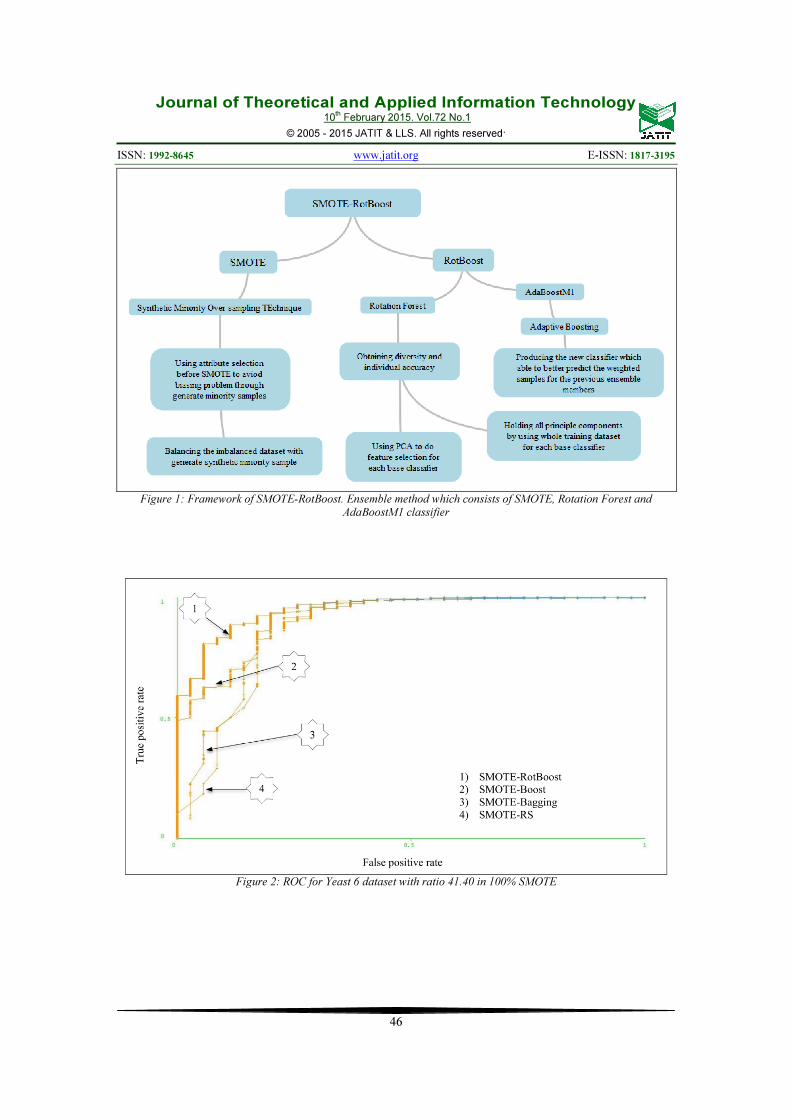
In order to reduce the classification error rate, [99] proposed and integrated the Rotation Forest and AdaBoostM1 ensemble methods, while [42] pointed out that the Rotation Forest and Boosting algorithms performed steadily with noise-free and imbalanced datasets. In view of these major advantages, the Rotation Forest and AdaBoostM1 methods were combined and utilized together with SMOTE to come up with the SMOTE-RotBoost. The detailed structure of the SMOTE-RotBoost is shown in Figure 1.
4 EVALUATION METRICS
4.1 Confusion Matrix
There are four outputs in binary classifications (two classes) as follows:
TP = True Positive rate (class members are classified as class members) = recall = sensitivity
TN = True Negative rate (class non-members are classified as non-members) = specificity
FP = False positive rate (class non-members are classified as class members) = fall out
FN = False negative rate (class members are classified as class non-members) => it will indicate which classifier is better to be selected in a method. FN with a low percentage value is taken into consideration (refer to section on False Negative rate).
In biomedical tests, sensitivity or recall is used for patients who have tested positive for diseases. Specificity is used for patients who tested negative for diseases. Table 1 shows the confusion matrix for these outputs in the predicted class and the actual class. [99] proposed and integrated the Rotation Forest and AdaBoostM1 ensemble methods, while [42] pointed out that the Rotation Forest and Boosting algorithms performed steadily with noise-free and imbalanced datasets. In view of these major advantages,
Table 1: Confusion Matrix for two-class classification
Predicted class
confusion matrix (Positive) (Negative)
Actual
class
Positive
class
TP FN
Negative
class
FP TN
Table 2 indicates the related equations between outputs (Equations 1 – 4).
Table 2: Equations of Confusion Matrix Predicted class
Actu
al
cla
ss
FNTP
TP
TP
+
= (1)
TPFN
FN
FN
+
= (2)
TNFP
FP
FP
+
= (3)
FPTN
TN
TN
+
= (4)
Journal of Theoretical and Applied Information Technology 10
th February 2015. Vol.72 No.1
© 2005 - 2015 JATIT & LLS. All rights reserved.
ISSN: 1992-8645 www.jatit.org E-ISSN: 1817-3195
43
4.2 Accuracy, precision, recall, and f-score
Table 3 indicates the related equations of accuracy, precision, recall and f-score. Equation 5 (table 3) denotes the relationship between outputs and the accuracy of the classifier, while Equations 6, 7 and 8 are used to calculate the Precision, Recall, and F-score, respectively. The precision, recall, and F-measure are important measurements of the performance of binary classifications with regard to issues pertaining to imbalanced classes [100-103]. Precision means the degree to which class members have been correctly classified as class members out of a total number of classified samples (Equation 6). Recall means the degree to which class members have been classified correctly out of the total number of class members (Equation 7). The harmonic mean (average) of Precision and Recall is defined as the F-score or F-measure. The F-score indicates an exchange between Precision and Recall. The Precision will be reduced with an increase in TP and FP (refer to Equation 6). Hence, the F-score is an effective measure of the quality of a classifier. However, one drawback of using the F-score as an assessment tool in machine learning is that it cannot withstand the TN rate [104, 105]. This problem can be solved by using Cohen’s Kappa coefficient.
Table 3: Equations of Accuracy, Precision, Recall and F-
score
TNFPFN TP
TNTP AccuracyClassifier
+++
+
= (5)
FPTP
TP
Precision
+
= (6)
TP
FNTP
TP
Recall =
+
= (7)
recallprecision
recallprecision2valueF
+
×
×=− (8)
4.3 False negative rate
According to [8, 10], a False Negative rate which is closer to 0 indicates the effectiveness of a machine learning classifier in comparison to other classifiers with values that are further from 0. However, it was demonstrated by [106] that the ROC (Receiver Operating Curve) was inadequate as an evaluation measurement due to the occurrence of bias in the class distribution when it came to a minority class. This limitation can be overcome by
a False Negative rate, which considers a low percentage magnitude as an indication of an effective classifier.
4.4 Area Under Curve of ROC
Receiver Operating Characteristics (ROC) is useful graph for visualizing classifier performance and organizing it [107]. An ROC curve illustrates tradeoff between TP rate (benefits) and FP rate (costs). ROC space is two dimensional which TP rate is on the Y-axis and FP rate is on X-axis. Figure 2 depicts as example of the ROC for Yeast 6 dataset with ratio 41.40 in 100% SMOTE. Calculating the Area under this graph shows Area Under Curve (AUC). Equation 9 indicates AUC based on TP and FP rates. Area Under ROC Curve is one of the fundamental metric tools in imbalanced and biological domain [107-114]. Researchers argued that the AUC has effective advantages rather than accuracy [115, 116]. Because based on Equation 9, AUC is in direct relation between TP and FP.
2
FPTP1AUC
−+
= (9)
4.5 Kappa Statistic
The Kappa statistic or Cohen’s Kappa coefficient (CKC) was proposed by [117] as a statistical measure and it is used to evaluate measurement agreement [118-122], intera rater reliability [123-125], reliability of disease classifications [126], and measurements in medical research [127]. Equation 10 gives a simple representation of the Kappa statistic.
agreement chance -1
agreement chance -agreement observed =κ (10)
In medical research, if metrics are in
agreement purely by chance, there is no real agreement at all. Only agreement that is beyond that expected by chance is deemed to be a true agreement. The Kappa statistic is a measure of true agreement. For every observed and chance agreement, there is a proportion of any possible beyond chance agreement that is an achieved beyond chance agreement [125]. The value of the Kappa statistic normally ranges from 0 and 1, with 1 being an indication of perfect agreement, with the raters agreeing on their classification of every case;
Journal of Theoretical and Applied Information Technology 10
th February 2015. Vol.72 No.1
© 2005 - 2015 JATIT & LLS. All rights reserved.
ISSN: 1992-8645 www.jatit.org E-ISSN: 1817-3195
44
and with 0 being an indication that the agreement is not better than what was expected by chance. These values very seldom range from -1 to 1 in clinical and medical cases. A negative value is obtained if two raters are under consideration, although if there are more than two raters being considered, then the possible minimum value will be raised [128].
4.6 Mean Absolute Error (MAE) and Root
Mean Absolute Error (RMSE)
The MAE, which is the average of absolute errors, is used to measure the trade-offs between predictors (unknown outputs) and outcomes (known outputs) regardless of their direction. This means that the MAE is a measure of the difference between the predicted results and observed results. Although some researchers [129, 130] are in favour of using the MAE to evaluate the average performance of a model, others [131-133] prefer to use the RMSE as a standard measure of model error. The RMSE is almost the same measure as the MAE, but it is more beneficial when it comes to huge errors. The RMSE has a powerful effect on huge errors (penalizes huge errors). Both the MAE and RMSE have values that range from 0 to infinity. A value which is closer to 0 indicates a perfect value. The MAE and RMSE were employed in this study to measure the performance of various classifiers. These metrics are calculated using Equations 11 and 12, with e being the error rate and n the number of samples.
∑=
=n
iie
n 1
1 MAE (11)
∑=
=n
ii
n 1
2e
1 RMSE (12)
5 RESULTS AND DISCUSSION
The SMOTE-RotBoost was introduced as a novel experimental ensemble method and its own base classifier was shown to be useful for imbalanced biomedical dataset classifications. Therefore, various classifiers were combined in a multiple classifier system. Evaluation metrics were employed to test the advantages of this method, and this is described in the Evaluation Metrics section.
Three actual imbalanced biomedical datasets retrieved from the KEEL datasets repository were used to assess the performance of
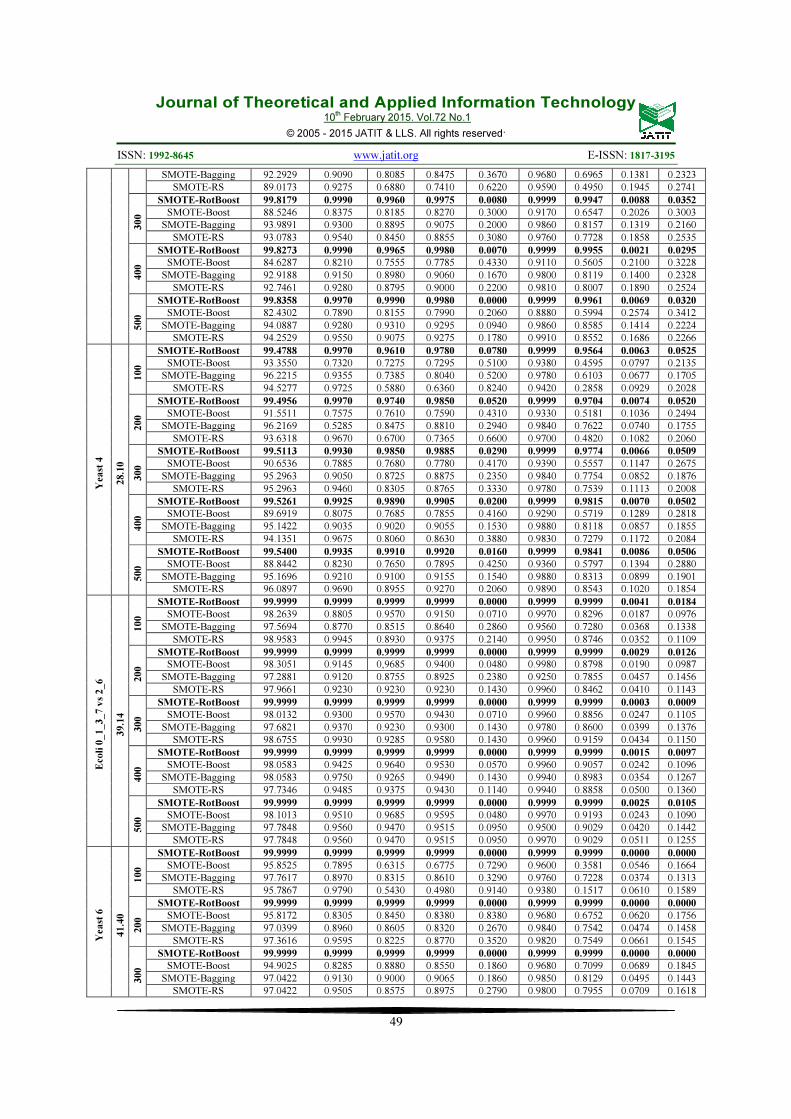
the SMOTE-RotBoost. These datasets were classified into ten datasets with various imbalanced ratios ranging from 1.86 to 41.40. While the data was being processed, all the missing values were removed. The datasets with their relevant ratios are shown in Table 4. The SMOTE-RotBoost was employed for data at 100%, 200%, 300%, 400%, and 500% of its initial size. Attribute selection was used to prevent the occurrence of bias before SMOTE. Both the imbalanced classes were altered into negative and positive classes from 0 and 1. The performance of the SMOTE-RotBoost was compared to that of three popular ensemble methods, namely the SMOTE-Boost [134], SMOTE-Bagging [135] and SMOTE-Random Subspace [136].
From Figure 3 it can be seen that on the whole the new ensemble method, which was applied at 100%, 200%, 300%, 400%, and 500% of the initial dataset size, produced more accurate results than the other three ensembles in average. Figure 4 presents the average values of precision, recall, and F-scores for ten datasets. The magnitudes of these three metrics produced by the SMOTE-RotBoost method were nearer to 1.
The overall magnitudes presented were the same for the different percentages of SMOTE. Figure 5 shows that the SMOTE-RotBoost obtained a lower False Negative rate in average (which is described in the related section) compared to the other ensemble methods, thus indicating that the classifiers, which were used in this method, were more efficient than the others were.
Figure 6 shows that similar results were obtained for the average of AUC (Area Under Curve) and Kappa statistic. The average value of the AUC using the SMOTE-RotBoost ensemble method was higher than that of the others, thus indicating that the randomly selected positive samples probably ranked higher than the negative samples. The same results were obtained for the AUC using different percentages of SMOTE. Figure 6 also indicates the significant agreement of the rates, which were classified in every case. The Kappa statistic in the figure is translated as an applicable measure of reliability
Figures 3 to 6 show that there was an acceptable conformity between the overall accuracy and the AUC for ranking the classification performance of the SMOTE-RotBoost. Significant
Journal of Theoretical and Applied Information Technology 10
th February 2015. Vol.72 No.1
© 2005 - 2015 JATIT & LLS. All rights reserved.
ISSN: 1992-8645 www.jatit.org E-ISSN: 1817-3195
45
results were obtained for all the datasets in the 100% SMOTE compared with the results of the other percentages of the applied SMOTE.
. From the results in Figure 7, it can be seen that compared to the other ensemble methods, the SMOTE-Rot Boost method produced the lowest MAE and RMSE. Figure 7 also shows that the RMSE was either larger or equal to the MAE for all the ensemble methods, and that for the SMOTE-RotBoost method the RMSE was equal to the MAE (close to 0), thus indicating that all the error rates possessed the same magnitude. The great difference between the MAE and the RMSE for the SMOTE-Boost method indicated that there was a greater variance of individual errors in the samples (there was a variation in the errors).
6 LIMITATION
The proposed ensemble method has limitations because it employs the AdaBoostM1 ensemble, which is susceptible to outliers and noisy datasets.
7 CONCLUSIONS
Compared to the other ensemble methods, namely the SMOTE-Boost, SMOTE-Bagging and SMOTE-Random Subspace, the SMOTE-RotBoost gives better performance and more benefits when it comes to the classification of imbalanced biomedical data. From the results given in Figures 1 to 6 it can be seen that the difference between the datasets which had imbalanced ratios with the performances of the SMOTE-RotBoost was insignificant. This method performed well with imbalanced biomedical datasets having the same ratios. The performance of this new method was measured with regard to eight metrics: Precision, Recall, F-score, FN rate, AUC, CKC, MAE, and RMSE. In practical terms, when the SMOTE-RotBoost was used for the classification of biological datasets, a low mean absolute error rate, and high accuracy and precision were reported. The Kappa Coefficient (CKC) values, which were close to 1, showed that all the rates in the classification of every case were in perfect agreement despite the False Negative rates which, being close to 0, denoted that the measurements were reliable. Unlike the other classifiers, the SMOTE-RotBoost enhanced the AUC-ROC outputs, which were represented by the larger area under the curve, and
provided a significant approach for the assessment of diagnostic tests. The magnitudes of the MAE and RMSE were closer to 0 in the SMOTE-RotBoost method compared to the three other ensemble methods.
8 AVAILABILITY OF SUPPORTING
DATA
The datasets supporting the results of this paper are available in the KEEL repository, http://sci2s.ugr.es/keel/imbalanced.
9 LIST OF ABBREVIATION USED
SMOTE: Synthetic Minority Over-sampling Technique; AdaBoostM1: Adapted Boosting Algorithm; Bagging: Bootstrap aggregating; PCA: Principle Component Analysis; ROC: Receiver Operating Characteristic; K-NN: K – Nearest Neighbor classifier; AUC: Area Under ROC Curve; FN: False Negative rate; CKC: Cohen’s Kappa Coefficient; MAE: Mean Absolute Error; RMSE: Root Mean Square Error; KEEL: Knowledge Extraction based on Evolutionary Learning; WEKA: Waikato Environment for Knowledge Analysis.
Journal of Theoretical and Applied Information Technology 10
th February 2015. Vol.72 No.1
© 2005 - 2015 JATIT & LLS. All rights reserved.
ISSN: 1992-8645 www.jatit.org E-ISSN: 1817-3195
46
Figure 1: Framework of SMOTE-RotBoost. Ensemble method which consists of SMOTE, Rotation Forest and
AdaBoostM1 classifier
Figure 2: ROC for Yeast 6 dataset with ratio 41.40 in 100% SMOTE

Journal of Theoretical and Applied Information Technology 10
th February 2015. Vol.72 No.1
© 2005 - 2015 JATIT & LLS. All rights reserved.
ISSN: 1992-8645 www.jatit.org E-ISSN: 1817-3195
47
Table 4: 4 Results for different ensemble methods. The best result for each dataset is marked in bold
Da
tasets
IR
SM
OT
E %
Methods Accuracy
% Precision Recall F-Score FN rate AUC CKC MAE RMSE
Brea
st C
an
cer
1.8
6
10
0
SMOTE-RotBoost 99.9999 0.9999 0.9999 0.9999 0.0000 0.9999 0.9999 0.0000 0.0000
SMOTE-Boost 96.4208 0.9640 0.9640 0.9640 0.0400 0.9950 0.9283 0.0456 0.1602
SMOTE-Bagging 98.3731 0.9840 0.9835 0.9835 0.0060 0.9980 0.9674 0.0433 0.1243
SMOTE-RS 97.7223 0.9775 0.9765 0.9775 0.0130 0.9970 0.9544 0.0548 0.1362
20
0
SMOTE-RotBoost 99.9999 0.9999 0.9999 0.9999 0.0000 0.9999 0.9999 0.0000 0.0000
SMOTE-Boost 97.2438 0.9695 0.9725 0.9710 0.0280 0.9950 0.9418 0.0423 0.1483
SMOTE-Bagging 98.0189 0.9805 0.9775 0.9790 0.0110 0.9999 0.9579 0.0373 0.1135
SMOTE-RS 98.6219 0.9875 0.9835 0.9855 0.0040 0.9950 0.9707 0.0441 0.1198
30
0
SMOTE-RotBoost 99.9999 0.9999 0.9999 0.9999 0.0000 0.9999 0.9999 0.0000 0.0000
SMOTE-Boost 97.9286 0.9750 0.9770 0.9760 0.0170 0.9970 0.9523 0.0286 0.1247
SMOTE-Bagging 98.2143 0.9810 0.9775 0.9795 0.0090 0.9999 0.9586 0.0271 0.0995
SMOTE-RS 98.6429 0.9885 0.9800 0.9840 0.0020 0.9980 0.9684 0.0330 0.1016
40
0
SMOTE-RotBoost 99.9999 0.9999 0.9999 0.9999 0.0000 0.9999 0.9999 0.0000 0.0000
SMOTE-Boost 97.1934 0.9600 0.9700 0.9650 0.0260 0.9970 0.9297 0.0308 0.1342
SMOTE-Bagging 99.0238 0.9915 0.9830 0.9875 0.0020 0.9999 0.9751 0.0228 0.0892
SMOTE-RS 99.1458 0.9935 0.9850 0.9890 0.0010 0.9999 0.9782 0.0300 0.0899
50
0
SMOTE-RotBoost 99.9999 0.9999 0.9999 0.9999 0.0000 0.9999 0.9999 0.0000 0.0000
SMOTE-Boost 97.9766 0.9700 0.9745 0.9745 0.0150 0.9970 0.9442 0.0230 0.1200
SMOTE-Bagging 98.9350 0.9875 0.9830 0.9850 0.0050 0.9999 0.9704 0.0219 0.0845
SMOTE-RS 99.0948 0.9910 0.9840 0.9875 0.0030 0.9980 0.9748 0.0276 0.0917
Eco
li1
3.3
6
10
0
SMOTE-RotBoost 99.9999 0.9999 0.9999 0.9999 0.0000 0.9999 0.9999 0.0000 0.0000
SMOTE-Boost 99.6633 0.9965 0.9970 0.9970 0.0000 0.9999 0.9933 0.0071 0.0508
SMOTE-Bagging 98.9899 0.9895 0.9905 0.9900 0.0000 0.9900 0.9798 0.0179 0.0999
SMOTE-RS 98.9899 0.9895 0.9905 0.9900 0.0000 0.9970 0.9798 0.2009 0.2282
20
0
SMOTE-RotBoost 99.9999 0.9999 0.9999 0.9999 0.0000 0.9999 0.9999 0.0000 0.0000
SMOTE-Boost 99.4652 0.9930 0.9955 0.9950 0.0000 0.9999 0.9887 0.0118 0.0651
SMOTE-Bagging 98.6631 0.9845 0.9880 0.9860 0.0070 0.9999 0.9718 0.0299 0.0961
SMOTE-RS 98.6631 0.9830 0.9830 0.9860 0.0000 0.9970 0.9719 0.1806 0.2184
30
0
SMOTE-RotBoost 99.9999 0.9999 0.9999 0.9999 0.0000 0.9999 0.9999 0.0000 0.0000
SMOTE-Boost 99.5565 0.9930 0.9970 0.9950 0.0000 0.9999 0.9898 0.0102 0.0633
SMOTE-Bagging 98.6696 0.9800 0.9905 0.9845 0.0000 0.9970 0.9696 0.0284 0.1093
SMOTE-RS 98.6696 0.9800 0.9905 0.9845 0.0000 0.9980 0.9696 0.1693 0.2081
40
0
SMOTE-RotBoost 99.9999 0.9999 0.9999 0.9999 0.0000 0.9999 0.9999 0.0000 0.0000
SMOTE-Boost 99.6212 0.9930 0.9975 0.9950 0.0000 0.9999 0.9905 0.0080 0.0509
SMOTE-Bagging 98.4848 0.9735 0.9895 0.9815 0.0000 0.9999 0.9623 0.0251 0.0943
SMOTE-RS 99.0530 0.9830 0.9935 0.9880 0.0000 0.9999 0.9763 0.1033 0.1554
50
0
SMOTE-RotBoost 99.9999 0.9999 0.9999 0.9999 0.0000 0.9999 0.9999 0.0000 0.0000
SMOTE-Boost 98.6777 0.9755 0.9890 0.9820 0.0070 0.9999 0.9639 0.0124 0.0818
SMOTE-Bagging 99.0083 0.9840 0.9885 0.9860 0.0140 0.9999 0.9727 0.0166 0.0833
SMOTE-RS 98.5124 0.9745 0.9855 0.9795 0.0140 0.9999 0.9593 0.1297 0.1835
Eco
li2
5.4
6
10
0
SMOTE-RotBoost 99.9999 0.9999 0.9999 0.9999 0.0000 0.9999 0.9999 0.0000 0.0000
SMOTE-Boost 90.4639 0.8710 0.8985 0.8830 0.1150 0.9450 0.7662 0.1431 0.2734
SMOTE-Bagging 93.0412 0.9105 0.9090 0.9115 0.1250 0.9680 0.8232 0.1119 0.2171
SMOTE-RS 92.0103 0.9010 0.8940 0.8985 0.1630 0.9740 0.7945 0.1477 0.2389
20
0
SMOTE-RotBoost 99.9999 0.9999 0.9999 0.9999 0.0000 0.9999 0.9999 0.0000 0.0000
SMOTE-Boost 90.0000 0.8890 0.8950 0.8920 0.1220 0.9510 0.7834 0.1479 0.2831
SMOTE-Bagging 93.8636 0.9335 0.9320 0.9315 0.0900 0.9860 0.8657 0.1159 0.2155
SMOTE-RS 93.1818 0.9245 0.9270 0.9255 0.0900 0.9750 0.8515 0.1580 0.2471
30
0
SMOTE-RotBoost 99.9999 0.9999 0.9999 0.9999 0.0000 0.9999 0.9999 0.0000 0.0000
SMOTE-Boost 90.4472 0.9020 0.9030 0.9025 0.1060 0.9470 0.8046 0.1427 0.2803
SMOTE-Bagging 92.6829 0.9250 0.9250 0.9250 0.0870 0.9860 0.8501 0.1144 0.2209
SMOTE-RS 91.6667 0.9135 0.9165 0.9150 0.0820 0.9700 0.8300 0.1582 0.2535
40
0
SMOTE-RotBoost 99.9999 0.9999 0.9999 0.9999 0.0000 0.9999 0.9999 0.0000 0.0000
SMOTE-Boost 90.4412 0.9040 0.9045 0.9045 0.0850 0.9620 0.8087 0.1416 0.2737
SMOTE-Bagging 93.0147 0.9305 0.9295 0.9300 0.0810 0.9880 0.8599 0.1111 0.2138
SMOTE-RS 93.3824 0.9335 0.9340 0.9335 0.9335 0.9810 0.8674 0.1428 0.2296
50
0
SMOTE-RotBoost 99.9999 0.9999 0.9999 0.9999 0.0000 0.9999 0.9999 0.0000 0.0000
SMOTE-Boost 90.2685 0.9025 0.9020 0.9025 0.0830 0.9610 0.8048 0.1427 0.2705
SMOTE-Bagging 94.9664 0.9510 0.9490 0.9495 0.0320 0.9890 0.8989 0.1065 0.2029
SMOTE-RS 94.1275 0.9415 0.9410 0.9410 0.0510 0.9860 0.8822 0.1283 0.2125

Journal of Theoretical and Applied Information Technology 10
th February 2015. Vol.72 No.1
© 2005 - 2015 JATIT & LLS. All rights reserved.
ISSN: 1992-8645 www.jatit.org E-ISSN: 1817-3195
48
Yea
st3
8.1
0
100
SMOTE-RotBoost 99.9999 0.9999 0.9999 0.9999 0.0000 0.9999 0.9999 0.0000 0.0000
SMOTE-Boost 94.9605 0.9220 0.9190 0.9205 0.1320 0.9720 0.8407 0.0953 0.2053
SMOTE-Bagging 96.7820 0.9445 0.9560 0.9500 0.0640 0.9940 0.8999 0.0593 0.1577
SMOTE-RS 88.2210 0.9360 0.7025 0.7540 0.5950 0.9790 0.5219 0.2116 0.2834
200
SMOTE-RotBoost 99.9999 0.9999 0.9999 0.9999 0.0000 0.9999 0.9999 0.0000 0.0000
SMOTE-Boost 94.6409 0.9255 0.9425 0.9335 0.0670 0.9730 0.8668 0.0959 0.2146
SMOTE-Bagging 97.0166 0.9580 0.9675 0.9625 0.0390 0.9950 0.9251 0.0577 0.1539
SMOTE-RS 97.1271 0.9645 0.9630 0.9635 0.0550 0.9930 0.9271 0.1383 0.2007
30
0
SMOTE-RotBoost 99.9999 0.9999 0.9999 0.9999 0.0000 0.9999 0.9999 0.0000 0.0000
SMOTE-Boost 94.3234 0.9335 0.9390 0.9360 0.0740 0.9690 0.8725 0.1145 0.2321
SMOTE-Bagging 96.4521 0.9560 0.9645 0.9600 0.0350 0.9950 0.9206 0.0632 0.1602
SMOTE-RS 95.7425 0.9670 0.9375 0.9505 0.1210 0.9970 0.9009 0.1681 0.2180
400
SMOTE-RotBoost 99.9999 0.9999 0.9999 0.9999 0.0000 0.9999 0.9999 0.0000 0.0000
SMOTE-Boost 94.4288 0.9370 0.9495 0.9420 0.0280 0.9780 0.8839 0.0989 0.2215
SMOTE-Bagging 96.9569 0.9655 0.9705 0.9680 0.0260 0.9970 0.9359 0.0554 0.1484
SMOTE-RS 96.4888 0.9710 0.9550 0.9620 0.0860 0.9980 0.9244 0.1550 0.2032
500
SMOTE-RotBoost 99.9999 0.9999 0.9999 0.9999 0.0000 0.9999 0.9999 0.0000 0.0000
SMOTE-Boost 94.4759 0.9415 0.9475 0.9440 0.0320 0.9780 0.8880 0.0985 0.2244
SMOTE-Bagging 96.9552 0.9675 0.9715 0.9690 0.0170 0.9970 0.9380 0.0559 0.1493
SMOTE-RS 94.9978 0.9595 0.9410 0.9480 0.1160 0.8961 0.1638 0.1638 0.2226
Eco
li 0
_2_
3_4
vs
5
9.1
0
100
SMOTE-RotBoost 99.9999 0.9999 0.9999 0.9999 0.0000 0.9999 0.9999 0.0000 0.0000
SMOTE-Boost 90.5930 0.7900 0.7385 0.7605 0.4830 0.9120 0.5219 0.1378 0.2637
SMOTE-Bagging 94.0695 0.9420 0.7725 0.8310 0.4500 0.9770 0.6644 0.1146 0.2057
SMOTE-RS 91.4110 0.9555 0.6500 0.7075 0.7000 0.9370 0.4292 0.1587 0.2572
200
SMOTE-RotBoost 99.9999 0.9999 0.9999 0.9999 0.0000 0.9999 0.9999 0.0000 0.0000
SMOTE-Boost 96.6942 0.9605 0.9505 0.9550 0.0830 0.9950 0.9104 0.0433 0.1577
SMOTE-Bagging 96.6942 0.9605 0.9505 0.9550 0.0830 0.9960 0.9104 0.0683 0.1529
SMOTE-RS 96.2810 0.9695 0.9310 0.9480 0.1330 0.9940 0.8962 0.1203 0.1938
30
0
SMOTE-RotBoost 99.9999 0.9999 0.9999 0.9999 0.0000 0.9999 0.9999 0.0000 0.0000
SMOTE-Boost 98.8550 0.9920 0.9815 0.9865 0.0380 0.9999 0.9727 0.0226 0.0965
SMOTE-Bagging 95.8015 0.9470 0.9560 0.9515 0.0500 0.9960 0.9021 0.0728 0.1595
SMOTE-RS 95.8015 0.9670 0.9350 0.9490 0.1250 0.9970 0.8978 0.0942 0.1587
400
SMOTE-RotBoost 99.9999 0.9999 0.9999 0.9999 0.0000 0.9999 0.9999 0.0000 0.0000
SMOTE-Boost 98.9362 0.9870 0.9895 0.9885 0.0100 0.9999 0.9768 0.0251 0.1046
SMOTE-Bagging 97.8723 0.9750 0.9790 0.9765 0.0200 0.9999 0.9537 0.0571 0.1255
SMOTE-RS 95.0355 0.9610 0.9325 0.9445 0.1300 0.9970 0.8885 0.1120 0.1719
500
SMOTE-RotBoost 99.9999 0.9999 0.9999 0.9999 0.0000 0.9999 0.9999 0.0000 0.0000
SMOTE-Boost 97.0199 0.9670 0.9710 0.9690 0.0250 0.9970 0.9380 0.0437 0.1502
SMOTE-Bagging 96.3576 0.9625 0.9615 0.9620 0.0500 0.9980 0.9238 0.0618 0.1474
SMOTE-RS 91.7219 0.9305 0.9005 0.9110 0.1830 0.9950 0.8224 0.1291 0.2032
Eco
li0
_1
vs
5
11
100
SMOTE-RotBoost 99.9999 0.9999 0.9999 0.9999 0.0000 0.9999 0.9999 0.0000 0.0000
SMOTE-Boost 98.4615 0.9800 0.9600 0.9700 0.0750 0.9999 0.9397 0.0186 0.0873
SMOTE-Bagging 96.9231 0.9585 0.9205 0.9385 0.1500 0.9980 0.8768 0.0489 0.1252
SMOTE-RS 98.8462 0.9935 0.9935 0.9770 0.0750 0.9999 0.9543 0.0685 0.1302
200
SMOTE-RotBoost 99.9999 0.9999 0.9999 0.9999 0.0000 0.9999 0.9999 0.0000 0.0000
SMOTE-Boost 98.5714 0.9690 0.9910 0.9795 0.0000 0.9999 0.9586 0.0188 0.0808
SMOTE-Bagging 98.9286 0.9760 0.9930 0.9845 0.0000 0.9999 0.9688 0.0543 0.1121
SMOTE-RS 99.2857 0.9840 0.9955 0.9895 0.0000 0.9999 0.9790 0.0465 0.0987
300
SMOTE-RotBoost 99.9999 0.9999 0.9999 0.9999 0.0000 0.9999 0.9999 0.0000 0.0000
SMOTE-Boost 98.6667 0.9790 0.9870 0.9830 0.0130 0.9999 0.9662 0.0209 0.0914
SMOTE-Bagging 99.0000 0.9820 0..9930 0.9875 0.0000 0.9999 0.9747 0.0435 0.1063
SMOTE-RS 99.3333 0.9915 0.9915 0.9915 0.0130 0.9999 0.9830 0.0484 0.1017
400
SMOTE-RotBoost 99.9999 0.9999 0.9999 0.9999 0.0000 0.9999 0.9999 0.0000 0.0000
SMOTE-Boost 97.8125 0.9845 0.9650 0.9740 0.0700 0.9999 0.9481 0.0274 0.1091
SMOTE-Bagging 99.0625 0.9905 0.9875 0.9890 0.0200 0.9999 0.9781 0.0521 0.1119
SMOTE-RS 98.4375 0.9860 0.9775 0.9820 0.0400 0.9999 0.9633 0.0745 0.1292
500
SMOTE-RotBoost 99.9999 0.9999 0.9999 0.9999 0.0000 0.9999 0.9999 0.0000 0.0000
SMOTE-Boost 99.1176 0.9890 0.9915 0.9905 0.0080 0.9999 0.9807 0.0161 0.0796
SMOTE-Bagging 99.4118 0.9920 0.9955 0.9935 0.0000 0.9999 0.9872 0.0525 0.1088
SMOTE-RS 98.2353 0.9790 0.9825 0.9805 0.0170 0.9999 0.9615 0.0545 0.1089
Yea
st 1
vs
7
14
.30
10
0
SMOTE-RotBoost 99.7955 0.9990 0.9915 0.9955 0.0170 0.9999 0.9904 0.0021 0.0320
SMOTE-Boost 90.5930 0.7900 0.7385 0.7605 0.4830 0.9120 0.5219 0.1378 0.2637
SMOTE-Bagging 94.0695 0.9420 0.7725 0.8310 0.4500 0.9770 0.6644 0.1146 0.2057
SMOTE-RS 91.4110 0.9555 0.6500 0.7075 0.7000 0.9370 0.4292 0.1587 0.2572
200 SMOTE-RotBoost 99.8073 0.9945 0.9940 0.9965 0.0000 0.9999 0.9933 0.0021 0.0310
SMOTE-Boost 87.8613 0.8165 0.7160 0.7500 0.5330 0.9020 0.5048 0.1653 0.2954
Journal of Theoretical and Applied Information Technology 10
th February 2015. Vol.72 No.1
© 2005 - 2015 JATIT & LLS. All rights reserved.
ISSN: 1992-8645 www.jatit.org E-ISSN: 1817-3195
49
SMOTE-Bagging 92.2929 0.9090 0.8085 0.8475 0.3670 0.9680 0.6965 0.1381 0.2323
SMOTE-RS 89.0173 0.9275 0.6880 0.7410 0.6220 0.9590 0.4950 0.1945 0.2741
30
0
SMOTE-RotBoost 99.8179 0.9990 0.9960 0.9975 0.0080 0.9999 0.9947 0.0088 0.0352
SMOTE-Boost 88.5246 0.8375 0.8185 0.8270 0.3000 0.9170 0.6547 0.2026 0.3003
SMOTE-Bagging 93.9891 0.9300 0.8895 0.9075 0.2000 0.9860 0.8157 0.1319 0.2160
SMOTE-RS 93.0783 0.9540 0.8450 0.8855 0.3080 0.9760 0.7728 0.1858 0.2535
400
SMOTE-RotBoost 99.8273 0.9990 0.9965 0.9980 0.0070 0.9999 0.9955 0.0021 0.0295
SMOTE-Boost 84.6287 0.8210 0.7555 0.7785 0.4330 0.9110 0.5605 0.2100 0.3228
SMOTE-Bagging 92.9188 0.9150 0.8980 0.9060 0.1670 0.9800 0.8119 0.1400 0.2328
SMOTE-RS 92.7461 0.9280 0.8795 0.9000 0.2200 0.9810 0.8007 0.1890 0.2524
500
SMOTE-RotBoost 99.8358 0.9970 0.9990 0.9980 0.0000 0.9999 0.9961 0.0069 0.0320
SMOTE-Boost 82.4302 0.7890 0.8155 0.7990 0.2060 0.8880 0.5994 0.2574 0.3412
SMOTE-Bagging 94.0887 0.9280 0.9310 0.9295 0.0940 0.9860 0.8585 0.1414 0.2224
SMOTE-RS 94.2529 0.9550 0.9075 0.9275 0.1780 0.9910 0.8552 0.1686 0.2266
Yea
st 4
28
.10
100
SMOTE-RotBoost 99.4788 0.9970 0.9610 0.9780 0.0780 0.9999 0.9564 0.0063 0.0525
SMOTE-Boost 93.3550 0.7320 0.7275 0.7295 0.5100 0.9380 0.4595 0.0797 0.2135
SMOTE-Bagging 96.2215 0.9355 0.7385 0.8040 0.5200 0.9780 0.6103 0.0677 0.1705
SMOTE-RS 94.5277 0.9725 0.5880 0.6360 0.8240 0.9420 0.2858 0.0929 0.2028
200
SMOTE-RotBoost 99.4956 0.9970 0.9740 0.9850 0.0520 0.9999 0.9704 0.0074 0.0520
SMOTE-Boost 91.5511 0.7575 0.7610 0.7590 0.4310 0.9330 0.5181 0.1036 0.2494
SMOTE-Bagging 96.2169 0.5285 0.8475 0.8810 0.2940 0.9840 0.7622 0.0740 0.1755
SMOTE-RS 93.6318 0.9670 0.6700 0.7365 0.6600 0.9700 0.4820 0.1082 0.2060
300
SMOTE-RotBoost 99.5113 0.9930 0.9850 0.9885 0.0290 0.9999 0.9774 0.0066 0.0509
SMOTE-Boost 90.6536 0.7885 0.7680 0.7780 0.4170 0.9390 0.5557 0.1147 0.2675
SMOTE-Bagging 95.2963 0.9050 0.8725 0.8875 0.2350 0.9840 0.7754 0.0852 0.1876
SMOTE-RS 95.2963 0.9460 0.8305 0.8765 0.3330 0.9780 0.7539 0.1113 0.2008
400
SMOTE-RotBoost 99.5261 0.9925 0.9890 0.9905 0.0200 0.9999 0.9815 0.0070 0.0502
SMOTE-Boost 89.6919 0.8075 0.7685 0.7855 0.4160 0.9290 0.5719 0.1289 0.2818
SMOTE-Bagging 95.1422 0.9035 0.9020 0.9055 0.1530 0.9880 0.8118 0.0857 0.1855
SMOTE-RS 94.1351 0.9675 0.8060 0.8630 0.3880 0.9830 0.7279 0.1172 0.2084
500
SMOTE-RotBoost 99.5400 0.9935 0.9910 0.9920 0.0160 0.9999 0.9841 0.0086 0.0506
SMOTE-Boost 88.8442 0.8230 0.7650 0.7895 0.4250 0.9360 0.5797 0.1394 0.2880
SMOTE-Bagging 95.1696 0.9210 0.9100 0.9155 0.1540 0.9880 0.8313 0.0899 0.1901
SMOTE-RS 96.0897 0.9690 0.8955 0.9270 0.2060 0.9890 0.8543 0.1020 0.1854
Eco
li 0
_1_
3_
7 v
s 2
_6
39
.14
10
0
SMOTE-RotBoost 99.9999 0.9999 0.9999 0.9999 0.0000 0.9999 0.9999 0.0041 0.0184
SMOTE-Boost 98.2639 0.8805 0.9570 0.9150 0.0710 0.9970 0.8296 0.0187 0.0976
SMOTE-Bagging 97.5694 0.8770 0.8515 0.8640 0.2860 0.9560 0.7280 0.0368 0.1338
SMOTE-RS 98.9583 0.9945 0.8930 0.9375 0.2140 0.9950 0.8746 0.0352 0.1109
200
SMOTE-RotBoost 99.9999 0.9999 0.9999 0.9999 0.0000 0.9999 0.9999 0.0029 0.0126
SMOTE-Boost 98.3051 0.9145 0,9685 0.9400 0.0480 0.9980 0.8798 0.0190 0.0987
SMOTE-Bagging 97.2881 0.9120 0.8755 0.8925 0.2380 0.9250 0.7855 0.0457 0.1456
SMOTE-RS 97.9661 0.9230 0.9230 0.9230 0.1430 0.9960 0.8462 0.0410 0.1143
300
SMOTE-RotBoost 99.9999 0.9999 0.9999 0.9999 0.0000 0.9999 0.9999 0.0003 0.0009
SMOTE-Boost 98.0132 0.9300 0.9570 0.9430 0.0710 0.9960 0.8856 0.0247 0.1105
SMOTE-Bagging 97.6821 0.9370 0.9230 0.9300 0.1430 0.9780 0.8600 0.0399 0.1376
SMOTE-RS 98.6755 0.9930 0.9285 0.9580 0.1430 0.9960 0.9159 0.0434 0.1150
400
SMOTE-RotBoost 99.9999 0.9999 0.9999 0.9999 0.0000 0.9999 0.9999 0.0015 0.0097
SMOTE-Boost 98.0583 0.9425 0.9640 0.9530 0.0570 0.9960 0.9057 0.0242 0.1096
SMOTE-Bagging 98.0583 0.9750 0.9265 0.9490 0.1430 0.9940 0.8983 0.0354 0.1267
SMOTE-RS 97.7346 0.9485 0.9375 0.9430 0.1140 0.9940 0.8858 0.0500 0.1360
500
SMOTE-RotBoost 99.9999 0.9999 0.9999 0.9999 0.0000 0.9999 0.9999 0.0025 0.0105
SMOTE-Boost 98.1013 0.9510 0.9685 0.9595 0.0480 0.9970 0.9193 0.0243 0.1090
SMOTE-Bagging 97.7848 0.9560 0.9470 0.9515 0.0950 0.9500 0.9029 0.0420 0.1442
SMOTE-RS 97.7848 0.9560 0.9470 0.9515 0.0950 0.9970 0.9029 0.0511 0.1255
Yea
st 6
41
.40
100
SMOTE-RotBoost 99.9999 0.9999 0.9999 0.9999 0.0000 0.9999 0.9999 0.0000 0.0000
SMOTE-Boost 95.8525 0.7895 0.6315 0.6775 0.7290 0.9600 0.3581 0.0546 0.1664
SMOTE-Bagging 97.7617 0.8970 0.8315 0.8610 0.3290 0.9760 0.7228 0.0374 0.1313
SMOTE-RS 95.7867 0.9790 0.5430 0.4980 0.9140 0.9380 0.1517 0.0610 0.1589
200
SMOTE-RotBoost 99.9999 0.9999 0.9999 0.9999 0.0000 0.9999 0.9999 0.0000 0.0000
SMOTE-Boost 95.8172 0.8305 0.8450 0.8380 0.8380 0.9680 0.6752 0.0620 0.1756
SMOTE-Bagging 97.0399 0.8960 0.8605 0.8320 0.2670 0.9840 0.7542 0.0474 0.1458
SMOTE-RS 97.3616 0.9595 0.8225 0.8770 0.3520 0.9820 0.7549 0.0661 0.1545
300
SMOTE-RotBoost 99.9999 0.9999 0.9999 0.9999 0.0000 0.9999 0.9999 0.0000 0.0000
SMOTE-Boost 94.9025 0.8285 0.8880 0.8550 0.1860 0.9680 0.7099 0.0689 0.1845
SMOTE-Bagging 97.0422 0.9130 0.9000 0.9065 0.1860 0.9850 0.8129 0.0495 0.1443
SMOTE-RS 97.0422 0.9505 0.8575 0.8975 0.2790 0.9800 0.7955 0.0709 0.1618

Journal of Theoretical and Applied Information Technology 10
th February 2015. Vol.72 No.1
© 2005 - 2015 JATIT & LLS. All rights reserved.
ISSN: 1992-8645 www.jatit.org E-ISSN: 1817-3195
50
400
SMOTE-RotBoost 99.9999 0.9999 0.9999 0.9999 0.0000 0.9999 0.9999 0.0000 0.0000
SMOTE-Boost 95.1355 0.8720 0.8775 0.8745 0.2170 0.9730 0.7489 0.0720 0.1960
SMOTE-Bagging 96.6749 0.9240 0.8985 0.9105 0.1890 0.9910 0.8217 0.0502 0.1454
SMOTE-RS 97.2291 0.9475 0.9040 0.9245 0.1830 0.9800 0.8487 0.0751 0.1667
500
SMOTE-RotBoost 99.9999 0.9999 0.9999 0.9999 0.0000 0.9999 0.9999 0.0000 0.0000
SMOTE-Boost 94.7559 0.8855 0.8740 0.8795 0.2240 0.9690 0.7594 0.0775 0.2026
SMOTE-Bagging 96.6847 0.9330 0.9140 0.9235 0.1570 0.9920 0.8466 0.0551 0.1522
SMOTE-RS 97.3478 0.9700 0.9075 0.9360 0.1810 0.9930 0.8717 0.0807 0.1580
Figure 3: average of overall accuracy from SMOTE 100% to 500%
Figure 4: average of precision, recall and f-score from SMOTE 100% to 500%

Journal of Theoretical and Applied Information Technology 10
th February 2015. Vol.72 No.1
© 2005 - 2015 JATIT & LLS. All rights reserved.
ISSN: 1992-8645 www.jatit.org E-ISSN: 1817-3195
51
Figure 5: average of false negative rate
Figure 6: average values of area under curve and kappa statistic
Figure 7: average values of mean absolute error and root mean square error
Journal of Theoretical and Applied Information Technology 10
th February 2015. Vol.72 No.1
© 2005 - 2015 JATIT & LLS. All rights reserved.
ISSN: 1992-8645 www.jatit.org E-ISSN: 1817-3195
52
REFERENCES:
[1] N. V. Chawla, K. W. Bowyer, L. O. Hall, and W. P. Kegelmeyer, "SMOTE: synthetic minority over-sampling technique," Journal of Artificial Intelligence Research, vol. 16, pp. 321-357, 2002.
[2] S. Kotsiantis, D. Kanellopoulos, and P. Pintelas, "Handling imbalanced datasets: A review," GESTS International Transactions on Computer Science and Engineering, vol. 30, pp. 25-36, 2006.
[3] N. V. Chawla, "Data mining for imbalanced datasets: An overview," in Data mining and knowledge discovery handbook, ed: Springer, 2005, pp. 853-867.
[4] G. K. J. Shawe-Taylor, "Optimizing classifiers for imbalanced training sets," in Advances in Neural Information Processing Systems 11: Proceedings of the 1998 Conference, 1999, p. 253.
[5] F. Provost, "Machine learning from imbalanced data sets 101," in Proceedings of the AAAI’2000 workshop on imbalanced data sets, 2000, pp. 1-3.
[6] G. M. Weiss and F. Provost, "The effect of class distribution on classifier learning: an empirical study," Rutgers Univ, 2001.
[7] N. Japkowicz and S. Stephen, "The class imbalance problem: A systematic study," Intelligent data analysis, vol. 6, pp. 429-449, 2002.
[8] N. Japkowicz, "The class imbalance problem: Significance and strategies," in Proc. of the Int’l Conf. on Artificial Intelligence, 2000.
[9] S. Ertekin, J. Huang, and C. L. Giles, "Active learning for class imbalance problem," in Proceedings of the 30th annual international ACM SIGIR conference on Research and development in information retrieval, 2007, pp. 823-824.
[10] X. Guo, Y. Yin, C. Dong, G. Yang, and G. Zhou, "On the class imbalance problem," in Natural Computation, 2008. ICNC'08. Fourth International Conference on, 2008, pp. 192-201.
[11] N. V. Chawla, "Data mining for imbalanced datasets: An overview," in Data Mining and Knowledge Discovery Handbook, ed: Springer, 2010, pp. 875-886.
[12] D. Kuang, C. X. Ling, and J. Du, "Foundation of mining class-imbalanced data," in Advances in Knowledge Discovery and Data Mining, ed: Springer, 2012, pp. 219-230.
[13] H. He and E. A. Garcia, "Learning from imbalanced data," Knowledge and Data Engineering, IEEE Transactions on, vol. 21, pp. 1263-1284, 2009.
[14] Q. Gu, Z. Cai, L. Zhu, and B. Huang, "Data mining on imbalanced data sets," in Advanced Computer Theory and Engineering, 2008. ICACTE'08. International Conference on, 2008, pp. 1020-1024.
[15] A. Orriols and E. Bernadó-Mansilla, "The class imbalance problem in learning classifier systems: a preliminary study," in Proceedings of the 2005 workshops on Genetic and evolutionary computation, 2005, pp. 74-78.
[16] N. V. Chawla, N. Japkowicz, and A. Kotcz, "Editorial: special issue on learning from imbalanced data sets," ACM Sigkdd Explorations Newsletter, vol. 6, pp. 1-6, 2004.
[17] N. Japkowicz, "Learning from imbalanced data sets: a comparison of various strategies," in AAAI workshop on learning from imbalanced data sets, 2000.
[18] J. Van Hulse, T. M. Khoshgoftaar, and A. Napolitano, "Experimental perspectives on learning from imbalanced data," in Proceedings of the 24th international conference on Machine learning, 2007, pp. 935-942.
[19] S. Hido, H. Kashima, and Y. Takahashi, "Roughly balanced bagging for imbalanced data," Statistical Analysis and Data Mining, vol. 2, pp. 412-426, 2009.
[20] T. M. Khoshgoftaar, J. Van Hulse, and A. Napolitano, "Comparing boosting and bagging techniques with noisy and imbalanced data," Systems, Man and Cybernetics, Part A: Systems and Humans, IEEE Transactions on, vol. 41, pp. 552-568, 2011.
[21] C. Li, "Classifying imbalanced data using a bagging ensemble variation (BEV)," in Proceedings of the 45th annual southeast regional conference, 2007, pp. 203-208.
[22] X. Zhu, "Lazy bagging for classifying imbalanced data," in Data Mining, 2007. ICDM 2007. Seventh IEEE International Conference on, 2007, pp. 763-768.
[23] B. C. Wallace, K. Small, C. E. Brodley, and T. A. Trikalinos, "Class imbalance, redux," in Data Mining (ICDM), 2011 IEEE 11th International Conference on, 2011, pp. 754-763.
[24] L. Breiman, "Bagging predictors," Machine learning, vol. 24, pp. 123-140, 1996.
Journal of Theoretical and Applied Information Technology 10
th February 2015. Vol.72 No.1
© 2005 - 2015 JATIT & LLS. All rights reserved.
ISSN: 1992-8645 www.jatit.org E-ISSN: 1817-3195
53
[25] N. V. Chawla, A. Lazarevic, L. O. Hall, and K. W. Bowyer, "SMOTEBoost: Improving prediction of the minority class in boosting," in Knowledge Discovery in Databases: PKDD 2003, ed: Springer, 2003, pp. 107-119.
[26] C. Seiffert, T. M. Khoshgoftaar, J. Van Hulse, and A. Napolitano, "RUSBoost: A hybrid approach to alleviating class imbalance," Systems, Man and Cybernetics, Part A: Systems and Humans, IEEE Transactions on, vol. 40, pp. 185-197, 2010.
[27] S. Hukerikar, A. Tumma, A. Nikam, and V. Attar, "SkewBoost: An algorithm for classifying imbalanced datasets," in Computer and Communication Technology (ICCCT), 2011 2nd International Conference on, 2011, pp. 46-52.
[28] Y. Freund and R. E. Schapire, "Experiments with a new boosting algorithm," in ICML, 1996, pp. 148-156.
[29] H. Guo and H. L. Viktor, "Learning from imbalanced data sets with boosting and data generation: the DataBoost-IM approach," ACM SIGKDD Explorations Newsletter, vol. 6, pp. 30-39, 2004.
[30] R. Akbani, S. Kwek, and N. Japkowicz, "Applying support vector machines to imbalanced datasets," in Machine Learning: ECML 2004, ed: Springer, 2004, pp. 39-50.
[31] Y. Liu, A. An, and X. Huang, "Boosting prediction accuracy on imbalanced datasets with SVM ensembles," in Advances in Knowledge Discovery and Data Mining, ed: Springer, 2006, pp. 107-118.
[32] Y. Tang, Y.-Q. Zhang, N. V. Chawla, and S. Krasser, "SVMs modeling for highly imbalanced classification," Systems, Man, and Cybernetics, Part B: Cybernetics, IEEE Transactions on, vol. 39, pp. 281-288, 2009.
[33] C. Zou, J. Gong, and H. Li, "An improved sequence based prediction protocol for DNA-binding proteins using SVM and comprehensive feature analysis," BMC bioinformatics, vol. 14, p. 90, 2013.
[34] C. Caragea, J. Sinapov, A. Silvescu, D. Dobbs, and V. Honavar, "Glycosylation site prediction using ensembles of Support Vector Machine classifiers," BMC bioinformatics, vol. 8, p. 438, 2007.
[35] L. Nanni and A. Lumini, "Ensemblator: An ensemble of classifiers for reliable classification of biological data," Pattern Recognition Letters, vol. 28, pp. 622-630, 2007.
[36] M. Galar, A. Fernandez, E. Barrenechea, H. Bustince, and F. Herrera, "A review on ensembles for the class imbalance problem: bagging-, boosting-, and hybrid-based approaches," Systems, Man, and Cybernetics, Part C: Applications and Reviews, IEEE Transactions on, vol. 42, pp. 463-484, 2012.
[37] R. Maclin and D. Opitz, "Popular ensemble methods: An empirical study," arXiv preprint arXiv:1106.0257, 2011.
[38] Z.-H. Zhou, Ensemble methods: foundations and algorithms: CRC Press, 2012.
[39] L. Rokach, "Ensemble-based classifiers," Artificial Intelligence Review, vol. 33, pp. 1-39, 2010.
[40] T. G. Dietterich, "Ensemble methods in machine learning," in Multiple classifier systems, ed: Springer, 2000, pp. 1-15.
[41] O. Okun and G. Valentini, Supervised and Unsupervised Ensemble Methods and their Applications vol. 126: Springer, 2008.
[42] S. Kotsiantis, "Combining bagging, boosting, rotation forest and random subspace methods," Artificial Intelligence Review, vol. 35, pp. 223-240, 2011/03/01 2011.
[43] J. Ghavidel, S. Yazdani, and M. Analoui, "A new ensemble classifier creation method by creating new training set for each base classifier," in Information and Knowledge Technology (IKT), 2013 5th Conference on, 2013, pp. 290-294.
[44] P. Yang, Y. Hwa Yang, B. B Zhou, and A. Y Zomaya, "A review of ensemble methods in bioinformatics," Current Bioinformatics, vol. 5, pp. 296-308, 2010.
[45] N. R. Garge, G. Bobashev, and B. Eggleston, "Random forest methodology for model-based recursive partitioning: the mobForest package for R," BMC bioinformatics, vol. 14, p. 125, 2013.
[46] J. Eickholt and J. Cheng, "DNdisorder: predicting protein disorder using boosting and deep networks," BMC bioinformatics, vol. 14, p. 88, 2013.
[47] P. Jain and J. D. Hirst, "Automatic structure classification of small proteins using random forest," BMC bioinformatics, vol. 11, p. 364, 2010.
[48] A. E. Jaffe, J. D. Storey, H. Ji, and J. T. Leek, "Gene set bagging for estimating the probability a statistically significant result will replicate," BMC bioinformatics, vol. 14, p. 360, 2013.

Journal of Theoretical and Applied Information Technology 10
th February 2015. Vol.72 No.1
© 2005 - 2015 JATIT & LLS. All rights reserved.
ISSN: 1992-8645 www.jatit.org E-ISSN: 1817-3195
54
[49] L. Lusa, "Class prediction for high-dimensional class-imbalanced data," BMC bioinformatics, vol. 11, p. 523, 2010.
[50] Y. Wang, W. Goh, L. Wong, and G. Montana, "Random forests on Hadoop for genome-wide association studies of multivariate neuroimaging phenotypes," BMC Bioinformatics, vol. 14, pp. 1-15, 2013.
[51] B. Zhang and T. D. Pham, "Phenotype recognition with combined features and random subspace classifier ensemble," BMC bioinformatics, vol. 12, p. 128, 2011.
[52] K. Moorthy and M. S. Mohamad, "Random forest for gene selection and microarray data classification," Bioinformation, vol. 7, p. 142, 2011.
[53] L. I. Kuncheva, J. J. Rodríguez, C. O. Plumpton, D. E. Linden, and S. J. Johnston, "Random subspace ensembles for fMRI classification," Medical Imaging, IEEE Transactions on, vol. 29, pp. 531-542, 2010.
[54] E. Bauer and R. Kohavi, "An empirical comparison of voting classification algorithms: Bagging, boosting, and variants," Machine learning, vol. 36, pp. 105-139, 1999.
[55] R. Bryll, R. Gutierrez-Osuna, and F. Quek, "Attribute bagging: improving accuracy of classifier ensembles by using random feature subsets," Pattern recognition, vol. 36, pp. 1291-1302, 2003.
[56] G. Seni and J. F. Elder, "Ensemble methods in data mining: improving accuracy through combining predictions," Synthesis Lectures on Data Mining and Knowledge Discovery, vol. 2, pp. 1-126, 2010.
[57] V. Nikulin, G. J. McLachlan, and S. K. Ng, "Ensemble approach for the classification of imbalanced data," in AI 2009: Advances in Artificial Intelligence, ed: Springer, 2009, pp. 291-300.
[58] T. G. Dietterich, "An experimental comparison of three methods for constructing ensembles of decision trees: Bagging, boosting, and randomization," Machine learning, vol. 40, pp. 139-157, 2000.
[59] G. Nasierding, B. Duc, S. Lee, and A. Z. Kouzani, "Dual-random ensemble method for multi-label classification of biological data," in Proceedings of the 2009 International Symposium on Bioelectronics and Bioinformatics, 2009, p. 49.
[60] P. Yang, "ENSEMBLE METHODS AND HYBRID ALGORITHMS FOR COMPUTATIONAL AND SYSTEMS BIOLOGY," The University of Sydney, 2012.
[61] M. Re and G. Valentini, "Simple ensemble methods are competitive with state-of-the-art data integration methods for gene function prediction," 2010.
[62] T. Hothorn, M. Dettling, and P. Bühlmann, "Ensemble methods of computational inference," in Bioinformatics and Computational Biology Solutions Using R and Bioconductor, ed: Springer, 2005, pp. 293-311.
[63] D.-C. Li, C.-W. Liu, and S. C. Hu, "A learning method for the class imbalance problem with medical data sets," Computers in biology and medicine, vol. 40, pp. 509-518, 2010.
[64] Y. Qi, "Random forest for bioinformatics," in Ensemble Machine Learning, ed: Springer, 2012, pp. 307-323.
[65] L. Deng, J. Guan, Q. Dong, and S. Zhou, "Prediction of protein-protein interaction sites using an ensemble method," BMC bioinformatics, vol. 10, p. 426, 2009.
[66] G. Pio, D. Malerba, D. D’Elia, and M. Ceci, "Integrating microRNA target predictions for the discovery of gene regulatory networks: a semi-supervised ensemble learning approach," BMC Bioinformatics, vol. 15, pp. 1-17, 2014.
[67] Z.-H. You, Y.-K. Lei, L. Zhu, J. Xia, and B. Wang, "Prediction of protein-protein interactions from amino acid sequences with ensemble extreme learning machines and principal component analysis," BMC bioinformatics, vol. 14, p. S10, 2013.
[68] K. D. MacIsaac, D. B. Gordon, L. Nekludova, D. T. Odom, J. Schreiber, D. K. Gifford, et al., "A hypothesis-based approach for identifying the binding specificity of regulatory proteins from chromatin immunoprecipitation data," Bioinformatics, vol. 22, pp. 423-429, 2006.
[69] P. Radivojac, N. V. Chawla, A. K. Dunker, and Z. Obradovic, "Classification and knowledge discovery in protein databases," Journal of Biomedical Informatics, vol. 37, pp. 224-239, 2004.
[70] R. Batuwita and V. Palade, "microPred: effective classification of pre-miRNAs for human miRNA gene prediction," Bioinformatics, vol. 25, pp. 989-995, 2009.
[71] J. Xiao, X. Tang, Y. Li, Z. Fang, D. Ma, Y. He, et al., "Identification of microRNA precursors based on random forest with network-level representation method of stem-loop structure," BMC bioinformatics, vol. 12, p. 165, 2011.

Journal of Theoretical and Applied Information Technology 10
th February 2015. Vol.72 No.1
© 2005 - 2015 JATIT & LLS. All rights reserved.
ISSN: 1992-8645 www.jatit.org E-ISSN: 1817-3195
55
[72] X. T. Dang, O. Hirose, T. Saethang, V. A. Tran, L. A. T. Nguyen, T. K. T. Le, et al., "A novel over-sampling method and its application to miRNA prediction," Journal of Biomedical Science and Engineering, vol. 6, p. 236, 2013.
[73] D.-G. Guan, J.-Y. Liao, Z.-H. Qu, Y. Zhang, and L.-H. Qu, "Detecting microRNAs from genome and next generation sequencing data using the Adaboost method with transition probability matrix and combined features," RNA biology, vol. 8, pp. 922-934, 2011.
[74] S. Lertampaiporn, C. Thammarongtham, C. Nukoolkit, B. Kaewkamnerdpong, and M. Ruengjitchatchawalya, "Heterogeneous ensemble approach with discriminative features and modified-SMOTEbagging for pre-miRNA classification," Nucleic acids research, vol. 41, pp. e21-e21, 2013.
[75] M. Nakamura, Y. Kajiwara, A. Otsuka, and H. Kimura, "LVQ-SMOTE–Learning Vector Quantization based Synthetic Minority Over–sampling Technique for biomedical data," BioData mining, vol. 6, p. 16, 2013.
[76] S. Doyle, J. Monaco, M. Feldman, J. Tomaszewski, and A. Madabhushi, "An active learning based classification strategy for the minority class problem: application to histopathology annotation," BMC bioinformatics, vol. 12, p. 424, 2011.
[77] L. Lusa, "SMOTE for high-dimensional class-imbalanced data," BMC bioinformatics, vol. 14, p. 106, 2013.
[78] C. M. Livi, L. Paillard, E. Blanzieri, and Y. Audic, "Identification of Regulatory Binding Sites on mRNA Using in Vivo Derived Informations and SVMs," in 6th International Conference on Practical Applications of Computational Biology & Bioinformatics, 2012, pp. 33-41.
[79] Z. Quan, G. Maozu, L. Yang, and W. Jun, "A classification method for class imbalanced data and its application on bioinformatics," Journal of Computer Research and Development, vol. 47, pp. 1407-1414, 2010.
[80] N. Qazi and K. Raza, "Effect of Feature Selection, SMOTE and under Sampling on Class Imbalance Classification," in Computer Modelling and Simulation (UKSim), 2012 UKSim 14th International Conference on, 2012, pp. 145-150.
[81] J. J. Rodriguez, L. I. Kuncheva, and C. J. Alonso, "Rotation forest: A new classifier ensemble method," Pattern Analysis and
Machine Intelligence, IEEE Transactions on, vol. 28, pp. 1619-1630, 2006.
[82] L. I. Kuncheva and J. J. Rodríguez, "An experimental study on rotation forest ensembles," in Multiple Classifier Systems, ed: Springer, 2007, pp. 459-468.
[83] J. R. Quinlan, C4. 5: programs for machine learning vol. 1: Morgan kaufmann, 1993.
[84] J. R. Quinlan, "Bagging, boosting, and C4. 5," in AAAI/IAAI, Vol. 1, 1996, pp. 725-730.
[85] C.-X. Zhang, J.-S. Zhang, and G.-W. Wang, "An empirical study of using Rotation Forest to improve regressors," Applied Mathematics and Computation, vol. 195, pp. 618-629, 2008.
[86] C. Pardo, J. F. Diez-Pastor, C. García-Osorio, and J. J. Rodríguez, "Rotation Forests for regression," Applied Mathematics and Computation, vol. 219, pp. 9914-9924, 2013.
[87] E. M. Karabulut and T. İbrikçi, "Effective diagnosis of coronary artery disease using the rotation forest ensemble method," Journal of medical systems, vol. 36, pp. 3011-3018, 2012.
[88] A. Ozcift, "SVM feature selection based rotation forest ensemble classifiers to improve computer-aided diagnosis of Parkinson disease," Journal of medical systems, vol. 36, pp. 2141-2147, 2012.
[89] K.-H. Liu and D.-S. Huang, "Cancer classification using rotation forest," Computers in Biology and Medicine, vol. 38, pp. 601-610, 2008.
[90] A. Ozcift and A. Gulten, "A robust multi-class feature selection strategy based on rotation forest ensemble algorithm for diagnosis of Erythemato-Squamous diseases," Journal of medical systems, vol. 36, pp. 941-949, 2012.
[91] G. Stiglic and P. Kokol, "Effectiveness of rotation forest in meta-learning based gene expression classification," in Computer-Based Medical Systems, 2007. CBMS'07. Twentieth IEEE International Symposium on, 2007, pp. 243-250.
[92] A. Dehzangi, S. Phon-Amnuaisuk, M. Manafi, and S. Safa, "Using rotation forest for protein fold prediction problem: An empirical study," in Evolutionary Computation, Machine Learning and Data Mining in Bioinformatics, ed: Springer, 2010, pp. 217-227.
[93] A. Ozcift and A. Gulten, "Classifier ensemble construction with rotation forest to improve medical diagnosis performance of machine learning algorithms," Computer Methods and
Journal of Theoretical and Applied Information Technology 10
th February 2015. Vol.72 No.1
© 2005 - 2015 JATIT & LLS. All rights reserved.
ISSN: 1992-8645 www.jatit.org E-ISSN: 1817-3195
56
Programs in Biomedicine, vol. 104, pp. 443-451, 12// 2011.
[94] C. J. Alonso-González, Q. I. Moro-Sancho, I. Ramos-Muñoz, and M. A. Simón-Hurtado, "Rotation forest on microarray domain: PCA versus ICA," in Trends in Applied Intelligent Systems, ed: Springer, 2010, pp. 96-105.
[95] H. I. Elshazly, A. M. Elkorany, A. E. Hassanien, and A. T. Azar, "Ensemble classifiers for biomedical data: Performance evaluation," in Computer Engineering & Systems (ICCES), 2013 8th International Conference on, 2013, pp. 184-189.
[96] K. Ridge, "Kent ridge bio-medical dataset (2009)," ed.
[97] Y. Freund and R. E. Schapire, "A decision-theoretic generalization of on-line learning and an application to boosting," Journal of computer and system sciences, vol. 55, pp. 119-139, 1997.
[98] M. Galar, A. Fernández, E. Barrenechea, H. Bustince, and F. Herrera, "A review on ensembles for the class imbalance problem: bagging-, boosting-, and hybrid-based approaches," Systems, Man, and Cybernetics, Part C: Applications and Reviews, IEEE Transactions on, vol. 42, pp. 463-484, 2012.
[99] C.-X. Zhang and J.-S. Zhang, "RotBoost: A technique for combining Rotation Forest and AdaBoost," Pattern Recognition Letters, vol. 29, pp. 1524-1536, 7/15/ 2008.
[100] M. Fatourechi, R. K. Ward, S. G. Mason, J. Huggins, A. Schlogl, and G. E. Birch, "Comparison of evaluation metrics in classification applications with imbalanced datasets," in Machine Learning and Applications, 2008. ICMLA'08. Seventh International Conference on, 2008, pp. 777-782.
[101] D. M. Powers, "Evaluation: from precision, recall and F-measure to ROC, informedness, markedness & correlation," Journal of Machine Learning Technologies, vol. 2, pp. 37-63, 2011.
[102] D. L. Olson and D. Delen, Advanced data mining techniques: Springer Publishing Company, Incorporated, 2008.
[103] R. Baeza-Yates and B. Ribeiro-Neto, Modern information retrieval vol. 463: ACM press New York, 1999.
[104] T. M. Mitchell, "Machine learning. 1997," Burr Ridge, IL: McGraw Hill, vol. 45, 1997.
[105] I. Witthen and E. Frank, "Data Mining—Practical Machine Learning Tools and Techniques With Java Implementations," ed:
New York and San Mateo, CA: Morgan Kaufmann Publishers, Academic Press, 2000.
[106] G. E. Batista, R. C. Prati, and M. C. Monard, "A study of the behavior of several methods for balancing machine learning training data," ACM SIGKDD Explorations Newsletter, vol. 6, pp. 20-29, 2004.
[107] T. Fawcett, "An introduction to ROC analysis," Pattern recognition letters, vol. 27, pp. 861-874, 2006.
[108] M. H. Zweig and G. Campbell, "Receiver-operating characteristic (ROC) plots: a fundamental evaluation tool in clinical medicine," Clinical chemistry, vol. 39, pp. 561-577, 1993.
[109] D. G. Altman and J. M. Bland, "Diagnostic tests 3: receiver operating characteristic plots," BMJ: British Medical Journal, vol. 309, p. 188, 1994.
[110] T. Fawcett, "ROC graphs: Notes and practical considerations for researchers," Machine learning, vol. 31, pp. 1-38, 2004.
[111] T. A. Lasko, J. G. Bhagwat, K. H. Zou, and L. Ohno-Machado, "The use of receiver operating characteristic curves in biomedical informatics," Journal of biomedical informatics, vol. 38, pp. 404-415, 2005.
[112] J. Huang and C. X. Ling, "Using AUC and accuracy in evaluating learning algorithms," Knowledge and Data Engineering, IEEE Transactions on, vol. 17, pp. 299-310, 2005.
[113] C. E. Metz, "Basic principles of ROC analysis," in Seminars in nuclear medicine, 1978, pp. 283-298.
[114] G. A. Mansoor and W. B. White, "Receiver operating characteristics of home blood pressure measurements thatbest detect ambulatory hypertension," American Journal of Hypertension, vol. 17, p. S51, 5// 2004.
[115] C. X. Ling, J. Huang, and H. Zhang, "AUC: a better measure than accuracy in comparing learning algorithms," in Advances in Artificial Intelligence, ed: Springer, 2003, pp. 329-341.
[116] J. A. Hanley and K. O. Hajian-Tilaki, "Sampling variability of nonparametric estimates of the areas under receiver operating characteristic curves: an update," Academic radiology, vol. 4, pp. 49-58, 1997.
[117] J. Cohen, "A coefficient of agreement for nominal scales," Educational and Psychological Measurement, 1960.
[118] J. Carletta, "Assessing agreement on classification tasks: the kappa statistic," Comput. Linguist., vol. 22, pp. 249-254, 1996.
Journal of Theoretical and Applied Information Technology 10
th February 2015. Vol.72 No.1
© 2005 - 2015 JATIT & LLS. All rights reserved.
ISSN: 1992-8645 www.jatit.org E-ISSN: 1817-3195
57
[119] B. Di Eugenio and M. Glass, "The kappa statistic: A second look," Computational linguistics, vol. 30, pp. 95-101, 2004.
[120] J. R. Landis and G. G. Koch, "The measurement of observer agreement for categorical data," biometrics, vol. 33, pp. 159-174, 1977.
[121] H. C. Kraemer, "Measurement of reliability for categorical data in medical research," Statistical Methods in Medical Research, vol. 1, pp. 183-199, 1992.
[122] A. Von Eye and E. Y. Mun, Analyzing rater agreement: Manifest variable methods: Psychology Press, 2004.
[123] J. L. Fleiss, B. Levin, and M. C. Paik, Statistical methods for rates and proportions: John Wiley & Sons, 2013.
[124] K. L. Gwet, "Variance estimation of nominal-scale inter-rater reliability with random selection of raters," Psychometrika, vol. 73, pp. 407-430, 2008.
[125] J. Sim and C. C. Wright, "The kappa statistic in reliability studies: use, interpretation, and sample size requirements," Physical therapy, vol. 85, pp. 257-268, 2005.
[126] A. Jimeno, E. Jimenez-Ruiz, V. Lee, S. Gaudan, R. Berlanga, and D. Rebholz-Schuhmann, "Assessment of disease named entity recognition on a corpus of annotated sentences," Bmc Bioinformatics, vol. 9, 2008.
[127] H. Chmura Kraemer, V. S. Periyakoil, and A. Noda, "Kappa coefficients in medical research," Statistics in medicine, vol. 21, pp. 2109-2129, 2002.
[128] T. McGinn, P. C. Wyer, T. B. Newman, S. Keitz, and R. Leipzig, "Tips for learners of evidence-based medicine: 3. Measures of observer variability (kappa statistic)," Canadian Medical Association Journal, vol. 171, pp. 1369-1373, 2004.
[129] C. J. Willmott and K. Matsuura, "Advantages of the mean absolute error (MAE) over the root mean square error (RMSE) in assessing average model performance," Climate Research, vol. 30, p. 79, 2005.
[130] T. Chai and R. Draxler, "Root mean square error (RMSE) or mean absolute error (MAE)?," Geoscientific Model Development Discussions, vol. 7, pp. 1525-1534, 2014.
[131] T. Chai, H.-C. Kim, P. Lee, D. Tong, L. Pan, Y. Tang, et al., "Evaluation of the United States National Air Quality Forecast Capability experimental real-time predictions in 2010 using Air Quality System ozone and
NO 2 measurements," Geoscientific Model Development, vol. 6, 2013.
[132] S. McKeen, J. Wilczak, G. Grell, I. Djalalova, S. Peckham, E. Y. Hsie, et al., "Assessment of an ensemble of seven real]time ozone
forecasts over eastern North America during
the summer of 2004," Journal of Geophysical
Research: Atmospheres (1984–2012), vol.
110, 2005.
[133] N. Savage, P. Agnew, L. Davis, C. Ordóñnez,
R. Thorpe, C. Johnson, et al., "Air quality
modelling using the Met Office Unified
Model (AQUM OS24-26): model description
and initial evaluation," Geoscientific Model
Development, vol. 6, 2013.
[134] N. V. Chawla, A. Lazarevic, L. O. Hall, and
K. W. Bowyer, "SMOTEBoost: Improving
prediction of the minority class in boosting,"
Knowledge Discovery in Databases: PKDD
2003, pp. 107-119, 2003.
[135] S. Wang and X. Yao, "Diversity analysis on
imbalanced data sets by using ensemble
models," in Computational Intelligence and
Data Mining, 2009. CIDM'09. IEEE
Symposium on, 2009, pp. 324-331.
[136] H.-Y. Huang, Y.-J. Lin, Y.-S. Chen, and H.-
Y. Lu, "Imbalanced data classification using
random subspace method and SMOTE," in
Soft Computing and Intelligent Systems
(SCIS) and 13th International Symposium on
Advanced Intelligent Systems (ISIS), 2012
Joint 6th International Conference on, 2012,
pp. 817-820.
Related Documents