Heinz Walz GmbH, Effeltrich, Germany http://www.walz.com/ PAM Application Notes (2008) 1: 1 - 10 (2 nd ed) New accessory for the DUAL-PAM-100: The P515/535 module and examples of its application Ulrich Schreiber and Christof Klughammer Abstract. The P515/535 module has become available as a new accessory for the DUAL-PAM-100. It serves for si- multaneous measurements of the dual beam 550 - 515 nm difference signal, reflecting the electrochromic pigment shift (ECS, P515), and of the single beam 535 nm signal, reflecting "membrane energization" ("scattering" changes). The technical features of the emitter and detector units of the new device are outlined and some typical examples of application are presented. A wide range of frequencies of the pulse modulated measuring light is provided, which can be rapidly altered under software control. In this way, the dark baseline can be assessed (at low frequency) and at the same time rapid induction kinetics can be measured (at high frequency). Due to an exceptionally high signal/noise ra- tio, the P515 change induced by a single-turnover saturating flash can be reliably measured without averaging. Com- parison of the single beam responses at 550, 535 and 515 nm with the dual beam 550 - 515 nm difference signal sug- gests that the latter is essentially free of "scattering" changes. Besides P515 (ECS), the 550 - 515 nm signal also con- tains information on the zeaxanthin content, which is reflected in changes of the "dark baseline". Such changes can be reliably evaluated due to the high signal stability, as demonstrated by measurements using an inert sample ("artificial leaf"). Valuable information on the membrane potential (Δψ) and proton gradient (ΔpH) components of the proton motive force (pmf) can be obtained by analyzing light-dark responses of the P515 signal, as previously demonstrated by David Kramer and co-workers (DIRK-analysis). The DUAL-PAM provides a special "P515 Flux" mode of opera- tion, with the actinic light being applied in form of light-dark pulses (1/1 modulation of light/dark). The "P515 Flux" signal provides valuable information on the steady-state rates of coupled electron and proton fluxes in vivo. Introduction The DUAL-PAM-100 is the successor of the PAM-100 Chlorophyll Fluorometer introduced in 1985. The "DUAL" stands for simultaneous measurements of two key signals, namely P700 absorbance and chlorophyll (Chl) fluorescence, as indicators of the efficiency of en- ergy conversion in photosystems I and II, respectively. In principle, such measurements have also been possible with the PAM-100, using various accessory components, like special emitter-detector units, single- and multiple- turnover flash lamps, actinic lamps for continuous illu- mination with blue, red or far-red light and data acquisi- tion system. All these components were miniaturized and optimized for fully computerized operation and inte- grated in the DUAL-PAM-100 to provide a compact and highly efficient universal photosynthesis measuring sys- tem. Besides measuring P700 and Chl fluorescence, this system can be extended by optional emitter-detector modules for assessment of other key photosynthesis pa- rameters, like transthylakoid proton gradient and mem- brane potential. Generally, the DUAL-PAM-100 is de- signed for measuring one pulse-modulated single beam signal (normally Chl fluorescence excited by red or blue measuring light) and one pulse-modulated dual beam dif- ference signal (normally P700 absorbance detected via the difference in the transmittance of 870 and 830 nm light). Here we report on a new P515/535 module, which can serve for in vivo assessment of the two components of the proton motive force (pmf), transmembrane potential (Δψ) and proton gradient (ΔpH), which drive ATP- synthesis via the reversible thylakoidal ATP-ase. The membrane potential is measured via the "electrochromic pigment absorbance shift" (ECS, P515) characterized by a broad peak at 515 - 525 nm. The ΔpH can be estimated from the light-off kinetics of the P515 signal and inde- pendently from the so-called "scattering" signal, charac- terized by a broad peak at 535 nm. Some background on P515. The P515 signal was discovered by Duysens (1954). Later, Junge and Witt (1968) showed that the P515 signal provides a linear measure of the electric potential across the thylakoid membrane. It is due to an electrochromic shift of pigment absorbance, mainly carotenoids and Chl b. For most of the original work on this signal, repeti- tive flash relaxation spectroscopy has been applied, as high quality signals can be obtained by averaging of the rapid responses, which can be readily distinguished from "non-specific" slow absorbance changes. A saturating single turnover flash induces an extremely rapid signal increase, which reflects the primary charge separation at PS I and PS II reaction centers. In intact, dark- adapted samples this rapid rise is followed by a much slower rise phase (t 1/2 approx. 20 ms), which is due to the electrogenic step in the so-called Q-cycle of the cyt b/f complex (Velthuys 1978), i.e. reflecting secondary inter- system electron transport induced by the primary charge separation. The rate of the ensuing signal decay is highly dependent on the physiological state of the sample, in P515/535 module 1

Welcome message from author
This document is posted to help you gain knowledge. Please leave a comment to let me know what you think about it! Share it to your friends and learn new things together.
Transcript

Heinz Walz GmbH, Effeltrich, Germany http://www.walz.com/ PAM Application Notes (2008) 1: 1 - 10 (2nd ed)
New accessory for the DUAL-PAM-100: The P515/535 module and examples of its application Ulrich Schreiber and Christof Klughammer Abstract. The P515/535 module has become available as a new accessory for the DUAL-PAM-100. It serves for si-multaneous measurements of the dual beam 550 - 515 nm difference signal, reflecting the electrochromic pigment shift (ECS, P515), and of the single beam 535 nm signal, reflecting "membrane energization" ("scattering" changes). The technical features of the emitter and detector units of the new device are outlined and some typical examples of application are presented. A wide range of frequencies of the pulse modulated measuring light is provided, which can be rapidly altered under software control. In this way, the dark baseline can be assessed (at low frequency) and at the same time rapid induction kinetics can be measured (at high frequency). Due to an exceptionally high signal/noise ra-tio, the P515 change induced by a single-turnover saturating flash can be reliably measured without averaging. Com-parison of the single beam responses at 550, 535 and 515 nm with the dual beam 550 - 515 nm difference signal sug-gests that the latter is essentially free of "scattering" changes. Besides P515 (ECS), the 550 - 515 nm signal also con-tains information on the zeaxanthin content, which is reflected in changes of the "dark baseline". Such changes can be reliably evaluated due to the high signal stability, as demonstrated by measurements using an inert sample ("artificial leaf"). Valuable information on the membrane potential (Δψ) and proton gradient (ΔpH) components of the proton motive force (pmf) can be obtained by analyzing light-dark responses of the P515 signal, as previously demonstrated by David Kramer and co-workers (DIRK-analysis). The DUAL-PAM provides a special "P515 Flux" mode of opera-tion, with the actinic light being applied in form of light-dark pulses (1/1 modulation of light/dark). The "P515 Flux" signal provides valuable information on the steady-state rates of coupled electron and proton fluxes in vivo.
IntroductionThe DUAL-PAM-100 is the successor of the PAM-100 Chlorophyll Fluorometer introduced in 1985. The "DUAL" stands for simultaneous measurements of two key signals, namely P700 absorbance and chlorophyll (Chl) fluorescence, as indicators of the efficiency of en-ergy conversion in photosystems I and II, respectively. In principle, such measurements have also been possible with the PAM-100, using various accessory components, like special emitter-detector units, single- and multiple-turnover flash lamps, actinic lamps for continuous illu-mination with blue, red or far-red light and data acquisi-tion system. All these components were miniaturized and optimized for fully computerized operation and inte-grated in the DUAL-PAM-100 to provide a compact and highly efficient universal photosynthesis measuring sys-tem. Besides measuring P700 and Chl fluorescence, this system can be extended by optional emitter-detector modules for assessment of other key photosynthesis pa-rameters, like transthylakoid proton gradient and mem-brane potential. Generally, the DUAL-PAM-100 is de-signed for measuring one pulse-modulated single beam signal (normally Chl fluorescence excited by red or blue measuring light) and one pulse-modulated dual beam dif-ference signal (normally P700 absorbance detected via the difference in the transmittance of 870 and 830 nm light).
Here we report on a new P515/535 module, which can serve for in vivo assessment of the two components of the proton motive force (pmf), transmembrane potential
(Δψ) and proton gradient (ΔpH), which drive ATP-synthesis via the reversible thylakoidal ATP-ase. The membrane potential is measured via the "electrochromic pigment absorbance shift" (ECS, P515) characterized by a broad peak at 515 - 525 nm. The ΔpH can be estimated from the light-off kinetics of the P515 signal and inde-pendently from the so-called "scattering" signal, charac-terized by a broad peak at 535 nm.
Some background on P515.
The P515 signal was discovered by Duysens (1954). Later, Junge and Witt (1968) showed that the P515 signal provides a linear measure of the electric potential across the thylakoid membrane. It is due to an electrochromic shift of pigment absorbance, mainly carotenoids and Chl b. For most of the original work on this signal, repeti-tive flash relaxation spectroscopy has been applied, as high quality signals can be obtained by averaging of the rapid responses, which can be readily distinguished from "non-specific" slow absorbance changes. A saturating single turnover flash induces an extremely rapid signal increase, which reflects the primary charge separation at PS I and PS II reaction centers. In intact, dark-adapted samples this rapid rise is followed by a much slower rise phase (t1/2 approx. 20 ms), which is due to the electrogenic step in the so-called Q-cycle of the cyt b/f complex (Velthuys 1978), i.e. reflecting secondary inter-system electron transport induced by the primary charge separation. The rate of the ensuing signal decay is highly dependent on the physiological state of the sample, in
P515/535 module 1

Heinz Walz GmbH, Effeltrich, Germany http://www.walz.com/ PAM Application Notes (2008) 1: 1 - 10 (2nd ed)
particular with respect to membrane integrity and preil-lumination. The decay is generally accelerated by mem-brane ion-leakiness and specifically by H+ conductivity of the reversible thylakoidal ATP-ase. The latter is acti-vated by illumination and linked to transduction of the pmf in ATP-synthesis.
Until recently, relatively little work has been dedicated to the slow changes of P515 absorbance in the minutes time range upon continuous illumination. Klughammer et al. (1990) developed a Kinetic LED Array Spectrophotome-ter that allows to deconvolute a variety of overlapping absorbance changes including P515. Measurements with this system revealed a substantial membrane potential maintained during steady-state illumination, which is highly susceptible to physiological stress. Recently, Sacksteder and Kramer (2000) introduced a special tech-nique for evaluation of the P515 (ECS) signal during steady state illumination: The DIRK (Dark Interval Re-laxation Kinetic) technique uses brief (<500 ms) dark in-tervals to create perturbations in steady-state electron and proton fluxes. The initial rate of the ECS (P515) decay has been suggested to be a linear measure of proton flux rate (efflux via ATP-synthase that in the steady-state equals influx via protolytic electron transport steps) and consequently of electron flux as well. When longer dark times are given, the ECS (P515) displays complex relaxa-
tion kinetics that have been applied by Cruz et al. (2001) for differentiation between Δψ and ΔpH components of the overall pmf (partition analysis). The latter analysis poses considerable demands to the stability and selectiv-ity of the measured signal.
Some background on the 535 nm signal.
The absorbance change at 535 nm has been attributed to a light induced increase of "light scattering" related to in-ternal acidification of the thylakoids upon ΔpH forma-tion (Deamer et al. 1966, Heber 1968). It has been used in numerous studies as a convenient semi-quantitative in-dicator of "membrane energization" and of the ΔpH com-ponent of the pmf in isolated chloroplasts and intact leaves. It is closely correlated with another semi-quantitative indicator of "membrane energization"/ΔpH, namely non-photochemical fluorescence quenching as measured via the Chl fluorescence parameters qN (in par-ticular energy-dependent qE) and NPQ (see e.g. Bilger et al. 1988). While it has been assumed for a long time that the 535 nm signal is somehow caused by changes in grana stacking, this interpretation recently has been ques-tioned by Ruban et al. (2002), who suggest that the in-crease in 535 nm absorbance is due to a red shift of the zeaxanthin absorbance peak.
Materials and MethodsTechnical features of the new P515/535 module.
Fig. 1. Emitter unit DUAL-EP515 and detector unit DUAL-DP515
The P515/535 module consists of the emitter unit DUAL-EP515 and the detector unit DUAL-DP515, optical de-sign and outer appearance of which are equivalent to the standard emitter detector units for simultaneous meas-urements of P700 and Chl fluorescence, DUAL-E and DUAL-DR (or DUAL-DB), respectively. These units can be connected to the same leaf holder or optical unit ED-101US/MD (for measurements with suspensions). Hence, identical optical geometries and light conditions are pro-vided for comparative measurements of the different pho-tosynthesis parameters.
The DUAL-EP515 is connected to the EMITTER socket and the DUAL-DP515 (Fig. 1) to the DETECTOR 1 socket of the DUAL-C Power-and-Control Unit. The P515 signal is measured dual beam as 550 – 515 nm dif-ference signal in analogy to the 870 - 830 nm P700 sig-nal. The 550 nm reference was chosen in order to mini-mize any contribution of "light scattering" changes to the difference signal. Assuming a Gauss shape absorbance peak at 535 nm, the absorbance changes at 550 and 515 nm should be about equal (see related data below under Results). On the other hand, in contrast to 550 nm at 515 nm there is substantial absorbance by zeaxanthin (broad absorbance band), so that the 550-515 nm signal not only reflects P515, but zeaxanthin changes as well. These two signal components, however, can be readily distinguished by the fact that zeaxanthin changes are ex-tremely slow. The dark-light and light-dark induced
P515/535 module 2

Heinz Walz GmbH, Effeltrich, Germany http://www.walz.com/ PAM Application Notes (2008) 1: 1 - 10 (2nd ed)
550 – 515 nm changes in the sub-s to min time range are almost exclusively due to P515, whereas the slower changes ranging from minutes to hours reflect zeaxanthin formation (via violaxanthin and antheraxanthin de-epoxidation) and zeaxanthin epoxidation, respectively.
Specifications of the DUAL-EP515. The DUAL-EP515 features an array of 8 white LEDs equipped with interfer-ence filters. While the 550 nm measuring light is derived from 3 LEDs with 3 individual 550 nm interference fil-ters (5.5 nm HBW), 4 LEDs equipped with 4 individual 515 nm interference filters (8.5 nm HBW) provides 520 nm measuring light which was actually used to measure the “515 nm” absorption changes. A single LED with a 535 nm interference filter (5.5 nm HBW) gives 535 nm measuring light. These LEDs, which are arranged in a ring, are focused via a central 6.5 mm hole in a chip-on-board (COB) LED array (featuring 635 nm Power-LEDs) on a 10 x 10 mm Perspex rod, which serves for mixing the various light qualities and guiding the randomized light to the sample. In addition, a single 740 nm LED equipped with a 1 mm RG9 filter in the center of the LED array serves for far-red illumination with preferen-tial excitation of PSI. The COB array consists of 24 Power-LEDs, which for short time intervals can be driven with high currents (up to 1.5 A). It provides continuous actinic illumination as well as Multiple Turnover and Single Turnover flashes.
Specifications of the DUAL-DP515. The DUAL-DP515 features a 10x10 mm PIN-photodiode equipped with a 2 mm blue-green filter (BG39) transmitting the 520, 535 and 550 nm measuring light but blocking the 635 nm ac-tinic and 730 nm far-red light. A 10 x 10 mm Perspex rod guides the transmitted measuring light from the sample to the BG39 filter in front of the PIN-photodiode, which is mounted on a printed circuit board, where the pulse-modulated signals are preamplified. It should be noted that for the sake of maximal signal/noise the DUAL-DP515, in contrast to the DUAL-DR (or DUAL-DB), is not equipped with a COB LED array for actinic illumina-tion. Light-induced responses in P700/Chl fluorescence can be compared at identical intensity settings with the corresponding responses in P515/"Scattering" when the LED Array cable of the DUAL-DR (or DUAL-DB) is disconnected.
Calibration of the P515 signal. The DUAL-PAM-100 applies a special modulation technique for high-sensitivity measurements of dual beam difference signals. The DualPAM software supports automated balancing of the two transmitted beams via adjusting the LED currents ("Balance", Fig. 2), so that the difference signal is close to zero. The resulting LED current ratio, which depends on the spectral properties of the sample, is displayed. Af-ter "Balance" the changes in the difference signal can be detected with high sensitivity without any risk of ampli-fier saturation. The single signals, which may be more than 1000x larger than the recorded signal changes, can be determined with the help of a special calibration rou-
tine, which involves a defined transient decrease of the 515 nm signal with respect to the 550 nm signal (via cor-responding decrease in LED current). The original differ-ence signals are measured in Volt units, which are trans-formed into ΔI / I units with the help of the calibration routine. The “I” corresponds to the amplitude of the bal-anced overall signals. In Fig. 3, an example of calibration is shown for a tobacco leaf at Measuring Light intensity setting 10. In this example the ΔI / I corresponding to the depicted bar amounts to 3.57 x 10⁻³ units and an overall signal I = 26.8 V is calculated.
Fig. 2. Balancing the 520 and 550 nm beams - screenshot.
In principle, it is also possible to measure the single beam 515 nm and 550 nm signals (see example below under Results), when the LED current slide of the other (nor-mally compensating) LED is moved to zero. In this case, Gain 1 (Low Gain) has to be applied to avoid amplifier saturation.
Recording of the single beam 535 nm signal. The sin-gle beam 535´nm signal is recorded in form of a non-compensated signal in analogy to Chl fluorescence. Just like the “Fluo” signal, it saturates at about 5.5 V. There-fore, in contrast to the dual beam 550 - 515 nm signal, it is recorded at Low Gain (Fig. 4A), so that a high setting of Measuring Light (ML) intensity can be applied, for the
Fig. 3. Definition of the signal scale in ΔI/I units for a tobacco leaf us-ing the automated calibration routine.
P515/535 module 3

Heinz Walz GmbH, Effeltrich, Germany http://www.walz.com/ PAM Application Notes (2008) 1: 1 - 10 (2nd ed)
sake of a high signal/noise ratio. As "scattering" changes are relatively slow, High Damping can be applied, thus further improving the signal/noise. For display of kinetic recordings the 535 nm signal is inverted, so that a "scat-tering" increase, which corresponds to a signal decrease, is displayed as an upwards transient, in analogy to the P515 signal.
Means to prevent preillumination effects of the Meas-uring Light.
In contrast to measurements of P700 via the 870-830 nm signal, where near-infrared ML can be applied at very high intensity without any actinic effects, measurements of P515 and "scattering" are complicated by a substantial fraction of the green measuring light being absorbed by photosynthetic pigments. The DUAL-PAM software pro-vides a number of means for preventing significant preil-lumination effects of the ML without sacrificing signal quality. This particularly applies to the rapid P515 change induced by a single turnover saturating flash (ST flash), the kinetics of which are extremely sensitive to preillu-mination (due to light activation of the reversible ATP-ase). In this type of measurements advantage is taken of the fact that the LED driven ML can be rapidly switched on. When "Auto ML on" is active (Fig. 4B), upon Start of a Fast Kinetics recording the ML is automatically switched on, so that before the measurement the sample can be kept in absolute darkness. Furthermore, use of the so-called "Variable Block Frequency" can be made (Fig. 4C). ML pulses are applied in the form of 30 µs "pulse
blocks" (containing 12 pulses) separated by more or less long "dark blocks". The signal level may be monitored with negligibly small actinic effect at low "Block Fre-quency" (MF-low ranging from 1-1000 Hz), e.g. for sig-nal calibration or for assessment of the absolute level. The actual measurement of light-induced changes can be carried out at high pulse frequency (MF-high ranging from 100-10000 Hz), depending on the required time resolution. For maximal time resolution the ML pulse fre-quency can be switched to MF-max, corresponding to about 400 kHz, with the help of pre-programmed Fast Trigger files, which define triggering of the various light sources and of MF-max with 2.5 µs resolution.
Signal/noise ratio and signal stability.
For reliable in vivo measurements with intact leaves par-ticularly high demands on signal/noise ratio and signal stability are made. The signal amplitude depends on the intensity of the measuring light (settings 1 - 20), the am-plifier gain (settings 1 and 5) and the transmittance of the sample. While with leaf samples and isolated chloroplasts the noise is mainly determined by the electronics, in the case of algae suspensions the "sample noise" (movement of cells or groups of cells) contributes substantially to overall noise. Signal stability, which is particularly im-portant for long term recordings, is affected by instru-ment and sample parameters as well. In particular, signal drift can be caused by temperature related intensity changes of the pulse-modulated LED measuring light and by optical changes of the sample (e.g. caused by fluctua-tions of the leaf water status or settling of algae). As long as these changes apply equally to the 515 nm and 550 nm signals, they should be eliminated in the 550 - 515 nm difference signal.
The noise amplitude of a given recording is a function of the number of "Point Averages", the Measuring Light Frequency (MF-low, MF-high and MF-max) and of the Damping (time constants 10 µs for Fast Kinetics or 1 ms for Slow Kinetics). The DUAL-PAM-100 software offers an exceptionally wide range of data acquisition rates. Fast Kinetics data can be acquired at rates ranging from 2.5 µs to 1000 µs/point, with up to 128000 points being saved. Slow Kinetics can be recorded at 1 - 100 ms/point with up to 1024000 points (Fig. 4D; maximal recording time more than 28 hours). In practice, kinetics normally are measured with acquisition rates much higher than re-quired for time resolution of the recorded kinetics and at a later stage, upon viewing and analyzing the data, suit-able "Point Averaging" is applied for noise reduction (Fig. 4E). For example, when the flash-induced P515 change (consisting of an instantaneous rise followed by slower changes in the ms time range) is measured at 2.5 µs/point and MF-10000, no kinetic information is lost, if 100 "Point Averages" are applied (see example under Re-sults in Fig. 6). In this particular example, the noise am-plitude amounted to 10-4 ΔI/I units with 100 "Point Aver-ages", as compared to 3 x 10⁻³ ΔI/I units without "Point Averaging". In view of a flash-induced signal change in
A B
C
D E
Fig. 4. Parameter adjustment: screenshots.
P515/535 module 4

Heinz Walz GmbH, Effeltrich, Germany http://www.walz.com/ PAM Application Notes (2008) 1: 1 - 10 (2nd ed)
the order of 15 x 10-3 ΔI/I units, this noise may be con-sidered rather low.
A non-ambiguous assessment of the instrument related noise and signal "drift" is possible using an "artificial leaf". For this purpose, a plastic filter sheet with a trans-mittance spectrum in the green region similar to a green leaf (Roscolux #01: Light Bastard Amber) was sand-wiched between two layers of highly scattering transpar-ent paper. With this "artificial leaf #01" the signal ampli-tudes at 515, 535 and 550 nm were very similar to those of a normal tobacco leaf.
Figure 5 shows the 550 - 515 nm signal measured with the "artificial leaf #01" at increasing Measuring Light Frequencies (MF). At higher MF settings on one hand the noise is reduced and on the other hand a negative signal drift is induced. While the noise at MF20 amounts to about 3 x 10⁻³ ΔI/I units, it decreases to about 10-4 ΔI/I units at MF1000 and 3 x 10⁻⁵ ΔI/I units at MF10000. At MF10000 and ML Intensity 10 the integrated photosyn-thetically active radiation (PAR) of the ML amounts to 4 µmol quanta·m-2·s-1. In most applications, the actinic ef-fect of the ML may be considered negligibly small, when applied below MF5000. Up to MF1000 the signal drift over 5 min time period does not exceed 10-4 ΔI/I units.
Upon switching to higher MF settings there is a biphasic decline of the signal, which at MF2000 amounts to about 3 x 10⁻⁴ and at MF10000 to about 2 x 10⁻³ ΔI/I units over 5 min time periods.
Fig. 5. Effect of increasing Measuring Light Frequency (MF) on the noise and stability of the 550-515 nm signal using the "artificial leaf#01". ML intensity 10. Points averaged: 30.
High MF settings normally are applied for the recording of sub-s Fast Kinetics only, where slow signal drifts are of no concern and where the actinic effect of the ML can be ignored.
Results and Discussion Rapid P515 relaxation kinetics induced by single-turnover saturating flash
In Fig. 6 typical recordings of P515 absorbance changes induced by a saturating single turnover flash in an intact tobacco leaf are presented. Fig. 6A shows the response after 1 h dark adaptation. A rapid rise of 14 x 10-3 ΔI / I units is followed by a distinct slow rise phase, with the overall response peaking at about 20 ms, before a slow decline sets in. In Fig. 4B the response of the same sam-
ple is shown after 10 min illumination at 100 µmol quanta·m-2·s-1 followed by 4 min dark adapta-tion. The preillumination has dramatically speeded up the decay of the flash induced P515 change and the slow rise phase has disappeared. The rapid rise phase is diminished by about 13%. It may be emphasized that the P515/535 module allows to assess the essential parameters of the flash induced P515 change with single recordings, i.e. there is no need for
A B
Fig. 6. Typical recordings of P515 changes induced by saturating single turnover flashes in tobacco leaf. Single recordings of Fast Kinetics (no curve averaging) using Auto ML on and MF-10000. Display with 100 points averaging. A) Dark-adapted for 1 h. B) Preilluminated for 10 min at 100 µmol quanta/(m²·s) followed by 4 min dark.
P515/535 module 5
Heinz Walz GmbH, Effeltrich, Germany http://www.walz.com/ PAM Application Notes (2008) 1: 1 - 10 (2nd ed)
A
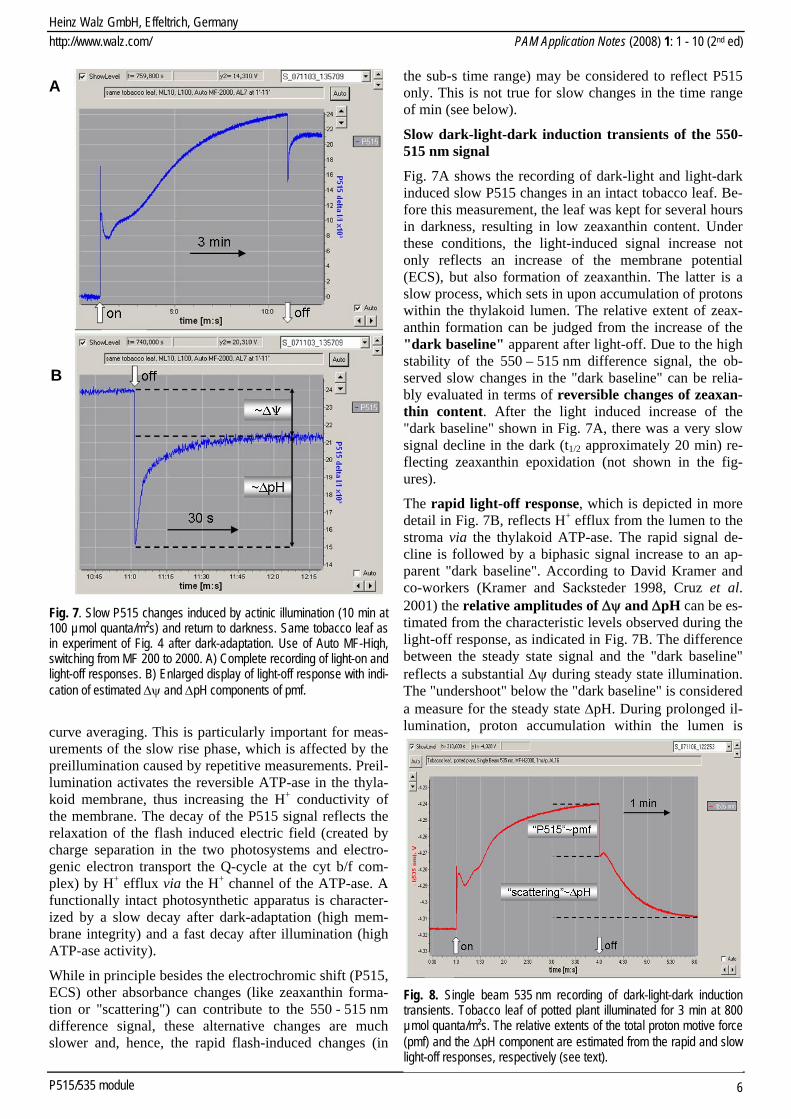
Fig. 7. Slow P515 changes induced by actinic illumination (10 min at100 µmol quanta/m²s) and return to darkness. Same tobacco leaf asin experiment of Fig. 4 after dark-adaptation. Use of Auto MF-High, switching from MF 200 to 2000. A) Complete recording of light-on and light-off responses. B) Enlarged display of light-off response with indi-cation of estimated Δψ and ΔpH components of pmf.
curve averaging. This is particularly important for meas-urements of the slow rise phase, which is affected by the preillumination caused by repetitive measurements. Preil-lumination activates the reversible ATP-ase in the thyla-koid membrane, thus increasing the H+ conductivity of the membrane. The decay of the P515 signal reflects the relaxation of the flash induced electric field (created by charge separation in the two photosystems and electro-genic electron transport the Q-cycle at the cyt b/f com-plex) by H+ efflux via the H+ channel of the ATP-ase. A functionally intact photosynthetic apparatus is character-ized by a slow decay after dark-adaptation (high mem-brane integrity) and a fast decay after illumination (high ATP-ase activity).
While in principle besides the electrochromic shift (P515, ECS) other absorbance changes (like zeaxanthin forma-tion or "scattering") can contribute to the 550 - 515 nm difference signal, these alternative changes are much slower and, hence, the rapid flash-induced changes (in
the sub-s time range) may be considered to reflect P515 only. This is not true for slow changes in the time range of min (see below).
Slow dark-light-dark induction transients of the 550-515 nm signal
Fig. 7A shows the recording of dark-light and light-dark induced slow P515 changes in an intact tobacco leaf. Be-fore this measurement, the leaf was kept for several hours in darkness, resulting in low zeaxanthin content. Under these conditions, the light-induced signal increase not only reflects an increase of the membrane potential (ECS), but also formation of zeaxanthin. The latter is a slow process, which sets in upon accumulation of protons within the thylakoid lumen. The relative extent of zeax-anthin formation can be judged from the increase of the "dark baseline" apparent after light-off. Due to the high stability of the 550 – 515 nm difference signal, the ob-served slow changes in the "dark baseline" can be relia-bly evaluated in terms of reversible changes of zeaxan-thin content. After the light induced increase of the "dark baseline" shown in Fig. 7A, there was a very slow signal decline in the dark (t1/2 approximately 20 min) re-flecting zeaxanthin epoxidation (not shown in the fig-ures).
B
The rapid light-off response, which is depicted in more detail in Fig. 7B, reflects H+ efflux from the lumen to the stroma via the thylakoid ATP-ase. The rapid signal de-cline is followed by a biphasic signal increase to an ap-parent "dark baseline". According to David Kramer and co-workers (Kramer and Sacksteder 1998, Cruz et al. 2001) the relative amplitudes of Δψ and ΔpH can be es-timated from the characteristic levels observed during the light-off response, as indicated in Fig. 7B. The difference between the steady state signal and the "dark baseline" reflects a substantial Δψ during steady state illumination. The "undershoot" below the "dark baseline" is considered a measure for the steady state ΔpH. During prolonged il-lumination, proton accumulation within the lumen is
P515/535 module 6
Fig. 8. Single beam 535 nm recording of dark-light-dark induction transients. Tobacco leaf of potted plant illuminated for 3 min at 800 µmol quanta/m²s. The relative extents of the total proton motive force (pmf) and the ΔpH component are estimated from the rapid and slow light-off responses, respectively (see text).

Heinz Walz GmbH, Effeltrich, Germany http://www.walz.com/ PAM Application Notes (2008) 1: 1 - 10 (2nd ed)
slowly compensated by anion influx. When upon light-off the accumulated protons are rapidly released from the lumen to the stroma via the ATP-ase, there is a sudden excess of negative charges at the internal side of the membrane, resulting in an inversed ECS. The inversed ECS slowly relaxes again during the following dark pe-riod, as anion concentrations of lumen and stroma equili-brate.
Dark-light-dark induction transients of the 535 nm signal
The single beam 535 nm signal shows complex dark-light-dark induction transients, which at low actinic in-tensities are dominated by the electrochromic shift and at high light intensities by the "scattering" change. Fig. 8 shows a typical recording with a tobacco leaf illuminated for 3 min at 800 µmol quanta·m-2·s-1. While the rapid on/off transients are due to the ECS (P515), the slow rise and decay phases reflect "scattering" changes, paralleling formation and decline of the ΔpH (Bilger et al. 1989).
It should be noted that the amplitude of the rapid light-off
response of the 535 nm signal cannot serve as a measure of the transmembrane Δψ, as has been assumed in nu-merous previous studies. In contrast to the rapid light-off response of the 550-515 nm signal described above (see Fig. 7b), it is not possible to measure the "dark baseline", as the slow ECS signal increase due to anion efflux is overlapped by the slow signal upon relaxation of the "scattering" signal.
Dual beam compared to single beam responses
The main purpose of measuring P515 dual beam as 550-515 nm difference signal is the elimination of the over-lapping "scattering" change. The following data suggest that "scattering" changes indeed are successfully sup-pressed. In Fig. 9 the single beam responses at 515, 550 and 535 nm are compared with the dual beam response (550-515 nm). Single beam 515 and 550 nm signals can be recorded, when after balance of the difference signal one of the two beams is turned off (by setting the LED current slide to zero).
Fig. 9. Comparison of single beam and dual beam responses. Tobacco leaf of potted plant illuminated at 800 µmol quanta/(m²·s). 8 min darkadaptation between consecutive measurements.
P515/535 module 7

Heinz Walz GmbH, Effeltrich, Germany http://www.walz.com/ PAM Application Notes (2008) 1: 1 - 10 (2nd ed)
While the single beam 515 and 550 nm responses display essentially the same slow "scattering" changes that domi-nate the 535 nm response, these are not apparent in the 550-515 nm difference signal.
Relatively mild heat pretreatment is known to substan-tially stimulate light induced "scattering" changes and to suppress the light induced P515 change (Bilger and Schreiber 1990). Fig. 10A shows the simultaneously measured single beam responses at 515 and 535 nm of a tobacco leaf pretreated for 5 min at 41°C. Compared with the corresponding traces in Fig. 9, the scattering response is considerably speeded up and its amplitude doubled. At the same time the rapid on/off P515 responses are low-ered by about a factor of 3. As shown in Fig. 10B, even under these highly unfavorable conditions, no scattering changes are apparent in the 550 - 515 nm difference sig-nal.
Long term P515 and 535 nm recording for assessment of light response characteristics
After stabilization of the Measuring Light LEDs (see sec-tion on signal stability under Materials and Methods), the P515 and 535 nm signals are sufficiently stable for as-sessment of long term signal changes in the hour time range. Prerequisite for such measurements is a stable wa-ter status of leaf samples. In Fig. 11 an example of a lengthy recording of the light-intensity dependence of the dark-light-dark responses is presented. The DualPAM software allows to program so-called Script-files, consist-ing of a list of commands, which are sequentially carried out at defined times by the instrument. In principle, all operations that can be carried out manually can also be programmed in a Script-file. In this way, even quite ex-tended and complex experiments can be reliably repro-duced.
While a detailed discussion of the complex information contained in the data of Fig. 11 would be out of scope of the present report, the following aspects shall be pointed out:
a) Both signals show a substantial rise of the "dark base-line", which may be assumed to reflect formation of zeaxanthin. After light-off, the "dark baseline dark" slowly returns to its original level with t1/2 = 20 min (not in the figures).
b) Surprisingly zeaxanthin formation already sets in at the lowest actinic intensity (step 1, 10 µmol quanta·m-2·s-1), i.e. under clearly light-limited conditions.
c) At low actinic intensity P515 and 535 nm signals dis-play very similar changes; both signals are dominated by the ECS, while no scattering change is apparent.
d) The steady state Δψ, as determined by the approach depicted in Fig. 7B, is negligibly small up to about 60 µmol quanta·m-2·s-1 (illumination step 3), then in-creases up to 300-400 µmol quanta·m-2·s-1 (illumina-tion steps 6-7), from whereon it declines again to zero.
A
Fig. 10. Simultaneous recording of dark-light-dark transients of singlebeam and dual beam signals of tobacco leaf pretreated for 5 min at41°C. 30 min recovery at room temperature (20°C). A) Comparison of single beam 515 and 535 nm signals. B) Comparison of dual-beam 550-515 nm with single beam 535 nm signal.
B
Fig. 11. Simultaneous recording of P515 and 535 nm signals of a dark-adapted tobacco leaf during the course of 3 min illumination pe-riods at increasing actinic intensities separated by 3 min dark periods.Actinic intensity sequentially was increased in ten steps from 10 to1600 µmol quanta/(m²·s). Plant dark-adapted over night before start ofScript-file recording.
P515/535 module 8

Heinz Walz GmbH, Effeltrich, Germany http://www.walz.com/ PAM Application Notes (2008) 1: 1 - 10 (2nd ed)
e) In contrast, the ΔpH component of the pmf continu-ously increases up to the maximal applied intensity. This finding is in agreement with the notion that the ΔpH (in contrast to the Δψ) plays a key role in the pro-tection against damage by excess light.
Estimation of coupled in vivo e- and H+ transport rates via "P515 flux" measurements
David Kramer and co-workers have presented extended work on the application of "Dark Induced Relaxation Ki-netics" (DIRK analysis) for assessment of the pmf and its relative partitioning into Δψ and ΔpH (Kramer and Sacksteder 1998, Kanazawa and Kramer 2002, Cruz et al. 2004). This work has confirmed and extended the results of basic research by numerous other researchers (e.g.
Witt, Junge, Rumberg, Joliot, Delosme, Bouges-Bocquet, Velthuys, Vredenberg, van Kooten, Hope, Cramer, Crofts, Whitmarsh, Rich, Garab, Hind, Crowther, Sha-hak, Morita) showing that the P515 signal carries funda-mental information on the rates of coupled electron and proton transport. During continuous illumination a flux equilibrium is established between formation of Δψ via charge separation at the reaction centers and relaxation of Δψ caused by H+ efflux via the ATP-ase. When illumina-tion is interrupted, formation of Δψ instantaneously is stopped (except for the dark electrogenic Q-cycle), whereas H+ efflux first continues at unchanged rate. The initial rate of the P515 light-off response may be taken as a measure of the H+ efflux rate during illumination, which is a function of the pmf (driving force) and the proton conductivity of the ATP-ase.
Fig. 12. Light-off response of the P515 signal in the steady-state with continuous illumination at 350 µmol quanta·m-2·s-1. Average of 4 re-cordings involving 2 s dark-periods separated by 30 s illumination. To-bacco leaf on potted plant.
Fig. 12 shows an example of measuring the light-off re-sponse of the P515 signal in a tobacco leaf with the DUAL-PAM-100. The system was programmed to inter-rupt continuous illumination at 350 µmol quanta·m-2·s-1 for 2 s and to measure the Fast Kinetics with 4 averages. The initial maximal rate is observed up to about 20 ms af-ter light-off. The DUAL-PAM-100 software offers the so-called "Flux Mode" for P515 and P700 measurements, which allows continuous assessment of the initial rates of P515 relaxa-tion and P700 re-reduction, respectively. When the "Flux Mode" is active, the actinic light is applied in form of light-dark pulses (1/1 modulation of light/dark). The modulation rate is determined by the Slow Kinetics Ac-quisition Rate. If e.g. an Acquisition Rate of 20 ms/p is selected, 20 ms AL-pulses are alternating with 20 ms dark-pulses. During steady-state illumination, the in-crease of the P515 signal (or Δψ) during an AL-pulse
Fig. 13. Dark-light induction curves of P515 (blue) and P515 Flux (green) signals. Slow Kinetics Acquisition Time 20 ms/p. Dark-adapted to-bacco leaf (attached, potted plant) in standard leaf-holder (without control of gas composition) illuminated at a mean actinic intensity of 300 µmol quanta·m-2·s-1. At time 22 min the CO2 supply was temporarily increased by blowing breath in the direction of the leaf from 1 m distance.
P515/535 module 9

Heinz Walz GmbH, Effeltrich, Germany http://www.walz.com/ PAM Application Notes (2008) 1: 1 - 10 (2nd ed)
equals the decrease of the P515 signal (or Δψ) during a dark-pulse. The repetitive signal changes are processed by the DUAL-PAM-100 to give a continuous "P515 Flux" signal, which can be displayed in parallel with the original P515 signal.
In Fig. 13 a "P515 Flux" measurement of a dark-light induction curve with 20 ms/p Acquisition Time is pre-sented. While phenomenologically the flux signal dis-plays some similarity to the original P515 signal, distin-guishing features are:
a) In contrast to the P515 signal, the flux signal is zero in the absence of actinic illumination. According to its definition, the measured flux corresponds to the charge separation rate in PS I and PS II, which is zero in the dark.
b) As the flux signal is derived from the rapid AL-off/on changes, it does not contain any contribution of the slow zeaxanthin (and scattering) changes.
When the CO2 concentration is transiently increased, this leads to a pronounced transient stimulation of the P515 signal. Simultaneously, a damped oscillation of the flux
signal is induced, with initial stimulation being followed by suppression etc. It appears likely that the suppression is due to a transient depletion of ADP, which temporarily slows down the H+ efflux rate via the ATP-ase. The ob-served oscillation is expression of a disturbance of the flux equilibrium between H+ influx (from stroma to lu-men side of the thylakoid membrane) coupled to photo-synthetic electron flow and H+ efflux via the ATP-ase. The oscillation and the eventually reestablished stable flux rate are the result of complex regulatory processes, leading to equilibration of the rates of primary charge separation (with consequent e- transport and H+ influx) and secondary H+ efflux.
In principle, it is possible to calibrate the "P515 Flux" signal in absolute units of H+/(mg Chl·time) or e-/(mg Chl·time), based on the amplitude of the rapid phase of the P515 change induced by a single turnover saturating flash. The latter corresponds to the transmem-brane field created by the movement of two electrons from inside to outside (one electron each in PS I and PS II). Details on the calibration procedure as well as com-parative measurements of the "P700 Flux" signal will be presented in a forthcoming communication.
ReferencesBilger W and Schreiber U (1990) Chlorophyll lumines-cence as indicator of stress-induced damage to the photo-synthetic apparatus. Effects of heat-stress in isolated chloroplasts. Photosynth Res 25: 161-171
Bilger W, Björkman O, Thayer SS (1989) Light-induced spectral absorbance changes in relation to photosynthesis and the epoxidation state of xanthophyll cycle compo-nents in cotton leaves. Plant Physiol 91: 542-551
Bilger W, Heber U and Schreiber U (1988) Kinetic rela-tionship between energy-dependent fluorescence quench-ing, light scattering, chlorophyll luminescence and proton pumping in intact leaves. Z Naturforsch 43c: 877-887
Cruz JA, Avenson TJ, Kanazawa A, Takizawa K, Ed-wards GE and Kramer DA (2004) Plasticity in light reac-tions of photosynthesis for energy production and photo-protection. J Exp Botany 56: 395-406
Deamer DW, Crofts AR and Packer L (1966) Mecha-nisms of light-induced structural changes in chloroplasts. I. Light-scattering increments and ultrastructural changes mediated by proton transport. Biochim Biophys Acta 131: 81-96
Duysens LNM (1954) Reversible changes in the absorp-tion spectrum of Chlorella upon irradiation. Science 120: 353-354
Heber U (1969) Conformational changes of chloroplasts induced by illumination of leaves in vivo. Biochim Bio-phys Acta 180: 302-319
Junge W and Witt HT (1968) On the ion transport system in photosynthesis: investigations on a molecular level. Z Naturforsch 23b: 244-254
Kanazawa A and Kramer DA (2002) In vivo modulation of non-photochemical quenching (NPQ) by regulation of the chloroplast ATP synthase. Proc Natl Acad Sci USA 99: 12798-12794
Klughammer C, Kolbowski J and Schreiber U (1990) LED array spectrophotometer for measurement of time resolved difference spectra in the 530–600 nm wave-length region. Photosynth Res 25: 317-327
Kramer DA and Sacksteder CA (1998) a diffused-optics flash kinetic spectrophotometer (DOFS) for measure-ments of absorbance changes in intact plants in the steady-state. Photosynth Res 56: 103-112
Ruban AV, Pascal AA, Robert B, Horton P (2002) Acti-vation of zeaxanthin is an obligatory event in the regula-tion of photosynthetic light harvesting. J Biol Chem 277: 7785–7789
Sacksteder CA and Kramer DA (2000) Dark interval re-laxation kinetics of absorbance changes as a quantitative probe of steady-state electron transfer. Photosynth Res 66: 145-158
Velthuys BR (1978) A third site of proton translocation in green plant photosynthetic electron transport. Proc Natl Acad Sci USA 76: 2765-2769
P515/535 module 10
Related Documents