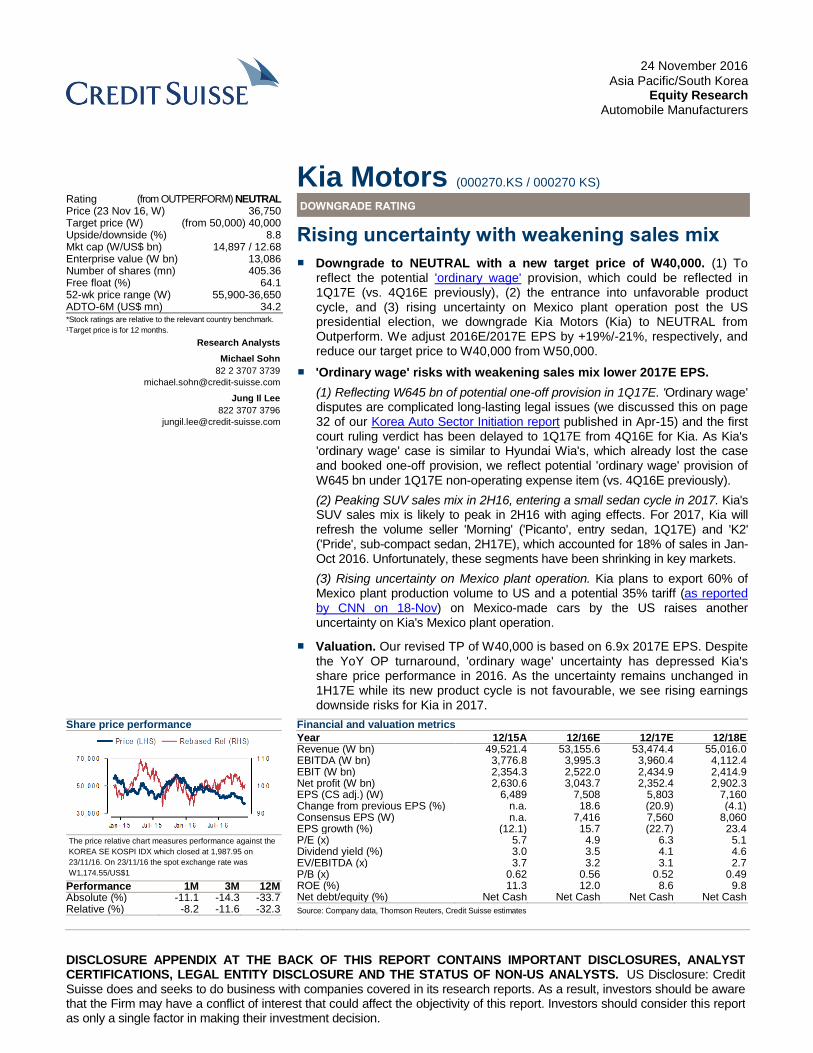
DISCLOSURE APPENDIX AT THE BACK OF THIS REPORT CONTAINS IMPORTANT DISCLOSURES, ANALYST CERTIFICATIONS, LEGAL ENTITY DISCLOSURE AND THE STATUS OF NON-US ANALYSTS. US Disclosure: Credit Suisse does and seeks to do business with companies covered in its research reports. As a result, investors should be aware that the Firm may have a conflict of interest that could affect the objectivity of this report. Investors should consider this report as only a single factor in making their investment decision. 24 November 2016 Asia Pacific/South Korea Equity Research Automobile Manufacturers Kia Motors (000270.KS / 000270 KS) Rating (from OUTPERFORM) NEUTRAL Price (23 Nov 16, W) 36,750 Target price (W) (from 50,000) 40,000 Upside/downside (%) 8.8 Mkt cap (W/US$ bn) 14,897 / 12.68 Enterprise value (W bn) 13,086 Number of shares (mn) 405.36 Free float (%) 64.1 52-wk price range (W) 55,900-36,650 ADTO-6M (US$ mn) 34.2 *Stock ratings are relative to the relevant country benchmark. ¹Target price is for 12 months. Research Analysts Michael Sohn 82 2 3707 3739 [email protected] Jung Il Lee 822 3707 3796 [email protected] DOWNGRADE RATING Rising uncertainty with weakening sales mix ■ Downgrade to NEUTRAL with a new target price of W40,000. (1) To reflect the potential 'ordinary wage' provision, which could be reflected in 1Q17E (vs. 4Q16E previously), (2) the entrance into unfavorable product cycle, and (3) rising uncertainty on Mexico plant operation post the US presidential election, we downgrade Kia Motors (Kia) to NEUTRAL from Outperform. We adjust 2016E/2017E EPS by +19%/-21%, respectively, and reduce our target price to W40,000 from W50,000. ■ 'Ordinary wage' risks with weakening sales mix lower 2017E EPS. (1) Reflecting W645 bn of potential one-off provision in 1Q17E. 'Ordinary wage' disputes are complicated long-lasting legal issues (we discussed this on page 32 of our Korea Auto Sector Initiation report published in Apr-15) and the first court ruling verdict has been delayed to 1Q17E from 4Q16E for Kia. As Kia's 'ordinary wage' case is similar to Hyundai Wia's, which already lost the case and booked one-off provision, we reflect potential 'ordinary wage' provision of W645 bn under 1Q17E non-operating expense item (vs. 4Q16E previously). (2) Peaking SUV sales mix in 2H16, entering a small sedan cycle in 2017. Kia's SUV sales mix is likely to peak in 2H16 with aging effects. For 2017, Kia will refresh the volume seller 'Morning' ('Picanto', entry sedan, 1Q17E) and 'K2' ('Pride', sub-compact sedan, 2H17E), which accounted for 18% of sales in Jan- Oct 2016. Unfortunately, these segments have been shrinking in key markets. (3) Rising uncertainty on Mexico plant operation. Kia plans to export 60% of Mexico plant production volume to US and a potential 35% tariff (as reported by CNN on 18-Nov) on Mexico-made cars by the US raises another uncertainty on Kia's Mexico plant operation. ■ Valuation. Our revised TP of W40,000 is based on 6.9x 2017E EPS. Despite the YoY OP turnaround, 'ordinary wage' uncertainty has depressed Kia's share price performance in 2016. As the uncertainty remains unchanged in 1H17E while its new product cycle is not favourable, we see rising earnings downside risks for Kia in 2017. Share price performance The price relative chart measures performance against the KOREA SE KOSPI IDX which closed at 1,987.95 on 23/11/16. On 23/11/16 the spot exchange rate was W1,174.55/US$1 Performance 1M 3M 12M Absolute (%) -11.1 -14.3 -33.7 Relative (%) -8.2 -11.6 -32.3 Financial and valuation metrics Year 12/15A 12/16E 12/17E 12/18E Revenue (W bn) 49,521.4 53,155.6 53,474.4 55,016.0 EBITDA (W bn) 3,776.8 3,995.3 3,960.4 4,112.4 EBIT (W bn) 2,354.3 2,522.0 2,434.9 2,414.9 Net profit (W bn) 2,630.6 3,043.7 2,352.4 2,902.3 EPS (CS adj.) (W) 6,489 7,508 5,803 7,160 Change from previous EPS (%) n.a. 18.6 (20.9) (4.1) Consensus EPS (W) n.a. 7,416 7,560 8,060 EPS growth (%) (12.1) 15.7 (22.7) 23.4 P/E (x) 5.7 4.9 6.3 5.1 Dividend yield (%) 3.0 3.5 4.1 4.6 EV/EBITDA (x) 3.7 3.2 3.1 2.7 P/B (x) 0.62 0.56 0.52 0.49 ROE (%) 11.3 12.0 8.6 9.8 Net debt/equity (%) Net Cash Net Cash Net Cash Net Cash Source: Company data, Thomson Reuters, Credit Suisse estimates

Welcome message from author
This document is posted to help you gain knowledge. Please leave a comment to let me know what you think about it! Share it to your friends and learn new things together.
Transcript
DISCLOSURE APPENDIX AT THE BACK OF THIS REPORT CONTAINS IMPORTANT DISCLOSURES, ANALYST CERTIFICATIONS, LEGAL ENTITY DISCLOSURE AND THE STATUS OF NON-US ANALYSTS. US Disclosure: Credit Suisse does and seeks to do business with companies covered in its research reports. As a result, investors should be aware that the Firm may have a conflict of interest that could affect the objectivity of this report. Investors should consider this report as only a single factor in making their investment decision.
24 November 2016 Asia Pacific/South Korea
Equity Research Automobile Manufacturers
Kia Motors (000270.KS / 000270 KS) Rating (from OUTPERFORM) NEUTRAL Price (23 Nov 16, W) 36,750 Target price (W) (from 50,000) 40,000 Upside/downside (%) 8.8 Mkt cap (W/US$ bn) 14,897 / 12.68 Enterprise value (W bn) 13,086 Number of shares (mn) 405.36 Free float (%) 64.1 52-wk price range (W) 55,900-36,650 ADTO-6M (US$ mn) 34.2 *Stock ratings are relative to the relevant country benchmark.
¹Target price is for 12 months.
Research Analysts
Michael Sohn
82 2 3707 3739
Jung Il Lee
822 3707 3796
DOWNGRADE RATING
Rising uncertainty with weakening sales mix
■ Downgrade to NEUTRAL with a new target price of W40,000. (1) To reflect the potential 'ordinary wage' provision, which could be reflected in 1Q17E (vs. 4Q16E previously), (2) the entrance into unfavorable product cycle, and (3) rising uncertainty on Mexico plant operation post the US presidential election, we downgrade Kia Motors (Kia) to NEUTRAL from Outperform. We adjust 2016E/2017E EPS by +19%/-21%, respectively, and reduce our target price to W40,000 from W50,000.
■ 'Ordinary wage' risks with weakening sales mix lower 2017E EPS.
(1) Reflecting W645 bn of potential one-off provision in 1Q17E. 'Ordinary wage' disputes are complicated long-lasting legal issues (we discussed this on page 32 of our Korea Auto Sector Initiation report published in Apr-15) and the first court ruling verdict has been delayed to 1Q17E from 4Q16E for Kia. As Kia's 'ordinary wage' case is similar to Hyundai Wia's, which already lost the case and booked one-off provision, we reflect potential 'ordinary wage' provision of
W645 bn under 1Q17E non-operating expense item (vs. 4Q16E previously).
(2) Peaking SUV sales mix in 2H16, entering a small sedan cycle in 2017. Kia's SUV sales mix is likely to peak in 2H16 with aging effects. For 2017, Kia will refresh the volume seller 'Morning' ('Picanto', entry sedan, 1Q17E) and 'K2' ('Pride', sub-compact sedan, 2H17E), which accounted for 18% of sales in Jan-Oct 2016. Unfortunately, these segments have been shrinking in key markets.
(3) Rising uncertainty on Mexico plant operation. Kia plans to export 60% of Mexico plant production volume to US and a potential 35% tariff (as reported by CNN on 18-Nov) on Mexico-made cars by the US raises another uncertainty on Kia's Mexico plant operation.
■ Valuation. Our revised TP of W40,000 is based on 6.9x 2017E EPS. Despite
the YoY OP turnaround, 'ordinary wage' uncertainty has depressed Kia's share price performance in 2016. As the uncertainty remains unchanged in 1H17E while its new product cycle is not favourable, we see rising earnings downside risks for Kia in 2017.
Share price performance
The price relative chart measures performance against the
KOREA SE KOSPI IDX which closed at 1,987.95 on
23/11/16. On 23/11/16 the spot exchange rate was
W1,174.55/US$1
Performance 1M 3M 12M Absolute (%) -11.1 -14.3 -33.7 Relative (%) -8.2 -11.6 -32.3
Financial and valuation metrics
Year 12/15A 12/16E 12/17E 12/18E Revenue (W bn) 49,521.4 53,155.6 53,474.4 55,016.0 EBITDA (W bn) 3,776.8 3,995.3 3,960.4 4,112.4 EBIT (W bn) 2,354.3 2,522.0 2,434.9 2,414.9 Net profit (W bn) 2,630.6 3,043.7 2,352.4 2,902.3 EPS (CS adj.) (W) 6,489 7,508 5,803 7,160 Change from previous EPS (%) n.a. 18.6 (20.9) (4.1) Consensus EPS (W) n.a. 7,416 7,560 8,060 EPS growth (%) (12.1) 15.7 (22.7) 23.4 P/E (x) 5.7 4.9 6.3 5.1 Dividend yield (%) 3.0 3.5 4.1 4.6 EV/EBITDA (x) 3.7 3.2 3.1 2.7 P/B (x) 0.62 0.56 0.52 0.49 ROE (%) 11.3 12.0 8.6 9.8 Net debt/equity (%) Net Cash Net Cash Net Cash Net Cash
Source: Company data, Thomson Reuters, Credit Suisse estimates

24 November 2016
Kia Motors (000270.KS / 000270 KS) 2
Focus charts
Figure 1: Despite four consecutive quarters of YoY
OP turnaround in 3Q15-2Q16…
Figure 2: …potential 'ordinary wage' provision of
W645 bn has been the key risk for Kia
Source: Company data, Credit Suisse estimates Source: Company data, Credit Suisse estimates
Figure 3: …which has caused the sluggish YTD
share price performance…
Figure 4: We reflect the provision in 1Q17E from
4Q16E to reflect the delay in 'ordinary wage' verdict
Source: Datastream, Credit Suisse Source: Company data, Credit Suisse estimates
Figure 5: Kia's SUV sales mix has peaked in 2016
with aging SUV models with the high base…
Figure 6: …and will enter a small sedan product
cycle, where segments have been shrinking
Source: Company data, Credit Suisse estimates * Sedan (mid-size & under) segment portion. Source: KAMA,CAAM, Autonews, Company data, Credit Suisse
4
-32
-19-23
-30
-15
20
3
2418
-23
11
-40
-20
0
20
40
1Q14 3Q14 1Q15 3Q15 1Q16 3Q16
Kia quarterly OP % YoY growth
(%)
-18
-1-0.3
-20
-15
-10
-5
0
Kia HMC Mobis
Potential impact on 2017E Pre-tax income
(%)
KRW645 bn
KRW14 bnKRW129 bn
71
107
68
60
70
80
90
100
110
Jan-15 Apr-15 Jul-15 Oct-15 Jan-16 Apr-16 Jul-16 Oct-16
Kia share performance relative to KOSPI
(January 2016 = 100)
3.66
3.02-0.645
0
1
2
3
4
2017E Pre-tax income(before provisioning)
W645bn provisioning for'ordinary wage' issue
2017E Pre-tax income(after provisioning)
(KRW tn)2017E Pre-tax income has now 18% (W645bn) potential downside from 'ordinary wage' provisioning (delayed to 1Q17E from 4Q16E)
16 16 15 1618 18
20
27
29
21
3336 32 32 31
3740 39
10
16
22
28
34
40
2009 2010 2011 2012 2013 2014 2015 2016E 2017E
HMC SUV segments sales mix Kia SUV segments sales mix
(%)(%)
62
45
71
41
35
2827
29
31
33
35
37
30
40
50
60
70
80
2007 2008 2009 2010 2011 2012 2013 2014 2015 2016YTD
Korea portion (LHS) China portion (LHS) US portion (RHS)
(%) (%)
24 November 2016
Kia Motors (000270.KS / 000270 KS) 3
Kia Motors (000270.KS / 000270 KS)
Price (23 Nov 2016): W36,750; Rating: (from OUTPERFORM) NEUTRAL; Target Price: (from W50,000) W40,000; Analyst: Michael Sohn
Income Statement (W bn) 12/15A 12/16E 12/17E 12/18E
Sales revenue 49,521 53,156 53,474 55,016 Cost of goods sold 39,654 42,673 43,033 44,325 EBITDA 3,777 3,995 3,960 4,112 EBIT 2,354 2,522 2,435 2,415 Net interest expense/(inc.) (85) (99) (165) (240) Recurring PBT 3,100 3,798 3,016 3,721 Profit after tax 2,631 3,044 2,352 2,902 Reported net profit 2,631 3,044 2,352 2,902 Net profit (Credit Suisse) 2,631 3,044 2,352 2,902
Balance Sheet (W bn) 12/15A 12/16E 12/17E 12/18E
Cash & cash equivalents 1,105 1,983 2,690 3,483 Current receivables 2,389 2,564 2,580 2,654 Inventories 7,695 7,729 7,240 6,899 Other current assets 7,202 8,368 9,060 9,981 Current assets 18,391 20,644 21,570 23,017 Property, plant & equip. 11,847 13,326 14,718 16,044 Investments 11,696 12,820 13,164 13,819 Intangibles 2,134 2,379 2,585 2,758 Other non-current assets 1,913 2,045 2,279 2,586 Total assets 45,980 51,214 54,316 58,224 Current liabilities 14,579 17,391 18,596 20,069 Total liabilities 21,776 24,634 25,911 27,524 Shareholders' equity 24,204 26,580 28,405 30,699 Minority interests 0 0 0 0 Total liabilities & equity 45,980 51,214 54,316 58,224
Cash Flow (W bn) 12/15A 12/16E 12/17E 12/18E
EBIT 2,354 2,522 2,435 2,415 Net interest 0 0 0 0 Tax paid 0 0 0 0 Working capital (1,836) (444) (702) (779) Other cash & non-cash items 2,857 1,729 2,541 2,738 Operating cash flow 3,375 3,807 4,274 4,374 Capex (3,915) (2,500) (2,425) (2,498) Free cash flow to the firm (539) 1,307 1,849 1,876 Investing cash flow (5,614) (2,077) (3,270) (3,226) Equity raised (146) (89) 0 0 Dividends paid (404) (441) (527) (608) Financing cash flow 906 (740) (297) (355) Total cash flow (1,332) 990 707 793 Adjustments (41) (112) 0 0 Net change in cash (1,374) 878 707 793
Per share 12/15A 12/16E 12/17E 12/18E
Shares (wtd avg.) (mn) 405 405 405 405 EPS (Credit Suisse) (W) 6,489 7,508 5,803 7,160 DPS (W) 1,100 1,300 1,500 1,700 Operating CFPS (W) 8,326 9,393 10,544 10,790
Earnings 12/15A 12/16E 12/17E 12/18E
Growth (%) Sales revenue 5.1 7.3 0.6 2.9 EBIT (8.5) 7.1 (3.5) (0.8) EPS (12.1) 15.7 (22.7) 23.4 Margins (%) EBITDA 7.6 7.5 7.4 7.5 EBIT 4.8 4.7 4.6 4.4
Valuation (x) 12/15A 12/16E 12/17E 12/18E
P/E 5.7 4.9 6.3 5.1 P/B 0.62 0.56 0.52 0.49 Dividend yield (%) 3.0 3.5 4.1 4.6 EV/sales 0.3 0.2 0.2 0.2 EV/EBITDA 3.7 3.2 3.1 2.7 EV/EBIT 6.0 5.1 5.0 4.6
ROE analysis (%) 12/15A 12/16E 12/17E 12/18E
ROE 11.3 12.0 8.6 9.8 ROIC 9.2 8.4 7.5 7.2
Credit ratios 12/15A 12/16E 12/17E 12/18E
Net debt/equity (%) (3.0) (7.3) (9.6) (12.4) Net debt/EBITDA (x) (0.20) (0.48) (0.69) (0.93)
Company Background
Kia Motors Corporation is a Korea-based automobile manufacturer of passenger vehicles, recreational vehicles, trucks and buses, taxies as well as special top vehicles under various brand names.
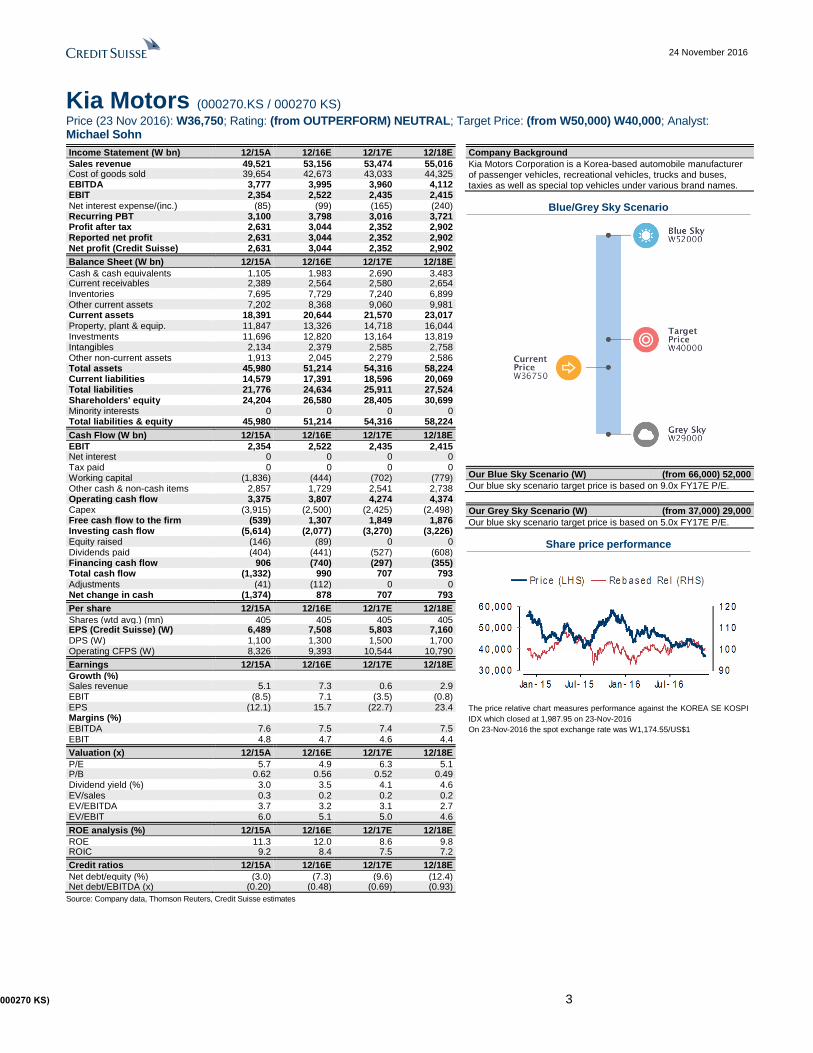
Blue/Grey Sky Scenario
Our Blue Sky Scenario (W) (from 66,000) 52,000
Our blue sky scenario target price is based on 9.0x FY17E P/E.
Our Grey Sky Scenario (W) (from 37,000) 29,000
Our blue sky scenario target price is based on 5.0x FY17E P/E.
Share price performance
The price relative chart measures performance against the KOREA SE KOSPI
IDX which closed at 1,987.95 on 23-Nov-2016
On 23-Nov-2016 the spot exchange rate was W1,174.55/US$1
Source: Company data, Thomson Reuters, Credit Suisse estimates

24 November 2016
Kia Motors (000270.KS / 000270 KS) 4
Rising uncertainty with weakening sales mix 'Ordinary wage' disputes have been complicated issues for Korean autos for years.
Since our initiation report, we've highlighted 'ordinary wage' disputes ("What constitutes
"ordinary wage" in Korea?'') which have long been one of the key risks for Korean autos,
(page 32 of Korea Auto Sector Initiation report published in Apr-15), in view of potential
wage hikes.
Production workers get paid 50% more than their ordinary wage for overtime or weekend
shifts. This means that if the scope of ordinary wages is expanded to include regular
bonuses, overtime and weekend shift wages will also have to be increased.
The Supreme Court of Korea ruled in December 2013 that bonuses should be included in
the scope of ordinary wages if such bonuses are paid: (1) on a regular, (2) uniform, and (3)
fixed basis. According to the first court ruling in January 2015, only 5,700 HMC employees
out of 60k, who used to work for Hyundai Motor Services before it merged with HMC in 1999,
meet all the above conditions (regularity, uniformity and fixedness). As the first and second
court rulings already favoured HMC, which are also similar for Hyundai Mobis (Mobis),
overall impact for HMC and Mobis is insignificant (Hyundai Motor wins wage legal suit).
The case of Kia is even more difficult than HMC's as Kia pays a bi-monthly bonus to
employees in regular, uniform and fixed fashion, and such payments could be considered
as ordinary wages. Kia is waiting for the first court ruling verdict which is expected to come
out in 1Q17E. If Kia loses the case, the scope of ordinary wage is expanded to include
regular bonuses and the company must pay the past three years of overtime wage
differences retroactively.
We assume W645 bn of 'ordinary wage' provision in 1Q17E (vs. 4Q16E previously).
According to our calculation, the potential one-off expense for Kia is estimated at W645 bn
which equates to 18% of 2017E pre-tax profit. As Kia's 'ordinary wage' case is similar to
Hyundai Wia's (Wia), which already lost the case and booked one-off provision, and the
company previously guided the first court verdict in 4Q16E, we previously reflected Kia's
potential 'ordinary wage' provision amounts of W645 bn under 4Q16E non-operating item
for conservative accounting (Ordinary wage' uncertainty dilutes fundamental turnaround).
However, as the verdict has been postponed to 1Q17E from 4Q16E, we now remove
W645 bn provision from 4Q16E and reflect it in 1Q17E, which results in us lifting 2016E
EPS by 19% and reducing 2017E EPS by 21%.

24 November 2016
Kia Motors (000270.KS / 000270 KS) 5
Figure 7: Ordinary wage impact calculation—Kia to see the biggest impact
Source: Company data, Credit Suisse estimates
Figure 8: Kia's 'ordinary wage' disputes could incur
W645 bn of provision in 1Q17E…
Figure 9: …which could lower 18% of Kia's 2017E
pre-tax profit
Source: Company data, Credit Suisse estimates Source: Company data, Credit Suisse estimates
Potential wages increase for HMC, Kia and Mobis
Assumptions
Estimated annual income W97.0m
Base salary portion 50%
Regular bonus portion 30%
Annual base salary W48.5m
Annual bi-monthly bonus W29.1m
Monthly 'ordinary wage' W4.0m
Monthly 'ordinary wage' including bonus W6.5m
Overtime wage calculation
Assumption: additional 50 days of overtime and the overtime wage equals 150% of ordinary wage per day
a) Overtime wage = 150% of 'ordinary wage' W4.0m * 150% * 38days W11.6m
b) Recalculation of overtime wage = 150% of base pay including bonusW6.5m * 150% * 38days W18.5m
c) Current retirement benefit W8.1m Overtime wage hike (b)- (a) W7.0m
d) Revised retirement benefit W8.7m Additional retirement benefit (d) - (c) W0.6m
Additional wage hike per person per year W7.5m
% of 2017E
pre-tax profit
# of HMC's production workers 5,700 Potential costs increase for HMC KRW129bn -1%
# of Kia's production workers 28,535 Potential costs increase for Kia KRW645bn -18%
# of Mobis' production workers 622 Potential costs increase for Mobis KRW14bn -0.3%
Michael Sohn:
- Weekend overtime:
1shift (8hours) a week * 50weeks = 400hours
- Weekday overtime:
1hours a day * five days a week * 50weeks = 250hours
-Total 650hours / 17hours a day = 38.2days
(1day = 8 hours * 2shifts = 16hours)
-18
-1-0.3
-20
-15
-10
-5
0
Kia HMC Mobis
Potential impact on 2017E Pre-tax income
(%)
KRW645 bn
KRW14 bnKRW129 bn
3.66
3.02-0.645
0
1
2
3
4
2017E Pre-tax income(before provisioning)
W645bn provisioning for'ordinary wage' issue
2017E Pre-tax income(after provisioning)
(KRW tn)2017E Pre-tax income has now 18% (W645bn) potential downside from 'ordinary wage' provisioning (delayed to 1Q17E from 4Q16E)

24 November 2016
Kia Motors (000270.KS / 000270 KS) 6
Peaking SUV sales mix in 2H16, entering small sedan cycle in 2017. As Kia has more
SUV & mini-van line-ups over Hyundai Motor (HMC), the company posted faster OP
turnaround from 3Q15 and continued to post four consecutive quarters of YoY OP
turnaround. Kia's SUV sales portion in Jan-Oct 2016 is at 42% (up 5 pp YoY) which is
higher than HMC's 26% (up 6 pp YoY). However, we are seeing Kia's SUV sales mix
weakening with aging SUV models with a high base. In Jan-Oct 2016, Kia's global SUV
sales growth came in at 11% YoY (vs. 2015's 17% YoY) and its SUV portion came down
to below 40% for two months in a row in September and October (vs. Jan-Aug 2016 SUV
sales portion of 43%).
Separately, Kia's 2017 new model rollout schedule is mostly focused on small passenger
sedans. Kia will refresh the major volume seller 'Morning' ('Picanto', entry sedan, 1Q17E)
and 'K2' ('Pride', sub-compact sedan, 2H17E), which accounted for 18% of sales in Jan-
Oct 2016. Unfortunately, these segments have been shrinking in key markets including
Korea, China, and the US. As seen from 'Optima' ('K5', mid-sized sedan), which did not
bring the new product momentum, we expect these two small sedans not to bring much
positive sales momentum for Kia in 2017E yet expect overall incentive spending to rise
along with aging SUVs.
Figure 10: Kia's SUV sales growth has begun to
slow down…
Figure 11: …and we forecast its SUV sales portion
to peak out in 2016…
Source: Company data, Credit Suisse Source: Company data, Credit Suisse estimates
Figure 12: Kia/HMC's new model roll-out schedule—Kia's 2017E new models are mostly passenger sedans Company 2015 Code 2016 Code 2017 and after Code
Kia Motors KX3 (1Q15, China) K7 follow-up (1Q16) YG Morning (Picanto) follow-up (1Q17) JA
K5 follow-up (3Q15) Sportage follow-up (1Q16, US/China/EU)
QL Pride (K2) follow-up (2H17) YB
K5 follow-up (4Q15, US) Niro hybrid (2Q16) DE K8 follow-up (1H17) CK
Sportage follow-up (3Q15) QL Pride (K2) follow-up (4Q16, China) Mid-sized SUV (China, 1Q17) QM
K5 hybrid (4Q15) B-segment CUV (3Q17)
Hyundai Motor Tucson follow-up (1Q15) TL Elantra follow-up (1Q16, US/China) AD Creta (SUV, 1Q17, Brazil)
Elantra follow-up (3Q15) AD Ioniq hybrid (1Q16) AE B-segment SUV (3Q16, Korea) OS
Creta (3Q15, India) i30 follow-up (3Q16) PD Accent follow-up (3Q17)
New hybrid model (4Q15) AE Creta (SUV, 3Q16, Russia) Veloster follow-up (4Q17)
Equus (EQ900) follow-up (4Q15) G80 Santa Fe (SUV, 3Q16, US) Genesis Coupe follow-up (2H17) IK
Tucson (SUV, 4Q16, India) TL Mid-sized luxury sedan (4Q17) G70
Azera follow-up (4Q16) IG Small-sized SUV (4Q17, China)
Source: Company data, Credit Suisse
45
40
25
30
35
40
45
50
Jan-14 Jul-14 Jan-15 Jul-15 Jan-16 Jul-16
Kia SUV sales portion
(%)
16 16 15 1618 18
20
27
29
21
3336 32 32 31
3740 39
10
16
22
28
34
40
2009 2010 2011 2012 2013 2014 2015 2016E 2017E
HMC SUV segments sales mix Kia SUV segments sales mix
(%)(%)

24 November 2016
Kia Motors (000270.KS / 000270 KS) 7
Figure 13: With shrinking mid-sized and under
passenger sedan segments in key markets…
Figure 14: Kia's new 'Optima' (mid-sized sedan)
posted weaker sales in Korea…
* Sedan (mid-size & under) segment portion. Source: KAMA,CAAM, Autonews, Company data, Credit Suisse
Source: Company data, Credit Suisse
Figure 15: …and lukewarm sales in the US…
Figure 16: …even with the much higher US
incentive spending has for the new 'Optima'
Source: Company data, Credit Suisse Source: Company data, Autodata, Credit Suisse
Figure 17: Causing overall US incentive spending to rise
Source: Company data, Credit Suisse estimates
62
45
71
41
35
2827
29
31
33
35
37
30
40
50
60
70
80
2007 2008 2009 2010 2011 2012 2013 2014 2015 2016YTD
Korea portion (LHS) China portion (LHS) US portion (RHS)
(%) (%)
0
2
4
6
8
10
12
1st month 4th month 7th month 10th month 13th month
Old K5 (Optima) - Korea sales trend since launch (May-10)
New K5 (Optima) - Korea sales trend since launch (Jul-15)
('000 units)
0
2
4
6
8
10
12
1st month 4th month 7th month 10th month 13th month
Old K5 (Optima) - US sales trend since launch (Nov-10)
New K5 (Optima) - US sales trend since launch (Oct-15)
('000 units)
0
1,000
2,000
3,000
4,000
5,000
1st month 4th month 7th month 10th month 13th month
Old K5 (Optima) - US incentive since launch (Nov-10)
New K5 (Optima) - US incentive since launch (Oct-15)
(USD)
3,133
1,500
2,000
2,500
3,000
3,500
Jan-13 Jan-14 Jan-15 Jan-16
Kia average US incentive spending
(USD)

24 November 2016
Kia Motors (000270.KS / 000270 KS) 8
Rising uncertainty on Mexico plant operation. Kia's share price has corrected 11% post
the US election as market concerns about a potential 35% tariff on Mexico-made vehicles
by the US which raises another uncertainty on Kia's newly built Mexico plant operation.
Kia plans to increase Mexico plant sales to 250k units (vs. our estimate of 230k units) in
2017E and about 60% of produced volume will be exported to the US. If the US raises
tariff for Mexico-made cars, Kia has to (1) reduce its production volume from Mexico and
increase exports to the US from Korea, or (2) re-allocate Mexico export volume to other
countries other than the US. In addition, a weakening Mexican Peso could cause Mexico
auto demand slowdown and also could increase uncertainty on forex translation loss when
recognising Mexico plant earnings under consolidated IFRS accounting.
Figure 18: 60% of Mexico plant sales is planned to
be exported to US…
Figure 19: ...and Mexico plant sales portion will
likely reach 10% by 2018E
Source: Company data, Credit Suisse estimates Source: Company data, Credit Suisse estimates
Figure 20: ...and a weakening Mexican Peso could cause forex translation loss
for Kia
Source: the BLOOMBERG PROFESSIONAL™ service, Credit Suisse
62
138
168
192210
0
50
100
150
200
250
2016E 2017E 2018E 2019E 2020E
Mexico plant export sales volume to US
('000 units) Kia plans to export 60% of its Mexico plant sales volume to the US
3.4
7.4
8.59.2 9.5
0
3
6
9
12
2016E 2017E 2018E 2019E 2020E
Kia's Mexico plant sales portion out of global sales volume
(%)
0.04
0.05
0.06
0.07
0.08
0.09
Jan-11 Jan-13 Jan-15
US Dollar / Mexican Peso
(USD/MXN)
50
60
70
80
90
100
Jan-11 Jan-13 Jan-15
Korean Won / Mexican Peso
(KRW/MXN)
24 November 2016
Kia Motors (000270.KS / 000270 KS) 9
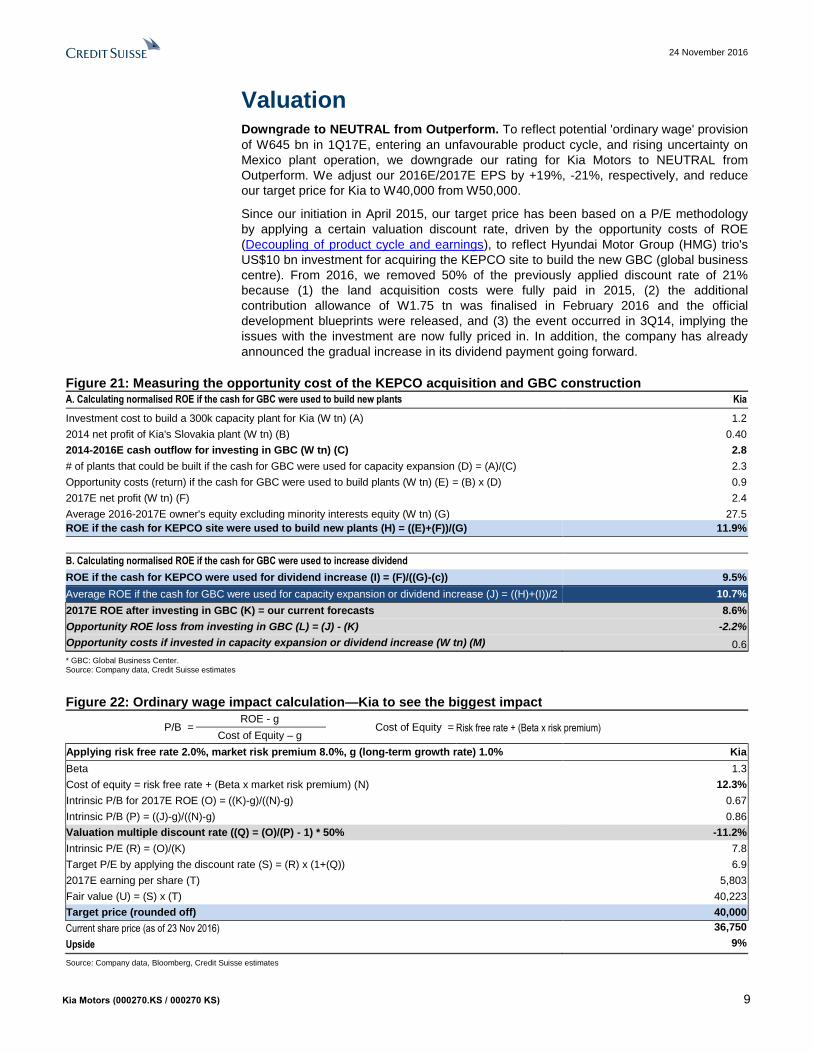
Valuation Downgrade to NEUTRAL from Outperform. To reflect potential 'ordinary wage' provision
of W645 bn in 1Q17E, entering an unfavourable product cycle, and rising uncertainty on
Mexico plant operation, we downgrade our rating for Kia Motors to NEUTRAL from
Outperform. We adjust our 2016E/2017E EPS by +19%, -21%, respectively, and reduce
our target price for Kia to W40,000 from W50,000.
Since our initiation in April 2015, our target price has been based on a P/E methodology
by applying a certain valuation discount rate, driven by the opportunity costs of ROE
(Decoupling of product cycle and earnings), to reflect Hyundai Motor Group (HMG) trio's
US$10 bn investment for acquiring the KEPCO site to build the new GBC (global business
centre). From 2016, we removed 50% of the previously applied discount rate of 21%
because (1) the land acquisition costs were fully paid in 2015, (2) the additional
contribution allowance of W1.75 tn was finalised in February 2016 and the official
development blueprints were released, and (3) the event occurred in 3Q14, implying the
issues with the investment are now fully priced in. In addition, the company has already
announced the gradual increase in its dividend payment going forward.
Figure 21: Measuring the opportunity cost of the KEPCO acquisition and GBC construction A. Calculating normalised ROE if the cash for GBC were used to build new plants Kia
Investment cost to build a 300k capacity plant for Kia (W tn) (A) 1.2
2014 net profit of Kia's Slovakia plant (W tn) (B) 0.40
2014-2016E cash outflow for investing in GBC (W tn) (C) 2.8
# of plants that could be built if the cash for GBC were used for capacity expansion (D) = (A)/(C) 2.3
Opportunity costs (return) if the cash for GBC were used to build plants (W tn) (E) = (B) x (D) 0.9
2017E net profit (W tn) (F) 2.4
Average 2016-2017E owner's equity excluding minority interests equity (W tn) (G) 27.5
ROE if the cash for KEPCO site were used to build new plants (H) = ((E)+(F))/(G) 11.9%
B. Calculating normalised ROE if the cash for GBC were used to increase dividend
ROE if the cash for KEPCO were used for dividend increase (I) = (F)/((G)-(c)) 9.5%
Average ROE if the cash for GBC were used for capacity expansion or dividend increase (J) = ((H)+(I))/2 10.7%
2017E ROE after investing in GBC (K) = our current forecasts 8.6%
Opportunity ROE loss from investing in GBC (L) = (J) - (K) -2.2%
Opportunity costs if invested in capacity expansion or dividend increase (W tn) (M) 0.6
* GBC: Global Business Center. Source: Company data, Credit Suisse estimates
Figure 22: Ordinary wage impact calculation—Kia to see the biggest impact
P/B = ROE - g
Cost of Equity = Risk free rate + (Beta x risk premium) Cost of Equity – g
Applying risk free rate 2.0%, market risk premium 8.0%, g (long-term growth rate) 1.0% Kia
Beta 1.3
Cost of equity = risk free rate + (Beta x market risk premium) (N) 12.3%
Intrinsic P/B for 2017E ROE (O) = ((K)-g)/((N)-g) 0.67
Intrinsic P/B (P) = ((J)-g)/((N)-g) 0.86
Valuation multiple discount rate ((Q) = (O)/(P) - 1) * 50% -11.2%
Intrinsic P/E (R) = (O)/(K) 7.8
Target P/E by applying the discount rate (S) = (R) x (1+(Q)) 6.9
2017E earning per share (T) 5,803
Fair value (U) = (S) x (T) 40,223
Target price (rounded off) 40,000
Current share price (as of 23 Nov 2016) 36,750
Upside 9%
Source: Company data, Bloomberg, Credit Suisse estimates

24 November 2016
Kia Motors (000270.KS / 000270 KS) 10
Figure 23: Kia—earnings estimate revisions
(KRW bn) 2015 2016E 2017E
Sales - New 49,521 53,156 53,474
Sales - Old 52,269 53,306
% change 1.7% 0.3%
Operating profit - New 2,354 2,522 2,435
Operating profit - Old 2,524 2,576
% change -0.1% -5.5%
Recurring profit - New 3,100 3,798 3,016
Recurring profit - Old 3,162 3,813
% change 20.1% -20.9%
Net profit - New (excluding minority shares) 2,631 3,044 2,352
Net profit - Old 2,567 2,974
% change 18.6% -20.9%
EPS - New (excluding minority shares) 6,489 7,508 5,803
EPS - Old 6,332 7,336
% change 18.6% -20.9%
Source: Company data, Credit Suisse estimates
Figure 24: Kia—4Q16E earnings preview 4Q16E
(W bn, %) 4Q15 3Q16 YoY (%) QoQ (%) CS est. Diff (%) Consensus
Sales revenue 12,792 12,699 4.4 5.2 13,357 -0.8 13,459
Operating profit 514 525 15.2 13.0 593 -5.2 625
Pre-tax profit 482 879 68.3 -7.7 812 -9.3 895
Net profit 431 664 41.4 -8.3 609 -8.5 665
OP margin 4.0 4.1 4.4 4.6
Pre-tax margin 3.8 6.9 6.1 6.7
NP margin 3.4 5.2 4.6 4.9
Source: Company data, Bloomberg estimates, Credit Suisse estimates
Figure 25: Kia—annual earnings forecasts 2016E 2017E
(KRW bn, %) CS est Consensus Variance (%) CS est Consensus Variance (%)
Sales revenue 53,156 53,058 0.2 53,474 54,689 -2.2
Operating profit 2,522 2,546 -0.9 2,435 2,686 -9.3
Pre-tax profit 3,798 3,753 1.2 3,016 3,866 -22.0
Net profit 3,044 3,012 1.0 2,352 3,047 -22.8
OP margin 4.7 4.8 -0.1ppt 4.6 4.9 -0.4ppt
Pre-tax margin 7.1 7.1 0.1ppt 5.6 7.1 -1.4ppt
NP margin 5.7 5.7 0.0ppt 4.4 5.6 -1.2ppt
Source: Company data, Bloomberg estimates, Credit Suisse estimates

24 November 2016
Kia Motors (000270.KS / 000270 KS) 11
Figure 26: Kia—one-year forward P/E band Figure 27: Kia—one-year forward P/B band
Source: Company data, Credit Suisse estimates Source: Company data, Credit Suisse estimates
Figure 28: Our 2017E OP is 9 % lower than falling
Bloomberg OP consensus
Figure 29: Falling one-year forward P/E multiple
trend
Source: Company data, the BLOOMBERG PROFESSIONAL™ service estimates, Credit Suisse estimates
Source: Company data, Credit Suisse estimates
Figure 30: Global auto OEMs—valuation comparison
Source: Company data, Credit Suisse estimates, IBES estimates for not rated companies
0
15,000
30,000
45,000
60,000
75,000
90,000
Jan-05 Jan-07 Jan-09 Jan-11 Jan-13 Jan-15
(KRW)
7.0x
6.0x
3.5x
2.0x
8.5x
0
15,000
30,000
45,000
60,000
75,000
90,000
Jan-05 Jan-07 Jan-09 Jan-11 Jan-13 Jan-15
(KRW)
1.2x
0.8x
0.5x
0.3x
2.2x
2.0
2.5
3.0
3.5
4.0
4.5
Jan-14 Jul-14 Jan-15 Jul-15 Jan-16 Jul-16
(KRW tn)
Kia 2017E consensus OP
Kia - 2017E Consensus OP: W2.7tnDownside to CS estimates: 9%
CSe
9.0
6.2
5
6
7
8
9
10
Jan-14 Jul-14 Jan-15 Jul-15 Jan-16 Jul-16
Kia 1-year forward P/E trend
(x)
Company Code Rec Price TP % Mkt Cap
As of 23-Nov-2016
(local) (local) Upside
(USD mn)
PER
(x)
PBR
(x)
NP Margin
(%)
EPS YoY
(%)
ROE
(%)
PER
(x)
PBR
(x)
NP Margin
(%)
EPS YoY
(%)
ROE
(%)
BMW BMWG.DE NC 83 N/A N/A 58,099 8.2 1.2 7.0 5.3 14.7 8.2 1.1 6.8 -0.3 13.4
Daimler DAIGn.DE NC 66 N/A N/A 74,495 8.1 1.2 5.6 2.5 14.9 7.7 1.1 5.9 5.1 15.3
Volkswagen VOWG_p.DE NC 121 N/A N/A 67,264 6.9 0.7 4.1 NM 10.3 5.6 0.6 4.8 23.2 11.1
FCA FCHA.MI NC 7 N/A N/A 11,611 4.7 0.6 2.0 NM 12.8 4.1 0.6 2.3 13.0 15.0
Renault RENA.PA NC 75 N/A N/A 21,846 6.2 0.7 6.7 18.2 11.4 5.5 0.6 7.0 12.0 11.8
Peugeot Citroen PEUP.PA NC 14 N/A N/A 13,104 7.1 1.0 3.2 93.7 15.3 6.8 0.9 3.3 3.9 12.7
Dongfeng Motor 0489.HK O 8 9 17 8,754 5.0 0.6 10.1 5.0 13.5 5.2 0.6 8.3 -4.2 11.6
Great Wall 2333.HK N 7 7 4 12,042 6.3 1.3 10.4 13.4 21.9 6.7 1.1 8.4 -6.4 17.9
Tata Motors TAMO.BO O 465 680 46 19,603 12.0 2.0 4.8 -12.1 19.2 13.3 1.7 4.0 -9.6 13.7
Toyota 7203.T N 6,287 6,500 3 170,248 8.5 1.1 8.1 7.8 13.8 11.1 1.1 6.4 -23.3 10.4
Honda 7267.T N 3,154 3,200 1 51,238 16.5 0.8 2.4 -32.4 5.0 10.6 0.8 3.9 56.2 7.7
Nissan 7201.T N 1,025 1,100 7 35,965 8.2 0.9 4.3 14.5 11.0 8.2 1.0 4.7 0.6 11.6
Ford F.N NC 12 N/A N/A 56,462 6.6 1.4 5.1 -6.1 25.0 7.2 1.1 4.7 -8.4 19.4
General Motors GM.N NC 34 N/A N/A 51,538 5.6 1.1 5.8 19.7 22.9 5.9 1.0 5.4 -4.5 18.5
Hyundai Motor 005380.KS O 134,500 168,000 25 25,224 6.7 0.6 6.1 -11.3 8.8 5.9 0.5 6.8 14.4 9.3
Kia Motor 000270.KS N 36,750 40,000 9 12,683 4.9 0.6 5.7 15.7 12.0 6.3 0.5 4.4 -22.7 8.6
Global Average 7.6 1.0 5.7 9.6 14.5 7.4 0.9 5.4 3.1 13.0
2017E2016E

24 November 2016
Kia Motors (000270.KS / 000270 KS) 12
Figure 31: Global auto OEMs—valuation comparison
(Units) Market 2011 2012 2013 2014 2015 2016E 2017E 2018E 2019E 2020E
Korea Domestic sales 491,712 480,844 457,787 464,563 526,638 526,638 515,000 510,000 505,000 505,000
Export sales 1,089,286 1,107,910 1,140,034 1,241,439 1,198,226 1,198,226 1,030,000 1,000,000 1,040,000 1,060,000
Sub total 1,580,998 1,588,754 1,597,821 1,706,002 1,724,864 1,724,864 1,545,000 1,510,000 1,545,000 1,565,000
Overseas China 432,518 480,566 546,766 646,036 616,096 630,000 670,000 710,000 750,000 800,000
Slovakia 252,200 292,000 313,000 323,500 338,000 335,000 335,000 335,000 340,000 340,000
US 272,304 358,199 369,505 365,510 371,012 370,000 365,000 365,000 370,000 370,000
Mexico 102,644 230,000 280,000 320,000 350,000
New plant (assuming India)
50,000 120,000 220,000
Sub total 957,022 1,130,765 1,229,271 1,335,046 1,325,108 1,437,644 1,600,000 1,740,000 1,900,000 2,080,000
Grand Total 2,538,020 2,719,519 2,827,092 3,041,048 3,049,972 2,982,644 3,110,000 3,285,000 3,465,000 3,670,000
YoY growth (%) 19% 7% 4% 8% 0.3% -2.2% 6% 6% 5% 6%
Source: Company data, Credit Suisse estimates

24 November 2016
Kia Motors (000270.KS / 000270 KS) 13
Companies Mentioned (Price as of 23-Nov-2016) BMW (BMWG.DE, €83.3) Daimler (DAIGn.DE, €65.52) Dongfeng Motor Group Company Limited (0489.HK, HK$7.84) Fiat Chrysler Automobile (FCHA.MI, €7.09) Ford Motor Company (F.N, $11.89) General Motors Company. (GM.N, $33.81) Great Wall Motor (2333.HK, HK$7.02) Honda Motor (7267.T, ¥3,154) Hyundai Mobis (012330.KS, W248,000) Hyundai Motor Company (005380.KS, W134,000, OUTPERFORM, TP W168,000) Hyundai Wia (011210.KS, W70,800) Kia Motors (000270.KS, W36,750, NEUTRAL, TP W40,000) Nissan Motor (7201.T, ¥1,025) PSA Peugeot Citroen (PEUP.PA, €14.28) Renault (RENA.PA, €74.99) Tata Motors Ltd. (TAMO.BO, Rs471.4) Toyota Motor (7203.T, ¥6,287) Volkswagen (VOWG_p.DE, €120.6)
Disclosure Appendix
Analyst Certification Michael Sohn and Jung Il Lee each certify, with respect to the companies or securities that the individual analyzes, that (1) the views expressed in this report accurately reflect his or her personal views about all of the subject companies and securities and (2) no part of his or her compensation was, is or will be directly or indirectly related to the specific recommendations or views expressed in this report.
3-Year Price and Rating History for Hyundai Motor Company (005380.KS)
005380.KS Closing Price Target Price
Date (W) (W) Rating
23-Jan-14 232,000 294,000 O
24-Jul-14 229,000 287,000
23-Oct-14 171,000 252,000
03-Mar-15 166,500 NR
21-Apr-15 171,000 170,000 N *
10-Jun-15 134,500 150,000
14-Jul-15 125,500 137,000
08-Sep-15 156,500 150,000
27-Jan-16 137,000 145,000
29-Feb-16 147,500 190,000 O
18-Jul-16 132,000 175,000
05-Oct-16 140,000 168,000
* Asterisk signifies initiation or assumption of coverage.
O U T PERFO RM
N O T RA T ED
N EU T RA L
3-Year Price and Rating History for Kia Motors (000270.KS)
000270.KS Closing Price Target Price
Date (W) (W) Rating
08-Jan-14 53,900 71,000 N
24-Jan-14 52,700 60,000
22-May-14 60,100 72,000 O
18-Sep-14 54,400 88,500
24-Oct-14 54,400 98,900
26-Jan-15 46,450 70,400
03-Mar-15 46,700 NR
21-Apr-15 47,900 42,000 U *
10-Jun-15 44,250 48,000 N
08-Sep-15 50,600 61,000 O
27-Jan-16 48,600 57,000
23-Mar-16 49,800 61,000
06-Jul-16 41,400 50,000
* Asterisk signifies initiation or assumption of coverage.
N EU T RA L
O U T PERFO RM
N O T RA T ED
U N D ERPERFO RM
The analyst(s) responsible for preparing this research report received Compensation that is based upon various factors including Credit Suisse's total revenues, a portion of which are generated by Credit Suisse's investment banking activities

24 November 2016
Kia Motors (000270.KS / 000270 KS) 14
As of December 10, 2012 Analysts’ stock rating are defined as follows: Outperform (O) : The stock’s total return is expected to outperform the relevant benchmark* over the next 12 months. Neutral (N) : The stock’s total return is expected to be in line with the relevant benchmark* over the next 12 months. Underperform (U) : The stock’s total return is expected to underperform the relevant benchmark* over the next 12 months. *Relevant benchmark by region: As of 10th December 2012, Japanese ratings are based on a stock’s total return relative to the analyst's coverage universe which consists of all companies covered by the analyst within the relevant sector, with Outperforms representing the most attractive, Neutrals the less attractive, and Underperforms the least attractive investment opportunities. As of 2nd October 2012, U.S. and Canadian as well as European ra tings are based on a stock’s total return relative to the analyst's coverage universe which consists of all companies covered by the analyst within the relevant sector , with Outperforms representing the most attractive, Neutrals the less attractive, and Underperforms the least attractive investment opportunities. For Latin American and non-Japan Asia stocks, ratings are based on a stock’s total return relative to the average total return of the relevant country or regional benchmark; prior to 2nd October 2012 U.S. and Canadian ratings were based on (1) a stock’s absolute total return potential to its current share price and (2) the relative attractiveness of a stock’s total return potential within an analyst’s coverage universe. For Australian and New Zealand stocks, the expected total return (ETR) calculation includes 12-month rolling dividend yield. An Outperform rating is assigned where an ETR is greater than or equal to 7.5%; Underperform where an ETR less than or equal to 5%. A Neutral may be assigned where the ETR is between -5% and 15%. The overlapping rating range allows analysts to assign a rating that puts ETR in the context of associated risks. Prior to 18 May 2015, ETR ranges for Outperform and Underperform ratings did not overlap with Neutral thresholds between 15% and 7.5%, wh ich was in operation from 7 July 2011. Restricted (R) : In certain circumstances, Credit Suisse policy and/or applicable law and regulations preclude certain types of communications, including an investment recommendation, during the course of Credit Suisse's engagement in an investment banking transaction and in certain other circumstances. Not Rated (NR) : Credit Suisse Equity Research does not have an investment rating or view on the stock or any other securities related to the company at this time. Not Covered (NC) : Credit Suisse Equity Research does not provide ongoing coverage of the company or offer an investment rating or investment view on the equity security of the company or related products.
Volatility Indicator [V] : A stock is defined as volatile if the stock price has moved up or down by 20% or more in a month in at least 8 of the past 24 months or the analyst expects significant volatility going forward.
Analysts’ sector weightings are distinct from analysts’ stock ratings and are based on the analyst’s expectations for the fundamentals and/or valuation of the sector* relative to the group’s historic fundamentals and/or valuation: Overweight : The analyst’s expectation for the sector’s fundamentals and/or valuation is favorable over the next 12 months. Market Weight : The analyst’s expectation for the sector’s fundamentals and/or valuation is neutral over the next 12 months. Underweight : The analyst’s expectation for the sector’s fundamentals and/or valuation is cautious over the next 12 months. *An analyst’s coverage sector consists of all companies covered by the analyst within the relevant sector. An analyst may cover m ultiple sectors.
Credit Suisse's distribution of stock ratings (and banking clients) is:
Global Ratings Distribution
Rating Versus universe (%) Of which banking clients (%) Outperform/Buy* 44% (63% banking clients) Neutral/Hold* 38% (60% banking clients) Underperform/Sell* 15% (55% banking clients) Restricted 3% *For purposes of the NYSE and NASD ratings distribution disclosure requirements, our stock ratings of Outperform, Neutral, and Underperform most closely correspond to Buy, Hold, and Sell, respectively; however, the meanings are not the same, as our stock ratings are determined on a relative basis. (Please refer to definitions above.) An investor's decision to buy or sell a security should be based on investment objectives, current holdings, an d other individual factors.
Important Global Disclosures Credit Suisse’s research reports are made available to clients through our proprietary research portal on CS PLUS. Credit Suisse research products may also be made available through third-party vendors or alternate electronic means as a convenience. Certain research products are only made available through CS PLUS. The services provided by Credit Suisse’s analysts to clients may depend on a specific client’s preferences regarding the frequency and manner of receiving communications, the client’s risk profile and investment, the size and scope of the overall client relationship with the Firm, as well as legal and regulatory constraints. To access all of Credit Suisse’s research that you are entitled to receive in the most timely manner, please contact your sales representative or go to https://plus.credit-suisse.com . Credit Suisse’s policy is to update research reports as it deems appropriate, based on developments with the subject company, the sector or the market that may have a material impact on the research views or opinions stated herein. Credit Suisse's policy is only to publish investment research that is impartial, independent, clear, fair and not misleading. For more detail please refer to Credit Suisse's Policies for Managing Conflicts of Interest in connection with Investment Research: http://www.csfb.com/research-and-analytics/disclaimer/managing_conflicts_disclaimer.html . Credit Suisse's policy is only to publish investment research that is impartial, independent, clear, fair and not misleading. For more detail please refer to Credit Suisse's Policies for Managing Conflicts of Interest in connection with Investment Research:
Target Price and Rating Valuation Methodology and Risks: (12 months) for Hyundai Motor Company (005380.KS)
Method: Our W168,000 target price on Hyundai Motor is based on 7.4x FY17E EPS. Our OUTPERFORM rating is on the back of: (1) HMC's favourable change in strategy towards more SUVs in 2016E, (2) US inventory and incentive stabilisition with EM forex/demand recovery, and (3) YoY OP turnaround expected in 4Q16E and 2017E (after a modest +1% YoY turnaround in 2Q16) as the labour strike issue was cleared out in 3Q16.
24 November 2016
Kia Motors (000270.KS / 000270 KS) 15
Risk: Risks to Hyundai Motor achieving our W168,000 target price and OUTPERFORM rating include the following: (1) KRW appreciation, (2) labour strikes, (3) quality defects, (4) rising M/S of imported vehicles, and (5) rising customer incentives.
Target Price and Rating Valuation Methodology and Risks: (12 months) for Kia Motors (000270.KS)
Method: Our target price of W40,000 for Kia Motors was derived by applying target P/E (price-to-earnings) multiple of 6.9x to FY17E EPS (earnings per share), which was derived by applying a logical valuation discount to Kia's intrinsic P/E post purchasing KEPCO's HQ land. Our NEUTRAL rating is based on (1) Kia's peaking SUV sales mix with aging impact from 2H16 (and entrance into a small sedan cycle in 2017E while the sedan market has been shrinking globally) and (2) continued uncertainty regarding 'ordinary wage' disputes which could potentially decrease 2017E pre-tax profit by 18%.
Risk: Key risks to our W40,000 target price and NEUTRAL rating for Kia Motors include: (1) ordinary wage issues, (2) potential revision of Korea-US FTA and NAFTA post US election, (3) KRW appreciation, and (4) quality defects.
Please refer to the firm's disclosure website at https://rave.credit-suisse.com/disclosures for the definitions of abbreviations typically used in the target price method and risk sections.
See the Companies Mentioned section for full company names The subject company (000270.KS, 005380.KS) currently is, or was during the 12-month period preceding the date of distribution of this report, a client of Credit Suisse. Credit Suisse provided investment banking services to the subject company (000270.KS, 005380.KS) within the past 12 months. Credit Suisse has received investment banking related compensation from the subject company (000270.KS, 005380.KS) within the past 12 months Credit Suisse expects to receive or intends to seek investment banking related compensation from the subject company (000270.KS, 005380.KS) within the next 3 months. Please visit https://credit-suisse.com/in/researchdisclosure for additional disclosures mandated vide Securities And Exchange Board of India (Research Analysts) Regulations, 2014 Credit Suisse may have interest in (TAMO.BO) Credit Suisse beneficially holds >0.5% long position of the total issued share capital of the subject company (000270.KS, 005380.KS).
For date and time of production, dissemination and history of recommendation for the subject company(ies) featured in this report, disseminated within the past 12 months, please refer to the link: https://rave.credit-suisse.com/disclosures/view/report?i=272255&v=-5ptg4pod05t0380a8yra1snm1 .
Important Regional Disclosures Singapore recipients should contact Credit Suisse AG, Singapore Branch for any matters arising from this research report. The analyst(s) involved in the preparation of this report may participate in events hosted by the subject company, including site visits. Credit Suisse does not accept or permit analysts to accept payment or reimbursement for travel expenses associated with these events. Restrictions on certain Canadian securities are indicated by the following abbreviations: NVS--Non-Voting shares; RVS--Restricted Voting Shares; SVS--Subordinate Voting Shares. Individuals receiving this report from a Canadian investment dealer that is not affiliated with Credit Suisse should be advised that this report may not contain regulatory disclosures the non-affiliated Canadian investment dealer would be required to make if this were its own report. For Credit Suisse Securities (Canada), Inc.'s policies and procedures regarding the dissemination of equity research, please visit https://www.credit-suisse.com/sites/disclaimers-ib/en/canada-research-policy.html. Credit Suisse has acted as lead manager or syndicate member in a public offering of securities for the subject company (005380.KS) within the past 3 years. Principal is not guaranteed in the case of equities because equity prices are variable. Commission is the commission rate or the amount agreed with a customer when setting up an account or at any time after that. This research report is authored by: Credit Suisse Securities (Europe) Limited, Seoul Branch ............................................................................................Michael Sohn ; Jung Il Lee To the extent this is a report authored in whole or in part by a non-U.S. analyst and is made available in the U.S., the following are important disclosures regarding any non-U.S. analyst contributors: The non-U.S. research analysts listed below (if any) are not registered/qualified as research analysts with FINRA. The non-U.S. research analysts listed below may not be associated persons of CSSU and therefore may not be subject to the NASD Rule 2711 and NYSE Rule 472 restrictions on communications with a subject company, public appearances and trading securities held by a research analyst account. Credit Suisse Securities (Europe) Limited, Seoul Branch ............................................................................................Michael Sohn ; Jung Il Lee
For Credit Suisse disclosure information on other companies mentioned in this report, please visit the website at https://rave.credit-suisse.com/disclosures or call +1 (877) 291-2683.
24 November 2016
Kia Motors (000270.KS / 000270 KS) 16
This report is produced by subsidiaries and affiliates of Credit Suisse operating under its Global Markets Division. For more information on our structure, please use the following link: https://www.credit-suisse.com/who-we-are This report may contain material that is not directed to, or intended for distribution to or use by, any person or entity who is a citizen or resident of or located in any locality, state, country or other jurisdiction where such distribution, publication, availability or use would be contrary to law or regulation or which would subject Credit Suisse or its affiliates ("CS") to any registration or licensing requirement within such jurisdiction. All material presented in this report, unless specifically indicated otherwise, is under copyright to CS. None of the material, nor its content, nor any copy of it, may be altered in any way, transmitted to, copied or distributed to any other party, without the prior express written permission of CS. All trademarks, service marks and logos used in this report are trademarks or service marks or registered trademarks or service marks of CS or its affiliates.The information, tools and material presented in this report are provided to you for information purposes only and are not to be used or considered as an offer or the solicitation of an offer to sell or to buy or subscribe for securities or other financial instruments. CS may not have taken any steps to ensure that the securities referred to in this report are suitable for any particular investor. CS will not treat recipients of this report as its customers by virtue of their receiving this report. The investments and services contained or referred to in this report may not be suitable for you and it is recommended that you consult an independent investment advisor if you are in doubt about such investments or investment services. Nothing in this report constitutes investment, legal, accounting or tax advice, or a representation that any investment or strategy is suitable or appropriate to your individual circumstances, or otherwise constitutes a personal recommendation to you. CS does not advise on the tax consequences of investments and you are advised to contact an independent tax adviser. Please note in particular that the bases and levels of taxation may change. Information and opinions presented in this report have been obtained or derived from sources believed by CS to be reliable, but CS makes no representation as to their accuracy or completeness. CS accepts no liability for loss arising from the use of the material presented in this report, except that this exclusion of liability does not apply to the extent that such liability arises under specific statutes or regulations applicable to CS. This report is not to be relied upon in substitution for the exercise of independent judgment. CS may have issued, and may in the future issue, other communications that are inconsistent with, and reach different conclusions from, the information presented in this report. Those communications reflect the different assumptions, views and analytical methods of the analysts who prepared them and CS is under no obligation to ensure that such other communications are brought to the attention of any recipient of this report. Some investments referred to in this report will be offered solely by a single entity and in the case of some investments solely by CS, or an associate of CS or CS may be the only market maker in such investments. Past performance should not be taken as an indication or guarantee of future performance, and no representation or warranty, express or implied, is made regarding future performance. Information, opinions and estimates contained in this report reflect a judgment at its original date of publication by CS and are subject to change without notice. The price, value of and income from any of the securities or financial instruments mentioned in this report can fall as well as rise. The value of securities and financial instruments is subject to exchange rate fluctuation that may have a positive or adverse effect on the price or income of such securities or financial instruments. Investors in securities such as ADR's, the values of which are influenced by currency volatility, effectively assume this risk. Structured securities are complex instruments, typically involve a high degree of risk and are intended for sale only to sophisticated investors who are capable of understanding and assuming the risks involved. The market value of any structured security may be affected by changes in economic, financial and political factors (including, but not limited to, spot and forward interest and exchange rates), time to maturity, market conditions and volatility, and the credit quality of any issuer or reference issuer. Any investor interested in purchasing a structured product should conduct their own investigation and analysis of the product and consult with their own professional advisers as to the risks involved in making such a purchase. Some investments discussed in this report may have a high level of volatility. High volatility investments may experience sudden and large falls in their value causing losses when that investment is realised. Those losses may equal your original investment. Indeed, in the case of some investments the potential losses may exceed the amount of initial investment and, in such circumstances, you may be required to pay more money to support those losses. Income yields from investments may fluctuate and, in consequence, initial capital paid to make the investment may be used as part of that income yield. Some investments may not be readily realisable and it may be difficult to sell or realise those investments, similarly it may prove difficult for you to obtain reliable information about the value, or risks, to which such an investment is exposed. This report may provide the addresses of, or contain hyperlinks to, websites. Except to the extent to which the report refers to website material of CS, CS has not reviewed any such site and takes no responsibility for the content contained therein. Such address or hyperlink (including addresses or hyperlinks to CS's own website material) is provided solely for your convenience and information and the content of any such website does not in any way form part of this document. Accessing such website or following such link through this report or CS's website shall be at your own risk.
This report is issued and distributed in European Union (except Switzerland): by Credit Suisse Securities (Europe) Limited, One Cabot Square, London E14 4QJ, England, which is authorised by the Prudential Regulation Authority and regulated by the Financial Conduct Authority and the Prudential Regulation Authority. Germany: Credit Suisse Securities (Europe) Limited Niederlassung Frankfurt am Main regulated by the Bundesanstalt fuer Finanzdienstleistungsaufsicht ("BaFin"). United States and Canada: Credit Suisse Securities (USA) LLC; Switzerland: Credit Suisse AG; Brazil: Banco de Investimentos Credit Suisse (Brasil) S.A or its affiliates; Mexico: Banco Credit Suisse (México), S.A. (transactions related to the securities mentioned in this report will only be effected in compliance with applicable regulation); Japan: by Credit Suisse Securities (Japan) Limited, Financial Instruments Firm, Director-General of Kanto Local Finance Bureau ( Kinsho) No. 66, a member of Japan Securities Dealers Association, The Financial Futures Association of Japan, Japan Investment Advisers Association, Type II Financial Instruments Firms Association; Hong Kong: Credit Suisse (Hong Kong) Limited; Australia: Credit Suisse Equities (Australia) Limited; Thailand: Credit Suisse Securities (Thailand) Limited, regulated by the Office of the Securities and Exchange Commission, Thailand, having registered address at 990 Abdulrahim Place, 27th Floor, Unit 2701, Rama IV Road, Silom, Bangrak, Bangkok10500, Thailand, Tel. +66 2614 6000; Malaysia: Credit Suisse Securities (Malaysia) Sdn Bhd, Credit Suisse AG, Singapore Branch; India: Credit Suisse Securities (India) Private Limited (CIN no.U67120MH1996PTC104392) regulated by the Securities and Exchange Board of India as Research Analyst (registration no. INH 000001030) and as Stock Broker (registration no. INB230970637; INF230970637; INB010970631; INF010970631), having registered address at 9th Floor, Ceejay House, Dr.A.B. Road, Worli, Mumbai - 18, India, T- +91-22 6777 3777; South Korea: Credit Suisse Securities (Europe) Limited, Seoul Branch; Taiwan: Credit Suisse AG Taipei Securities Branch; Indonesia: PT Credit Suisse Securities Indonesia; Philippines: Credit Suisse Securities (Philippines ) Inc., and elsewhere in the world by the relevant authorised affiliate of the above. Additional Regional Disclaimers Hong Kong: Credit Suisse (Hong Kong) Limited ("CSHK") is licensed and regulated by the Securities and Futures Commission of Hong Kong under the laws of Hong Kong, which differ from Australian laws. CSHKL does not hold an Australian financial services licence (AFSL) and is exempt from the requirement to hold an AFSL under the Corporations Act 2001 (the Act) under Class Order 03/1103 published by the ASIC in respect of financial services provided to Australian wholesale clients (within the meaning of section 761G of the Act). Research on Taiwanese securities produced by Credit Suisse AG, Taipei Securities Branch has been prepared by a registered Senior Business Person. Malaysia: Research provided to residents of Malaysia is authorised by the Head of Research for Credit Suisse Securities (Malaysia) Sdn Bhd, to whom they should direct any queries on +603 2723 2020. Singapore: This report has been prepared and issued for distribution in Singapore to institutional investors, accredited investors and expert investors (each as defined under the Financial Advisers Regulations) only, and is also distributed by Credit Suisse AG, Singapore branch to overseas investors (as defined under the Financial Advisers Regulations). By virtue of your status as an institutional investor, accredited investor, expert investor or overseas investor, Credit Suisse AG, Singapore branch is exempted from complying with certain compliance requirements under the Financial Advisers Act, Chapter 110 of Singapore (the "FAA"), the Financial Advisers Regulations and the relevant Notices and Guidelines issued thereunder, in respect of any financial advisory service which Credit Suisse AG, Singapore branch may provide to you. UAE: This information is being distributed by Credit Suisse AG (DIFC Branch), duly licensed and regulated by the Dubai Financial Services Authority (“DFSA”). Related financial services or products are only made available to Professional Clients or Market Counterparties, as defined by the DFSA, and are not intended for any other persons. Credit Suisse AG (DIFC Branch) is located on Level 9 East, The Gate Building, DIFC, Dubai, United Arab Emirates. EU: This report has been produced by subsidiaries and affiliates of Credit Suisse operating under its Global Markets Division This research may not conform to Canadian disclosure requirements. In jurisdictions where CS is not already registered or licensed to trade in securities, transactions will only be effected in accordance with applicable securities legislation, which will vary from jurisdiction to jurisdiction and may require that the trade be made in accordance with applicable exemptions from registration or licensing requirements. Non-US customers wishing to effect a transaction should contact a CS entity in their local jurisdiction unless governing law permits otherwise. US customers wishing to effect a transaction should do so only by contacting a representative at Credit Suisse Securities (USA) LLC in the US. Please note that this research was originally prepared and issued by CS for distribution to their market professional and institutional investor customers. Recipients who are not market professional or institutional investor customers of CS should seek the advice of their independent financial advisor prior to taking any investment decision based on this report or for any necessary explanation of its contents. This research may relate to investments or services of a person outside of the UK or to other matters which are not authorised by the Prudential Regulation Authority and regulated by the Financial Conduct Authority and the Prudential Regulation Authority or in respect of which the protections of the Prudential Regulation Authority and Financial Conduct Authority for private customers and/or the UK compensation scheme may not be available, and further details as to where this may be the case are available upon request in respect of this report. CS may provide various services to US municipal entities or obligated persons ("municipalities"), including suggesting individual transactions or trades and entering into such transactions. Any services CS provides to municipalities are not viewed as "advice" within the meaning of Section 975 of the Dodd-Frank Wall Street Reform and Consumer Protection Act. CS is providing any such services and related information solely on an arm's length basis and not as an advisor or fiduciary to the municipality. In connection with the provision of the any such services, there is no agreement, direct or indirect, between any municipality (including the officials,management, employees or agents thereof) and CS for CS to provide advice to the municipality. Municipalities should consult with their financial, accounting and legal advisors regarding any such services provided by CS. In addition, CS is not acting for direct or indirect compensation to solicit the municipality on behalf of an unaffiliated broker, dealer, municipal securities dealer, municipal advisor, or investment adviser for the purpose of obtaining or retaining an engagement by the municipality for or in connection with Municipal Financial Products, the issuance of municipal securities, or of an investment adviser to provide investment advisory services to or on behalf of the municipality. If this report is being distributed by a financial institution other than Credit Suisse AG, or its affiliates, that financial institution is solely responsible for distribution. Clients of that institution should contact that institution to effect a transaction in the securities mentioned in this report or require further information. This report does not constitute investment advice by Credit Suisse to the clients of the distributing financial institution, and neither Credit Suisse AG, its affiliates, and their respective officers, directors and employees accept any liability whatsoever for any direct or consequential loss arising from their use of this report or its content. Principal is not guaranteed. Commission is the commission rate or the amount agreed with a customer when setting up an account or at any time after that. Copyright © 2016 CREDIT SUISSE AG and/or its affiliates. All rights reserved.
Investment principal on bonds can be eroded depending on sale price or market price. In addition, there are bonds on which investment principal can be eroded due to changes in redemption amounts. Care is required when investing in such instruments. When you purchase non-listed Japanese fixed income securities (Japanese government bonds, Japanese municipal bonds, Japanese government guaranteed bonds, Japanese corporate bonds) from CS as a seller, you will be requested to pay the purchase price only.
Related Documents