doi: 10.1152/jn.00524.2006 96:3209-3219, 2006. First published 23 August 2006; J Neurophysiol Shih-Chieh Lin, Damien Gervasoni and Miguel A. L. Nicolelis Forebrain Noncholinergic Neuronal Ensembles Fast Modulation of Prefrontal Cortex Activity by Basal You might find this additional info useful... 48 articles, 14 of which you can access for free at: This article cites http://jn.physiology.org/content/96/6/3209.full#ref-list-1 10 other HighWire-hosted articles: This article has been cited by http://jn.physiology.org/content/96/6/3209#cited-by including high resolution figures, can be found at: Updated information and services http://jn.physiology.org/content/96/6/3209.full can be found at: Journal of Neurophysiology about Additional material and information http://www.the-aps.org/publications/jn This information is current as of June 9, 2013. at http://www.the-aps.org/. Copyright © 2006 by the American Physiological Society. ISSN: 0022-3077, ESSN: 1522-1598. Visit our website times a year (monthly) by the American Physiological Society, 9650 Rockville Pike, Bethesda MD 20814-3991. publishes original articles on the function of the nervous system. It is published 12 Journal of Neurophysiology by guest on June 9, 2013 http://jn.physiology.org/ Downloaded from

Welcome message from author
This document is posted to help you gain knowledge. Please leave a comment to let me know what you think about it! Share it to your friends and learn new things together.
Transcript
doi: 10.1152/jn.00524.200696:3209-3219, 2006. First published 23 August 2006;J Neurophysiol
Shih-Chieh Lin, Damien Gervasoni and Miguel A. L. NicolelisForebrain Noncholinergic Neuronal EnsemblesFast Modulation of Prefrontal Cortex Activity by Basal
You might find this additional info useful...
48 articles, 14 of which you can access for free at: This article citeshttp://jn.physiology.org/content/96/6/3209.full#ref-list-1
10 other HighWire-hosted articles: This article has been cited by http://jn.physiology.org/content/96/6/3209#cited-by
including high resolution figures, can be found at: Updated information and serviceshttp://jn.physiology.org/content/96/6/3209.full
can be found at: Journal of Neurophysiology about Additional material and informationhttp://www.the-aps.org/publications/jn
This information is current as of June 9, 2013.
at http://www.the-aps.org/. Copyright © 2006 by the American Physiological Society. ISSN: 0022-3077, ESSN: 1522-1598. Visit our websitetimes a year (monthly) by the American Physiological Society, 9650 Rockville Pike, Bethesda MD 20814-3991.
publishes original articles on the function of the nervous system. It is published 12Journal of Neurophysiology
by guest on June 9, 2013http://jn.physiology.org/
Dow
nloaded from

Fast Modulation of Prefrontal Cortex Activity by Basal ForebrainNoncholinergic Neuronal Ensembles
Shih-Chieh Lin,1,2 Damien Gervasoni,1,5 and Miguel A. L. Nicolelis1,2,3,4
1Department of Neurobiology, Duke University Medical Center; 2Center for Neuroengineering, 3Department of Biomedical Engineering,and 4Department of Psychological and Brain Sciences, Duke University, Durham, North Carolina; and 5Centre National de la RechercheScientifique, Universite Claude Bernard, Lyon, France
Submitted 16 May 2006; accepted in final form 19 August 2006
Lin, Shih-Chieh, Damien Gervasoni, and Miguel A. L. Nicolelis.Fast modulation of prefrontal cortex activity by basal forebrainnoncholinergic neuronal ensembles. J Neurophysiol 96: 3209–3219,2006. First published August 23, 2006; doi:10.1152/jn.00524.2006.Traditionally, most basal forebrain (BF) functions have been attrib-uted to its cholinergic neurons. However, the majority of cortical-projecting BF neurons are noncholinergic and their in vivo functionsremain unclear. We investigated how BF modulates cortical dynamicsby simultaneously recording �50 BF single neurons along with localfield potentials (LFPs) from the prefrontal cortex (PFCx) in differentwake–sleep states of adult rats. Using stereotypical spike time corre-lations, we identified a large (roughly 70%) subset of BF neurons,which we named BF tonic neurons (BFTNs). BFTNs fired tonically at2–8 Hz without significantly changing their average firing rate acrosswake–sleep states. As such, these cannot be classified as cholinergicneurons. BFTNs substantially increased the spiking variability duringwaking and rapid-eye-movement sleep, by exhibiting frequent spikebursts with �50-ms interspike interval. Spike bursts among BFTNswere highly correlated, leading to transient population synchroniza-tion events of BFTN ensembles that lasted on average 160 ms. Mostimportantly, BFTN synchronization occurred preferentially just be-fore the troughs of PFCx LFP oscillations, which reflect increasedcortical activity. Furthermore, BFTN synchronization was accompa-nied by transient increases in prefrontal cortex gamma oscillations.These results suggest that synchronization of BFTN ensembles, whichare likely to be formed by cortical-projecting GABAergic neuronsfrom the BF, could be primarily responsible for fast cortical modula-tions to provide transient amplification of cortical activity.
I N T R O D U C T I O N
The mammalian basal forebrain (BF) critically modulatescortical activity (Buzsaki et al. 1988; Riekkinen et al. 1991)during different wake–sleep states (Jones 2003; Zaborszky andDuque 2003). The BF also plays important roles in corticalplasticity (Dykes 1997; Kilgard and Merzenich 1998; Wein-berger 2003), learning and memory (Everitt and Robbins 1997;Weinberger 2003), and attention (Chiba et al. 1995; Everitt andRobbins 1997). Although most BF functions have been attrib-uted to its cholinergic cortical-projecting neurons (Everitt andRobbins 1997; Wenk 1997), cholinergic neurons constituteonly up to a third of the cortical projections from the BF (Grittiet al. 1997). Noncholinergic BF cortical projections, derivedmainly from GABAergic neurons, along with a smaller subsetof possibly glutaminergic neurons, have been described in rats,cats, and rhesus monkeys (Freund and Gulyas 1991; Freund
and Meskenaite 1992; Gritti et al. 1997; Rye et al. 1984;Walker et al. 1989). As such, BF afferents represent one of thelargest cortical-projecting neuromodulatory systems in mam-mals (Semba 2000; Zaborszky and Duque 2003). Despite theirpotential physiological relevance, the lack of manipulationsspecifically targeting such noncholinergic BF cortical projec-tions has prevented a full assessment of their in vivo functions.
Several lines of evidence have suggested that noncholinergicBF cortical projections play important roles in modulatingcortical networks (Dykes 1997; Sarter and Bruno 2002). First,excitotoxic lesions of the BF, which preferentially targetednoncholinergic BF neurons (Page et al. 1991), prominentlyincreased cortical slow oscillations (Buzsaki et al. 1988; Riek-kinen et al. 1991). However, selective BF cholinergic lesionsusing immunotoxins only mildly altered cortical oscillationpatterns (Berntson et al. 2002; Wenk et al. 1994). Second, theextent of cholinergic neuron loss after excitotoxic lesions of theBF did not correlate with the severity of learning and memoryimpairments (Dunnett et al. 1991; Markowska et al. 1990). Infact, learning impairment can be quite severe even with the BFcholinergic system relatively intact. Third, the onset of corticalactivation after electrical stimulation of the BF is so rapid (�50ms) (Jimenez-Capdeville et al. 1997; McLin et al. 2002) that itcannot be fully accounted for by the slow-excitatory cholin-ergic actions through muscarinic receptors (McCormick andPrince 1986), implicating a role for fast-acting noncholinergicprojections during the initial excitation (Dykes 1997). Finally,GABAergic BF cortical projections preferentially synapse onintracortical GABAergic interneurons, an ideal target to en-hance cortical activity through disinhibition (Freund and Gul-yas 1991; Freund and Meskenaite 1992).
Based on these observations, we hypothesized that noncho-linergic neurons could be responsible for fast cortical modula-tion. To test this hypothesis and to better understand the in vivofunctions of noncholinergic BF neurons, we simultaneouslyrecorded neuronal ensemble activity from the BF and theprefrontal cortex (PFCx) during the natural wake–sleep cycleof adult rats, using chronically implanted multielectrode arrays(Nicolelis et al. 1997). PFCx was chosen because of its roles inhigher cognitive functions and its large reciprocal connectionswith the BF (Zaborszky and Duque 2003; Zaborszky et al.1997). This experimental approach allowed access to a largesample of BF neurons per animal, especially the more abun-dant noncholinergic cells with large cell body size (Gritti et al.
Address for reprint requests and other correspondence: S.-C. Lin, Dept. ofNeurobiology, Duke University Medical Center, 101 Research Drive, Box3209, Durham, NC 27710 (E-mail: [email protected]).
The costs of publication of this article were defrayed in part by the paymentof page charges. The article must therefore be hereby marked “advertisement”in accordance with 18 U.S.C. Section 1734 solely to indicate this fact.
J Neurophysiol 96: 3209–3219, 2006.First published August 23, 2006; doi:10.1152/jn.00524.2006.
32090022-3077/06 $8.00 Copyright © 2006 The American Physiological Societywww.jn.org
by guest on June 9, 2013http://jn.physiology.org/
Dow
nloaded from

1997). It also allowed us to investigate the relationship be-tween BF and PFCx activity during different wake–sleepstates.
M E T H O D S
Surgery
All procedures were approved by the Duke IACUC and performedin accordance with National Institutes of Health guidelines. Thesurgical procedure has already been described in detail (Nicolelis et al.1997). Six adult female rats, 250–300 g, housed under a 6 AM to 6 PM
lights-on/lights-off cycle, were implanted with custom-built 32-wireS-isonel–coated tungsten microwire electrode arrays (35- or 50-�mdiameter wires with 1–2 M� impedance measured at 1 kHz, arrangedin a 4 � 8 grid with 250-�m spacing between wires) in the BF (n �6) and PFCx (n � 4) under ketamine (50–90 mg/kg) and xylazine(5–10 mg/kg) anesthesia. One rat was implanted with a custom-builtmovable array in the BF where the electrode tips could be advancedby a microdrive. The following coordinates (in millimeters) relative toBregma were used to center the arrays: BF (�0.5 anteroposterior[AP], �2 mediolateral [ML], �7.5 dorsoventral [DV]); PFCx (�3.5AP, �2.5 ML, �4.5 DV). Electrode tip locations were verified withcresyl violet staining of histological sections after the end of theexperiment and compared with reference anatomical planes (Paxinosand Watson 2005). All electrode arrays were found at expectedpositions.
Recording
Rats were allowed 7–10 days to recover from the surgery and werethen habituated to the recording chamber for 6 h (10 AM to 4 PM) for2–3 consecutive days before the recording session, with unrestrictedaccess to water and food pellets. This extended habituation reducedthe novelty of the recording chamber and ensured normal sleeppatterns during the recording session. Rats were recorded for anaverage of 4.97 � 0.17 h (n � 10) per session. Five sessions wererecorded for the rat with a movable array in the BF. Electrodes wereadvanced 250 �m per session (�7.25 to �8.25 mm DV for the fivesessions) and rats were allowed 1 wk of rest between sessions. Forother rats implanted with a fixed array in the BF, one recordingsession per rat (n � 5) was used in the final analysis.
Single-unit activity and LFPs were referenced to a common skullscrew and recorded using a multichannel acquisition processor (MAP,Plexon, Dallas, TX) (Nicolelis et al. 1997). Single-unit activities with�3:1 signal-to-noise ratio were sorted on-line and later confirmedwith an off-line sorting algorithm (Plexon) as previously described(Nicolelis et al. 2003). Only single units with clear separation from thenoise cluster and with minimal spike collisions (spikes with �1.5-msinterspike interval) were used for further analyses. If any single unitwas recorded over multiple electrodes, as demonstrated by a spuriouszero-lag peak in the pairwise correlation function, the duplicate unitwas discarded from further analyses. Single units entering the finalanalyses all contained adequate sampling (�10 min) of the threemajor states.
LFP signals, recorded from the same electrodes, were filtered(0.3–400 Hz) and digitized (500 Hz). This digitization rate allowedfor reliable estimation of spectral power �100 Hz without concerns ofsignal aliasing. Behaviors were recorded by way of two CCD video-cameras and a VCR. Video and neural recordings were synchronizedwith a millisecond-precision timer (model VTG-55, For-A, Tokyo,Japan).
Data analyses
The three major wake–sleep states—waking (WK), slow-wavesleep (SWS), and rapid-eye-movement sleep (REM)—were deter-
mined using the state-space method we previously developed (Ger-vasoni et al. 2004). Briefly, two spectral amplitude ratios (0.5–20/0.5–55 and 0.5–4.5/0.5–9 Hz) were calculated for each 1-s segment ofLFP data. The resulting time series were then smoothed with a 20-binHanning window to reduce within-state variability. The two spectralfeatures spanned a two-dimensional state space (y-axis and x-axis,respectively), where each dot corresponded to 1 s of LFP signal.Because the prevalence of the whisker-twitching state was �0.5% inthese recordings [compared with the median prevalence of 1.3%reported in Gervasoni et al. (2004)], we opted to analyze only thethree well-separated clusters in the state space, which corresponded toWK, SWS, and REM states. Points within cluster boundaries werelabeled as the three main states. Short trajectories (�20 s) leaving andreentering a given cluster boundary without touching the boundariesof other clusters were also assigned to that state. Other points outsidecluster boundaries were labeled separately as state-transition epochs.This ensured that the three coded wake–sleep states included onlyphysiologically homogeneous epochs at the core of the clusters. Thestate coding was validated by video analysis of behaviors.
The firing rate of BF single units at each state was calculated bydividing the total number of spikes in a given state by the totalduration of that state. The coefficient of variation of interspike interval(CVISI) distribution at each state was calculated by dividing the SD ofISIs by the mean of ISIs, considering only ISIs taken from a givenstate for each single unit.
Single-factor repeated-measure ANOVA (� � 0.05) was used toinvestigate the general main effect of state dependency. When therewas a main effect, we performed post hoc comparisons using a pairedt-test (� � 0.05).
Pairwise correlation of spike trains was calculated for all simulta-neously recorded BF single-unit pairs (n � 4,844). State-dependentcorrelation was also calculated using spikes in the three wake–sleepstates. Correlation functions were binned at 1 ms and calculated forlag intervals of [�3, 3] seconds. Each correlation function wasnormalized by the mean of its values at [�3, �1]- and [1, 3]-sintervals, which represented the baseline level of correlation expectedby the respective firing rate of the two single units. To ensure that eachcorrelation function contained sufficient observations to make statis-tical inference, pairs with mean values at [�3, �1]- and [1, 3]-sintervals less than a cutoff value 2.4 count per bin at any state wereexcluded. This cutoff value roughly corresponded to two neuronssimultaneously firing at 2 Hz for 10 min. A cross-correlation functionwas considered statistically significant when more than 10 bins withinthe [�0.3, 0.3]-s interval laid outside the [minimum, maximum]bound of its values at [�3, �1]- and [1, 3]-s intervals (P � 0.000025).This formulation of statistical significance tested whether the twoneurons were more tightly correlated around time 0 than what wouldbe expected by the rate covariation at the timescale of a few seconds.This ignored gross state-dependent firing rate modulations that tookplace over longer timescales. Furthermore, the upper and lowerbounds of the confidence interval were determined empirically fromthe correlation function at [�3, �1]- and [1, 3]-s intervals, whichprovided an accurate estimation of chance correlation expected by thefiring rates of the two neurons, while preserving the fine temporalstructure of the two spike trains in the estimation of chance correla-tion. This empirical construction of confidence interval also resolvedthe task of analytically estimating chance correlation when calculatingstate-dependent correlations, where each state was constituted bymany temporally disjoint intervals. Changing the stringency of thestatistical test mattered little to our results.
Principal component analysis (PCA) was used to determine thedominant correlation patterns among all 4,844 pairs in the [�0.3,0.3]-s interval. All bins except the three bins around zero time lag([�1, 0, 1] ms) were submitted to PCA, for a total of 598 bins. Thethree middle bins were excluded from this analysis because correla-tion at these bins could not be reliably estimated for single unitsrecorded from the same electrode. The first principal component
3210 S.-C. LIN, D. GERVASONI, AND M.A.L. NICOLELIS
J Neurophysiol • VOL 96 • DECEMBER 2006 • www.jn.org
by guest on June 9, 2013http://jn.physiology.org/
Dow
nloaded from
(PC1) explained 38–51% of variance among 598 PCs. The correlationscore was then defined for each pairwise correlation function by firstsubtracting the baseline value (�1) from the correlation function andthen taking the inner product with the PC1. This allowed us to focuson the particular kind of correlation functions with a shape similar tothat of the PC1.
For hierarchical cluster analysis of similarities between BF neurons,we constructed a distance matrix for all BF neurons recorded simul-taneously based on their respective correlation score (CS). The dis-tance measure (d) was defined as d � 1/(CS* � BIAS), whereBIAS � 0.5 and CS* � CS if CS � 0 or CS* � 0 if CS � 0.
Intuitively, this ensured that a high CS would lead to a smalldistance, whereas a small CS would lead to a large distance. TheBIAS term was introduced to set an upper bound for the distancemeasure such that it would not go to infinity with a small CS. NegativeCS was replaced with zero to avoid negative distance. A hierarchicalcluster tree was computed on this distance matrix using the un-weighted average distance method (Statistics toolbox, MATLAB).The hierarchical cluster tree, the dendrogram, was then rearranged bythe ascending order of the minimum average distance in each subtree.This neuronal rank was then applied back to the matrix of correlationscores (Fig. 4B) such that neurons were ordered by their averagecorrelation score and their similarities with each other. Guided by thedendrogram, BF tonic neurons (BFTNs) were defined for each corre-lation score matrix as the core set of neurons that were highlycorrelated with each other. Specifically, for a BF neuron to be labeledas a BFTN, more than half of its correlations with other BFTNs shouldhave a correlation score �1.
Spike bursts within each spike train were identified as all the spikeswith the preceding or following ISI in the [0, 50]-ms range. Spikebursts accounted for 13.6 � 0.5% (n � 223) of BFTN spikes. Thechoice of ISI upper bound up to 100 ms mattered little to our finalresults.
To compare similarities between correlation score matrices forcorrelation using all spikes and correlation using only spike bursts, wetransformed each matrix into a linear vector and computed the cosineof the angle between the two vectors, a measure bounded by [�1, 1].Pearson’s correlation coefficient between the two vectors gave similarresults (average correlation coefficient 0.73 � 0.03, n � 10).
The BFTN population firing rate trace was calculated by combiningthe time stamp of all spikes from all BFTNs within each session,binned at 10 ms, and smoothed with a 10-bin Hanning window. Todetermine the timing of each BFTN transient synchronization event,we first generated the BFTN population firing rate trace using onlyspikes within spike bursts. BFTN transient synchronization eventswere defined as the top 20% local maxima in this population firingrate trace, which provided a conservative selection of BFTN transientsynchronization events. Relaxation of our criteria up to the top halflocal maxima mattered little to our conclusions in Figs. 6 and 7.
To determine the theta phase of BFTN transient synchronizationevents, we first identified the local peaks and troughs of prominenttheta oscillations (with an amplitude cutoff) during WK and REMstates. Phase values were linearly interpolated by assigning thetapeaks at phase zero and theta troughs at phase � (and ��). Theresultant theta-phase distribution of BFTN synchronization eventswas then tested for significant phase locking by applying the Rayleightest for circular uniformity (significant if Z �5).
PFCx LFP averages triggered by BFTN synchronization eventswere calculated in the three major states. All LFP averages werecalculated at the [�3, 3]-s interval. The LFP average was consideredstatistically significant when �20 bins within the [�0.3, 0.3]-s inter-val laid outside the [minimum, maximum] bound of its values at [�3,�1]- and [1, 3]-s intervals (P � 0.000025). Because all but one of theLFP averages were statistically significant using this criterion, relax-ing the criterion did not change our conclusions.
Oscillation phase at time 0 of the LFP averages was determined bylinear interpolation using local peaks (phase zero) and local troughs
(phases � and ��) in the LFP averages as reference points. LFPaverages were first smoothed with a 30-bin Hanning window (60-msduration) to smooth out small fluctuations.
The BFTN synchronization–triggered PFCx LFP spectral perturba-tions were calculated as follows: First, the log-power spectrogram wascalculated for the [�3, 3]-s interval around each BFTN synchroniza-tion event, with a 0.2-s window and a 0.01-s step. Second, theselog-power spectrograms were averaged within each animal for allsynchronization events (and also separately for events within WK,SWS, and REM states). Results from all eight sessions with PFCx
A
B
C
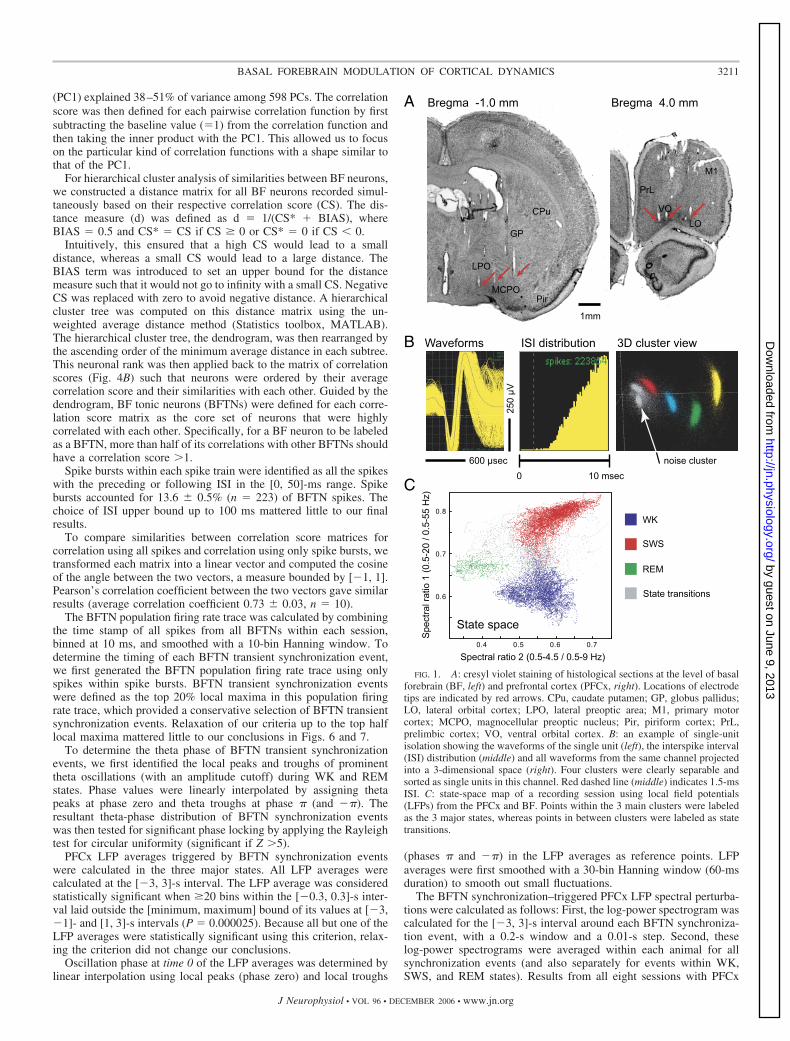
FIG. 1. A: cresyl violet staining of histological sections at the level of basalforebrain (BF, left) and prefrontal cortex (PFCx, right). Locations of electrodetips are indicated by red arrows. CPu, caudate putamen; GP, globus pallidus;LO, lateral orbital cortex; LPO, lateral preoptic area; M1, primary motorcortex; MCPO, magnocellular preoptic nucleus; Pir, piriform cortex; PrL,prelimbic cortex; VO, ventral orbital cortex. B: an example of single-unitisolation showing the waveforms of the single unit (left), the interspike interval(ISI) distribution (middle) and all waveforms from the same channel projectedinto a 3-dimensional space (right). Four clusters were clearly separable andsorted as single units in this channel. Red dashed line (middle) indicates 1.5-msISI. C: state-space map of a recording session using local field potentials(LFPs) from the PFCx and BF. Points within the 3 main clusters were labeledas the 3 major states, whereas points in between clusters were labeled as statetransitions.
3211BASAL FOREBRAIN MODULATION OF CORTICAL DYNAMICS
J Neurophysiol • VOL 96 • DECEMBER 2006 • www.jn.org
by guest on June 9, 2013http://jn.physiology.org/
Dow
nloaded from
LFPs were averaged to give the final result. The spectrogram at the[�3, �1.8]-s interval (100 time steps) was used as the baseline andthe mean spectrum of the baseline period was subtracted from eachtime window to reveal spectral power fluctuations. The [minimum,maximum] amplitude during the baseline period (per frequency bin)was used as the threshold for statistical significance (P � 0.01).Nonstatistically significant spectrogram bins were plotted with zeroamplitude (green) in Fig. 7. In other words, all nongreen bins werestatistically significant.
R E S U L T S
Six rats were implanted with multielectrode arrays in the BFand the PFCx (Fig. 1A). Single-unit activity from the BF andLFPs from both the BF and PFCx were recorded for, onaverage, 4.97 � 0.17 h (n � 10 sessions, mean � SE) duringthe light cycle when the rats were naturally sleeping andwaking without being disturbed. A total of 327 single unitswere sorted off-line (Fig. 1B) (Nicolelis et al. 2003). Anaverage of 32.7 � 3.0 (n � 10) BF single units were simulta-neously recorded during each session. Epochs of the three
major wake–sleep states—waking (WK), slow-wave sleep(SWS), and rapid-eye-movement sleep (REM)—were identi-fied based on spectral features of LFPs using the state-spacemethod we previously developed (Gervasoni et al. 2004) (Fig.1C), which was behaviorally validated by classical sleep scor-ing methods. On average, 49 � 11 min of WK, 156 � 9 minof SWS, and 28 � 3 min of REM epochs (n � 10) wereidentified per recording session. State transition epochs (i.e.,points connecting the three main clusters in the state space)were not coded toward the three major wake–sleep states.
State-dependent firing patterns of BF neurons
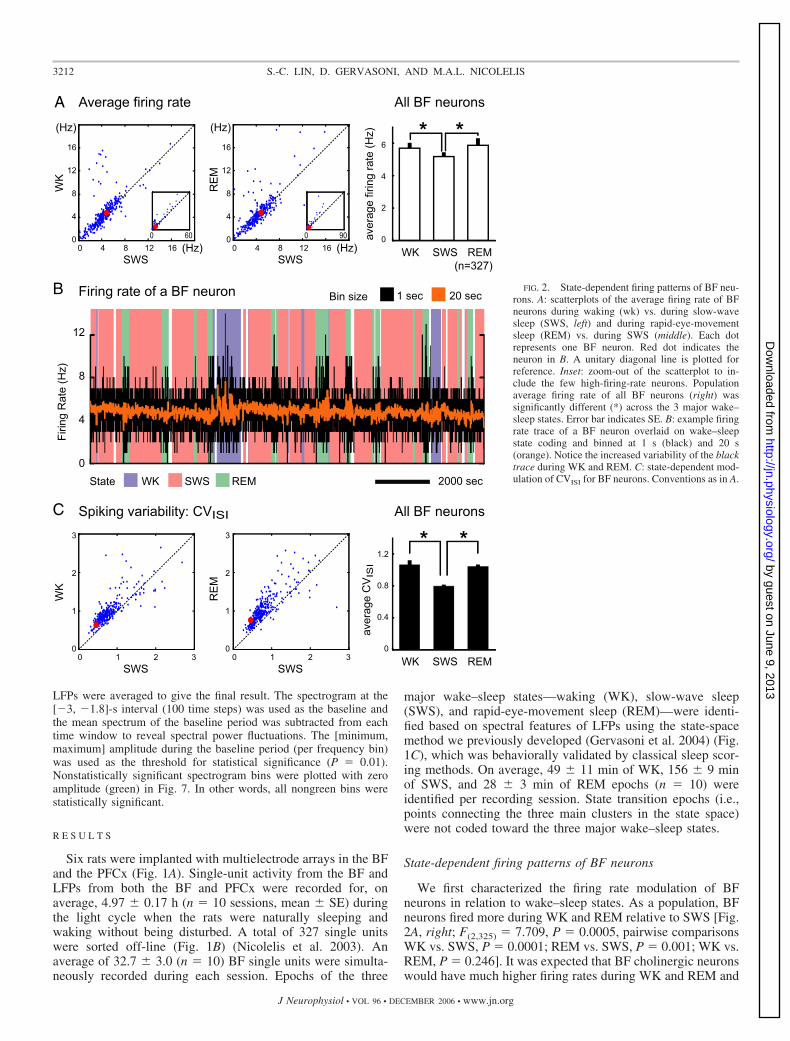
We first characterized the firing rate modulation of BFneurons in relation to wake–sleep states. As a population, BFneurons fired more during WK and REM relative to SWS [Fig.2A, right; F(2,325) � 7.709, P � 0.0005, pairwise comparisonsWK vs. SWS, P � 0.0001; REM vs. SWS, P � 0.001; WK vs.REM, P � 0.246]. It was expected that BF cholinergic neuronswould have much higher firing rates during WK and REM and
A
B
C
FIG. 2. State-dependent firing patterns of BF neu-rons. A: scatterplots of the average firing rate of BFneurons during waking (wk) vs. during slow-wavesleep (SWS, left) and during rapid-eye-movementsleep (REM) vs. during SWS (middle). Each dotrepresents one BF neuron. Red dot indicates theneuron in B. A unitary diagonal line is plotted forreference. Inset: zoom-out of the scatterplot to in-clude the few high-firing-rate neurons. Populationaverage firing rate of all BF neurons (right) wassignificantly different (*) across the 3 major wake–sleep states. Error bar indicates SE. B: example firingrate trace of a BF neuron overlaid on wake–sleepstate coding and binned at 1 s (black) and 20 s(orange). Notice the increased variability of the blacktrace during WK and REM. C: state-dependent mod-ulation of CVISI for BF neurons. Conventions as in A.
3212 S.-C. LIN, D. GERVASONI, AND M.A.L. NICOLELIS
J Neurophysiol • VOL 96 • DECEMBER 2006 • www.jn.org
by guest on June 9, 2013http://jn.physiology.org/
Dow
nloaded from
virtually cease firing during SWS, as recently demonstratedusing juxtacellular recording and labeling in head-restrainedrats (Lee et al. 2005). Consistent with this description ofcholinergic neurons, roughly 10% (33/327) of our recorded BFneurons increased their firing rate �1.5-fold during WK orREM relative to SWS. However, in contrast to the state-dependent firing rate modulation of cholinergic neurons (Lee etal. 2005), the majority of our recorded BF neurons had similarfiring rates across states (along the diagonal line of Fig. 2Awith firing rate 2–8 Hz). This strongly suggests that these BFneurons were not cholinergic neurons.
Despite the lack of firing rate modulation across states, weobserved a clear state-dependent modulation in the firing pat-tern among most BF neurons recorded: the variability of thefiring rate trace increased prominently during WK and REMrelative to that of SWS (Fig. 2B, black trace). The spikingvariability, quantified by the coefficient of variation of theinterspike interval distribution (CVISI) (Fig. 2C), was consis-tently higher during WK and REM than during SWS for almostall BF neurons [Fig. 2C, right; F(2,325) � 166.479, P � 2 �
10�50, pairwise comparisons WK vs. SWS, P � 3 � 10�8;REM vs. SWS, P � 2 � 10�51; WK vs. REM, P � 0.657].
Given that a vast number of BF neurons exhibit clearstate-dependent modulation of their spiking variability, but nochanges in their average firing rate, how can these noncholin-ergic BF neurons modulate, at least partially, the differentpatterns of cortical activity during various wake–sleep states?We hypothesized that this state-dependent spiking variabilitycould be used to modulate cortical activity by coordinatingtransient firing rate fluctuations of BF neurons across thepopulation. For this hypothesis to be valid, spike timing shouldbe correlated across the BF neuronal population. This hypoth-esis further proposed that such spike timing correlation shouldbe more prominent during WK and REM than during SWS.
Pairwise correlation of BF neurons in different states
To test our hypothesis, pairwise correlation of spike trainswas used to quantify how well transient firing rate fluctuationsamong all simultaneously recorded BF neurons were correlated
A B
C
D E
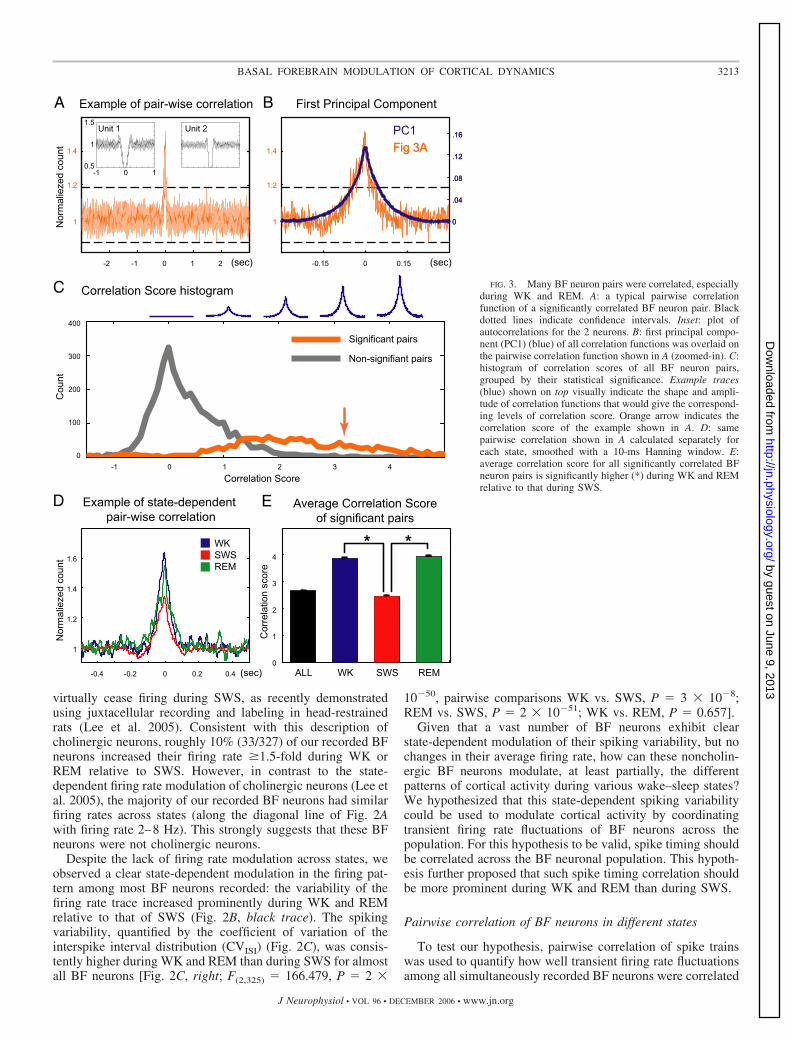
FIG. 3. Many BF neuron pairs were correlated, especiallyduring WK and REM. A: a typical pairwise correlationfunction of a significantly correlated BF neuron pair. Blackdotted lines indicate confidence intervals. Inset: plot ofautocorrelations for the 2 neurons. B: first principal compo-nent (PC1) (blue) of all correlation functions was overlaid onthe pairwise correlation function shown in A (zoomed-in). C:histogram of correlation scores of all BF neuron pairs,grouped by their statistical significance. Example traces(blue) shown on top visually indicate the shape and ampli-tude of correlation functions that would give the correspond-ing levels of correlation score. Orange arrow indicates thecorrelation score of the example shown in A. D: samepairwise correlation shown in A calculated separately foreach state, smoothed with a 10-ms Hanning window. E:average correlation score for all significantly correlated BFneuron pairs is significantly higher (*) during WK and REMrelative to that during SWS.
3213BASAL FOREBRAIN MODULATION OF CORTICAL DYNAMICS
J Neurophysiol • VOL 96 • DECEMBER 2006 • www.jn.org
by guest on June 9, 2013http://jn.physiology.org/
Dow
nloaded from

across behavioral states. Among 4,844 simultaneously re-corded BF neuronal pairs, 33% of them were significantlycorrelated in the [�300, �300]-ms interval. Many correlatedpairs had a broad (about 150 ms) zero-lag peak (see Fig. 3, Aand B). This observation was confirmed when we used princi-pal component analysis (PCA) to determine the dominantcorrelation patterns among all pairwise correlation functions.This analysis revealed that the first principal component (PC1)(Fig. 3B), which overlapped almost completely with the exam-ple in Fig. 3A, explained 38% of the variability among all pairsand 42% of the variability among significantly correlated pairs.The second PC explained only 3–4% of variance and thereforedoes not reflect the dominant correlation patterns.
To give a quantitative measure of how strongly each pair-wise correlation behaved like the PC1, a correlation score wasdefined for each pairwise correlation by projecting the individ-ual correlation function (baseline subtracted) onto the PC1(Fig. 3C). Correlation functions with a shape similar to that ofthe PC1 and high amplitude would result in high correlationscores (�1), as illustrated by example traces above Fig. 3C,whereas nonsignificantly correlated pairs had correlationscores close to zero (Fig. 3C). This confirmed that statisticallycorrelated pairs had shapes similar to the PC1 and that PC1successfully captured the most prominent correlation pattern.
We further tested whether wake–sleep states modulated thestrength of correlation. Significant correlations were present inall three major wake–sleep states, with higher correlation peaksduring the WK and REM states (see example in Fig. 3D).Correlation scores were significantly higher during WK andREM compared with that of SWS for all significantly corre-lated pairs [Fig. 3E; F(2,1617) � 435.798, P � 4 � 10�152,pairwise comparisons WK vs. SWS, P � 2 � 10�124; REM vs.SWS, P � 1 � 10�114; WK vs. REM, P � 0.307]. Theseresults confirmed our predictions that the spiking variability ofBF neurons was indeed correlated, especially during WK andREM, and could potentially be used to modulate corticalactivity without significantly modulating the average firing rateacross wake–sleep states.
BF tonic neurons form functional assemblies
Because not all BF neuron pairs had high correlation scores, wefurther asked whether the pairs with high correlation scores wereformed by a subset of BF neurons. For this purpose, we con-structed a matrix of correlation scores for all BF neuron pairsrecorded simultaneously within a session (Fig. 4A). If a subset ofBF neurons accounted for most of the correlation, we should beable to reorder the neurons using a hierarchical cluster analysisand have high correlation scores clustered together. We observedthat, in all recording sessions, a subset of neurons accounted formost of the high correlation score pairs (see example in Fig. 4Band population results in Fig. 4C) and constituted 67.8 � 3.7%(n � 10) of all recorded BF neurons.
Importantly, this novel correlation-based characterizationrevealed a physiologically homogeneous subset of BF neurons.These neurons were exclusively tonic-firing neurons (4.23 �0.10 Hz, n � 223) that showed little change in average firingrate across states [Fig. 4D; F(2,221) � 0.462, P � 0.631] but hadrobust increases in the spiking variability during WK and REMrelative to SWS [Fig. 4E; F(2,221) � 185.473, P � 5 � 10�48,pairwise comparisons WK vs. SWS, P � 5 � 10�6; REM vs.SWS, P � 3 � 10�49; WK vs. REM, P � 0.395]. We refer tothis set of neurons as the BF tonic neurons, or BFTNs.
Transient synchronization among BFTNs using spike bursts
Given that BFTNs formed functional assemblies and theirspike timings were highly correlated, we further investigatedthe output of the BFTN ensembles. The population firing rateof BFTNs fluctuated more during WK and REM relative toSWS (pop-FR traces in Fig. 5A). Prominent peaks in the BFTNpopulation firing rate traces were clearly visible in all threemajor states (Fig. 5, A1–A3), indicating that the output ofBFTN ensembles was not temporally uniform and varied on afast timescale.
When the spike trains of BFTNs were plotted using the newneuron rank derived from the hierarchical cluster analysis (Fig.4B), most BFTNs fired brief spike bursts (spikes with 0- to
A B C
D E
FIG. 4. Identification of BF tonic neu-rons (BFTNs). A: unsorted matrix of corre-lation scores among 41 simultaneously re-corded BF neurons. B: same matrix sortedwith a hierarchical cluster analysis revealedthat 29 BFTNs (bounded by the red square)accounted for the majority of high correla-tion scores. Dendrogram of the hierarchicalcluster analysis was aligned on the sidewith BFTNs labeled red. C: histogram ofcorrelation scores plotted separately forpairs between BFTNs (red) and for all otherpairs (gray). Pairs between BFTNs ac-counted for most of the high correlationscores. D: scatterplots of the average firingrate of BF neurons during REM vs. duringSWS (left) with BFTNs labeled red. Popu-lation average firing rate of BFTNs was notsignificantly different (ns) across the 3states (right). E: scatterplot and the popula-tion average of CVISI for BFTNs. Conven-tions as in D.
3214 S.-C. LIN, D. GERVASONI, AND M.A.L. NICOLELIS
J Neurophysiol • VOL 96 • DECEMBER 2006 • www.jn.org
by guest on June 9, 2013http://jn.physiology.org/
Dow
nloaded from

50-ms ISI, labeled as red spikes in Fig. 5A) at the peaks ofBFTN population firing rates. Conversely, BFTN spike burstsaccounted for most of the peaks in the BFTN population firingrates (compare the two pop-FR traces in Fig. 5A). Theseobservations indicated that BFTNs engaged in transient popu-lation synchronization events through brief spike bursts.
We further quantified how strongly spike bursts of BFTNswere correlated. Pairwise correlation using spikes within spikebursts (referred to hereafter as spike burst correlation) showedmuch higher correlation peaks than correlation using all spikes(see example in Fig. 5B; correlation score paired t-test, t2436 �
58.29). The spike burst correlations were similar in width withcorrelations using all spikes because the PC1 of spike burstcorrelations was almost identical with that in Fig. 3B (corre-lation coefficient 0.9869). The PC1 explained 51% of thevariability among all spike burst correlations. Furthermore, thematrices of correlation scores using all spikes (Fig. 4B) andspike burst correlations (Fig. 5C) were also highly similar(average similarity 0.82 � 0.02, n � 10). They differed only inscale (20-fold). Notice that only spike burst correlations be-tween BFTNs showed high correlation scores, indicating thatthese correlations represent a unique property of BFTNs.
These observations indicated that most of the observedpairwise correlations can be accounted for by transient popu-lation synchronization among BFTNs, consisting of brief spikebursts. BFTN transient synchronization events, defined as thelocal peaks of the BFTN population firing rate trace (seeMETHODS), were more prevalent during WK (0.52 � 0.07 Hz)and REM (0.72 � 0.07 Hz) than during SWS (0.26 � 0.03 Hz)[F(2,8) � 34.386, P � 0.0001]. The average duration of BFTNtransient synchronization, represented by the width of the PC1(Fig. 3B) at half-peak, was roughly 160 ms, which is the sametime window for one cycle of exploratory behaviors such aswhisking, licking, and sniffing (Davis and Smith 1992; Welkeret al. 1964) and also the duration of one theta oscillation cycle.Taken together, the BFTN ensemble output seems to be orga-nized into transient synchronization events, which could havea substantial impact on the modulation of cortical activity.
BFTN synchronization was coupled to PFCx activity
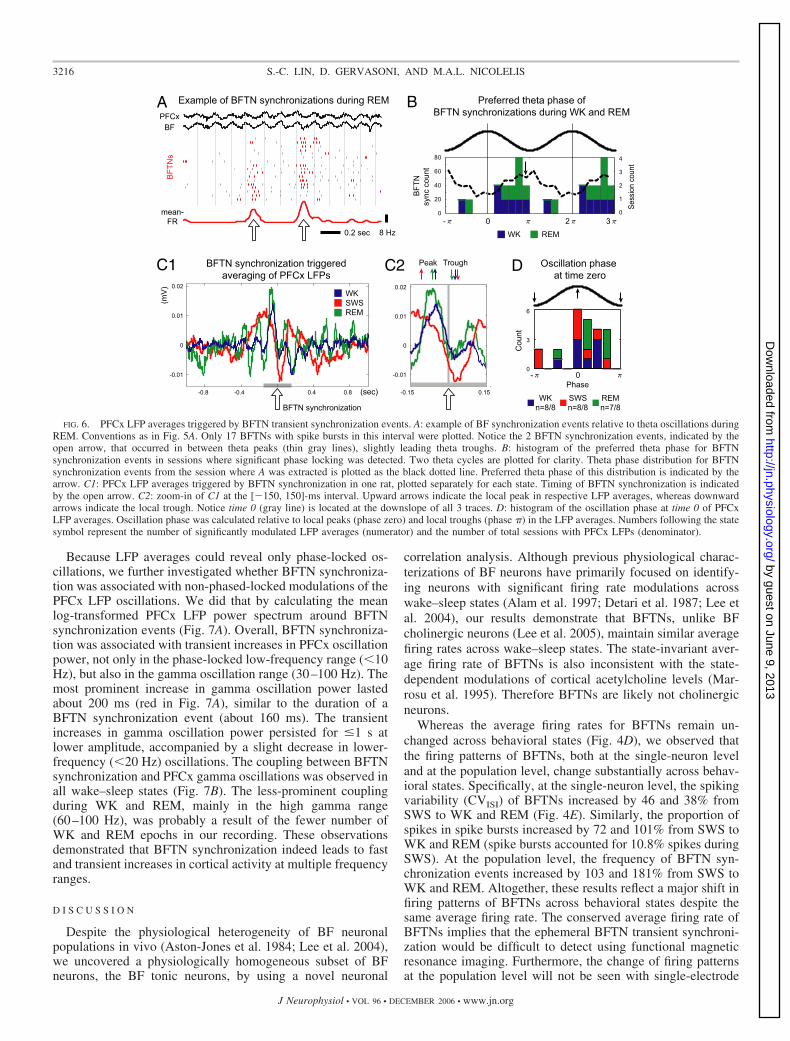
If transient BFTN synchronization indeed modulated corti-cal activity, one would predict that it should be tightly coupledwith fluctuations in cortical oscillation patterns. Indeed, weobserved that during WK with prominent theta oscillations andduring REM, BFTN synchronization events occurred prefer-entially between PFCx theta peaks and slightly lead thetatroughs (see example in Fig. 6A). We linearly extrapolated thetheta phase of each BFTN synchronization event relative totheta peaks (phase zero) and theta troughs (phase �). Acrossthe eight sessions where PFCx LFPs were recorded, in 14/16cases (7/8 for WK; 7/8 for REM) the theta-phase distribution ofBFTN synchronization events was not uniform (Rayleigh test,Z �5). Overall, the preferred theta phase of BFTN synchroni-zation was at the downslope of PFCx theta oscillations justpreceding the trough (Fig. 6B).
Next, we calculated PFCx LFP averages triggered by BFTNsynchronization events. All but one (23/24, three states � eightsessions) of the LFP averages showed significant modulationsin the [�300, 300]-ms interval around the time of BFTNsynchronization (Fig. 6C). LFP averages showed prominenttheta oscillation (5–9 Hz) coupling during WK and REM andoscillations at lower frequencies during SWS (Fig. 6C1). Fur-thermore, consistent with the theta oscillation coupling duringWK and REM (Fig. 6A), BFTN synchronization occurredpreferentially at the downslope of cortical oscillations preced-ing the trough of LFP averages in all wake–sleep states (Fig. 6,C2 and D). Because cortical oscillation troughs likely corre-spond to increased neuronal activity in the cortex (Chrobak andBuzsaki 1998; Fries et al. 2001), these results suggested thatthe BFTN synchronization phase leads transient increases incortical neuronal activity.
A1
A2
A3
B C
FIG. 5. Transient population synchronization among BFTNs using spikebursts. A: examples of spike rasters of BFTNs in the 3 states, aligned withPFCx and BF LFPs and the clustering dendrogram. Spike bursts (spikes with0- to 50-ms ISI) were labeled red. BFTN population firing rate traces (pop-FR)were drawn at the bottom for all spikes (black) and for spike bursts only (red).Local peaks in the red pop-FR trace indicated transient synchronization eventsamong BFTNs (see METHODS), which was more prevalent during WK (A1) andREM (A3) than during SWS (A2). B: an example of pairwise correlationbetween 2 BFTNs using only spike bursts (red) and all spikes (blue). C:correlation scores of spike burst correlations plotted in the same matrixconfiguration as in Fig. 4B. Notice the different color scale.
3215BASAL FOREBRAIN MODULATION OF CORTICAL DYNAMICS
J Neurophysiol • VOL 96 • DECEMBER 2006 • www.jn.org
by guest on June 9, 2013http://jn.physiology.org/
Dow
nloaded from
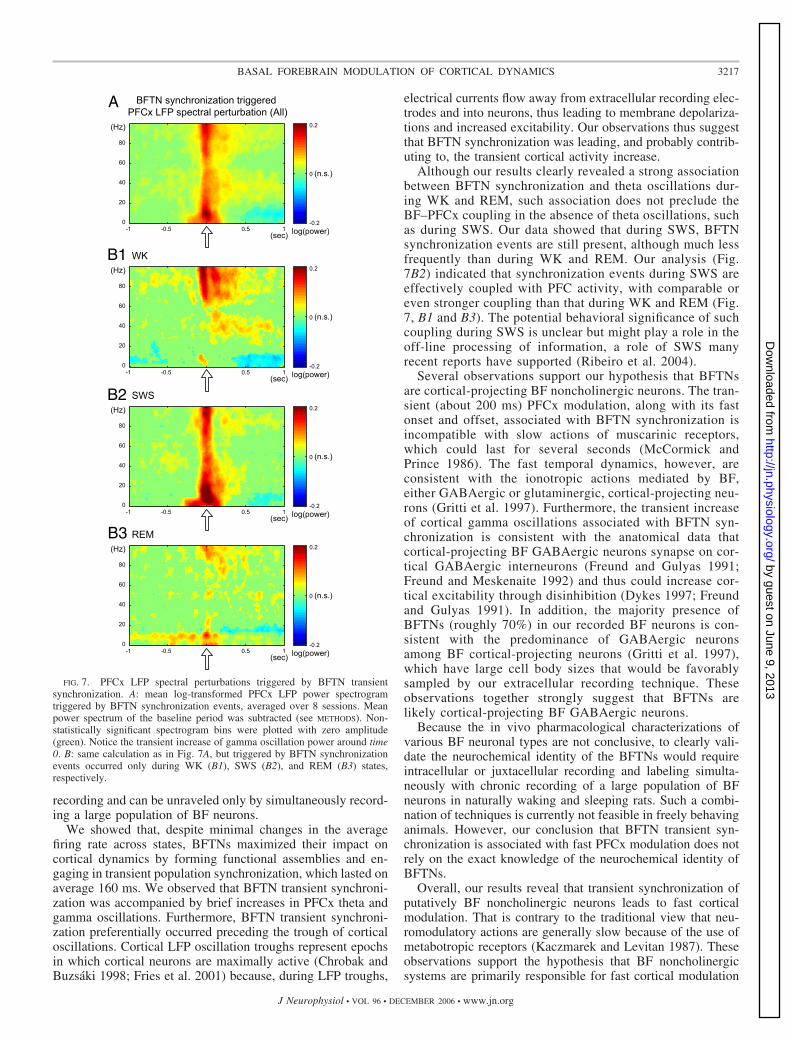
Because LFP averages could reveal only phase-locked os-cillations, we further investigated whether BFTN synchroniza-tion was associated with non-phased-locked modulations of thePFCx LFP oscillations. We did that by calculating the meanlog-transformed PFCx LFP power spectrum around BFTNsynchronization events (Fig. 7A). Overall, BFTN synchroniza-tion was associated with transient increases in PFCx oscillationpower, not only in the phase-locked low-frequency range (�10Hz), but also in the gamma oscillation range (30–100 Hz). Themost prominent increase in gamma oscillation power lastedabout 200 ms (red in Fig. 7A), similar to the duration of aBFTN synchronization event (about 160 ms). The transientincreases in gamma oscillation power persisted for �1 s atlower amplitude, accompanied by a slight decrease in lower-frequency (�20 Hz) oscillations. The coupling between BFTNsynchronization and PFCx gamma oscillations was observed inall wake–sleep states (Fig. 7B). The less-prominent couplingduring WK and REM, mainly in the high gamma range(60–100 Hz), was probably a result of the fewer number ofWK and REM epochs in our recording. These observationsdemonstrated that BFTN synchronization indeed leads to fastand transient increases in cortical activity at multiple frequencyranges.
D I S C U S S I O N
Despite the physiological heterogeneity of BF neuronalpopulations in vivo (Aston-Jones et al. 1984; Lee et al. 2004),we uncovered a physiologically homogeneous subset of BFneurons, the BF tonic neurons, by using a novel neuronal
correlation analysis. Although previous physiological charac-terizations of BF neurons have primarily focused on identify-ing neurons with significant firing rate modulations acrosswake–sleep states (Alam et al. 1997; Detari et al. 1987; Lee etal. 2004), our results demonstrate that BFTNs, unlike BFcholinergic neurons (Lee et al. 2005), maintain similar averagefiring rates across wake–sleep states. The state-invariant aver-age firing rate of BFTNs is also inconsistent with the state-dependent modulations of cortical acetylcholine levels (Mar-rosu et al. 1995). Therefore BFTNs are likely not cholinergicneurons.
Whereas the average firing rates for BFTNs remain un-changed across behavioral states (Fig. 4D), we observed thatthe firing patterns of BFTNs, both at the single-neuron leveland at the population level, change substantially across behav-ioral states. Specifically, at the single-neuron level, the spikingvariability (CVISI) of BFTNs increased by 46 and 38% fromSWS to WK and REM (Fig. 4E). Similarly, the proportion ofspikes in spike bursts increased by 72 and 101% from SWS toWK and REM (spike bursts accounted for 10.8% spikes duringSWS). At the population level, the frequency of BFTN syn-chronization events increased by 103 and 181% from SWS toWK and REM. Altogether, these results reflect a major shift infiring patterns of BFTNs across behavioral states despite thesame average firing rate. The conserved average firing rate ofBFTNs implies that the ephemeral BFTN transient synchroni-zation would be difficult to detect using functional magneticresonance imaging. Furthermore, the change of firing patternsat the population level will not be seen with single-electrode
A
C1 C2 D
B
FIG. 6. PFCx LFP averages triggered by BFTN transient synchronization events. A: example of BF synchronization events relative to theta oscillations duringREM. Conventions as in Fig. 5A. Only 17 BFTNs with spike bursts in this interval were plotted. Notice the 2 BFTN synchronization events, indicated by theopen arrow, that occurred in between theta peaks (thin gray lines), slightly leading theta troughs. B: histogram of the preferred theta phase for BFTNsynchronization events in sessions where significant phase locking was detected. Two theta cycles are plotted for clarity. Theta phase distribution for BFTNsynchronization events from the session where A was extracted is plotted as the black dotted line. Preferred theta phase of this distribution is indicated by thearrow. C1: PFCx LFP averages triggered by BFTN synchronization in one rat, plotted separately for each state. Timing of BFTN synchronization is indicatedby the open arrow. C2: zoom-in of C1 at the [�150, 150]-ms interval. Upward arrows indicate the local peak in respective LFP averages, whereas downwardarrows indicate the local trough. Notice time 0 (gray line) is located at the downslope of all 3 traces. D: histogram of the oscillation phase at time 0 of PFCxLFP averages. Oscillation phase was calculated relative to local peaks (phase zero) and local troughs (phase �) in the LFP averages. Numbers following the statesymbol represent the number of significantly modulated LFP averages (numerator) and the number of total sessions with PFCx LFPs (denominator).
3216 S.-C. LIN, D. GERVASONI, AND M.A.L. NICOLELIS
J Neurophysiol • VOL 96 • DECEMBER 2006 • www.jn.org
by guest on June 9, 2013http://jn.physiology.org/
Dow
nloaded from
recording and can be unraveled only by simultaneously record-ing a large population of BF neurons.
We showed that, despite minimal changes in the averagefiring rate across states, BFTNs maximized their impact oncortical dynamics by forming functional assemblies and en-gaging in transient population synchronization, which lasted onaverage 160 ms. We observed that BFTN transient synchroni-zation was accompanied by brief increases in PFCx theta andgamma oscillations. Furthermore, BFTN transient synchroni-zation preferentially occurred preceding the trough of corticaloscillations. Cortical LFP oscillation troughs represent epochsin which cortical neurons are maximally active (Chrobak andBuzsaki 1998; Fries et al. 2001) because, during LFP troughs,
electrical currents flow away from extracellular recording elec-trodes and into neurons, thus leading to membrane depolariza-tions and increased excitability. Our observations thus suggestthat BFTN synchronization was leading, and probably contrib-uting to, the transient cortical activity increase.
Although our results clearly revealed a strong associationbetween BFTN synchronization and theta oscillations dur-ing WK and REM, such association does not preclude theBF–PFCx coupling in the absence of theta oscillations, suchas during SWS. Our data showed that during SWS, BFTNsynchronization events are still present, although much lessfrequently than during WK and REM. Our analysis (Fig.7B2) indicated that synchronization events during SWS areeffectively coupled with PFC activity, with comparable oreven stronger coupling than that during WK and REM (Fig.7, B1 and B3). The potential behavioral significance of suchcoupling during SWS is unclear but might play a role in theoff-line processing of information, a role of SWS manyrecent reports have supported (Ribeiro et al. 2004).
Several observations support our hypothesis that BFTNsare cortical-projecting BF noncholinergic neurons. The tran-sient (about 200 ms) PFCx modulation, along with its fastonset and offset, associated with BFTN synchronization isincompatible with slow actions of muscarinic receptors,which could last for several seconds (McCormick andPrince 1986). The fast temporal dynamics, however, areconsistent with the ionotropic actions mediated by BF,either GABAergic or glutaminergic, cortical-projecting neu-rons (Gritti et al. 1997). Furthermore, the transient increaseof cortical gamma oscillations associated with BFTN syn-chronization is consistent with the anatomical data thatcortical-projecting BF GABAergic neurons synapse on cor-tical GABAergic interneurons (Freund and Gulyas 1991;Freund and Meskenaite 1992) and thus could increase cor-tical excitability through disinhibition (Dykes 1997; Freundand Gulyas 1991). In addition, the majority presence ofBFTNs (roughly 70%) in our recorded BF neurons is con-sistent with the predominance of GABAergic neuronsamong BF cortical-projecting neurons (Gritti et al. 1997),which have large cell body sizes that would be favorablysampled by our extracellular recording technique. Theseobservations together strongly suggest that BFTNs arelikely cortical-projecting BF GABAergic neurons.
Because the in vivo pharmacological characterizations ofvarious BF neuronal types are not conclusive, to clearly vali-date the neurochemical identity of the BFTNs would requireintracellular or juxtacellular recording and labeling simulta-neously with chronic recording of a large population of BFneurons in naturally waking and sleeping rats. Such a combi-nation of techniques is currently not feasible in freely behavinganimals. However, our conclusion that BFTN transient syn-chronization is associated with fast PFCx modulation does notrely on the exact knowledge of the neurochemical identity ofBFTNs.
Overall, our results reveal that transient synchronization ofputatively BF noncholinergic neurons leads to fast corticalmodulation. That is contrary to the traditional view that neu-romodulatory actions are generally slow because of the use ofmetabotropic receptors (Kaczmarek and Levitan 1987). Theseobservations support the hypothesis that BF noncholinergicsystems are primarily responsible for fast cortical modulation
A
B1
B2
B3
FIG. 7. PFCx LFP spectral perturbations triggered by BFTN transientsynchronization. A: mean log-transformed PFCx LFP power spectrogramtriggered by BFTN synchronization events, averaged over 8 sessions. Meanpower spectrum of the baseline period was subtracted (see METHODS). Non-statistically significant spectrogram bins were plotted with zero amplitude(green). Notice the transient increase of gamma oscillation power around time0. B: same calculation as in Fig. 7A, but triggered by BFTN synchronizationevents occurred only during WK (B1), SWS (B2), and REM (B3) states,respectively.
3217BASAL FOREBRAIN MODULATION OF CORTICAL DYNAMICS
J Neurophysiol • VOL 96 • DECEMBER 2006 • www.jn.org
by guest on June 9, 2013http://jn.physiology.org/
Dow
nloaded from

to transiently amplify cortical activity and the processing ofincoming stimuli, especially during WK and REM. Such atransient signal-amplifying mechanism could serve as a neuralsubstrate for selective attention.
A C K N O W L E D G M E N T S
We thank R. Costa, R. Gutierrez, M. Wiest, E. Thomson, S. Ribeiro, and S.Raghavachari for valuable discussions and comments on previous versions ofthe manuscript. We also thank J. Meloy for technical assistance and S.Halkiotis for proofreading the manuscript.
G R A N T S
This work was supported by funding from Institut National de la Santeet de la Recherche Medicale to D. Gervasoni and from National Institutesof Health and Defense Advanced Research Projects Agency to M.A.L.Nicolelis.
R E F E R E N C E S
Alam MN, McGinty D, and Szymusiak R. Thermosensitive neurons of thediagonal band in rats: relation to wakefulness and non-rapid eye movementsleep. Brain Res 752: 81–89, 1997.
Aston-Jones G, Shaver R, and Dinan T. Cortically projecting nucleus basalisneurons in rat are physiologically heterogeneous. Neurosci Lett 46: 19–24,1984.
Berntson GG, Shafi R, and Sarter M. Specific contributions of the basalforebrain corticopetal cholinergic system to electroencephalographicactivity and sleep/waking behaviour. Eur J Neurosci 16: 2453–2461,2002.
Buzsaki G, Bickford R, Ponomareff G, Thal L, Mandel R, and Gage F.Nucleus basalis and thalamic control of neocortical activity in the freelymoving rat. J Neurosci 8: 4007–4026, 1988.
Chiba AA, Bucci DJ, Holland PC, and Gallagher M. Basal forebraincholinergic lesions disrupt increments but not decrements in conditionedstimulus processing. J Neurosci 15: 7315–7322, 1995.
Chrobak JJ and Buzsaki G. Gamma oscillations in the entorhinal cortex ofthe freely behaving rat. J Neurosci 18: 388–398, 1998.
Davis JD and Smith GP. Analysis of the microstructure of the rhythmictongue movements of rats ingesting maltose and sucrose solutions. BehavNeurosci 106: 217–228, 1992.
Detari L, Juhasz G, and Kukorelli T. Neuronal firing in the pallidal region:firing patterns during sleep-wakefulness cycle in cats. ElectroencephalogrClin Neurophysiol 67: 159–166, 1987.
Dunnett SB, Everitt BJ, and Robbins TW. The basal forebrain-corticalcholinergic system: interpreting the functional consequences of excitotoxiclesions. Trends Neurosci 14: 494–501, 1991.
Dykes RW. Mechanisms controlling neuronal plasticity in somatosensorycortex. Can J Physiol Pharmacol 75: 535–545, 1997.
Engel AK, Fries P, and Singer W. Dynamic predictions: oscillations andsynchrony in top-down processing. Nat Rev Neurosci 2: 704–716, 2001.
Everitt BJ and Robbins TW. Central cholinergic systems and cognition.Annu Rev Psychol 48: 649–684, 1997.
Fell J, Fernandez G, Klaver P, Elger CE, and Fries P. Is synchronizedneuronal gamma activity relevant for selective attention? Brain Res Rev 42:265–272, 2003.
Freund TF and Gulyas AI. GABAergic interneurons containing calbindinD28K or somatostatin are major targets of GABAergic basal forebrainafferents in the rat neocortex. J Comp Neurol 314: 187–199, 1991.
Freund TF and Meskenaite V. gamma-Aminobutyric acid-containing basalforebrain neurons innervate inhibitory interneurons in the neocortex. ProcNatl Acad Sci USA 89: 738–742, 1992.
Fries P, Reynolds JH, Rorie AE, and Desimone R. Modulation of oscillatoryneuronal synchronization by selective visual attention. Science 291: 1560–1563, 2001.
Gervasoni D, Lin SC, Ribeiro S, Soares ES, Pantoja J, and Nicolelis MA.Global forebrain dynamics predict rat behavioral states and their transitions.J Neurosci 24: 11137–11147, 2004.
Gritti I, Mainville L, Mancia M, and Jones BE. GABAergic and othernoncholinergic basal forebrain neurons, together with cholinergic neurons,project to the mesocortex and isocortex in the rat. J Comp Neurol 383:163–177, 1997.
Jimenez-Capdeville ME, Dykes RW, and Myasnikov AA. Differentialcontrol of cortical activity by the basal forebrain in rats: a role for bothcholinergic and inhibitory influences. J Comp Neurol 381: 53– 67, 1997.
Jones BE. Arousal systems. Front Biosci 8: s438–s451, 2003.Kaczmarek LK and Levitan IB. Neuromodulation: The Biochemical Control
of Neuronal Excitability. New York: Oxford Univ. Press, 1987.Kilgard MP and Merzenich MM. Cortical map reorganization enabled by
nucleus basalis activity. Science 279: 1714–1718, 1998.Lee MG, Hassani OK, Alonso A, and Jones BE. Cholinergic basal forebrain
neurons burst with theta during waking and paradoxical sleep. J Neurosci25: 4365–4369, 2005.
Lee MG, Manns ID, Alonso A, and Jones BE. Sleep-wake related dischargeproperties of basal forebrain neurons recorded with micropipettes in head-fixed rats. J Neurophysiol 92: 1182–1198, 2004.
Markowska AL, Wenk GL, and Olton DS. Nucleus basalis magnocellularisand memory: differential effects of two neurotoxins. Behav Neural Biol 54:13–26, 1990.
Marrosu F, Portas C, Mascia MS, Casu MA, Fa M, Giagheddu M,Imperato A, and Gessa GL. Microdialysis measurement of cortical andhippocampal acetylcholine release during sleep-wake cycle in freely movingcats. Brain Res 671: 329–332, 1995.
McCormick D and Prince D. Mechanisms of action of acetylcholine in theguinea-pig cerebral cortex in vitro. J Physiol 375: 169–194, 1986.
McLin DE 3rd, Miasnikov AA, and Weinberger NM. The effects ofelectrical stimulation of the nucleus basalis on the electroencephalogram,heart rate, and respiration. Behav Neurosci 116: 795–806, 2002.
Nicolelis MA, Dimitrov D, Carmena JM, Crist R, Lehew G, Kralik JD,and Wise SP. Chronic, multisite, multielectrode recordings in macaquemonkeys. Proc Natl Acad Sci USA 100: 11041–11046, 2003.
Nicolelis MA, Ghazanfar AA, Faggin BM, Votaw S, and Oliveira LM.Reconstructing the engram: simultaneous, multisite, many single neuronrecordings. Neuron 18: 529–537, 1997.
Page KJ, Everitt BJ, Robbins TW, Marston HM, and Wilkinson LS.Dissociable effects on spatial maze and passive avoidance acquisition andretention following AMPA- and ibotenic acid-induced excitotoxic lesions ofthe basal forebrain in rats: differential dependence on cholinergic neuronalloss. Neuroscience 43: 457–472, 1991.
Paxinos G and Watson C. The Rat Brain in Stereotaxic Coordinates. SanDiego, CA: Academic Press, 2005.
Posner MI. Orienting of attention. Q J Exp Psychol 32: 3–25, 1980.Ribeiro S, Gervasoni D, Soares ES, Zhou Y, Lin SC, Pantoja J, Lavine
M, and Nicolelis MA. Long-lasting novelty-induced neuronal reverber-ation during slow-wave sleep in multiple forebrain areas. PLoS Biol 2:E24, 2004.
Richardson RT and DeLong MR. Electrophysiological studies of the func-tions of the nucleus basalis in primates. Adv Exp Med Biol 295: 233–252,1991.
Riekkinen P Jr, Sirvio J, Riekkinen M, and Riekkinen P. EEG changesinduced by acute and chronic quisqualic or ibotenic acid nucleus basalislesions are stabilized by tacridine. Brain Res 559: 304–308, 1991.
Rye DB, Wainer BH, Mesulam MM, Mufson EJ, and Saper CB. Corticalprojections arising from the basal forebrain: a study of cholinergic andnoncholinergic components employing combined retrograde tracing andimmunohistochemical localization of choline acetyltransferase. Neuro-science 13: 627–643, 1984.
Sarter M and Bruno JP. The neglected constituent of the basal forebraincorticopetal projection system: GABAergic projections. Eur J Neurosci 15:1867–1873, 2002.
Semba K. Multiple output pathways of the basal forebrain: organization,chemical heterogeneity, and roles in vigilance. Behav Brain Res 115:117–141, 2000.
Varela F, Lachaux JP, Rodriguez E, and Martinerie J. The brainweb: phasesynchronization and large-scale integration. Nat Rev Neurosci 2: 229–239,2001.
Walker LC, Price DL, and Young WS 3rd. GABAergic neurons in theprimate basal forebrain magnocellular complex. Brain Res 499: 188–192,1989.
Weinberger NM. The nucleus basalis and memory codes: auditory corticalplasticity and the induction of specific, associative behavioral memory.Neurobiol Learn Mem 80: 268–284, 2003.
Welker WI, Johnson JI Jr, and Pubols BH Jr. Some morphological andphysiological characteristics of the somatic sensory system in raccoons. AmZool 136: 75–94, 1964.
3218 S.-C. LIN, D. GERVASONI, AND M.A.L. NICOLELIS
J Neurophysiol • VOL 96 • DECEMBER 2006 • www.jn.org
by guest on June 9, 2013http://jn.physiology.org/
Dow
nloaded from
Wenk G, Stoehr J, Quintana G, Mobley S, and Wiley R. Behavioral,biochemical, histological, and electrophysiological effects of 192 IgG-saporin injections into the basal forebrain of rats. J Neurosci 14: 5986–5995,1994.
Wenk GL. The nucleus basalis magnocellularis cholinergic system: onehundred years of progress. Neurobiol Learn Mem 67: 85–95, 1997.
Whalen P, Kapp B, and Pascoe J. Neuronal activity within the nucleusbasalis and conditioned neocortical electroencephalographic activation.J Neurosci 14: 1623–1633, 1994.
Wilson FA and Rolls ET. Learning and memory are reflected in the responsesof reinforcement-related neurons in the primate basal forebrain. J Neurosci10: 1254–1267, 1990.
Zaborszky L and Duque A. Sleep-wake mechanisms and basal forebraincircuitry. Front Biosci 8: d1146–d1169, 2003.
Zaborszky L, Gaykema RP, Swanson DJ, and Cullinan WE. Cortical inputto the basal forebrain. Neuroscience 79: 1051–1078, 1997.
Zaborszky L, Pang K, Somogyi J, Nadasdy Z, and Kallo I. The basal forebraincorticopetal system revisited. Ann NY Acad Sci 877: 339–367, 1999.
3219BASAL FOREBRAIN MODULATION OF CORTICAL DYNAMICS
J Neurophysiol • VOL 96 • DECEMBER 2006 • www.jn.org
by guest on June 9, 2013http://jn.physiology.org/
Dow
nloaded from
Related Documents