Neuron Article Neurodegenerative Diseases Target Large-Scale Human Brain Networks William W. Seeley, 1, * Richard K. Crawford, 1 Juan Zhou, 1 Bruce L. Miller, 1 and Michael D. Greicius 2 1 Memory and Aging Center, Department of Neurology, University of California, San Francisco, San Francisco, CA 94143, USA 2 Department of Neurology and Neurological Sciences, Stanford University School of Medicine, Stanford, CA 94305, USA *Correspondence: [email protected] DOI 10.1016/j.neuron.2009.03.024 SUMMARY During development, the healthy human brain constructs a host of large-scale, distributed, func- tion-critical neural networks. Neurodegenerative diseases have been thought to target these systems, but this hypothesis has not been systematically tested in living humans. We used network-sensitive neuroimaging methods to show that five different neurodegenerative syndromes cause circumscribed atrophy within five distinct, healthy, human intrinsic functional connectivity networks. We further discov- ered a direct link between intrinsic connectivity and gray matter structure. Across healthy individuals, nodes within each functional network exhibited tightly correlated gray matter volumes. The findings suggest that human neural networks can be defined by synchronous baseline activity, a unified cortico- trophic fate, and selective vulnerability to neurode- generative illness. Future studies may clarify how these complex systems are assembled during devel- opment and undermined by disease. INTRODUCTION Recent functional magnetic resonance imaging (fMRI) advances have helped researchers delineate the human brain’s intrinsic functional network architecture (Fox and Raichle, 2007; Fox et al., 2005; Fransson, 2005; Greicius et al., 2003; Seeley et al., 2007). These studies have shown that, during task-free condi- tions, correlated spontaneous activity occurs within spatially distinct, functionally related groups of cortical and subcortical regions (Beckmann et al., 2005; Seeley et al., 2007; Vincent et al., 2007). As predicted by principles governing network- based synaptic physiology (Bi and Poo, 1999; Katz and Shatz, 1996), regions with synchronous baseline activity feature direct or indirect anatomical connections (Greicius et al., 2008; Seeley et al., 2007; Vincent et al., 2007). Blood-oxygen-level-dependent (BOLD) signal fluctuations within these intrinsic connectivity networks (ICNs) occur at low frequencies (0.01–0.08 Hz), exist in nonhuman primates, and continue during general anesthesia and sleep, suggesting that ICNs cannot be explained by ongoing conscious mentation alone (Fox and Raichle, 2007). On the other hand, ICNs remain detectable during mental effort (Fransson, 2006), and ICN strength and variation influence task perfor- mance inside (Fox et al., 2007; Hesselmann et al., 2008) and outside (Seeley et al., 2007) the scanner. How ICN patterns and fluctuations relate to gray matter structure in health and disease, however, remains unknown. Neurodegenerative diseases cause progressive, incapacitat- ing cognitive, behavioral, and motor dysfunction. Early on, mis- folded disease proteins aggregate within small, selectively vulnerable neuron populations that reside in specific brain regions (Graveland et al., 1985; Hyman et al., 1984; Seeley et al., 2006). Synapses falter, and damage spreads to new regions, accompanied by worsening clinical deficits (Selkoe, 2002). Often, later-affected regions bear known anatomical connections with the sites of earlier injury (Seeley et al., 2008a). Based on neuropathology (Braak and Braak, 1991), neuroimag- ing (Buckner et al., 2005; Greicius et al., 2004), and evidence from transgenic animal models (Palop et al., 2007), some authors have suggested that neurodegeneration may relate to neural network dysfunction (Buckner et al., 2005; Palop et al., 2006). In human spongiform encephalopathies, which cause rapidly progressive dementia through conformational changes in mis- folded prion protein, direct evidence supports disease propaga- tion along transsynaptic connections (Scott et al., 1992). For all other neurodegenerative diseases, limited human experimental data support the ‘‘network degeneration hypothesis.’’ If demon- strated as a class-wide phenomenon, however, this framework would have major mechanistic significance, predicting that the spatial patterning of disease relates to some structural, meta- bolic, or physiological aspect of neural network biology. Confirm- ing the network degeneration hypothesis would also have clinical impact, stimulating development of new network-based diag- nostic and disease-monitoring assays. To test the network degeneration hypothesis in living humans, we studied patients with five distinct neurodegenerative syndromes and two healthy control groups (Figure 1). Only early age-of-onset dementia syndromes were included, enabling us to better match patient groups for age and other demographic vari- ables (Table S1 available online). Patients were diagnosed with Alzheimer’s disease (AD, n = 24), behavioral variant frontotempo- ral dementia (bvFTD, n = 24), semantic dementia (SD, n = 24), progressive nonfluent aphasia (PNFA, n = 13), or corticobasal syndrome (CBS, n = 17), based on standard research criteria. Diagnoses were made on clinical grounds; therefore, neuroimag- ing and pathological data did not influence group membership. To weight our analyses toward the distinctive, early-stage neuro- anatomic features of each syndrome, we excluded patients with 42 Neuron 62, 42–52, April 16, 2009 ª2009 Elsevier Inc. NEURON 3746

Welcome message from author
This document is posted to help you gain knowledge. Please leave a comment to let me know what you think about it! Share it to your friends and learn new things together.
Transcript
Neuron
Article
Neurodegenerative Diseases TargetLarge-Scale Human Brain NetworksWilliam W. Seeley,1,* Richard K. Crawford,1 Juan Zhou,1 Bruce L. Miller,1 and Michael D. Greicius21Memory and Aging Center, Department of Neurology, University of California, San Francisco, San Francisco, CA 94143, USA2Department of Neurology and Neurological Sciences, Stanford University School of Medicine, Stanford, CA 94305, USA*Correspondence: [email protected] 10.1016/j.neuron.2009.03.024
SUMMARY
During development, the healthy human brainconstructs a host of large-scale, distributed, func-tion-critical neural networks. Neurodegenerativediseases have been thought to target these systems,but this hypothesis has not been systematicallytested in living humans. We used network-sensitiveneuroimaging methods to show that five differentneurodegenerative syndromes cause circumscribedatrophy within five distinct, healthy, human intrinsicfunctional connectivity networks. We further discov-ered a direct link between intrinsic connectivity andgray matter structure. Across healthy individuals,nodes within each functional network exhibitedtightly correlated gray matter volumes. The findingssuggest that human neural networks can be definedby synchronous baseline activity, a unified cortico-trophic fate, and selective vulnerability to neurode-generative illness. Future studies may clarify howthese complex systems are assembled during devel-opment and undermined by disease.
INTRODUCTION
Recent functional magnetic resonance imaging (fMRI) advanceshave helped researchers delineate the human brain’s intrinsicfunctional network architecture (Fox and Raichle, 2007; Foxet al., 2005; Fransson, 2005; Greicius et al., 2003; Seeley et al.,2007). These studies have shown that, during task-free condi-tions, correlated spontaneous activity occurs within spatiallydistinct, functionally related groups of cortical and subcorticalregions (Beckmann et al., 2005; Seeley et al., 2007; Vincentet al., 2007). As predicted by principles governing network-based synaptic physiology (Bi and Poo, 1999; Katz and Shatz,1996), regions with synchronous baseline activity feature director indirect anatomical connections (Greicius et al., 2008; Seeleyet al., 2007; Vincent et al., 2007). Blood-oxygen-level-dependent(BOLD) signal fluctuations within these intrinsic connectivitynetworks (ICNs) occur at low frequencies (0.01–0.08 Hz), existin nonhuman primates, and continue during general anesthesiaand sleep, suggesting that ICNs cannot be explained by ongoingconscious mentation alone (Fox and Raichle, 2007). On the otherhand, ICNs remain detectable during mental effort (Fransson,
2006), and ICN strength and variation influence task perfor-mance inside (Fox et al., 2007; Hesselmann et al., 2008) andoutside (Seeley et al., 2007) the scanner. How ICN patternsand fluctuations relate to gray matter structure in health anddisease, however, remains unknown.Neurodegenerative diseases cause progressive, incapacitat-
ing cognitive, behavioral, and motor dysfunction. Early on, mis-folded disease proteins aggregate within small, selectivelyvulnerable neuron populations that reside in specific brainregions (Graveland et al., 1985; Hyman et al., 1984; Seeleyet al., 2006). Synapses falter, and damage spreads to newregions, accompanied by worsening clinical deficits (Selkoe,2002). Often, later-affected regions bear known anatomicalconnections with the sites of earlier injury (Seeley et al., 2008a).Based on neuropathology (Braak and Braak, 1991), neuroimag-ing (Buckner et al., 2005; Greicius et al., 2004), and evidencefrom transgenic animal models (Palop et al., 2007), some authorshave suggested that neurodegeneration may relate to neuralnetwork dysfunction (Buckner et al., 2005; Palop et al., 2006).In human spongiform encephalopathies, which cause rapidlyprogressive dementia through conformational changes in mis-folded prion protein, direct evidence supports disease propaga-tion along transsynaptic connections (Scott et al., 1992). For allother neurodegenerative diseases, limited human experimentaldata support the ‘‘network degeneration hypothesis.’’ If demon-strated as a class-wide phenomenon, however, this frameworkwould have major mechanistic significance, predicting that thespatial patterning of disease relates to some structural, meta-bolic, or physiological aspect of neural network biology. Confirm-ing the network degeneration hypothesis would also have clinicalimpact, stimulating development of new network-based diag-nostic and disease-monitoring assays.To test the network degeneration hypothesis in living humans,
we studied patients with five distinct neurodegenerativesyndromes and two healthy control groups (Figure 1). Only earlyage-of-onset dementia syndromeswere included, enabling us tobetter match patient groups for age and other demographic vari-ables (Table S1 available online). Patients were diagnosed withAlzheimer’s disease (AD, n = 24), behavioral variant frontotempo-ral dementia (bvFTD, n = 24), semantic dementia (SD, n = 24),progressive nonfluent aphasia (PNFA, n = 13), or corticobasalsyndrome (CBS, n = 17), based on standard research criteria.Diagnosesweremade on clinical grounds; therefore, neuroimag-ing and pathological data did not influence group membership.To weight our analyses toward the distinctive, early-stage neuro-anatomic features of each syndrome, we excluded patients with
42 Neuron 62, 42–52, April 16, 2009 ª2009 Elsevier Inc.
NEURON 3746
moderate or severe dementia (defined by Clinical DementiaRating [CDR] scale scores >1). After defining the patient groups,we conducted a series of quantitative structural and functionalimaging analyses in patients and controls to test the hypothesisthat syndrome-associated regional degeneration patterns reflectdistinct human neural network architectures.
RESULTS
Each Neurodegenerative Syndrome Features a DistinctRegional Vulnerability PatternFirst, we established each syndrome’s functional and anatomicaldeficit profiles compared to 65 healthy, age-matched controls(Table S1 and Figure 2A). A standard neuropsychological batterywas administered, and magnetic resonance (MR) voxel-basedmorphometry (VBM) facilitatedwhole-brain statistical parametricgray matter comparisons between each patient group andcontrols. The findings replicated previous work, performed byour group and others, on the five syndromes (Boccardi et al.,2005; Gorno-Tempini et al., 2004; Josephs et al., 2006, 2008;Seeley et al., 2005, 2008a). In summary, AD was associatedwith episodic memory dysfunction and prominent medialtemporal, posterior cingulate/precuneus, and lateral temporo-parietal atrophy. bvFTD, SD, and PNFA, which together make
up the clinical frontotemporal dementia (FTD) spectrum, eachshowed a unique deficit signature. bvFTD featured prominentbehavioral deficits with anterior cingulate, frontoinsular, striatal,and frontopolar degeneration. SD resulted in loss of word andobject meaning accompanied by left-predominant temporalpole (Tpole) and subgenual cingulate involvement. PNFA pre-sented with nonfluent, effortful, and agrammatic speech andwas associatedwith left frontal operculum, dorsal anterior insula,and precentral gyrus atrophy. Patients with CBS had prominent,asymmetric sensorimotor impairment, with akinesia, rigidity,apraxia, and cortical sensory loss or other cortical cognitive defi-cits; accordingly, CBS gray matter loss was confined to dorsalfrontoparietal sensorimotor association areas, primary motorand sensory cortices, and dorsal insula. The early-stage,syndrome-specific anatomical patterns provided seed regionsfor our subsequent network analyses in healthy controls (HCs).
Syndromic Atrophy Foci Anchor Large-Scale FunctionalNetworks in the Healthy BrainThe network degeneration hypothesis predicts that syndromicatrophy patterns should recapitulate healthy functional networkarchitectures. To evaluate this possibility, we identified themost atrophied cortical region in each patient group (Figure 2A,Table S2) and used these regions of interest (ROIs) to seed ICN
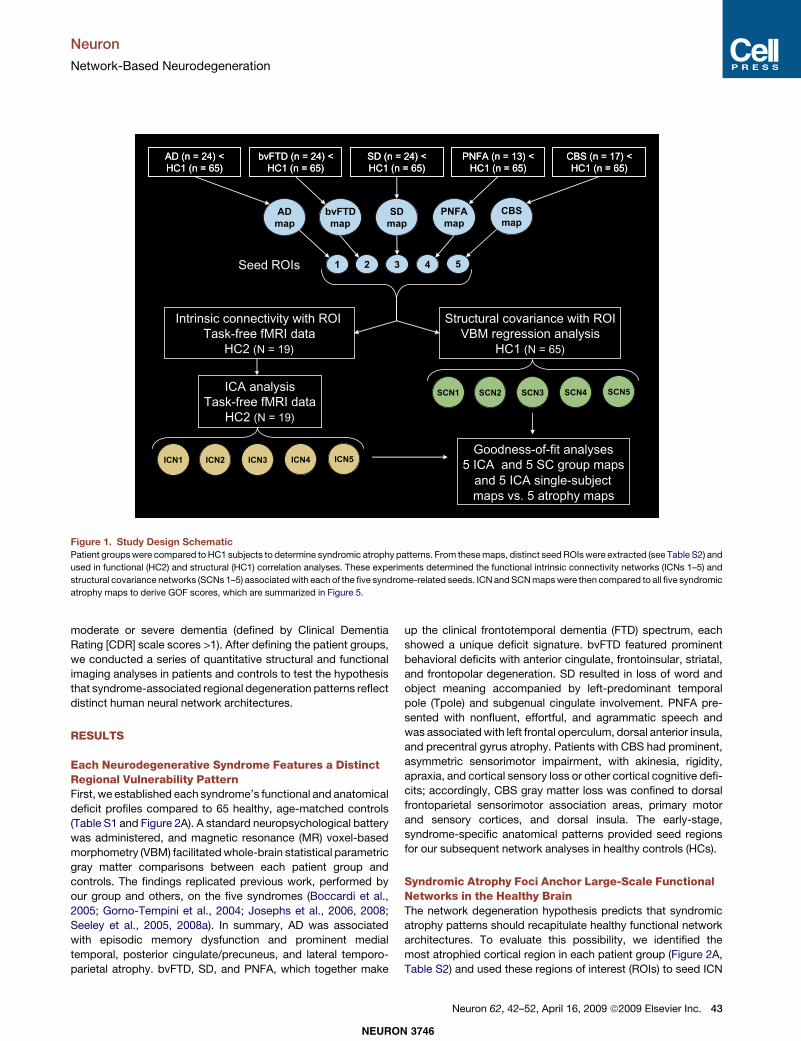
Figure 1. Study Design SchematicPatient groupswere compared toHC1 subjects to determine syndromic atrophy patterns. From thesemaps, distinct seedROIswere extracted (see Table S2) and
used in functional (HC2) and structural (HC1) correlation analyses. These experiments determined the functional intrinsic connectivity networks (ICNs 1–5) and
structural covariance networks (SCNs 1–5) associatedwith each of the five syndrome-related seeds. ICNandSCNmapswere then compared to all five syndromic
atrophy maps to derive GOF scores, which are summarized in Figure 5.
NEURON 3746
Neuron
Network-Based Neurodegeneration
Neuron 62, 42–52, April 16, 2009 ª2009 Elsevier Inc. 43
mapping experiments in a separategroupof 19HCs (HC2). Thesecontrols, also age-matched to the patient groups, underwent6 min of task-free fMRI scanning. From these data, we extractedthe mean BOLD signal time series from the five syndrome-asso-ciated ROIs and entered these time series into five separatewhole-brain intrinsic functional connectivity analyses. The result-ing ROI-based network maps then served as spatial templatesfor independent component analysis (ICA), following previousapproaches (Greicius et al., 2004; Seeley et al., 2007). Next, weidentified a best-fit ICA-generated component for each networktemplate for each subject and combined these componentsto produce group-level network maps for each seed ROI. Asanticipated, the five disease-vulnerable ROIs anchored fivedistinct ICNs in HCs (Figure 2B). Remarkably, as predicted bythe network degeneration hypothesis, these distributed networkmaps, thoughgenerated from isolatedcortical seedROIs, closelymirrored the atrophy patterns seen in the five neurodegenerativesyndromes (Figures 2 and 3).
Normal Structural Covariance Patterns Mirror IntrinsicFunctional ConnectivityPhysiological studies have shown that synchronous neuronalfiring promotes network-based synaptogenesis (Bi and Poo,1999; Katz and Shatz, 1996). Therefore, we further questioned
whether coherent spontaneous ICN activity might impactnormal cortical structure. Specifically, we hypothesized thatfunctionally correlated brain regions would show correlatedgray matter volumes across healthy subjects. One previousVBM study, though not designed to assess the relationshipbetween functional connectivity and structure, selected land-mark-based cortical and limbic ROIs and found group-levelgray matter density correlations between these ROIs andhomologous contralateral and functionally related ipsilateralregions (Mechelli et al., 2005). We adapted these methods tostudy structural covariance patterns arising from disease-vulnerable foci, applying the same seed ROIs (Figure 2A, TableS2) used to probe our intrinsic functional connectivity data.Local ROI mean gray matter intensities extracted from the fiveseeds provided covariates for five separate whole-brain statis-tical parametric regression analyses in which age and genderwere entered as nuisance covariates. These studies revealedstriking convergence between healthy intrinsic functionalconnectivity, derived within subjects (Figures 2B, 3B, 4A, and4B), and structural covariance, assessed across subjects(Figures 2C, 3C, 4C, and 4D). As a result, our three data streamsconverged (Figures 5 and 6). That is, normal ICN and structuralcovariance patterns mirrored each other and reflected, withhigh fidelity, those regions that codegenerate in distinct human
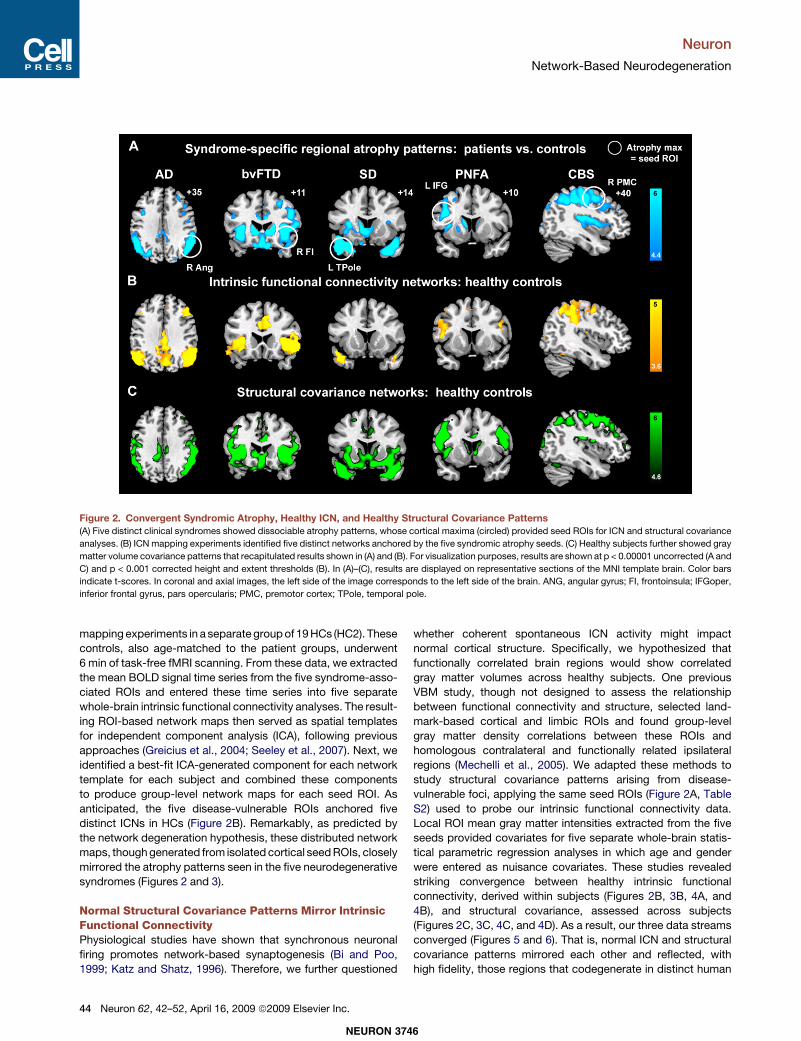
Figure 2. Convergent Syndromic Atrophy, Healthy ICN, and Healthy Structural Covariance Patterns(A) Five distinct clinical syndromes showed dissociable atrophy patterns, whose cortical maxima (circled) provided seed ROIs for ICN and structural covariance
analyses. (B) ICN mapping experiments identified five distinct networks anchored by the five syndromic atrophy seeds. (C) Healthy subjects further showed gray
matter volume covariance patterns that recapitulated results shown in (A) and (B). For visualization purposes, results are shown at p < 0.00001 uncorrected (A and
C) and p < 0.001 corrected height and extent thresholds (B). In (A)–(C), results are displayed on representative sections of the MNI template brain. Color bars
indicate t-scores. In coronal and axial images, the left side of the image corresponds to the left side of the brain. ANG, angular gyrus; FI, frontoinsula; IFGoper,
inferior frontal gyrus, pars opercularis; PMC, premotor cortex; TPole, temporal pole.
NEURON 3746
Neuron
Network-Based Neurodegeneration
44 Neuron 62, 42–52, April 16, 2009 ª2009 Elsevier Inc.
neurodegenerative syndromes. bvFTD was chosen to highlightconvergence of the three maps in greater detail (Figure 3).ROI functional time series from a representative control subject(Figures 4A and 4B) and related group-level structural correla-tion plots (Figures 4C and 4D) further illustrate the brain’sshared functional-structural covariance architecture.
Disease-Vulnerable Networks Are Dissociable: SpatialSimilarity and Overlap AnalysesTo quantify the spatial similarity between each atrophy patternand the healthy functional-structural covariance networks, weused the 10 control group correlation maps (5 functional, 5structural) to generate goodness-of-fit (GOF) scores to eachsyndromic atrophy map. Fit was defined as the differencebetween the mean t-score of all voxels inside versus outsideeach binary spatial atrophy template. These analyses indicateda strong fit between the intrinsic functional and structuralcovariance maps and their source atrophy patterns (Figures5A and 5C). Although only a small, single ROI from each source
map (Figure 2A) was used to seed the ICN and structuralcovariance analyses, the resulting healthy networks fit betterwith their source atrophy maps than with the other four diseasepatterns.To confirm our group-level spatial similarity findings, we used
each HC2 subject’s best-fit ICA components (one for eachseed ROI) to generate individual GOF scores to the source andother atrophy maps (Figure 5B). Paired-sample t tests (n = 19,two-tailed) showed significant source versus other GOF differ-ences for all five ICNs (right angular gyrus [ANG]: t = 6.9, p =0.000002; right frontoinsula [FI]: t = 2.4, p = 0.03; left Tpole:t = 7.4, p = 0.0000007; left inferior frontal gyrus [IFG]: t = 4.7,p = 0.0002; right premotor cortex [PMC]: t = 8.6, p =0.00000009;mean of all seeds: t = 8.8, p = 0.00000006). The leaststrong (though still significant) source versus other GOF statis-tical difference involved the right FI ICN.Ashighlighted inFigure3,this ICN and its structural covariance counterpart map showedrobust qualitative similarity to the bvFTD atrophy map at thegroup level. We derived further support for the close
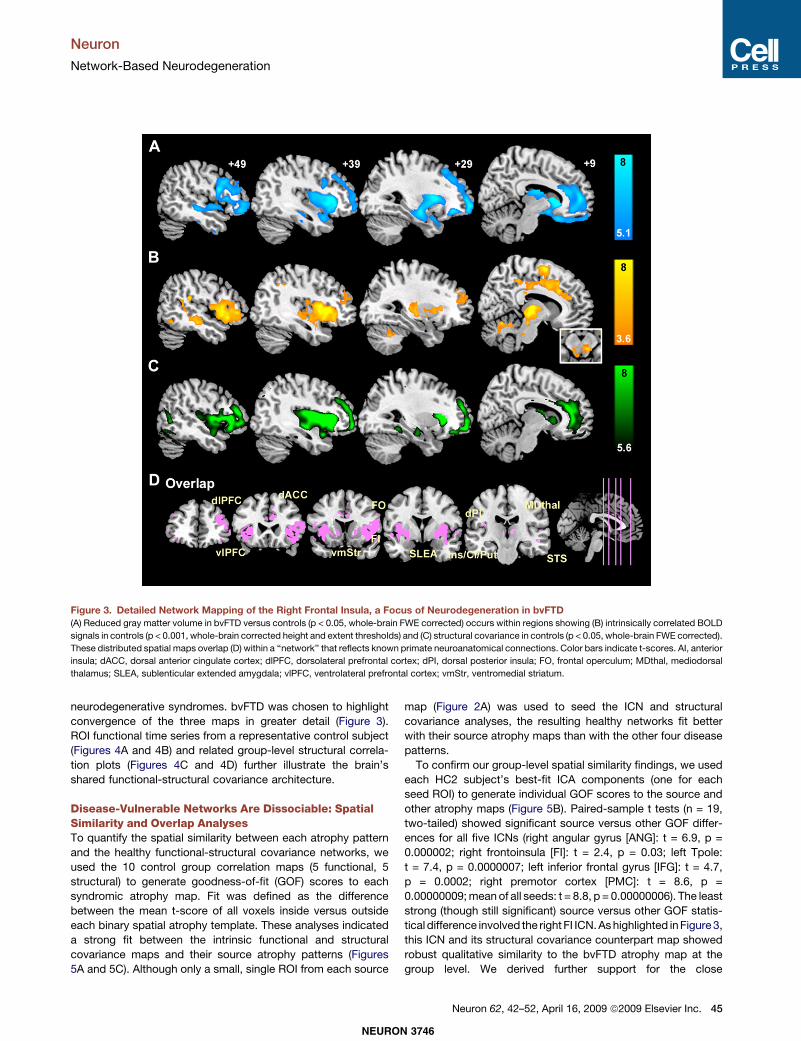
Figure 3. Detailed Network Mapping of the Right Frontal Insula, a Focus of Neurodegeneration in bvFTD(A) Reduced gray matter volume in bvFTD versus controls (p < 0.05, whole-brain FWE corrected) occurs within regions showing (B) intrinsically correlated BOLD
signals in controls (p < 0.001, whole-brain corrected height and extent thresholds) and (C) structural covariance in controls (p < 0.05, whole-brain FWE corrected).
These distributed spatial maps overlap (D) within a ‘‘network’’ that reflects known primate neuroanatomical connections. Color bars indicate t-scores. AI, anterior
insula; dACC, dorsal anterior cingulate cortex; dlPFC, dorsolateral prefrontal cortex; dPI, dorsal posterior insula; FO, frontal operculum; MDthal, mediodorsal
thalamus; SLEA, sublenticular extended amygdala; vlPFC, ventrolateral prefrontal cortex; vmStr, ventromedial striatum.
NEURON 3746
Neuron
Network-Based Neurodegeneration
Neuron 62, 42–52, April 16, 2009 ª2009 Elsevier Inc. 45
atrophy-ICN relationship by comparing each HC2 subject’s firstand second best-fit ICA components, for each ICN, to the rele-vant source atrophy maps (see Experimental Procedures). Thisanalysis confirmed a sharp GOF drop-off from the first to secondbest-fitting ICAcomponents (paired-sample t tests: rightANG, t =7.3, p = 0.0000009; right FI, t = 5.3, p = 0.00005; left Tpole, t = 8.6,p = 0.00000008; left IFG, t = 4.7, p = 0.0002; right PMC, t = 5.1; p =0.00008). By definition, the remaining (unselected) components(third best-fit andbeyond) for each subject fit the relevant atrophy
patterns even lesswell. Therefore, our ICAandcomponent selec-tion procedures effectively identified the five normal ICNs thatcorrespond best to the five syndromic atrophy patterns.Finally, to visualize the spatial relationships among the five
disease-vulnerable networks, we determined the voxel-wise(whole-brain) overlap of each three-map set (atrophy, intrinsicfunctional connectivity, and structural covariance associatedwith each ROI) and plotted the five resulting overlap maps on ashared template. Becausewe hypothesized that the five systems
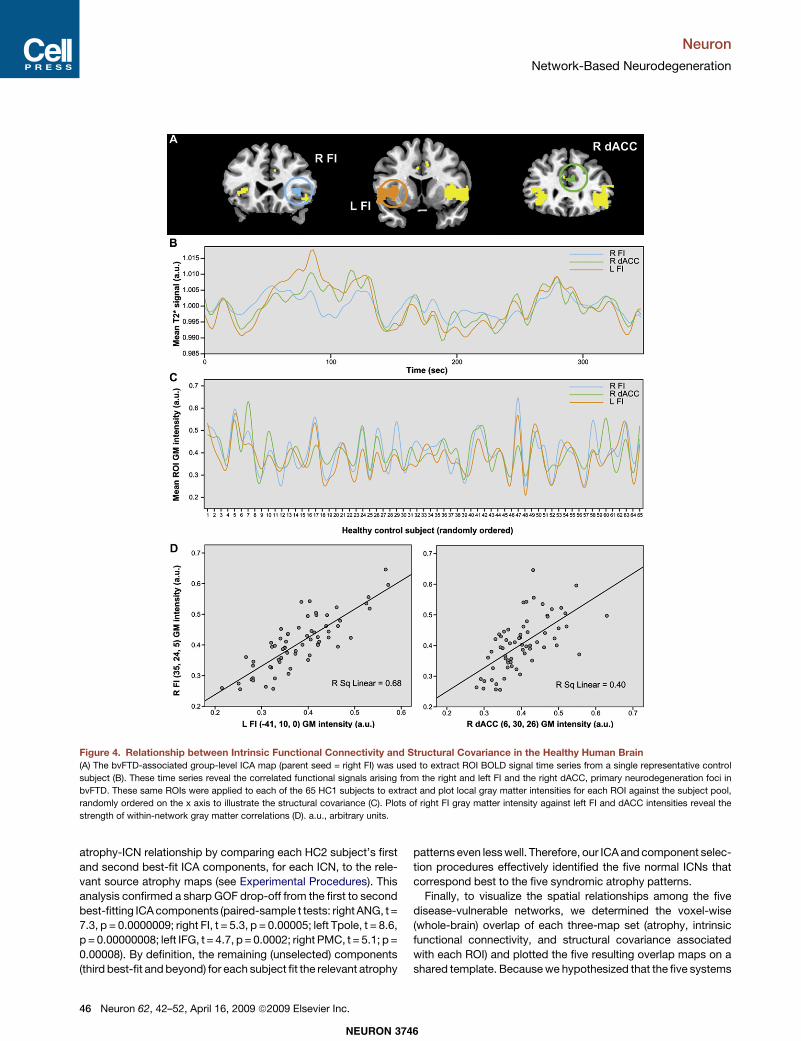
Figure 4. Relationship between Intrinsic Functional Connectivity and Structural Covariance in the Healthy Human Brain(A) The bvFTD-associated group-level ICA map (parent seed = right FI) was used to extract ROI BOLD signal time series from a single representative control
subject (B). These time series reveal the correlated functional signals arising from the right and left FI and the right dACC, primary neurodegeneration foci in
bvFTD. These same ROIs were applied to each of the 65 HC1 subjects to extract and plot local gray matter intensities for each ROI against the subject pool,
randomly ordered on the x axis to illustrate the structural covariance (C). Plots of right FI gray matter intensity against left FI and dACC intensities reveal the
strength of within-network gray matter correlations (D). a.u., arbitrary units.
NEURON 3746
Neuron
Network-Based Neurodegeneration
46 Neuron 62, 42–52, April 16, 2009 ª2009 Elsevier Inc.
would prove dissociable, we lowered the statistical threshold foreach map used to create the overlaps (see Experimental Proce-dures), in effect reducing our power to demonstrate spatial diver-gence among the five networks. Nonetheless, the five overlapmaps showed minimal overlap with each other (Figure 6), illus-trating the dissociable nature of these targeted brain systems.
DISCUSSION
Our results show that functional and structural network mappingapproaches yield robust, convergent, anatomically predictablenetworks, and that specific neurodegenerative diseases targetthese patterned brain systems. First, we characterized five early-stage dementia syndromes to isolate five circumscribed atrophypatterns, replicating and extending previous findings (Boccardiet al., 2005; Gorno-Tempini et al., 2004; Josephs et al., 2006,2008; Seeley et al., 2008a). We then demonstrated that thesespatial disease patterns reflect the healthy brain’s intrinsicfunctional network architecture. Although we and others havenoted the concordance between AD-related atrophy and healthyintrinsic functional connectivity (Buckner et al., 2005; Greiciuset al., 2004), in this study we confirmed the network degenerationhypothesis across five distinct dementia syndromes. Becausethese syndromes describe the clinical rather than moleculardisease features, and because each syndrome can result fromdiverse underlying molecular pathologies, our data suggest thatnumerous disease proteins, including b-amyloid, tau, alpha-synu-clein, and TDP-43, have the capacity to misfold and aggregatewith specific brain networks.The ICNs linked here to disease represent canonical findings
from the ICN literature. Our AD-affected ICN (right ANG seed)corresponds to the ‘‘default mode network’’ that participates in
episodic memory (Buckner et al., 2005) and became known forits task-related deactivations across fMRI studies (Fox et al.,2005; Fransson, 2005; Greicius et al., 2003). The ICN targetedin bvFTD (right FI seed) was first identified with ICA (Beckmannet al., 2005) and later linked to emotional salience processingcapacities (Seeley et al., 2007) lost in early bvFTD (Seeley,2008). SD affects an ICN (left Tpole seed) that has escapedprevious detection in humans but corresponds to a Tpole-subge-nual cingulate-ventral striatum-amygdala network, well-estab-lished in nonhuman primates (Mesulam and Mufson, 1982), thatshows progressive atrophy in early-stage SD (Brambati et al.,2007). The PNFA-targeted ICN (left IFG seed) includes the frontaloperculum, primary and supplementary motor cortices, and infe-rior parietal lobule bilaterally, linking the language and motorsystems that enable speech fluency. This ICN, often dividedinto left and right hemispheric systems, has been noted in severalprevious studies (Beckmann et al., 2005; Damoiseaux et al.,2006; De Luca et al., 2006; van den Heuvel et al., 2008). InPNFA, asymmetric degeneration of this system may reflect itsaccentuated functional and connectional asymmetry in healthyhumans (Stark et al., 2008). InCBS, prominent skeletal andocularmotor abnormalities result from disease within a dorsal sensori-motor association network (right PMC seed) detailed in severalICN studies (De Luca et al., 2006; Fox et al., 2005; Vincentet al., 2008) and elegantly mapped in themacaque using conver-gent ICN, oculomotor task-based fMRI, and axonal tracermethods (Vincent et al., 2007). ICNs frequently reported (Beck-mann et al., 2005; Damoiseaux et al., 2006; De Luca et al.,2006; van den Heuvel et al., 2008) but not studied here includeprimary and secondary visual networks that may providesubstrate for the visual-spatial variant of AD known as the poste-rior cortical atrophy syndrome (Hof et al., 1997), a primary
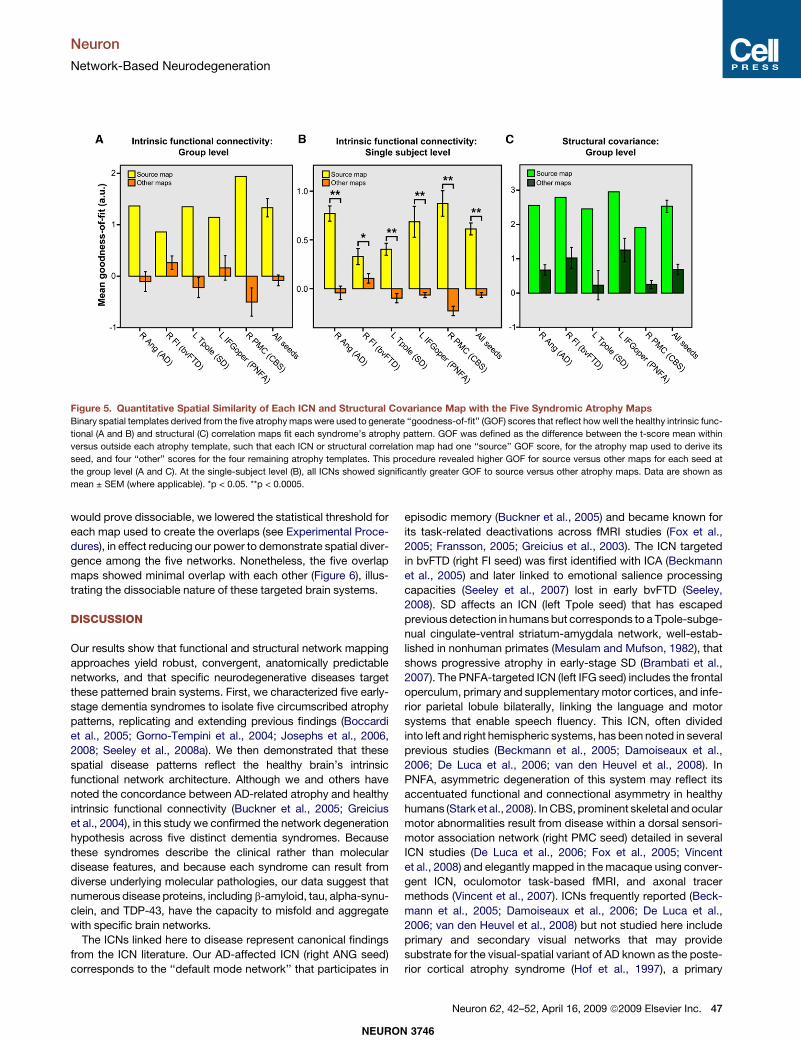
Figure 5. Quantitative Spatial Similarity of Each ICN and Structural Covariance Map with the Five Syndromic Atrophy MapsBinary spatial templates derived from the five atrophy maps were used to generate ‘‘goodness-of-fit’’ (GOF) scores that reflect howwell the healthy intrinsic func-
tional (A and B) and structural (C) correlation maps fit each syndrome’s atrophy pattern. GOF was defined as the difference between the t-score mean within
versus outside each atrophy template, such that each ICN or structural correlation map had one ‘‘source’’ GOF score, for the atrophy map used to derive its
seed, and four ‘‘other’’ scores for the four remaining atrophy templates. This procedure revealed higher GOF for source versus other maps for each seed at
the group level (A and C). At the single-subject level (B), all ICNs showed significantly greater GOF to source versus other atrophy maps. Data are shown as
mean ± SEM (where applicable). *p < 0.05. **p < 0.0005.
NEURON 3746
Neuron
Network-Based Neurodegeneration
Neuron 62, 42–52, April 16, 2009 ª2009 Elsevier Inc. 47
sensorimotor ICN thatmay relate to amyotrophic lateral sclerosis(Kassubek et al., 2005), and a lateral frontoparietal executive-control network (Seeley et al., 2007; Vincent et al., 2008) thatfalters in most neurodegenerative diseases as degenerationspreads beyond the sites of initial injury into widely intercon-nected supervisory neocortical systems.
Confirmation of the network degeneration hypothesis raisesimportant questions about how specific syndromes will impactICN strength. Previous studies suggest that AD attenuatesconnectivity within the right ANG (default mode) network (Grei-cius et al., 2004; Supekar et al., 2008), even during early clinicalstages (Sorg et al., 2007). Task-based episodic memory fMRIstudies, in contrast, suggest heightened hippocampal activationduring prodromal AD (Dickerson et al., 2004), and an AD intrinsicconnectivity study revealed focal frontal connectivity enhance-ments (Supekar et al., 2008). For the non-AD dementiasyndromes, no published ICN data are available. Therefore, itremains uncertain whether disease causes network connectivityimpairment, upregulation, or effects that vary by disease stage.This issue requires clarification before network connectivityapproaches can be used to diagnose dementia or track itsprogression. Those patients who scale up connectivity withinearly-affected networks or unaffected compensatory systemsmay prove more resilient to functional decline. Even more intri-guingly, patients with focal connectivity enhancements may
develop new or intensified functional capabilities (Seeley et al.,2008b).Why does neurodegeneration spread throughout specific
neural networks? The present study was designed to raise ratherthan answer this question, but several mechanisms may apply.First, selective neuronal vulnerability within key synaptic conver-gence zones may disconnect or weaken functional circuits(Hyman et al., 1984), inducing deleterious network-widecompensatory strategies. This notion fits with AD transgenicmouse models, in which aberrant medial temporal circuit excit-ability disrupts homeostasis and function, leading to progressivedegeneration within the circuit (Palop et al., 2006, 2007). Second,retrograde axonal transport deficits may cut off growth factorsupply to long-range projection neurons, begetting axonaldegeneration, synapse loss, and postsynaptic dendrite retrac-tion (Salehi et al., 2006). Third, as seen in experimental priondisease, misfolded disease proteins may themselves propagatealong neural processes, marching throughout local and thenlong-range circuits via transsynaptic spread (Scott et al., 1992).This account of our data would require that nonprion misfoldeddisease proteins could trigger misfolding of adjacent same-species proteins, which, in turn, could cascade down processesand between interconnected neurons. Althoughmany aspects ofthis candidate mechanism remain unexplored, in a recent studypathological tau conformers were shown to induce native
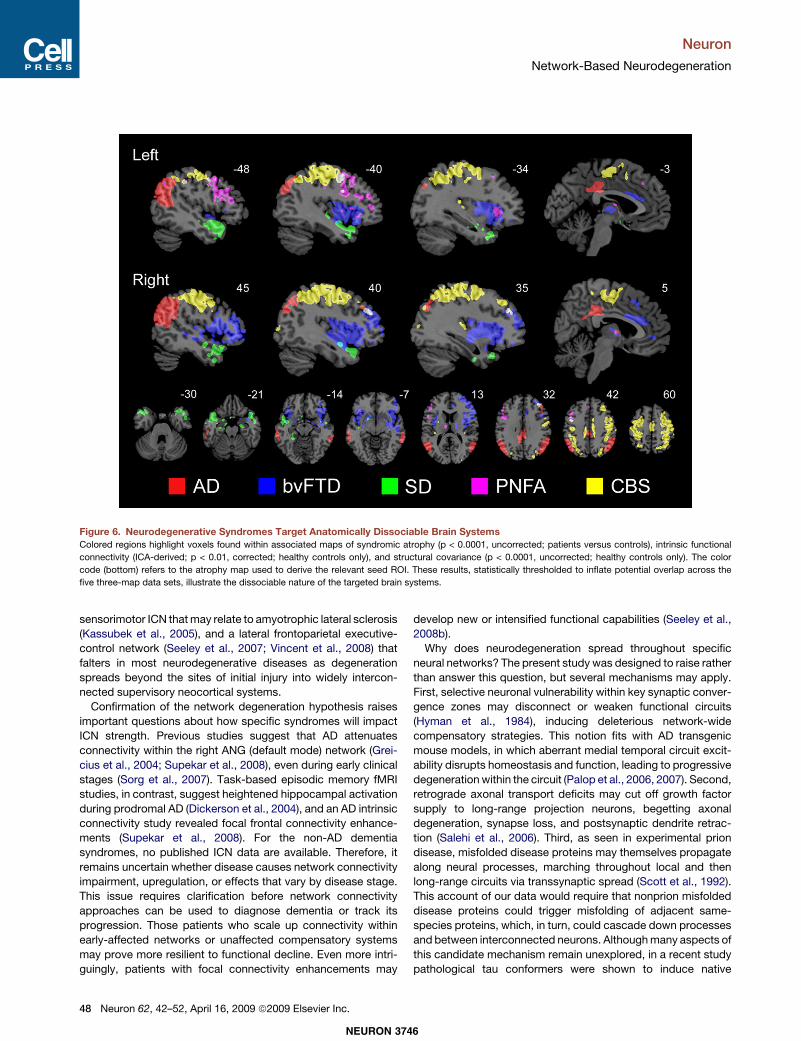
Figure 6. Neurodegenerative Syndromes Target Anatomically Dissociable Brain SystemsColored regions highlight voxels found within associated maps of syndromic atrophy (p < 0.0001, uncorrected; patients versus controls), intrinsic functional
connectivity (ICA-derived; p < 0.01, corrected; healthy controls only), and structural covariance (p < 0.0001, uncorrected; healthy controls only). The color
code (bottom) refers to the atrophy map used to derive the relevant seed ROI. These results, statistically thresholded to inflate potential overlap across the
five three-map data sets, illustrate the dissociable nature of the targeted brain systems.
NEURON 3746
Neuron
Network-Based Neurodegeneration
48 Neuron 62, 42–52, April 16, 2009 ª2009 Elsevier Inc.
(unfolded) tau to adopt a pathological conformation, and thismis-folding seeded further conformational changes in adjacent taumolecules (Frost et al., 2008). Finally, each syndrome we studiedfeatures sporadic and autosomal dominantly inherited forms. ForAD, known susceptibility genes, such as the Apo 34 allele,increase risk or hasten disease onset. Lifelong possession ofa disease-causingmutation (Geschwind et al., 2001) or risk factorallele (Reiman et al., 2004) may destabilize network connectivityand function in young adulthood or even childhood (Shaw et al.,2007), setting the stage for mid- to late-life neurodegeneration.These hypothetical network degeneration mechanisms neednot be considered mutually exclusive.Several recent studies suggest that, in health, functionally
correlated brain regions feature defined axonal connections(Greicius et al., 2008; Seeley et al., 2007; Sporns et al., 2005).Our findings demonstrate a less intuitive linkage, revealing thathealthy ICNs feature correlated gray matter volume. This findingbuilds on existing notions of ‘‘small worldness’’ in human corticalgray matter structure (He et al., 2007) by demonstrating a direct,network-based function-structure relationship. Why gray matterfunction and volume correlate, however, remains unclear. Duringdevelopment, network covariance may emerge (Fair et al., 2008)and remodel itself (Kelly et al., 2008; Lerch et al., 2006) inresponse to core inherited projection map formation scripts(Ruthazer and Cline, 2004) that interact with the environment todrive individual differences in cognitive, emotional, and motorfunction (Seeley et al., 2007). Use-related trophic effects, inturn, may continue to reshape the cortical mantle throughoutadulthood (Maguire et al., 2000), linking synaptic strength,synaptic density, and neuropil mass within functionally coactiveregions.In summary, neurodegenerative diseases are not diffuse,
random, or confluent, but instead target specific large-scaledistributed networks. In the healthy brain, these networks featureconvergent intrinsic functional and structural covariance. Tobuildmore comprehensive diseasepathogenesismodels, neuro-degeneration researchers should pursue the interface betweendisease protein aggregation and selective, network-drivenneuronal vulnerability.
EXPERIMENTAL PROCEDURES
SubjectsAll subjects (or their surrogates) provided informed consent and the proce-
dures were approved by the institutional review boards at UCSF and Stanford
University.
Patients: Structural Imaging
Subjects for each patient group were selected from the UCSF Memory and
Aging Center (MAC) database. All had undergone a comprehensive neurolog-
ical, neuropsychological, and functional assessment, and final diagnoseswere
rendered at a multidisciplinary consensus conference, as detailed previously
(Liu et al., 2004). To be considered for inclusion, patients were required to
meet published research criteria, which do not include neuroimaging features,
for probable AD (McKhann et al., 1984), bvFTD (Neary et al., 1998), SD (Neary
et al., 1998), PNFA (Neary et al., 1998), or CBS (criteria developed at the MAC,
as previously described; Boxer et al., 2006) within 90 days of MRI scanning. In
addition, the following selection criteria were required: (1) CDR total score% 1,
(2) CDR and Mini Mental State Examination (MMSE) completed within 90 days
of scanning, (3) absence of comorbid motor neuron disease, and (4) absence
of significant vascular or other structural lesions on MRI. We chose to study
only these five syndromes because they could be matched for age while
preserving adequate sample size. Although potentially relevant to our study
aims, patients with the posterior cortical atrophy syndrome, progressive
supranuclear palsy, dementia with Lewy bodies, Huntington’s disease, amyo-
trophic lateral sclerosis, and multiple systems atrophy were excluded to
constrain the scope of the study and promote matching or because too few
subjects with these diagnoses had available research MRI scans. The three
patient groups with the most subjects meeting inclusion criteria were bvFTD
(n = 24), AD (n = 49), and SD (n = 32). Therefore, 24 AD and 24 SD subjects
were chosen from their larger pools to match the bvFTD group, as closely as
possible, for age, gender, and education (Table S1). PNFA (n = 13) and CBS
(n = 17) groups were smaller than the others but still comparable to published
samples used to illustrate the syndromic regional atrophy patterns (Boxer
et al., 2006; Gorno-Tempini et al., 2004; Josephs et al., 2006). These
syndromes are known to feature uneven gender distributions (Johnson et al.,
2005); therefore, in part because of our strict inclusion criteria (e.g., CDR% 1),
all groups could not be matched for gender. Accordingly, gender was added
as a nuisance covariate to the neuroimaging analyses.
Importantly, we made a sharp distinction between clinical syndromes and
histopathological entities. Therefore, although the terms Alzheimer’s disease
and corticobasal degeneration are used by pathologists to describe specific
histopathologies, in this context we applied the terms Alzheimer’s disease
and corticobasal syndrome only to suggest clinical, not pathological, features.
This approach fits with our scientific objective, which was to determine the
relationship between syndromic atrophy patterns and healthy human brain
networks. Our overarching hypothesis, indeed, was that large-scale cortical
networks provide anatomical scaffoldings that are dismantled to produce clin-
ically recognizable lesion-deficit constellations (syndromes). Applying network
imaging to predict neuropathology was not a goal of this study; indeed, most
degenerative syndromes can be caused by several underlying pathologies,
and all neuropathological entities can give rise to diverse clinical syndromes.
UCSF Controls: Structural Imaging
HCs were recruited from the San Francisco community for the structural
imaging and neuropsychological analyses. These controls, referred to as
HC1, underwent a comprehensive neuropsychological assessment and
a neurological exam within 180 days of scanning. HC1 subjects were required
to have a CDR total score of 0, an MMSE of 28 or higher, no significant history
of neurological disease or structural pathology on MRI, and a consensus diag-
nosis of cognitively normal; 101 subjects met these criteria. This group was
reduced to 65 subjects to match, as closely as possible, the overall patient
group for age, gender, and education. No UCSF control subject took neuro-
psychiatric medications except one, who took buproprion 100 mg daily for
a remote history of depression.
Stanford Controls: Functional Imaging
HC subjects for the functional imaging analyses, referred to as HC2, were
recruited from the UCSF MAC (as described above) and from the Stanford
Medical Center community. The Stanford subjects denied any significant
neurologic or psychiatric history and were not taking psychoactive medica-
tions. All had MMSE scores of 27/30 or higher.
Image AcquisitionStructural Imaging
Structural MRI scans were obtained at UCSF on all patients and HC1 subjects.
Images were acquired on a 1.5 Tesla Magneton VISION system (Siemens Inc.,
Iselin, NJ) using a standard quadrature head coil. A volumetric magnetization
prepared rapid gradient echo (MP-RAGE) MRI (TR/TE/inversion time = 10/4/
300 ms) sequence was used to obtain a T1-weighted image of the entire brain
(15! flip angle, coronal orientation perpendicular to the double spin echo
sequence, 1.0 3 1.0 mm2 in-plane resolution of 1.5 mm slab thickness).
Functional Imaging
fMRI scanning was performed at Stanford University on all HC2 subjects.
Images were acquired on a 3 Tesla GE Signa Excite scanner (GE Medical
Systems, Milwaukee, WI) using a standard GE whole head coil. Twenty-eight
axial slices (4mm thick, 1mmskip) parallel to the plane connecting the anterior
and posterior commissures and covering the whole brain were imaged using a
T2* weighted gradient echo spiral pulse sequence (repetition time, 2000 ms;
echo time, 30 ms; flip angle, 80! and 1 interleave) (Glover and Lai, 1998). The
NEURON 3746
Neuron
Network-Based Neurodegeneration
Neuron 62, 42–52, April 16, 2009 ª2009 Elsevier Inc. 49
field of view was 200 x 200 mm2, and the matrix size was 64 x 64, yielding an
in-plane spatial resolution of 3.125 mm. To reduce blurring and signal loss
arising from field inhomogeneities, an automated high-order shimmingmethod
based on spiral acquisitions was used before acquiring functional MRI scans
(D.H. Kim et al., 2000, Proc. 8th Ann. Mtg. of ISMRM, abstract). All subjects
underwent two 6min task-free fMRI scans after being instructed only to remain
awake with their eyes closed. For 2 of 17 subjects, one of the two runs was
excluded due to technical factors.
Image Preprocessing and AnalysisStructural Imaging
VBM is a flexible whole-brain statistical analysis technique that can be used to
assess between-group differences in local brain tissue content or correlations
between tissue content and other measures of interest. Before analysis,
T1-weighted MR images underwent several preprocessing steps, following
an optimized VBM protocol (Good et al., 2001). First, a study-specific template
and priors were created to minimize spatial normalization and segmentation
errors. This approach helps to identify group differences in patients with neuro-
degenerative disease (Senjem et al., 2005). All subjects were used to create the
template, and custom images for each subject were generated by applying
affine and deformation parameters obtained from normalizing the gray matter
images, segmented in native space, to the custom template. Voxel values
were modulated by multiplying them by the jacobian determinants derived
from the spatial normalization step, and images were smoothed with a 12 mm
isotropic Gaussian kernel.
To identify gray matter regions significantly atrophied in each syndrome
versus HC1, each group was entered as a condition into a single model, and
linear contrasts were applied to derive five syndromic atrophy maps. From
thesemaps, we isolated themost significantly atrophied cortical region, desig-
nated as the voxel with the peak t-score (Table S2). We elected to use only
cortical seed ROIs because subcortical/limbic nuclei, such as the caudate or
amygdala, feature a dense admixture of subnuclear projection fields and
outputs with multinetwork connectivity. Therefore, after 4 mm fMRI data
smoothing, subcortical/limbic connectivity maps become less straightforward
to interpret than those derived using cortical seeds, and we sought to treat all
five network analyses similarly in this regard. In addition, VBM can overesti-
mate periventricular volume loss due to atrophy-related spatial registration
errors, even with the optimized methods employed here (Senjem et al.,
2005). This concern further justifies exclusion of subcortical seeds for func-
tional connectivity and structural covariance analyses. For the SD map, we
chose the second most atrophied cortical region because the peak region
fell within an area of susceptibility artifact on our T2* images (Ojemann et al.,
1997). Collectively, the syndromic peak voxels were used to create five
4 mm radius spherical ROIs using MarsbaR v0.41, an ROI toolbox for SPM
(M. Brett et al., 2002, 8th Int. Conf. on Func.Map. of theHumanBrain, abstract).
These five cortical seeds were used in all subsequent structural and functional
correlation analyses.
Structural correlation analyses were applied only to the 65 HC1 subjects.
Adapting previous approaches by Mechelli et al. (2005), we extracted each
subject’s mean gray matter intensity from the five seed ROIs. These values
were then entered into separate covariate-only models to identify each voxel,
across the whole brain, whose gray matter intensity was significantly corre-
lated with that of each seed across subjects.
For all VBM analyses, age and gender were entered as nuisance covariates
and total intracranial volume served as a global correction factor. Preprocess-
ing and analysis was implemented in the SPM5 software package (www.fil.ion.
ucl.ac.uk/spm). For group contrast and correlation analyses, voxels were
considered significant if they met statistical threshold of p < 0.05, corrected
for family wise error (FWE).
Functional Imaging
Functional images were realigned, slice-time corrected, normalized, and
smoothed with a 4 mm Gaussian kernel. Normalization was carried out by
calculating the warping parameters between themean T2* (spiral in/out) image
and the MNI EPI template and applying them to all images in the sequence.
Subsequently, the images were resampled at a voxel size of 2 mm3.
ROIs derived from the five syndromic atrophy patterns were then used to
seed five separate functional connectivity analyses, following previous
methods (Seeley et al., 2007). That is, after removing the first eight n frames
to allow stabilization of themagnetic field, the average time series from the first
task-free scan was extracted from each ROI by averaging the time series of all
voxels within the ROI. Before averaging individual voxel data, scaling and
filtering steps were performed across all brain voxels as follows. To minimize
the effect of global drift, voxel intensities were scaled by dividing the value
of each time point by the mean value of the whole-brain image at that time
point. Next, the scaled waveform of each brain voxel was filtered using a band-
pass filter (0.0083/s < f < 0.15/s) to reduce the effect of low-frequency drift and
high-frequency noise (Lowe et al., 1998). The scaling and filtering steps were
applied equivalently to all voxels (including those in the ROIs). The resulting
time series, representing the average intensity (after scaling and filtering) of
all voxels in the ROI, was then used as a covariate of interest in a whole-brain,
linear regression, statistical parametric analysis. As a means of controlling for
nonneural noise in the ROI time series, we included, as a nuisance covariate,
the global average T2* time series. Contrast images corresponding to the ROI
time series regressors were derived individually for each subject, and entered
into second-level, random-effects analyses (joint height and extent thresholds
of p < 0.001 for significant clusters, corrected at the whole-brain level) (Poline
et al., 1997) to determine the brain areas that showed significant functional
connectivity with each seed across HC2 subjects. The resulting group maps
were used as spatial templates to select the best-fit independent component
from each subject in subsequent ICA analyses.
We used ICA to further refine our intrinsic functional connectivity maps (See-
ley et al., 2007). ICA decomposes a time course of whole-brain volumes (a 4D
image) from a single subject into independent spatiotemporal components.
After preprocessing, images were concatenated into 4D files and entered
into FSL 4.0 Melodic ICA software (http://www.fmrib.ox.ac.uk/fsl/index.
html). We allowed the program to automatically determine the dimensionality
of each data set, including the number of components. Among the 19 control
subjects, ICA extracted an average of 36.7 components (range 19–51) from
Run 1 and 36.5 components (range 29–52) from Run 2. After high-frequency
filtering, an average of 23.2 components (range 7–42) remained from Run 1
and 20.7 components (range 12–42) remained for Run 2. Temporal filtering
was not applied to the ICA data because ICA has been shown to separate non-
neural noise components from components of interest (Beckmann et al.,
2005). The components for each subject (from Run 1 or 2) that best fit the
ROI-derived group ICN template maps were selected using an automated
three-step procedure (Seeley et al., 2007). For 2 of 19 subjects, the algorithm
selected the same component for two of the five spatial templates. For one of
these subjects, the right parietal (AD) and left inferior frontal (PNFA) seed-
based ROI maps were best fit by the same component, and for the other
subject the right FI (bvFTD) and left inferior frontal (PNFA) seed maps best fit
the same component. One-sample t tests were performed on the best-fit
component images to derive a group-level ICN map for each seed. Signifi-
cance was determined using joint expected probability distribution with height
and extent thresholds of p < 0.001. The ICA-derived group maps were used in
all figures and spatial similarity analyses.
Spatial Similarity Analyses
The spatial similarity between atrophy maps and their related ICN and struc-
tural covariance maps was first quantified by measuring the GOF between
each atrophy map, binarized at a p < 0.05 FWE corrected threshold, and the
group-level ICA-derived ICNs and VBM-derived structural correlation maps.
GOF was defined as the difference between the mean of the t-scores inside
versus outside the binarized atrophy map. Therefore, each group-level corre-
lation map had five GOF scores: one ‘‘source’’ and four ‘‘other.’’ Here, source
refers to the GOF score from the atrophy map used to derive the correlation
map’s seed, whereas other refers to the four other atrophy maps. We further
compared each HC2 subject’s five best-fit ICA components (one for each
seed ROI) to the five atrophy maps, using the same GOF procedure. Other
GOF scores were averaged for each subject, and paired-sample t tests were
used to compare source versus mean other map GOF scores. Finally, to
assess the specificity of each atrophy-ICN pairing at the single-subject level,
we calculated mean source map GOF score for the best-fit ICA components
(one each from Runs 1 and 2) and compared these scores to the mean GOF
for the second best-fit components (Runs 1 and 2) using paired-sample t tests
(two-tailed). Because structural covariance cannot be derived for single
NEURON 3746
Neuron
Network-Based Neurodegeneration
50 Neuron 62, 42–52, April 16, 2009 ª2009 Elsevier Inc.
subjects, statistical comparisons of structural covariance GOF results were
not performed.
To visualize the spatial overlap within related atrophy, functional connec-
tivity, and structural covariance maps, we loaded all three maps as overlays,
rendered at less stringent statistical thresholds (atrophy: p < 0.0001, uncor-
rected; functional connectivity: ICA maps at p < 0.01 joint height and extent
thresholds, corrected at the whole-brain level; structural covariance: p <
0.0001, uncorrected), and determined the intersection of the three maps,
defined as those voxels contained in 3/3maps at these thresholds. This proce-
dure allowed us to demonstrate the convergence of the three maps within
each set, as well as the spatial dissimilarity between the five separate three-
map sets (Figure 6).
SUPPLEMENTAL DATA
The supplemental data for this article include two tables and can be found at
http://www.neuron.org/supplemental/S0896-6273(09)00249-9.
ACKNOWLEDGMENTS
We thank M.L. Gorno-Tempini and V. Menon for discussion and our patients
and their families for participating in neurodegeneration research. This work
was supported by the National Institute of Aging (NIA grants K08 AG027086
to W.W.S.; P01 AG19724 and P50 AG1657303-75271 to B.L.M.), the National
Institute of Neurological Disorders and Stroke (NINDS grant K23NS048302 to
M.D.G.), and the Larry L. Hillblom Foundation (W.W.S.).
Accepted: March 15, 2009
Published: April 15, 2009
REFERENCES
Beckmann, C.F., DeLuca, M., Devlin, J.T., and Smith, S.M. (2005). Investiga-
tions into resting-state connectivity using independent component analysis.
Philos. Trans. R. Soc. Lond. B Biol. Sci. 360, 1001–1013.
Bi, G., and Poo,M. (1999). Distributed synaptic modification in neural networks
induced by patterned stimulation. Nature 401, 792–796.
Boccardi, M., Sabattoli, F., Laakso, M.P., Testa, C., Rossi, R., Beltramello, A.,
Soininen, H., and Frisoni, G.B. (2005). Frontotemporal dementia as a neural
system disease. Neurobiol. Aging 26, 37–44.
Boxer, A.L., Geschwind, M.D., Belfor, N., Gorno-Tempini, M.L., Schauer, G.F.,
Miller, B.L., Weiner, M.W., and Rosen, H.J. (2006). Patterns of brain atrophy
that differentiate corticobasal degeneration syndrome from progressive
supranuclear palsy. Arch. Neurol. 63, 81–86.
Braak, H., and Braak, E. (1991). Neuropathological staging of Alzheimer-
related changes. Acta Neuropathol. (Berl.) 82, 239–259.
Brambati, S.M., Rankin, K.P., Narvid, J., Seeley, W.W., Dean, D., Rosen, H.J.,
Miller, B.L., Ashburner, J., and Gorno-Tempini, M.L. (2007). Atrophy progres-
sion in semantic dementia with asymmetric temporal involvement: A tensor-
based morphometry study. Neurobiol. Aging 30, 103–111.
Buckner, R.L., Snyder, A.Z., Shannon, B.J., LaRossa, G., Sachs, R., Fotenos,
A.F., Sheline, Y.I., Klunk, W.E., Mathis, C.A., Morris, J.C., and Mintun, M.A.
(2005). Molecular, structural, and functional characterization of Alzheimer’s
disease: evidence for a relationship between default activity, amyloid, and
memory. J. Neurosci. 25, 7709–7717.
Damoiseaux, J.S., Rombouts, S.A., Barkhof, F., Scheltens, P., Stam, C.J.,
Smith, S.M., and Beckmann, C.F. (2006). Consistent resting-state networks
across healthy subjects. Proc. Natl. Acad. Sci. USA 103, 13848–13853.
DeLuca,M., Beckmann,C.F., DeStefano,N.,Matthews,P.M., andSmith, S.M.
(2006). fMRI resting state networks define distinct modes of long-distance
interactions in the human brain. Neuroimage 29, 1359–1367.
Dickerson, B.C., Salat, D.H., Bates, J.F., Atiya, M., Killiany, R.J., Greve, D.N.,
Dale, A.M., Stern, C.E., Blacker, D., Albert, M.S., and Sperling, R.A. (2004).
Medial temporal lobe function and structure in mild cognitive impairment.
Ann. Neurol. 56, 27–35.
Fair,D.A.,Cohen,A.L.,Dosenbach,N.U.,Church, J.A.,Miezin, F.M.,Barch,D.M.,
Raichle, M.E., Petersen, S.E., and Schlaggar, B.L. (2008). The maturing
architecture of the brain’s default network. Proc. Natl. Acad. Sci. USA 105,
4028–4032.
Fox, M.D., and Raichle, M.E. (2007). Spontaneous fluctuations in brain activity
observed with functional magnetic resonance imaging. Nat. Rev. Neurosci. 8,
700–711.
Fox, M.D., Snyder, A.Z., Vincent, J.L., Corbetta, M., Van Essen, D.C., and
Raichle, M.E. (2005). The human brain is intrinsically organized into dynamic,
anticorrelated functional networks. Proc. Natl. Acad. Sci. USA 102,
9673–9678.
Fox, M.D., Snyder, A.Z., Vincent, J.L., and Raichle, M.E. (2007). Intrinsic fluc-
tuations within cortical systems account for intertrial variability in human
behavior. Neuron 56, 171–184.
Fransson, P. (2005). Spontaneous low-frequency BOLD signal fluctuations: an
fMRI investigation of the resting-state default mode of brain function hypoth-
esis. Hum. Brain Mapp. 26, 15–29.
Fransson, P. (2006). How default is the default mode of brain function?
Further evidence from intrinsic BOLD signal fluctuations. Neuropsychologia
44, 2836–2845.
Frost, B., Ollesch, J., Wille, H., and Diamond, M.I. (2008). Conformational
diversity of wild-type tau fibrils specified by templated conformation change.
J. Biol. Chem. 284, 3546–3551.
Geschwind, D.H., Robidoux, J., Alarcon, M., Miller, B., Wilhelmsen, K.,
Cummings, J., and Nasreddine, Z. (2001). Dementia and neurodevelopmental
predisposition: cognitive dysfunction in presymptomatic subjects precedes
dementia by decades in frontotemporal dementia. Ann. Neurol. 50, 741–746.
Glover, G.H., and Lai, S. (1998). Self-navigated spiral fMRI: interleaved versus
single-shot. Magn. Reson. Med. 39, 361–368.
Good, C.D., Johnsrude, I.S., Ashburner, J., Henson, R.N., Friston, K.J., and
Frackowiak, R.S. (2001). A voxel-based morphometric study of ageing in
465 normal adult human brains. Neuroimage 14, 21–36.
Gorno-Tempini,M.L.,Dronkers,N.F.,Rankin,K.P.,Ogar,J.M.,Phengrasamy, L.,
Rosen, H.J., Johnson, J.K., Weiner, M.W., and Miller, B.L. (2004). Cognition
and anatomy in three variants of primary progressive aphasia. Ann. Neurol. 55,
335–346.
Graveland, G.A., Williams, R.S., and DiFiglia, M. (1985). Evidence for degener-
ative and regenerative changes in neostriatal spiny neurons in Huntington’s
disease. Science 227, 770–773.
Greicius, M.D., Krasnow, B., Reiss, A.L., and Menon, V. (2003). Functional
connectivity in the resting brain: a network analysis of the default mode
hypothesis. Proc. Natl. Acad. Sci. USA 100, 253–258.
Greicius, M.D., Srivastava, G., Reiss, A.L., and Menon, V. (2004). Default-
mode network activity distinguishes Alzheimer’s disease from healthy aging:
evidence from functional MRI. Proc. Natl. Acad. Sci. USA 101, 4637–4642.
Greicius, M.D., Supekar, K., Menon, V., and Dougherty, R.F. (2008). Resting-
State Functional Connectivity Reflects Structural Connectivity in the Default
Mode Network. Cereb. Cortex 19, 72–78.
He, Y., Chen, Z.J., and Evans, A.C. (2007). Small-world anatomical networks in
the human brain revealed by cortical thickness from MRI. Cereb. Cortex 17,
2407–2419.
Hesselmann, G., Kell, C.A., Eger, E., and Kleinschmidt, A. (2008). Spontaneous
local variations in ongoing neural activity bias perceptual decisions. Proc. Natl.
Acad. Sci. USA 105, 10984–10989.
Hof, P.R., Vogt, B.A., Bouras, C., and Morrison, J.H. (1997). Atypical form of
Alzheimer’s disease with prominent posterior cortical atrophy: a review of
lesion distribution and circuit disconnection in cortical visual pathways. Vision
Res. 37, 3609–3625.
Hyman, B.T., Damasio, A.R., Van Hoesen, G.W., and Barnes, C.L. (1984).
Alzheimer’s disease: cell-specific pathology isolates the hippocampal forma-
tion. Science 225, 1168–1170.
Johnson, J.K., Diehl, J., Mendez,M.F., Neuhaus, J., Shapira, J.S., Forman, M.,
Chute, D.J., Roberson, E.D., Pace-Savitsky, C., Neumann, M., et al. (2005).
NEURON 3746
Neuron
Network-Based Neurodegeneration
Neuron 62, 42–52, April 16, 2009 ª2009 Elsevier Inc. 51
Frontotemporal lobar degeneration: demographic characteristics of 353
patients. Arch. Neurol. 62, 925–930.
Josephs, K.A., Duffy, J.R., Strand, E.A.,Whitwell, J.L., Layton, K.F., Parisi, J.E.,
Hauser, M.F., Witte, R.J., Boeve, B.F., Knopman, D.S., et al. (2006). Clinico-
pathological and imaging correlates of progressive aphasia and apraxia of
speech. Brain 129, 1385–1398.
Josephs, K.A., Whitwell, J.L., Dickson, D.W., Boeve, B.F., Knopman, D.S.,
Petersen, R.C., Parisi, J.E., and Jack, C.R., Jr. (2008). Voxel-based morphom-
etry in autopsy proven PSP and CBD. Neurobiol. Aging 29, 280–289.
Kassubek, J., Unrath, A., Huppertz, H.J., Lule, D., Ethofer, T., Sperfeld, A.D.,
and Ludolph, A.C. (2005). Global brain atrophy and corticospinal tract alter-
ations in ALS, as investigated by voxel-basedmorphometry of 3-DMRI. Amyo-
troph. Lateral Scler. Other Motor Neuron Disord. 6, 213–220.
Katz, L.C., and Shatz, C.J. (1996). Synaptic activity and the construction of
cortical circuits. Science 274, 1133–1138.
Kelly, A.M., Di Martino, A., Uddin, L.Q., Shehzad, Z., Gee, D.G., Reiss, P.T.,
Margulies, D.S., Castellanos, F.X., and Milham, M.P. (2008). Development of
Anterior Cingulate Functional Connectivity from Late Childhood to Early Adult-
hood. Cereb. Cortex 19, 640–657.
Lerch, J.P.,Worsley, K., Shaw,W.P., Greenstein, D.K., Lenroot, R.K.,Giedd, J.,
and Evans, A.C. (2006). Mapping anatomical correlations across cerebral
cortex (MACACC) using cortical thickness from MRI. Neuroimage 31,
993–1003.
Liu, W., Miller, B.L., Kramer, J.H., Rankin, K., Wyss-Coray, C., Gearhart, R.,
Phengrasamy, L., Weiner, M., and Rosen, H.J. (2004). Behavioral disorders
in the frontal and temporal variants of frontotemporal dementia. Neurology
62, 742–748.
Lowe, M.J., Mock, B.J., and Sorenson, J.A. (1998). Functional connectivity
in single and multislice echoplanar imaging using resting-state fluctuations.
Neuroimage 7, 119–132.
Maguire, E.A., Gadian, D.G., Johnsrude, I.S., Good, C.D., Ashburner, J.,
Frackowiak, R.S., and Frith, C.D. (2000). Navigation-related structural change
in the hippocampi of taxi drivers. Proc. Natl. Acad. Sci. USA 97, 4398–4403.
McKhann, G., Drachman, D., Folstein, M., Katzman, R., Price, D., and
Stadlan, E.M. (1984). Clinical diagnosis of Alzheimer’s disease: report of the
NINCDS-ADRDA Work Group under the auspices of Department of Health and
Human Services Task Force on Alzheimer’s Disease. Neurology 34, 939–944.
Mechelli, A., Friston, K.J., Frackowiak, R.S., and Price, C.J. (2005). Structural
covariance in the human cortex. J. Neurosci. 25, 8303–8310.
Mesulam, M.M., and Mufson, E.J. (1982). Insula of the old world monkey. I.
Architectonics in the insulo-orbito-temporal component of the paralimbic
brain. J. Comp. Neurol. 212, 1–22.
Neary, D., Snowden, J.S., Gustafson, L., Passant, U., Stuss, D., Black, S.,
Freedman,M., Kertesz, A., Robert, P.H., Albert, M., et al. (1998). Frontotempo-
ral lobar degeneration: a consensus on clinical diagnostic criteria. Neurology
51, 1546–1554.
Ojemann, J.G., Akbudak, E., Snyder, A.Z., McKinstry, R.C., Raichle, M.E., and
Conturo, T.E. (1997). Anatomic localization and quantitative analysis of
gradient refocused echo-planar fMRI susceptibility artifacts. Neuroimage 6,
156–167.
Palop, J.J., Chin, J., and Mucke, L. (2006). A network dysfunction perspective
on neurodegenerative diseases. Nature 443, 768–773.
Palop, J.J., Chin, J., Roberson, E.D.,Wang, J., Thwin,M.T., Bien-Ly,N., Yoo, J.,
Ho, K.O., Yu, G.Q., Kreitzer, A., et al. (2007). Aberrant excitatory neuronal
activity and compensatory remodeling of inhibitory hippocampal circuits in
mouse models of Alzheimer’s disease. Neuron 55, 697–711.
Poline, J.B., Worsley, K.J., Evans, A.C., and Friston, K.J. (1997). Combining
spatial extent and peak intensity to test for activations in functional imaging.
Neuroimage 5, 83–96.
Reiman, E.M., Chen, K., Alexander, G.E., Caselli, R.J., Bandy, D., Osborne, D.,
Saunders, A.M., and Hardy, J. (2004). Functional brain abnormalities in young
adults at genetic risk for late-onset Alzheimer’s dementia. Proc. Natl. Acad.
Sci. USA 101, 284–289.
Ruthazer, E.S., and Cline, H.T. (2004). Insights into activity-dependent map
formation from the retinotectal system: a middle-of-the-brain perspective.
J. Neurobiol. 59, 134–146.
Salehi, A., Delcroix, J.D., Belichenko, P.V., Zhan, K., Wu, C., Valletta, J.S.,
Takimoto-Kimura, R., Kleschevnikov, A.M., Sambamurti, K., Chung, P.P.,
et al. (2006). Increased App expression in amousemodel of Down’s syndrome
disrupts NGF transport and causes cholinergic neuron degeneration. Neuron
51, 29–42.
Scott, J.R., Davies, D., and Fraser, H. (1992). Scrapie in the central nervous
system: neuroanatomical spread of infection and Sinc control of pathogenesis.
J. Gen. Virol. 73, 1637–1644.
Seeley, W.W. (2008). Selective functional, regional, and neuronal vulnerability
in frontotemporal dementia. Curr. Opin. Neurol. 21, 701–707.
Seeley, W.W., Bauer, A.M., Miller, B.L., Gorno-Tempini, M.L., Kramer, J.H.,
Weiner, M., and Rosen, H.J. (2005). The natural history of temporal variant
frontotemporal dementia. Neurology 64, 1384–1390.
Seeley, W.W., Carlin, D.A., Allman, J.M., Macedo, M.N., Bush, C., Miller, B.L.,
and Dearmond, S.J. (2006). Early frontotemporal dementia targets neurons
unique to apes and humans. Ann. Neurol. 60, 660–667.
Seeley, W.W., Menon, V., Schatzberg, A.F., Keller, J., Glover, G.H., Kenna, H.,
Reiss, A.L., and Greicius, M.D. (2007). Dissociable intrinsic connectivity
networks for salience processing and executive control. J. Neurosci. 27,
2349–2356.
Seeley, W.W., Crawford, R., Rascovsky, K., Kramer, J.H., Weiner, M., Miller,
B.L., and Gorno-Tempini, M.L. (2008a). Frontal paralimbic network atrophy
in very mild behavioral variant frontotemporal dementia. Arch. Neurol. 65,
249–255.
Seeley, W.W., Matthews, B.R., Crawford, R.K., Gorno-Tempini, M.L., Foti, D.,
Mackenzie, I.R., and Miller, B.L. (2008b). Unravelling Bolero: progressive
aphasia, transmodal creativity and the right posterior neocortex. Brain 131,
39–49.
Selkoe, D.J. (2002). Alzheimer’s disease is a synaptic failure. Science 298,
789–791.
Senjem, M.L., Gunter, J.L., Shiung, M.M., Petersen, R.C., and Jack, C.R., Jr.
(2005). Comparison of different methodological implementations of voxel-
based morphometry in neurodegenerative disease. Neuroimage 26, 600–608.
Shaw, P., Lerch, J.P., Pruessner, J.C., Taylor, K.N., Rose, A.B., Greenstein, D.,
Clasen, L., Evans, A., Rapoport, J.L., and Giedd, J.N. (2007). Cortical
morphology in children and adolescents with different apolipoprotein E gene
polymorphisms: an observational study. Lancet Neurol. 6, 494–500.
Sorg, C., Riedl, V., Muhlau, M., Calhoun, V.D., Eichele, T., Laer, L., Drzezga, A.,
Forstl, H., Kurz, A., Zimmer, C., and Wohlschlager, A.M. (2007). Selective
changes of resting-state networks in individuals at risk for Alzheimer’s disease.
Proc. Natl. Acad. Sci. USA 104, 18760–18765.
Sporns, O., Tononi, G., and Kotter, R. (2005). The human connectome: a struc-
tural description of the human brain. PLoS Comput. Biol. 1, e42.
Stark, D.E., Margulies, D.S., Shehzad, Z.E., Reiss, P., Kelly, A.M., Uddin, L.Q.,
Gee, D.G., Roy, A.K., Banich, M.T., Castellanos, F.X., andMilham,M.P. (2008).
Regional variation in interhemispheric coordination of intrinsic hemodynamic
fluctuations. J. Neurosci. 28, 13754–13764.
Supekar, K., Menon, V., Rubin, D., Musen, M., and Greicius, M.D. (2008).
Network analysis of intrinsic functional brain connectivity in Alzheimer’s
disease. PLoS Comput. Biol. 4, e1000100.
van den Heuvel, M., Mandl, R., and Hulshoff Pol, H. (2008). Normalized cut
group clustering of resting-state FMRI data. PLoS ONE 3, e2001.
Vincent, J.L., Kahn, I., Snyder, A.Z., Raichle, M.E., and Buckner, R.L. (2008).
Evidence for a frontoparietal control system revealed by intrinsic functional
connectivity. J. Neurophysiol. 100, 3328–3342.
Vincent, J.L., Patel, G.H., Fox, M.D., Snyder, A.Z., Baker, J.T., Van Essen,
D.C., Zempel, J.M., Snyder, L.H., Corbetta, M., and Raichle, M.E. (2007).
Intrinsic functional architecture in the anaesthetized monkey brain. Nature
447, 83–86.
NEURON 3746
Neuron
Network-Based Neurodegeneration
52 Neuron 62, 42–52, April 16, 2009 ª2009 Elsevier Inc.
Related Documents