REVIEW Neuroimaging tools to rate regional atrophy, subcortical cerebrovascular disease, and regional cerebral blood flow and metabolism: consensus paper of the EADC G B Frisoni, P h Scheltens, S Galluzzi, F M Nobili, N C Fox, P H Robert, H Soininen, L-O Wahlund, G Waldemar, E Salmon ............................................................................................................................... J Neurol Neurosurg Psychiatry 2003;74:1371–1381 Neuroimaging is a mainstay in the differential diagnosis of patients with cognitive impairment. The often equivocal clinical pictures, the prognostic uncertainty of the earliest stages of mild cognitive impairment, and the subtle brain changes mean that neuroimaging techniques are of potentially great incremental diagnostic value. A number of methods, ranging from very simple subjective visual ratings to highly sophisticated computerised tools, have been developed, which allow rating of structural and functional brain changes. The choice of the method is not obvious, and current guidelines provide no indications on which tools should be preferred. In this paper, we give indications for tools with demonstrated accuracy for detecting regional atrophy, cerebrovascular disease, and regional brain function, and discuss these according to increasing technological complexity, ranging from those with high feasibility that can be used at the patient’s bedside to highly technological ones that require trained personnel and specific hardware and software. ........................................................................... See end of article for authors’ affiliations ....................... Correspondence to: Dr G B Frisoni, Laboratory of Epidemiology & Neuroimaging, IRCCS San Giovanni di Dio-FBF, via Pilastroni 4, 25125 Brescia, Italy; [email protected] ....................... I maging in dementia or cognitive impairment is moving from a negative, exclusionary role to one that adds positive diagnostic and prog- nostic information. Only 10 years ago, the practice parameters of the American Academy of Neurology regarded computed tomography (CT) and magnetic resonance (MR) as ‘‘optional’’ examinations. 1 The belief is now widely held that quantitative ratings of struc- tural and functional changes can have an impact on the clinical management of the patient. 2 The increased social awareness of cognitive disturbances brings patients to first medical observation in earlier stages of the dementing disorder, 34 when the diagnosis is often uncertain and imaging can represent a significant aid to the differential diagnosis. Hippocampal atrophy on MR, 5 and medial temporal or temporoparietal cortical hypoperfusion/hypometabolism on sin- gle photon emission tomography (SPET) 67 and positron emission tomography (PET) 8 have been shown to be among the most accurate markers of conversion of patients with mild cognitive impairment (MCI) to Alzheimer’s disease (AD). Furthermore, the rate of atrophy progression has been suggested as a feasible surrogate marker for trials of disease modifying drugs, 9 and indeed, atrophy measures have now been adopted in several current trials in MCI and AD. 10 Available criteria for vascular dementia 11 12 require brain imaging criteria that define mini- mum extension, topography, and severity of vascular lesions. In the NINDS-AIREN criteria, leukoencephalopathy involving at least 25% of the total white matter must be present to diagnose small vessel cerebrovascular disease. Tools to rate quantitatively the vascular load in the brain might increase the diagnostic accuracy of vascular dementia. The practising dementia specialist can find few literature indications on how to exploit the potential of neuroimaging. Diagnostic guidelines issued by the European Federation of Neurological Societies 13 and the more recently issued practice parameters of the American Academy of Neurology 14 suggest that at least one structural CT or MR examination should be made over the course of a dementing disorder to rule out space occupying or vascular lesions, and that SPET and PET should be used in cases of significant diagnostic uncertainty. Moreover, they suggest that, although not required by guidelines, more specific CT/MR parameters measuring atrophy and subcortical vascular lesions and SPECT/PET parameters of perfu- sion/metabolism may be diagnostic aids in the evaluation of patients with cognitive impair- ment. However, no indication is provided as to how images should be rated to extract clinically useful information. Paradoxically, scores of methods to rate structural and functional changes in the brains of patients with cognitive impairment can be found in the literature. 15 Methods range from very simple subjective visual ratings to highly sophisticated computerised tools. The choice of the method is not obvious. The diagnostic accuracy (sensitivity and specificity) generally ................................................... Abbreviations: AD, Alzheimer’s disease; ARWMC, Age Related White Matter Changes; CT, computed tomography; MCI, mild cognitive impairment; MR, magnetic resonance; MTL, medial temporal lobe; MMS, Mini Mental State; PET, positron emission tomography; SPET, single photon emission tomography 1371 www.jnnp.com group.bmj.com on May 20, 2016 - Published by http://jnnp.bmj.com/ Downloaded from

Welcome message from author
This document is posted to help you gain knowledge. Please leave a comment to let me know what you think about it! Share it to your friends and learn new things together.
Transcript
REVIEW
Neuroimaging tools to rate regional atrophy, subcorticalcerebrovascular disease, and regional cerebral blood flowand metabolism: consensus paper of the EADCG B Frisoni, P h Scheltens, S Galluzzi, F M Nobili, N C Fox, P H Robert, H Soininen, L-O Wahlund,G Waldemar, E Salmon. . . . . . . . . . . . . . . . . . . . . . . . . . . . . . . . . . . . . . . . . . . . . . . . . . . . . . . . . . . . . . . . . . . . . . . . . . . . . . . . . . . . . . . . . . . . . . . . . . . . . . . . . . . . . . . . . . . . . . . . . . . . . . .
J Neurol Neurosurg Psychiatry 2003;74:1371–1381
Neuroimaging is a mainstay in the differential diagnosis ofpatients with cognitive impairment. The often equivocalclinical pictures, the prognostic uncertainty of the earlieststages of mild cognitive impairment, and the subtle brainchanges mean that neuroimaging techniques are ofpotentially great incremental diagnostic value. A number ofmethods, ranging from very simple subjective visual ratingsto highly sophisticated computerised tools, have beendeveloped, which allow rating of structural and functionalbrain changes. The choice of the method is not obvious,and current guidelines provide no indications on whichtools should be preferred. In this paper, we give indicationsfor tools with demonstrated accuracy for detecting regionalatrophy, cerebrovascular disease, and regional brainfunction, and discuss these according to increasingtechnological complexity, ranging from those with highfeasibility that can be used at the patient’s bedside to highlytechnological ones that require trained personnel andspecific hardware and software.. . . . . . . . . . . . . . . . . . . . . . . . . . . . . . . . . . . . . . . . . . . . . . . . . . . . . . . . . . . . . . . . . . . . . . . . . . .
See end of article forauthors’ affiliations. . . . . . . . . . . . . . . . . . . . . . .
Correspondence to:Dr G B Frisoni, Laboratoryof Epidemiology &Neuroimaging, IRCCS SanGiovanni di Dio-FBF, viaPilastroni 4, 25125Brescia, Italy;[email protected]. . . . . . . . . . . . . . . . . . . . . . .
Imaging in dementia or cognitive impairment ismoving from a negative, exclusionary role toone that adds positive diagnostic and prog-
nostic information. Only 10 years ago, thepractice parameters of the American Academyof Neurology regarded computed tomography(CT) and magnetic resonance (MR) as‘‘optional’’ examinations.1 The belief is nowwidely held that quantitative ratings of struc-tural and functional changes can have an impacton the clinical management of the patient.2
The increased social awareness of cognitivedisturbances brings patients to first medicalobservation in earlier stages of the dementingdisorder,3 4 when the diagnosis is often uncertainand imaging can represent a significant aid tothe differential diagnosis. Hippocampal atrophyon MR,5 and medial temporal or temporoparietalcortical hypoperfusion/hypometabolism on sin-gle photon emission tomography (SPET)6 7 andpositron emission tomography (PET)8 have beenshown to be among the most accurate markers ofconversion of patients with mild cognitiveimpairment (MCI) to Alzheimer’s disease (AD).
Furthermore, the rate of atrophy progression hasbeen suggested as a feasible surrogate marker fortrials of disease modifying drugs,9 and indeed,atrophy measures have now been adopted inseveral current trials in MCI and AD.10
Available criteria for vascular dementia11 12
require brain imaging criteria that define mini-mum extension, topography, and severity ofvascular lesions. In the NINDS-AIREN criteria,leukoencephalopathy involving at least 25% ofthe total white matter must be present todiagnose small vessel cerebrovascular disease.Tools to rate quantitatively the vascular load inthe brain might increase the diagnostic accuracyof vascular dementia.
The practising dementia specialist can find fewliterature indications on how to exploit thepotential of neuroimaging. Diagnostic guidelinesissued by the European Federation ofNeurological Societies13 and the more recentlyissued practice parameters of the AmericanAcademy of Neurology14 suggest that at leastone structural CT or MR examination should bemade over the course of a dementing disorder torule out space occupying or vascular lesions, andthat SPET and PET should be used in cases ofsignificant diagnostic uncertainty. Moreover,they suggest that, although not required byguidelines, more specific CT/MR parametersmeasuring atrophy and subcortical vascularlesions and SPECT/PET parameters of perfu-sion/metabolism may be diagnostic aids in theevaluation of patients with cognitive impair-ment. However, no indication is provided as tohow images should be rated to extract clinicallyuseful information.
Paradoxically, scores of methods to ratestructural and functional changes in the brainsof patients with cognitive impairment can befound in the literature.15 Methods range fromvery simple subjective visual ratings to highlysophisticated computerised tools. The choice ofthe method is not obvious. The diagnosticaccuracy (sensitivity and specificity) generally
. . . . . . . . . . . . . . . . . . . . . . . . . . . . . . . . . . . . . . . . . . . . . . . . . . .
Abbreviations: AD, Alzheimer’s disease; ARWMC, AgeRelated White Matter Changes; CT, computedtomography; MCI, mild cognitive impairment; MR,magnetic resonance; MTL, medial temporal lobe; MMS,Mini Mental State; PET, positron emission tomography;SPET, single photon emission tomography
1371
www.jnnp.com
group.bmj.com on May 20, 2016 - Published by http://jnnp.bmj.com/Downloaded from

ranges between 70 and 90%15 16 and, although it is likely thatmore sophisticated methods are more accurate, there is littleevidence that this is the case. Moreover, the accuracy of anymethod is heavily affected by personal expertise and clinicalcomposition of the population of interest, and the incre-mental diagnostic accuracy by number and type of otherdiagnostic tests. Thus, as is often the case in medicine,17 thedementia specialist will choose more on the basis of practicalconsiderations (availability, accessibility, cost, technicalfeasibility) than strict scientific evidence.
The aim of this paper is to highlight those instrumentsthat the practising dementia specialist might use in theclinical setting. The paper is a consensus produced bythe Neuroimaging Working Group of the EuropeanAlzheimer’s Disease Consortium (EADC). The EADC is aconsortium of 43 Alzheimer’s centres in 13 Europeancountries (principal investigator Pr. B Vellas, Toulouse,France, www.alzheimer-europe.org/EADC), and is fundedby the European Union with the purpose of definingoperational standards of excellence for the diagnosis andtreatment of patients with cognitive impairment. The firstdraft of the consensus was produced on 12 November 2001,in Toulouse, France, during one of the biannual meetings ofthe EADC. The first draft of the manuscript was produced inJuly 2002 and circulated for comments to all EADC centres,as was the final version.
The instruments have been selected by capitalising on theexperience of previous reviews made by some of theauthors.15 18–20 The instruments will be described accordingto increasing levels of technological complexity and feasibilityso that physicians can choose those more consistent with thetechnological facilities of their clinical setting. Levels range
from unaided ratings (subjective visual) of films or hardcopies obtained with routine acquisition protocols on a singleoccasion to sophisticated computer based measurementsbased on digital images obtained with non-routine specificacquisition protocols on two or more separate occasions(tables 1 and 2). The variables of interest will be the threemain aspects in the assessment of cognitive disturbances, i.e.regional atrophy, subcortical cerebrovascular disease, andregional functional (perfusion/metabolism) defects. CT andMR will be addressed separately because generally differenttools apply to the two techniques, while SPET and PET will beaddressed together as the same tools can be used and the twotechniques give grossly similar clinical information.
CT LEVEL 1: FILM WITH ROUTINE ACQUISITION(ORBITOMEATAL LINE, SLICE THICKNESS 8–10 MM)Subcortical cerebrovascular disease: visual rating scalesA number of rating scales to grade subcortical cerebrovas-cular disease (sCVD) on CT or MR films have beendeveloped.18 The European Task Force on Age RelatedWhite Matter Changes reviewed instruments developed asof 1998, and concluded that the ideal rating scale did not yetexist.18 Based on this conclusion, they developed an instru-ment to rate sCVD, which was applicable to routine axial CTscans (the Age Related White Matter Changes (ARWMC)scale).21 This is a four-point scale that rates white matterchanges separately in five areas: frontal, parieto-occipital,temporal, infratentorial/cerebellum, and basal ganglia (stria-tum, globus pallidus, thalamus, internal/external capsule,and insula). The first three areas are scored as 0 = no lesions(including symmetrical, well defined caps or bands), 1 =focal lesions, 2 = beginning confluence of lesions, 3 = diffuse
Table 1 Levels of increasing technological intensity of tools to rate structural imaging findings in patients with cognitiveimpairment
Level Medium Technical requirements
Regional atrophy Subcortical cerebrovascular disease
Measurement Experience Measurement Experience
CT 1 Film Routine acquisition* None — Visual rating scales: ARWMCscale21
1–2 weeks
CT 2 Film 2–3 mm thick slices ontemporal lobe plane
Linear measures: minimumthickness of the MTL22 and radialwidth of the temporal horn27
1–3 days None —
MR 1 Film Routine acquisition� Visual rating scales: Scheltens’MTL atrophy score30
1–3 days Visual rating scales: ARWMCscale21
1–2 weeks
Linear measures: width of thetemporal horn24
1–3 days
MR 2 Digital 3D T1 acquisition manualor semiautomatic post-processing
Volumetric measures:hippocampal and entorhinalcortex volumes38 39
2–4 weeks Volumetric measures:thresholding of WMH41
1 day
MR 3 Digital 3D T1 acquisition softwarefor computerised post-processing serial scans
Prospective whole brainassessment: brain boundary shiftintegral45
— None —
ARWMC, Age Related White Matter Changes; MTL, medial temporal lobe; WMH, white matter hyperintensities; ROI, region of interest.*Orbitomeatal line, slice thickness of 8–10 mm; �including coronal T1 acquisition through the MTL.Experience denotes the training time needed to obtain accurate measurements.
Table 2 Levels of increasing technological intensity of tools to rate functional imaging findings in patients with cognitiveimpairment
Level Medium Technical requirements
Focal hypoperfusion/metabolism
Measurement Experience
SPET/PET 1 Hardcopy — Visual assessment 1–2 weeksSPET/PET 2 Digital — ROI sampling 1–3 daysSPET/PET 3 Digital Software for computerised post-processing Voxel by voxel analysis in the stereotactic space61 —
ROI, region of interest.Experience denotes the training time needed to obtain accurate measurements.
1372 Frisoni, Scheltens, Galluzzi, et al
www.jnnp.com
group.bmj.com on May 20, 2016 - Published by http://jnnp.bmj.com/Downloaded from
involvement of the entire region, with or without involve-ment of U fibres. The infratentorial/cerebellum and basalganglia are scored as 0 = no lesions, 1 = only one focal lesion(.5 mm), 2 = more than one focal lesion, 3 = confluentlesions. The final result of the rating is 10 separate scores(five for the right and five for the left hemisphere) rangingbetween 0 and 3, rating the different brain regions (fig 1).
The inter-rater reliability was found to be moderate(k = 0.48). The ARWMC scale was applied on both CT andMR films. A good correlation between the two imagingmodalities was found; in more than 50% of patients CT andMR scored equal in all areas. However, in 31% of patients MRscored parieto-occipital lesions better than CT, and scoredinfratentorial lesions better in 23% of patients. The clinicalfeatures of the 77 patients with white matter changes used tovalidate the ARWMC scale were not described, and data onknown group validity were not reported.
The novelty of the ARWMC scale is that images due todifferent pathology such as lacunes (featuring axonal loss)and white matter lesions (featuring demyelination with littleor no axonal loss) are rated separately. The main limitation isrepresented by the unavailability of a global measurement ofseverity, as the sum score of the 10 ratings has not yet beenvalidated. There are no data on the added diagnostic value ofthis scale.
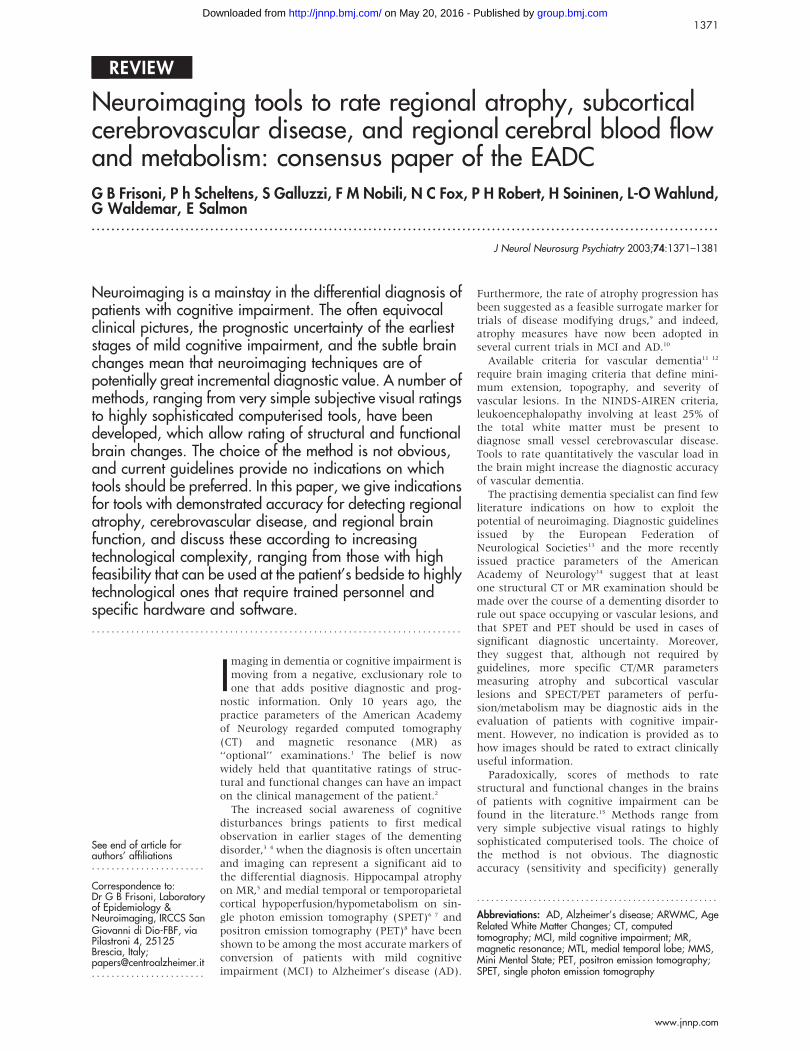
CT LEVEL 2: FILM WITH 2–3 MM THICK SLICES ONTHE TEMPORAL LOBE PLANERegional atrophy: linear measuresAtrophy in the medial temporal lobe (MTL) is usually notobvious on CT films because the scan angle routinely useddoes not give the best image of this region.22 However, with adifferent scan angle (slice orientation parallel to the plane ofthe temporal lobe, i.e. 15–20˚caudal to the infraorbitomeatalline),23 atrophy of the MTL can be detected with linearmeasures in AD patients.
The minimum thickness of the MTL is the most widelyrecognised linear CT measurement.22 The technical require-ments for this measurement are the orientation of the CTscan parallel to the plan of the temporal lobe and thin slicethickness (2–3 mm). The measurement is taken with acalliper in the parahippocampal gyrus region, where theportion between the anterior and posterior aspects of thebrainstem is thinnest (fig 2). In a group of 44 pathologicallyconfirmed AD patients with mean (SD) Mini Mental State(MMS) scores of 9.3 (6.9), Jobst et al found that theminimum thickness of the MTL separated AD patients fromnon-demented controls with a sensitivity of 92% andspecificity of 95%. Two recent studies of mild AD patientsfound lower sensitivity values: 48% in 33 patients with MMSof 22 (2.1) compared with 31 controls,24 and 75% (specificity90%) in 60 with MMS of 19.6 (4.5) v 17 patients withvascular dementia, 14 with depression and nine withparaphrenia.25 Jobst et al showed that the progression ofMTL atrophy thus measured was a sensitive marker ofincident cognitive deterioration in subjects who werecognitively normal at baseline.26
Recently, a CT based measurement of MTL atrophy hasbeen developed based on enlargement of radial width of thetemporal horn.27 The measurement is sufficiently reliable,accurate, and feasible to be routinely employed.27 CT scansare acquired according to the technique of Jobst et al, and themeasurement can be taken also on MR scans. As the greatestproportion of hippocampal atrophy typical of AD takes placein the hippocampal head,28 the radial width of the temporalhorn measurement is devised so as to capture atrophy in thisregion. The measurement is taken at the tip of the temporalhorn with a precision calliper (fig 2). Intraclass correlationcoefficients for inter- and intra-rater reliability were between0.94 and 0.98. Using a cutoff of 5.3 mm, the sensitivity and
Figure 1 CT level 1 (left side images) and MR level 1 (right side images)for cerebrovascular disease: a visual rating scale based on CT andMR films (the Age Related White Matter Changes scale 21). Grade 1,focal lesions; grade 2, early beginning confluent lesions; grade 3,confluent lesions with diffuse involvement of a lobe, with or withoutinvolvement of U fibress. Image pairs (CT/MR) are matching slices ofthe same patient. Reprinted with permission from American HeartAssociation.
Figure 2 CT level 2 for regional atrophy: linear measurements ofmedial temporal lobe atrophy based on CT films. Minimum thicknessof the medial temporal lobe22: the measurement is taken in theparahippocampal gyrus region where the portion between the anteriorand posterior aspects of the brainstem is thinnest (white arrows). Radialwidth of the temporal horn27: the measurement is the distance betweentwo parallel lines drawn tangential to the tip of the temporal horns whereits width is maximum (red arrows). Right side, non-demented elderlyperson; left side: Alzheimer’s disease.
Neuroimaging and cognitive impairment 1373
www.jnnp.com
group.bmj.com on May 20, 2016 - Published by http://jnnp.bmj.com/Downloaded from

specificity were 93 and 97% in separating 42 mild tomoderate AD patients (MMS of 21 (2.3)) from 29 non-demented controls. In a small group of patients withmild cognitive impairment, the measurement has beenshown to have sensitivity and specificity of 80 and 95%.29
There are no data on the added diagnostic value of thesemeasurements.
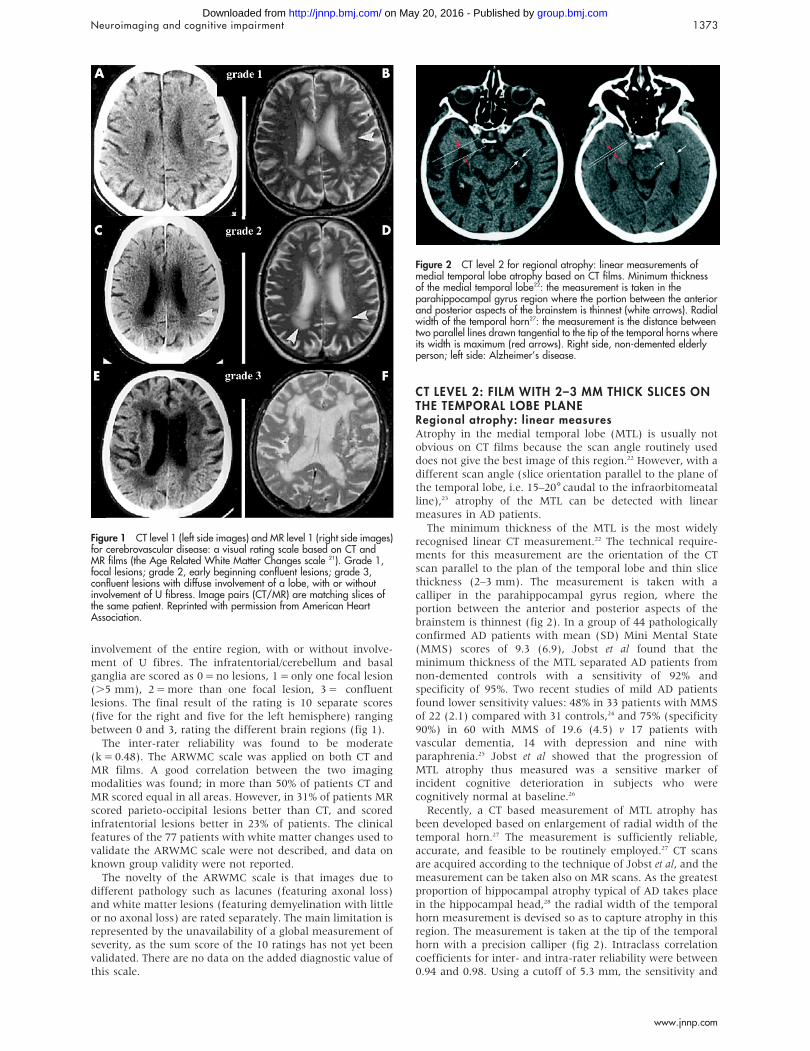
MR LEVEL 1: FILM WITH ROUTINE ACQUISITION(ROUTINE T2 AXIAL, ROUTINE T1 CORONALTHROUGH THE MEDIAL TEMPORAL LOBE)Regional atrophy: visual rating scales and linearmeasurementsWhile CT imaging of the temporal lobe allows appreciation ofthe indirect signs of hippocampal atrophy (such as theenlargement of the temporal horns), MR can directlyvisualise the hippocampus and other critical MTL structurein substantial cytoarchitectonic detail. Scheltens et al30 havedeveloped a subjective visual rating scale to assess MTLatrophy on plain MR films (the subjective MTL atrophyscore). T1 weighted sequences are used and six coronal slices(slice thickness of 5 mm) parallel to the brainstem axis areacquired from a midsagittal scout image, the first imagebeing acquired directly adjacent to the brainstem. The score isassigned based on visual rating of the width of the choroidfissure, width of the temporal horn, and height of thehippocampal formation. The resulting scores are 0 = absent,1 = minimal, 2 = mild, 3 = moderate, and 4 = severe MTLatrophy (fig 3A).
In 21 AD patients and 21 controls, the subjective MTLatrophy score yielded a sensitivity of 81% and specificity of67%. The score correlated well with linear measurements ofMTL atrophy.31 Moreover, in 41 patients with AD and 66 non-demented controls, the subjective MTL atrophy score showed
a correct classification of 96%, slightly higher than the correctclassification given by volumetry (93%).31 In the same study,visual rating yielded a diagnostic gain over the mini-mentalstate examination (MMSE) score alone, while volumetry didnot.31 Lastly, in a prospective study of 31 patients with minorcognitive impairment, the subjective MTL atrophy score andhippocampal volume improved the predictive accuracy of ageand delayed recall score for AD at follow up.32 Although theoverall predictive accuracy of hippocampal volume measure-ment was better than that of the score (100% v 83%),qualitative rating was suggested as a good alternative.32
The sensitivity and specificity of linear measurements ofthe width of the temporal horn were investigated on coronalMR films where the measurements were taken according to astandard method (fig 3B).24 30 In 46 AD patients and 31controls, the width of the temporal horn had a sensitivity of74% in mildly and 82% in moderately severe AD patients withspecificity set at 95%.24
Subcortical cerebrovascular disease: visual ratingscalesWhen the ARWMC scale is applied on MR films, acquisitionis made by routine axial T2 weighted or (preferably) fluidattenuated inversion recovery (FLAIR) sequences. Lesions arerated similarly to CT (fig 1). The inter-rater reliability on MRwas good (k = 0.67). The scale was validated comparing thedegree and distribution of white matter changes on CT andMR films in the different areas. MR was superior fordetecting small white matter changes, whereas larger lesionswere detected equally well with both CT and MR. MRdetected significantly more white matter changes than did CTin the parieto-occipital and infratentorial areas.21
Although the ARWMC scale is a reliable tool to quantifysCVD on both CT and MR films, whether the CT or the MRversion should be preferred for clinical applications still needs
Figure 3 MR level 1 for regional atrophy: visual rating and linear measurements of the medial temporal lobe atrophy based on MR films. (A)subjective medial temporal lobe atrophy score: 0 = absent, 1 = minimal, 2 = mild, 3 = moderate, and 4 = severe.30 (B) Width of the temporal horn.24
1374 Frisoni, Scheltens, Galluzzi, et al
www.jnnp.com
group.bmj.com on May 20, 2016 - Published by http://jnnp.bmj.com/Downloaded from
to be determined. While MR is more sensitive than CT, thelatter might be preferred in clinical practice for its greaterspecificity in order to reduce false positives.33–35 Studiesare needed to compare the CT and MR based versions ofthe ARWMC scale. There are no data on the addeddiagnostic value of either the CT or MR based version ofthis scale.
MR LEVEL 2: DIGITAL WITH 3D ACQUISITION ANDMANUAL OR SEMIAUTOMATIC POST-PROCESSINGRegional atrophy: volumetric measurementsThe need for biological indicators of AD with high sensitivityand specificity is of great importance in pre-dementia formsof AD (MCI), where the clinical picture is less distinctive, theclinical diagnosis more difficult, and biological markers of thedisease might yield significant incremental diagnostic value.36
Although there are yet no studies assessing the accuracy ofdifferent techniques in the diagnosis of MCI due to AD, it islikely that MR levels 2 and 3 might be particularly useful.37
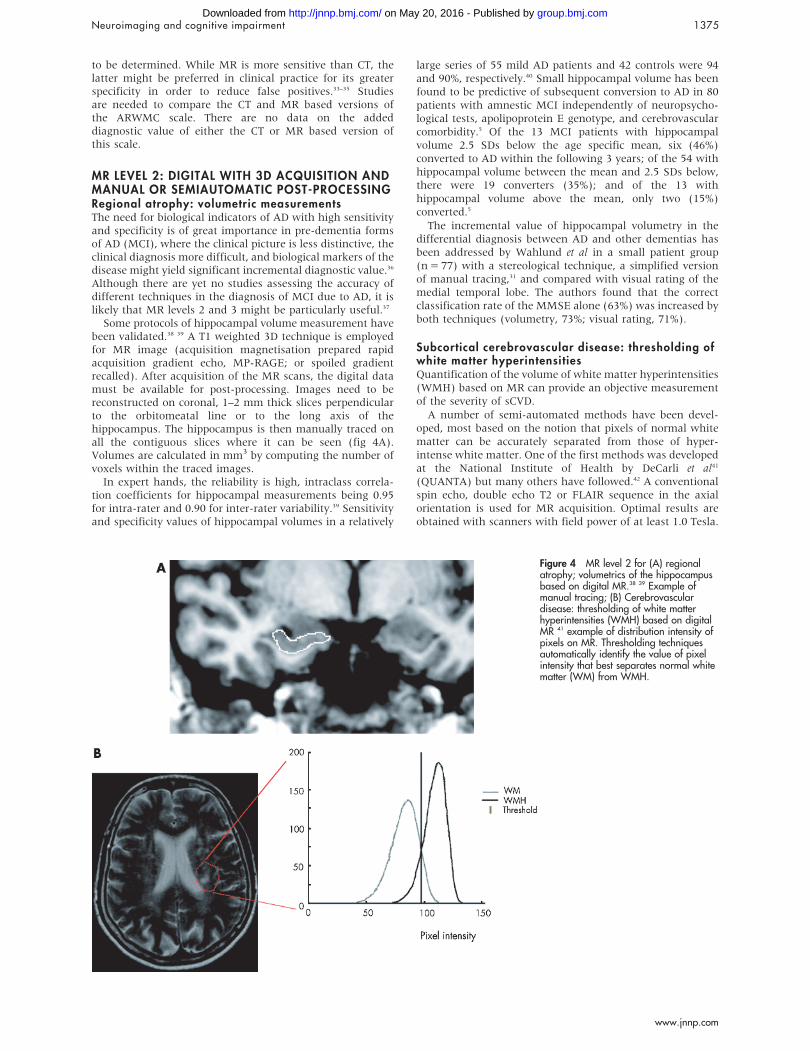
Some protocols of hippocampal volume measurement havebeen validated.38 39 A T1 weighted 3D technique is employedfor MR image (acquisition magnetisation prepared rapidacquisition gradient echo, MP-RAGE; or spoiled gradientrecalled). After acquisition of the MR scans, the digital datamust be available for post-processing. Images need to bereconstructed on coronal, 1–2 mm thick slices perpendicularto the orbitomeatal line or to the long axis of thehippocampus. The hippocampus is then manually traced onall the contiguous slices where it can be seen (fig 4A).Volumes are calculated in mm3 by computing the number ofvoxels within the traced images.
In expert hands, the reliability is high, intraclass correla-tion coefficients for hippocampal measurements being 0.95for intra-rater and 0.90 for inter-rater variability.39 Sensitivityand specificity values of hippocampal volumes in a relatively
large series of 55 mild AD patients and 42 controls were 94and 90%, respectively.40 Small hippocampal volume has beenfound to be predictive of subsequent conversion to AD in 80patients with amnestic MCI independently of neuropsycho-logical tests, apolipoprotein E genotype, and cerebrovascularcomorbidity.5 Of the 13 MCI patients with hippocampalvolume 2.5 SDs below the age specific mean, six (46%)converted to AD within the following 3 years; of the 54 withhippocampal volume between the mean and 2.5 SDs below,there were 19 converters (35%); and of the 13 withhippocampal volume above the mean, only two (15%)converted.5
The incremental value of hippocampal volumetry in thedifferential diagnosis between AD and other dementias hasbeen addressed by Wahlund et al in a small patient group(n = 77) with a stereological technique, a simplified versionof manual tracing,31 and compared with visual rating of themedial temporal lobe. The authors found that the correctclassification rate of the MMSE alone (63%) was increased byboth techniques (volumetry, 73%; visual rating, 71%).
Subcortical cerebrovascular disease: thresholding ofwhite matter hyperintensitiesQuantification of the volume of white matter hyperintensities(WMH) based on MR can provide an objective measurementof the severity of sCVD.
A number of semi-automated methods have been devel-oped, most based on the notion that pixels of normal whitematter can be accurately separated from those of hyper-intense white matter. One of the first methods was developedat the National Institute of Health by DeCarli et al41
(QUANTA) but many others have followed.42 A conventionalspin echo, double echo T2 or FLAIR sequence in the axialorientation is used for MR acquisition. Optimal results areobtained with scanners with field power of at least 1.0 Tesla.
Figure 4 MR level 2 for (A) regionalatrophy; volumetrics of the hippocampusbased on digital MR.38 39 Example ofmanual tracing; (B) Cerebrovasculardisease: thresholding of white matterhyperintensities (WMH) based on digitalMR 41 example of distribution intensity ofpixels on MR. Thresholding techniquesautomatically identify the value of pixelintensity that best separates normal whitematter (WM) from WMH.
Neuroimaging and cognitive impairment 1375
www.jnnp.com
group.bmj.com on May 20, 2016 - Published by http://jnnp.bmj.com/Downloaded from

Digital information is generally transferred for processingand analysis to a separate workstation. Measuring involvesmanual tracing followed by automatic thresholding. Manualtracing is carried out on a crudely defined region of interest(ROI) within the white matter, which completely includes allthe hyperintense white matter. Automatic segmentationcomprises the following phases: histogram representation ofthe pixel intensity distribution, Gaussian modelling of thepixel distribution separately for normal and hyperintensewhite matter, and identification of the optimal intensitycutoff to separate normal from hyperintense white matterpixels on the basis of maximum likelihood functions (fig 4B).WMH volumes are computed in cm3 by multiplying thenumber of pixels assigned to hyperintense white matter in allthe pertinent slices by the pixel volume. More automatedtechniques have also been developed.43
Intra- and inter-rater reliabilities of this method are good.41
WMH volume has been found to correlate with other featuresbelieved to be indicative of sCVD (parkinsonism anddepression) and was predictive of cognitive impairment in agroup of 369 cognitively intact community dwelling oldermen.44 There are no data on the added diagnostic value of thistool.
MR LEVEL 3: DIGITAL WITH 3D ACQUISITION,COMPUTERISED POST-PROCESSING, AND SERIALSCANSRegional atrophy: whole brain assessment with thebrain boundary shift integralSerial scans within the same subject have the advantage thatthe wide inter-individual variability of brain morphology isnot an issue, and comparing before and after images of thesame subject(s) carries much less error than comparing acase with controls. Although the method is not available forclinical use, its potential clinical applications are such thatthe practising physician should be aware of its existence.
According to the brain boundary shift integral (BBSI)algorithm developed by Fox and Freeborough,45 serial (atleast two) T1 weighted volumetric MR scans need to beacquired with a 3D technique as described in MR level 2.Serial scans are positionally matched so that differences inthe two scans can be visualised by subtracting one scan fromthe other (fig 5). An automated subtraction algorithm is thenused to measure the difference in brain volume. Brainvolume changes are measured by calculating the integral ofthe shift in the brain-cerebrospinal fluid boundary taken over
the brain surface. Volume loss is expressed as a percentage ofinitial brain volume and converted into a rate of atrophy incm3 per year.
The reproducibility of this technique is good: the mean coef-ficients of variation of brain volumes for inter- and intra-raterreproducibility were 0.55% (range 0.07–1.1%) and 0.54%(range 0.03–1.5%).46 The rate of atrophy in a group of 18 ADpatients was significantly greater than in 31 controls (2.78% v0.24% per year with no overlap between the groups).47
Moreover, the rate of global cerebral volume loss wasstrongly correlated with the rate of cognitive changemeasured with the MMSE in 29 AD patients.48 Althoughthere are no explicit data on the added diagnostic value of thetechnique, the method allowed detection of loss of braintissue in asymptomatic individuals carrying an autosomaldominant mutation known to cause AD more than 2 yearsbefore the appearance of symptoms.49 50
Although the use of the BBSI in MCI patients to predictconversion to AD is tempting, the need for prospective scansspaced at least 1 year apart and the high conversion rate insome clinical series (up to 25% per year) might lead to asignificant proportion of converters by the time the test ispositive. The technique might be more useful in trulyasymptomatic persons at high risk for AD, who might havefirst year conversion rates close to zero, such as apoE 4/4carriers or APP or presenilin mutation carriers. In fourpersons coming from families with early onset AD resultingfrom known autosomal dominant mutations (APP V717G,PS1 M139V, and PS1 intron 4), the technique was shown tobe sensitive to the volumetric reduction of the brainparenchyma more than 1 year before the onset of the mildestsymptoms and about 4 years before the patient fulfilledcriteria for AD.50
SPET/PET LEVEL 1: HARDCOPYVisual assessmentMeasurements of regional blood flow with SPET and ofregional glucose metabolism with PET can detect cerebralfunctional impairment at the cellular level and complementinformation on structural changes obtained by structuralimaging methods in the evaluation of dementia.51 14 Inconditions where a normal coupling of metabolism andperfusion can be expected, SPET can provide data reasonablycomparable to those of PET with significant cost savings.52
For 18FDG-PET, the subject should be studied in the fastedstate, and a minimum of 30 min to allow brain accumulationof the radiotracer is recommended. Other requirements(injected dose, scanning time, reconstruction, position)depend on the machine and the acquisition mode.Conditions of examination should be kept constant to allowcomparison between local normative and patient data.
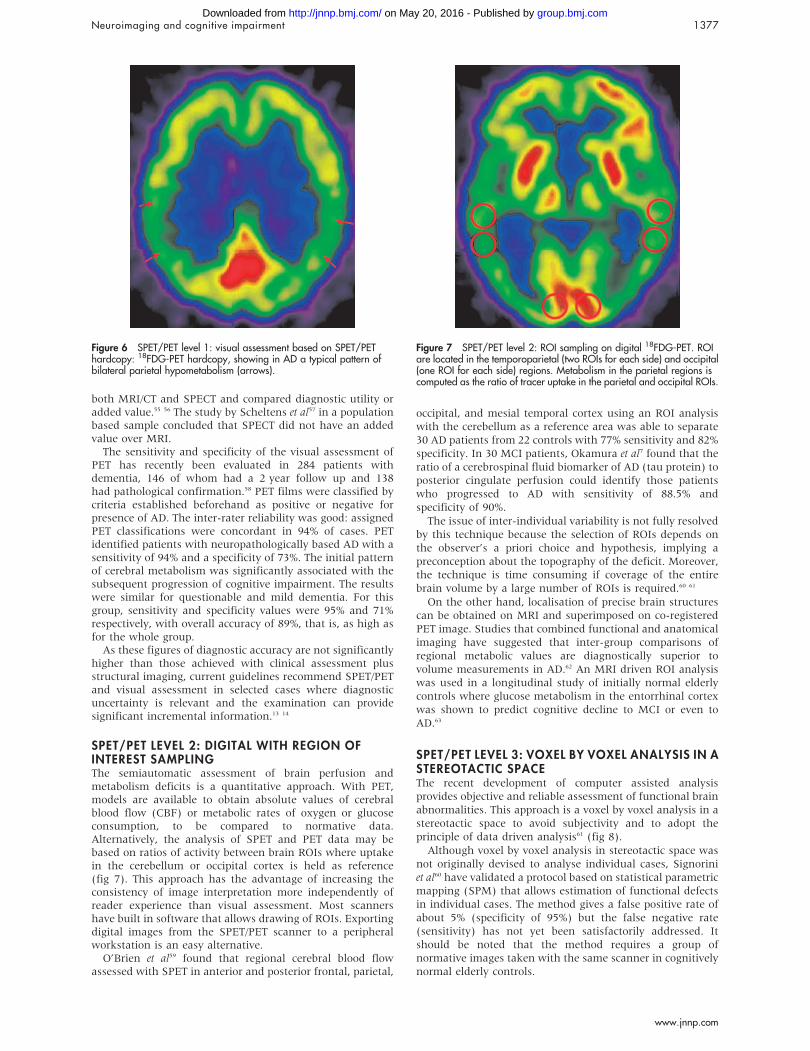
The currently used analysis method in most nuclearmedicine departments is that of subjective visual assessmentof SPET/PET colour coded hardcopies, showing in AD atypical pattern of temporoparietal hypoperfusion/hypometa-bolism (fig 6), although frontal defects are also very commoneven in the early stage.53
A clinical pathological study54 evaluated the sensitivity andspecificity of the visual assessment of SPET in 70 patientswith dementia and 70 controls. Sagittal, coronal, and axialSPET orientations were evaluated by experienced personneland rated as normal or abnormal (hypoperfused) in the lobarregion, cerebellum, and subcortical structures in each hemi-sphere. Criteria for the presence of AD were previously agreedupon to include either bilateral or asymmetric temporal orparietal lobe hypoperfusion, or both. SPET significantlyimproved the diagnostic accuracy of AD; a positive SPETscan raised the likelihood of pathological AD from 84%, asdefined by clinical diagnosis, to 92%. Few studies included
Figure 5 MR level 3 for regional atrophy: Fox and Freeborough’s brainboundary shift integral (BBSI) based on digital MR 45 greater than normalloss of atrophy over 1 year in a patient with AD (voxels marked in red).
1376 Frisoni, Scheltens, Galluzzi, et al
www.jnnp.com
group.bmj.com on May 20, 2016 - Published by http://jnnp.bmj.com/Downloaded from
both MRI/CT and SPECT and compared diagnostic utility oradded value.55 56 The study by Scheltens et al57 in a populationbased sample concluded that SPECT did not have an addedvalue over MRI.
The sensitivity and specificity of the visual assessment ofPET has recently been evaluated in 284 patients withdementia, 146 of whom had a 2 year follow up and 138had pathological confirmation.58 PET films were classified bycriteria established beforehand as positive or negative forpresence of AD. The inter-rater reliability was good: assignedPET classifications were concordant in 94% of cases. PETidentified patients with neuropathologically based AD with asensitivity of 94% and a specificity of 73%. The initial patternof cerebral metabolism was significantly associated with thesubsequent progression of cognitive impairment. The resultswere similar for questionable and mild dementia. For thisgroup, sensitivity and specificity values were 95% and 71%respectively, with overall accuracy of 89%, that is, as high asfor the whole group.
As these figures of diagnostic accuracy are not significantlyhigher than those achieved with clinical assessment plusstructural imaging, current guidelines recommend SPET/PETand visual assessment in selected cases where diagnosticuncertainty is relevant and the examination can providesignificant incremental information.13 14
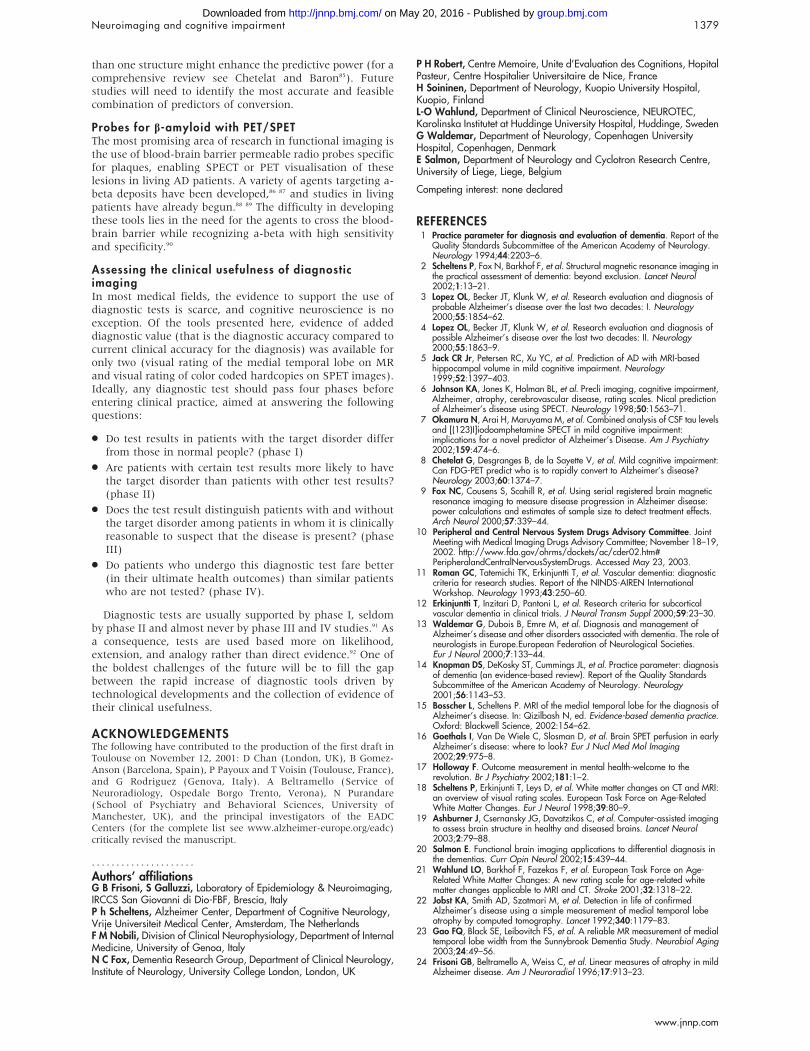
SPET/PET LEVEL 2: DIGITAL WITH REGION OFINTEREST SAMPLINGThe semiautomatic assessment of brain perfusion andmetabolism deficits is a quantitative approach. With PET,models are available to obtain absolute values of cerebralblood flow (CBF) or metabolic rates of oxygen or glucoseconsumption, to be compared to normative data.Alternatively, the analysis of SPET and PET data may bebased on ratios of activity between brain ROIs where uptakein the cerebellum or occipital cortex is held as reference(fig 7). This approach has the advantage of increasing theconsistency of image interpretation more independently ofreader experience than visual assessment. Most scannershave built in software that allows drawing of ROIs. Exportingdigital images from the SPET/PET scanner to a peripheralworkstation is an easy alternative.
O’Brien et al59 found that regional cerebral blood flowassessed with SPET in anterior and posterior frontal, parietal,
occipital, and mesial temporal cortex using an ROI analysiswith the cerebellum as a reference area was able to separate30 AD patients from 22 controls with 77% sensitivity and 82%specificity. In 30 MCI patients, Okamura et al7 found that theratio of a cerebrospinal fluid biomarker of AD (tau protein) toposterior cingulate perfusion could identify those patientswho progressed to AD with sensitivity of 88.5% andspecificity of 90%.
The issue of inter-individual variability is not fully resolvedby this technique because the selection of ROIs depends onthe observer’s a priori choice and hypothesis, implying apreconception about the topography of the deficit. Moreover,the technique is time consuming if coverage of the entirebrain volume by a large number of ROIs is required.60 61
On the other hand, localisation of precise brain structurescan be obtained on MRI and superimposed on co-registeredPET image. Studies that combined functional and anatomicalimaging have suggested that inter-group comparisons ofregional metabolic values are diagnostically superior tovolume measurements in AD.62 An MRI driven ROI analysiswas used in a longitudinal study of initially normal elderlycontrols where glucose metabolism in the entorrhinal cortexwas shown to predict cognitive decline to MCI or even toAD.63
SPET/PET LEVEL 3: VOXEL BY VOXEL ANALYSIS IN ASTEREOTACTIC SPACEThe recent development of computer assisted analysisprovides objective and reliable assessment of functional brainabnormalities. This approach is a voxel by voxel analysis in astereotactic space to avoid subjectivity and to adopt theprinciple of data driven analysis61 (fig 8).
Although voxel by voxel analysis in stereotactic space wasnot originally devised to analyse individual cases, Signoriniet al60 have validated a protocol based on statistical parametricmapping (SPM) that allows estimation of functional defectsin individual cases. The method gives a false positive rate ofabout 5% (specificity of 95%) but the false negative rate(sensitivity) has not yet been satisfactorily addressed. Itshould be noted that the method requires a group ofnormative images taken with the same scanner in cognitivelynormal elderly controls.
Figure 6 SPET/PET level 1: visual assessment based on SPET/PEThardcopy: 18FDG-PET hardcopy, showing in AD a typical pattern ofbilateral parietal hypometabolism (arrows).
Figure 7 SPET/PET level 2: ROI sampling on digital 18FDG-PET. ROIare located in the temporoparietal (two ROIs for each side) and occipital(one ROI for each side) regions. Metabolism in the parietal regions iscomputed as the ratio of tracer uptake in the parietal and occipital ROIs.
Neuroimaging and cognitive impairment 1377
www.jnnp.com
group.bmj.com on May 20, 2016 - Published by http://jnnp.bmj.com/Downloaded from

Herholz et al64 showed in a study of 395 patients with ADand 110 controls that automated PET analysis with SPMreached 93% sensitivity and specificity in the distinction ofmild to moderate AD from controls, and 84% sensitivity and93% specificity in the detection of very mild AD (MMSE.24).With another voxel based method of analysis, a metabolicpattern similar to that observed in AD was reported incognitively normal carriers of the apolipoprotein E e4 allelewith a familial history of AD, and a significant decline inglucose metabolism was observed over an interval ofapproximately 2 years.65 The authors have emphasised theavailability of PET to test the efficacy of treatments forattenuating this metabolic decline.
The usefulness of these methods in the clinical routine ispromising but there are yet no data on their added diagnosticvalue.65–67
DISCUSSIONThe sophisticated clinical questions that modern physiciansneed to answer require equally sophisticated tools andmethods. Patients with cognitive impairment have additionalcomplexity in that the clinical picture may not be sufficientlycharacteristic, brain changes are subtle, and diagnosis andmanagement would benefit from precise neuroimaginginformation. As outlined above, the dementia specialist hasa wide range of options to extract quantitative informationfrom neuroimaging examinations, which may assist in thepositive diagnosis of dementia. Options range from tools withhigh feasibility that can be used at the patient’s bedside tohighly technological tools that require trained personnel andspecific hardware and software. The quality of the obtainedinformation is obviously different, although there are yet noindications as to which tool is more useful or has the highestcost/benefit ratio in clinical practice. The dementia specialistwill thus need to match clinical requirements with techno-logical demands and local opportunities.
A number of questions remain open that will deserveattention in the near future.
The differential diagnosis of the dementias: detectingpatterns of atrophy or brain functional impairmentwith computational imagingImaging research of the last 10 years has led us to believe thatthe dementias have relatively specific imaging patterns.68
Although a detailed review is beyond the scope of this workand can be found elsewhere,15 69 a few key facts should behighlighted. Pick’s disease often shows asymmetric anteriorfrontal and/or temporal atrophy of the cortex and white
matter, with enlargement of the ventricular horns so severethat quantitative measures are superfluous. The frontalvariant of frontotemporal degeneration shows more promi-nent frontal and temporal atrophy than AD but milderhippocampal atrophy.68 Dementia with Lewy bodies showshippocampal atrophy milder than AD, no occipital lobeatrophy, and occipital SPET hypoperfusion or PET hypome-tabolism.68 70 71 The pattern of atrophy of Parkinson’s diseasewith dementia is similar to AD.39 68 Vascular dementiafeatures hippocampal atrophy less severe than AD in additionto cortical and/or subcortical signs of vascular damage.39 68
Although atrophy pattern detection might be useful diag-nostic information, to date there is no single tool that allowsdetection of the patterns in a given patient, and the physicianwill need to compound two or more of the quantitative toolsdescribed in this paper. Newly developed computerised toolsbased on high resolution MR images such as voxel basedmorphometry72 and cortical pattern matching73 allowunbiased assessment of atrophy and, with appropriatechanges to make them suitable to single case analyses,74
might be the future answer.
The clinical topographic correlates of subcorticalcerebrovascular diseaseThe high prevalence of subcortical cerebrovascular disease inpatients with AD75 and its contribution to cognitive impair-ment76 account for the development of many CT and MRbased rating tools.18 However, these have failed to enter theclinical routine for at least two reasons. First, it is not clear towhat extent some images (diffuse leukoaraiosis and patchylesions on CT, and punctate and confluent hyperintensitieson MR) denote vascular pathology. Although clinicopatholo-gical correlations are available,77 more work is clearly needed.Secondly, the clinical correlates of subcortical cerebrovasculardisease are unclear. WMH have been associated withcognitive impairment,78 parkinsonism,79 late life depression,80
and psychosis,81 but it is unclear why some patients developone rather than another syndrome. Recently, Benson et al82
have used an automated segmentation method to separatepathological from normal white matter in 16 elderly subjectswith and 12 without mobility impairment. With voxel basedmorphometry applied to WMH, they showed that frontalperiventricular WMHswere sensitive (93%) and parieto-occipital WMH were specific (100%) in detecting mobilityimpairment in this group of subjects.82 This or othercomputerised neuroanatomy techniques may help in betterunderstanding the clinical correlates of WMH.
The prediction of conversion of mild cognitiveimpairment to Alzheimer’s diseaseThree parameters are the acknowledged predictors of theconversion of MCI to AD, and two are based on imaging: lowhippocampal volume,5 hypoperfusion of the temporoparietalcortex,83 and elevated tau protein in the CSF,84 with decreaseda-beta.84 However, none of the predictors taken alone seemsto yield sufficiently satisfactory accuracy. For example, only46% of MCI patients with severe hippocampal atrophy (2.5SDs or more below the age specific mean) and 35% of thosewith minimal to moderate atrophy (from 0 to 2.5 SDs below)have converted to AD 3 years after baseline assessment.5
Compounding imaging and biological information toenhance the accuracy of the prediction seems a morepromising strategy. Okamura et al7 have studied 30 MCIpatients, 22 of whom had and eight did not have progressionof the cognitive impairment in the following 3 years, andfound that a high ratio between tau in the CSF and posteriorcingulate perfusion on SPET could identify progressors withsensitivity of 89% and specificity of 90%. Alternatively,compounding structural information on atrophy in more
Figure 8 SPET/PET level 3: voxel based analysis of PET data showingmetabolic decrease in a single AD patient compared with 21 elderlycontrols. Significant metabolic impairment (p,0.01) in superior andinferior temporal cortex is superimposed on a canonical MR picture.
1378 Frisoni, Scheltens, Galluzzi, et al
www.jnnp.com
group.bmj.com on May 20, 2016 - Published by http://jnnp.bmj.com/Downloaded from
than one structure might enhance the predictive power (for acomprehensive review see Chetelat and Baron85). Futurestudies will need to identify the most accurate and feasiblecombination of predictors of conversion.
Probes for b-amyloid with PET/SPETThe most promising area of research in functional imaging isthe use of blood-brain barrier permeable radio probes specificfor plaques, enabling SPECT or PET visualisation of theselesions in living AD patients. A variety of agents targeting a-beta deposits have been developed,86 87 and studies in livingpatients have already begun.88 89 The difficulty in developingthese tools lies in the need for the agents to cross the blood-brain barrier while recognizing a-beta with high sensitivityand specificity.90
Assessing the clinical usefulness of diagnosticimagingIn most medical fields, the evidence to support the use ofdiagnostic tests is scarce, and cognitive neuroscience is noexception. Of the tools presented here, evidence of addeddiagnostic value (that is the diagnostic accuracy compared tocurrent clinical accuracy for the diagnosis) was available foronly two (visual rating of the medial temporal lobe on MRand visual rating of color coded hardcopies on SPET images).Ideally, any diagnostic test should pass four phases beforeentering clinical practice, aimed at answering the followingquestions:
N Do test results in patients with the target disorder differfrom those in normal people? (phase I)
N Are patients with certain test results more likely to havethe target disorder than patients with other test results?(phase II)
N Does the test result distinguish patients with and withoutthe target disorder among patients in whom it is clinicallyreasonable to suspect that the disease is present? (phaseIII)
N Do patients who undergo this diagnostic test fare better(in their ultimate health outcomes) than similar patientswho are not tested? (phase IV).
Diagnostic tests are usually supported by phase I, seldomby phase II and almost never by phase III and IV studies.91 Asa consequence, tests are used based more on likelihood,extension, and analogy rather than direct evidence.92 One ofthe boldest challenges of the future will be to fill the gapbetween the rapid increase of diagnostic tools driven bytechnological developments and the collection of evidence oftheir clinical usefulness.
ACKNOWLEDGEMENTSThe following have contributed to the production of the first draft inToulouse on November 12, 2001: D Chan (London, UK), B Gomez-Anson (Barcelona, Spain), P Payoux and T Voisin (Toulouse, France),and G Rodriguez (Genova, Italy). A Beltramello (Service ofNeuroradiology, Ospedale Borgo Trento, Verona), N Purandare(School of Psychiatry and Behavioral Sciences, University ofManchester, UK), and the principal investigators of the EADCCenters (for the complete list see www.alzheimer-europe.org/eadc)critically revised the manuscript.
Authors’ affiliations. . . . . . . . . . . . . . . . . . . . .
G B Frisoni, S Galluzzi, Laboratory of Epidemiology & Neuroimaging,IRCCS San Giovanni di Dio-FBF, Brescia, ItalyP h Scheltens, Alzheimer Center, Department of Cognitive Neurology,Vrije Universiteit Medical Center, Amsterdam, The NetherlandsF M Nobili, Division of Clinical Neurophysiology, Department of InternalMedicine, University of Genoa, ItalyN C Fox, Dementia Research Group, Department of Clinical Neurology,Institute of Neurology, University College London, London, UK
P H Robert, Centre Memoire, Unite d’Evaluation des Cognitions, HopitalPasteur, Centre Hospitalier Universitaire de Nice, FranceH Soininen, Department of Neurology, Kuopio University Hospital,Kuopio, FinlandL-O Wahlund, Department of Clinical Neuroscience, NEUROTEC,Karolinska Institutet at Huddinge University Hospital, Huddinge, SwedenG Waldemar, Department of Neurology, Copenhagen UniversityHospital, Copenhagen, DenmarkE Salmon, Department of Neurology and Cyclotron Research Centre,University of Liege, Liege, Belgium
Competing interest: none declared
REFERENCES1 Practice parameter for diagnosis and evaluation of dementia. Report of the
Quality Standards Subcommittee of the American Academy of Neurology.Neurology 1994;44:2203–6.
2 Scheltens P, Fox N, Barkhof F, et al. Structural magnetic resonance imaging inthe practical assessment of dementia: beyond exclusion. Lancet Neurol2002;1:13–21.
3 Lopez OL, Becker JT, Klunk W, et al. Research evaluation and diagnosis ofprobable Alzheimer’s disease over the last two decades: I. Neurology2000;55:1854–62.
4 Lopez OL, Becker JT, Klunk W, et al. Research evaluation and diagnosis ofpossible Alzheimer’s disease over the last two decades: II. Neurology2000;55:1863–9.
5 Jack CR Jr, Petersen RC, Xu YC, et al. Prediction of AD with MRI-basedhippocampal volume in mild cognitive impairment. Neurology1999;52:1397–403.
6 Johnson KA, Jones K, Holman BL, et al. Precli imaging, cognitive impairment,Alzheimer, atrophy, cerebrovascular disease, rating scales. Nical predictionof Alzheimer’s disease using SPECT. Neurology 1998;50:1563–71.
7 Okamura N, Arai H, Maruyama M, et al. Combined analysis of CSF tau levelsand [(123)I]iodoamphetamine SPECT in mild cognitive impairment:implications for a novel predictor of Alzheimer’s Disease. Am J Psychiatry2002;159:474–6.
8 Chetelat G, Desgranges B, de la Sayette V, et al. Mild cognitive impairment:Can FDG-PET predict who is to rapidly convert to Alzheimer’s disease?Neurology 2003;60:1374–7.
9 Fox NC, Cousens S, Scahill R, et al. Using serial registered brain magneticresonance imaging to measure disease progression in Alzheimer disease:power calculations and estimates of sample size to detect treatment effects.Arch Neurol 2000;57:339–44.
10 Peripheral and Central Nervous System Drugs Advisory Committee. JointMeeting with Medical Imaging Drugs Advisory Committee; November 18–19,2002. http://www.fda.gov/ohrms/dockets/ac/cder02.htm#PeripheralandCentralNervousSystemDrugs. Accessed May 23, 2003.
11 Roman GC, Tatemichi TK, Erkinjuntti T, et al. Vascular dementia: diagnosticcriteria for research studies. Report of the NINDS-AIREN InternationalWorkshop. Neurology 1993;43:250–60.
12 Erkinjuntti T, Inzitari D, Pantoni L, et al. Research criteria for subcorticalvascular dementia in clinical trials. J Neural Transm Suppl 2000;59:23–30.
13 Waldemar G, Dubois B, Emre M, et al. Diagnosis and management ofAlzheimer’s disease and other disorders associated with dementia. The role ofneurologists in Europe.European Federation of Neurological Societies.Eur J Neurol 2000;7:133–44.
14 Knopman DS, DeKosky ST, Cummings JL, et al. Practice parameter: diagnosisof dementia (an evidence-based review). Report of the Quality StandardsSubcommittee of the American Academy of Neurology. Neurology2001;56:1143–53.
15 Bosscher L, Scheltens P. MRI of the medial temporal lobe for the diagnosis ofAlzheimer’s disease. In: Qizilbash N, ed. Evidence-based dementia practice.Oxford: Blackwell Science, 2002:154–62.
16 Goethals I, Van De Wiele C, Slosman D, et al. Brain SPET perfusion in earlyAlzheimer’s disease: where to look? Eur J Nucl Med Mol Imaging2002;29:975–8.
17 Holloway F. Outcome measurement in mental health-welcome to therevolution. Br J Psychiatry 2002;181:1–2.
18 Scheltens P, Erkinjunti T, Leys D, et al. White matter changes on CT and MRI:an overview of visual rating scales. European Task Force on Age-RelatedWhite Matter Changes. Eur J Neurol 1998;39:80–9.
19 Ashburner J, Csernansky JG, Davatzikos C, et al. Computer-assisted imagingto assess brain structure in healthy and diseased brains. Lancet Neurol2003;2:79–88.
20 Salmon E. Functional brain imaging applications to differential diagnosis inthe dementias. Curr Opin Neurol 2002;15:439–44.
21 Wahlund LO, Barkhof F, Fazekas F, et al. European Task Force on Age-Related White Matter Changes: A new rating scale for age-related whitematter changes applicable to MRI and CT. Stroke 2001;32:1318–22.
22 Jobst KA, Smith AD, Szatmari M, et al. Detection in life of confirmedAlzheimer’s disease using a simple measurement of medial temporal lobeatrophy by computed tomography. Lancet 1992;340:1179–83.
23 Gao FQ, Black SE, Leibovitch FS, et al. A reliable MR measurement of medialtemporal lobe width from the Sunnybrook Dementia Study. Neurobiol Aging2003;24:49–56.
24 Frisoni GB, Beltramello A, Weiss C, et al. Linear measures of atrophy in mildAlzheimer disease. Am J Neuroradiol 1996;17:913–23.
Neuroimaging and cognitive impairment 1379
www.jnnp.com
group.bmj.com on May 20, 2016 - Published by http://jnnp.bmj.com/Downloaded from

25 Denihan A, Wilson G, Cunningham C, et al. CT measurement of medialtemporal lobe atrophy in Alzheimer’s disease, vascular dementia, depressionand paraphrenia. Int J Geriatr Psychiatry 2000;15:306–12.
26 Jobst KA, Smith AD, Szatmari M, et al. Rapidly progressing atrophy of medialtemporal lobe in Alzheimer’s disease. Lancet 1994;343:829–30.
27 Frisoni GB, Geroldi C, Beltramello A, et al. Radial width of the temporal horn:a sensitive measure in Alzheimer disease. Am J Neuroradiol 2002;23:35–47.
28 Laakso MP, Frisoni GB, Kononen M, et al. Hippocampus and entorhinalcortex in frontotemporal dementia. A qualitative MRI study. Biol Psychiatry2000;47:1056–63.
29 Frisoni GB, Rossi R, Beltramello A. The radial width of the temporal horn inmild cognitive impairment. J Neuroimaging 2002;12:351–4.
30 Scheltens P, Leys D, Barkhof F, et al. Atrophy of medial temporal lobes on MRIin ‘‘probable’’ Alzheimer’s disease and normal ageing: diagnostic value andneuropsychological correlates. J Neurol Neurosurg Psychiatry1992;55:967–72.
31 Wahlund LO, Julin P, Johansson SE, et al. Visual rating and volumetry of themedial temporal lobe on magnetic resonance imaging in dementia: acomparative study. J Neurol Neurosurg Psychiatry 2000;69:630–5.
32 Visser PJ, Verhey FR, Hofman PA, et al. Medial temporal lobe atrophypredicts Alzheimer’s disease in patients with minor cognitive impairment.J Neurol Neurosurg Psychiatry 2002;72:491–7.
33 Rockwood K, Parhad I, Hachinski V, et al. Diagnosis of vascular dementia:Consortium of Canadian Centres for Clinical Cognitive Research concensusstatement. Can J Neurol Sci 1994;21:358–64.
34 Lopez OL, Becker JT, Jungreis CA, et al. Computed tomography–but notmagnetic resonance imaging–identified periventricular white-matter lesionspredict symptomatic cerebrovascular disease in probable Alzheimer’sdisease. Arch Neurol 1995;52:659–64.
35 Pantoni L, Leys D, Fazekas F, et al. Role of white matter lesions in cognitiveimpairment of vascular origin. Alzheimer Dis Assoc Disord 1999;13(Suppl3):S49–54.
36 Frisoni GB, Padovani A, Wahlund LO. The diagnosis of Alzheimer’s diseasebefore it is Alzheimer’s dementia. Arch Neurol 2003, in press.
37 Du AT, Schuff N, Amend D, et al. Magnetic resonance imaging of theentorhinal cortex and hippocampus in mild cognitive impairment andAlzheimer’s disease. J Neurol Neurosurg Psychiatry 2001;71:441–7.
38 Jack CR Jr, Bentley MD, Twomey CK, et al. MR imaging-based volumemeasurements of the hippocampal formation and anterior temporal lobe:validation studies. Radiology 1990;176:205–9.
39 Laakso MP, Partanen K, Riekkinen P, et al. Hippocampal volumes inAlzheimer’s disease, Parkinson’s disease with and without dementia, and invascular dementia: An MRI study. Neurology 1996;46:678–81.
40 Laakso MP, Soininen H, Partanen K, et al. MRI of the hippocampus inAlzheimer’s disease: sensitivity, specificity, and analysis of the incorrectlyclassified subjects. Neurobiol Aging 1998;19:23–31.
41 DeCarli C, Maisog J, Murphy DG, et al. Method for quantification of brain,ventricular, and subarachnoid CSF volumes from MR images. J Comput AssistTomogr 1992;16:274–84.
42 Ge Y, Grossman RI, Babb JS, et al. Age-related total gray matter and whitematter changes in normal adult brain. Part I: volumetric MR imaging analysis,AJNR Am J Neuroradiol 2002;23:1327–33.
43 Smith SM, Zhang Y, Jenkinson M, et al. Accurate, robust, and automatedlongitudinal and cross-sectional brain change analysis. Neuroimage2002;17:479–89.
44 DeCarli C, Miller BL, Swan GE, et al. Cerebrovascular and brain morphologiccorrelates of mild cognitive impairment in the National Heart, Lung, and BloodInstitute Twin Study. Arch Neurol 2001;58:643–7.
45 Fox NC, Freeborough PA, Rossor MN. Visualisation and quantification ofrates of atrophy in Alzheimer’s disease. Lancet 1996;348:94–7.
46 Chan D, Fox NC, Jenkins R, et al. Rates of global and regional cerebralatrophy in AD and frontotemporal dementia. Neurology 2001;57:1756–63.
47 Fox NC, Freeborough PA. Brain atrophy progression measured fromregistered serial MRI: validation and application to Alzheimer’s disease.J Magn Reson Imaging 1997;7:1069–75.
48 Fox NC, Scahill RI, Crum WR, et al. Correlation between rates of brainatrophy and cognitive decline in AD. Neurology 1999;52:1687–9.
49 Fox NC, Warrington EK, Freeborough PA, et al. Presymptomatichippocampal atrophy in Alzheimer’s disease. A longitudinal MRI study. Brain1996;119:2001–7.
50 Fox NC, Crum WR, Scahill RI, et al. Imaging of onset and progression ofAlzheimer’s disease with voxel-compression mapping of serial magneticresonance images. Lancet 2001;358:201–5.
51 Perani D. The role of emission tomography in dementia. Ital J Neurol Sci1999;20(Suppl 5):S254–7.
52 Messa C, Perani D, Lucignani G, et al. High-resolution technetium-99m-HMPAO SPECT in patients with probable Alzheimer’s disease: comparisonwith fluorine-18-FDG PET. J Nucl Med 1994;35:210–16.
53 Waldemar G, Bruhn P, Kristensen M, et al. Heterogeneity of neocorticalcerebral blood flow deficits in dementia of the Alzheimer type: a [99mTc]-d,l-HMPAO SPECT study. J Neurol Neurosurg Psychiatry 1994;57:285–95.
54 Jagust W, Thisted R, Devous MD Sr, et al. SPECT perfusion imaging in thediagnosis of Alzheimer’s disease: a clinical-pathologic study. Neurology2001;56:950–6.
55 Pearlson GD, Harris GJ, Powers RE, et al. Quantitative changes in mesialtemporal volume, regional cerebral blood flow, and cognition in Alzheimer’sdisease. Arch Gen Psychiatry 1992;49:402–8.
56 Jobst KA, Smith AD, Barker CS, et al. Association of atrophy of the medialtemporal lobe with reduced blood flow in the posterior parietotemporal cortexin patients with a clinical and pathological diagnosis of Alzheimer’s disease.J Neurol Neurosurg Psychiatry 1992;55:190–4.
57 Scheltens P, Launer LJ, Barkhof F, et al. The diagnostic value of magneticresonance imaging and technetium 99 m-HMPAO single-photon-emissioncomputed tomography for the diagnosis of Alzheimer disease in a community-dwelling elderly population. Alzheimer Dis Assoc Disord 1997;11:63–70.
58 Silverman DH, Small GW, Chang CY, et al. Positron emission tomography inevaluation of dementia: Regional brain metabolism and long-term outcome.JAMA 2001;286:2120–7.
59 O’Brien JT, Ames D, Desmond P, et al. Combined magnetic resonanceimaging and single-photon emission tomography scanning in thediscrimination of Alzheimer’s disease from age-matched controls. IntPsychogeriatr 2001;13:149–61.
60 Signorini M, Paulesu E, Friston K, et al. Rapid assessment of regional cerebralmetabolic abnormalities in single subjects with quantitative andnonquantitative [18F]FDG PET: A clinical validation of statistical parametricmapping. Neuroimage 1999;9:63–80.
61 Matsuda H. Cerebral blood flow and metabolic abnormalities in Alzheimer’sdisease. Ann Nucl Med 2001;15:85–92.
62 De Santi S, de Leon MJ, Rusinek H, et al. Hippocampal formation glucosemetabolism and volume losses in MCI and AD. Neurobiol Aging2001;22:529–39.
63 de Leon MJ, Convit A, Wolf OT, et al. Prediction of cognitive decline innormal elderly subjects with 2-[(18)F]fluoro-2-deoxy-D-glucose/positron-emission tomography (FDG/PET). Proc Natl Acad Sci USA2001;98:10966–71.
64 Herholz K, Salmon E, Perani D, et al. Discrimination between Alzheimerdementia and controls by automated analysis of multicenter FDG PET.Neuroimage 2002;17:302–16.
65 Reiman EM, Caselli RJ, Chen K, et al. Declining brain activity in cognitivelynormal apolipoprotein E epsilon 4 heterozygotes: A foundation for usingpositron emission tomography to efficiently test treatments to preventAlzheimer’s disease. Proc Natl Acad Sci USA 2001;98:3334–9.
66 Van Laere KJ, Warwick J, Versijpt J, et al. Analysis of clinical brain SPECTdata based on anatomic standardization and reference to normal data: anROC-based comparison of visual, semiquantitative, and voxel-basedmethods. J Nucl Med 2002;43:458–69.
67 Nobili F, Koulibaly M, Vitali P, et al. Brain perfusion follow-up in Alzheimer’spatients during treatment with acetylcholinesterase inhibitors. J Nucl Med2002;43:983–90.
68 Frisoni GB. Structural imaging in the clinical diagnosis of Alzheimer’s disease:problems and tools. J Neurol Neurosurg Psychiatry 2001;70:711–18.
69 Fontaine S, Bourgouin P. Structural brain imaging in Alzheimer’s disease. In:Gauthier S, ed. Clinical diagnosis and management of Alzheimer’s disease.London: Martin Dunitz, 1999:107–16.
70 Lobotesis K, Fenwick JD, Phipps A, et al. Occipital hypoperfusion on SPECT indementia with Lewy bodies but not AD. Neurology 2001;56:643–9.
71 Middelkoop HA, van der Flier WM, Burton EJ, et al. Dementia with Lewybodies and AD are not associated with occipital lobe atrophy on MRI.Neurology 2001;57:2117–20.
72 Ashburner J, Friston KJ. Voxel-based morphometry – the methods.Neuroimage 2000;14:805–21.
73 Thompson PM, Mega MS, Toga AW. Disease-specific brain atlases. In:Toga AW, Mazziotta JC, eds. Brain mapping: the disorders. Academic Press,2000:131–77.
74 Woermann FG, Free SL, Koepp MJ, Ashburner J, et al. Voxel-by-voxelcomparison of automatically segmented cerebral gray matter–a rater-independent comparison of structural MRI in patients with epilepsy.NeuroImage 1999;10:373–84.
75 Neuropathology Group. Medical Research Council Cognitive Function andAging Study. Pathological correlates of late-onset dementia in a multicentre,community-based population in England and Wales.Neuropathology Groupof the Medical Research Council Cognitive Function and Ageing Study (MRCCFAS). Lancet 2001;357:169–75.
76 Snowdon DA, Greiner LH, Mortimer JA, et al. Brain infarction and the clinicalexpression of Alzheimer disease. The Nun Study. JAMA 1997;277:813–7.
77 Fazekas F, Kleinert R, Offenbacher H, et al. Pathologic correlates of incidentalMRI white matter signal hyperintensities. Neurology 1993;43:1683–9.
78 DeCarli C, Murphy DG, Tranh M, et al. The effect of white matterhyperintensity volume on brain structure, cognitive performance, and cerebralmetabolism of glucose in 51 healthy adults. Neurology 1995;45:2077–84.
79 Zijlmans JC, Thijssen HO, Vogels OJ, et al. MRI in patients with suspectedvascular parkinsonism. Neurology 1995;45:2183–8.
80 O’Brien J, Ames D, Chiu E, et al. Severe deep white matter lesions andoutcome in elderly patients with major depressive disorder: follow up study.BMJ 1998;317:982–4.
81 Tonkonogy JM, Geller JL. Late-onset paranoid psychosis as a distinctclinicopathologic entity: magnetic resonance imaging data in elderly patientswith paranoid psychosis of late onset and schizophrenia of early onset.Neuropsychiatry Neuropsychol Behav Neurol 1999;12:230–5.
82 Benson RR, Guttmann CR, Wei X, et al. Older people with impaired mobilityhave specific loci of periventricular abnormality on MRI. Neurology2002;58:48–55.
83 Arnaiz E, Jelic V, Almkvist O, et al. Impaired cerebral glucose metabolism andcognitive functioning predict deterioration in mild cognitive impairment.Neuroreport 2001;12:851–5.
84 Riemenschneider M, Lautenschlager N, Wagenpfeil S, et al. Cerebrospinalfluid tau and beta-amyloid 42 proteins identify Alzheimer disease in subjectswith mild cognitive impairment. Arch Neurol 2002;59:1729–34.
85 Chetelat G, Baron J-C. Early diagnosis of Alzheimer’s disease: contribution ofstructural neuroimaging. NeuroImage 2003;18:525–41.
1380 Frisoni, Scheltens, Galluzzi, et al
www.jnnp.com
group.bmj.com on May 20, 2016 - Published by http://jnnp.bmj.com/Downloaded from

86 Klunk WE, Wang Y, Huang GF, et al. The binding of 2-(49-methylaminophenyl)benzothiazole to postmortem brain homogenates isdominated by the amyloid component. J Neurosci 2003;23:2086–92.
87 Skovronsky DM, Zhang B, Kung MP, et al. In vivo detection of amyloidplaques in a mouse model of Alzheimer’s disease. Proc Natl Acad Sci USA2000;97:7609–14.
88 Shoghi-Jadid K, Small GW, Agdeppa ED, et al. Localization of neurofibrillarytangles and beta-amyloid plaques in the brains of living patients withAlzheimer disease. Am J Geriatr Psychiatry 2002;10:24–35.
89 Petrella JR, Coleman RE, Doraiswamy PM. Neuroimaging and earlydiagnosis of Alzheimer disease: a look to the future. Radiology2003;226:315–36.
90 Small GW, Agdeppa ED, Kepe V, et al. In vivo brain imaging of tangleburden in humans. J Mol Neurosci 2002;19:323–7.
91 Sackett DL, Haynes RB. The architecture of diagnostic research. BMJ2002;324:539–41.
92 Hillman BJ. Medical imaging in the 21st century. Lancet 1997;350:731–3.
NEURONLINE . . . . . . . . . . . . . . . . . . . . . . . . . . . . . . . . . . . . . . . . . . . . . . . . . . . . . . . . . . . . . . . . . . . . . . . . . . . . . . . . . . . . . . . . . . . . . . . . . . . .
Clinical neurophysiology on the internet: www.neurophys.com
Straightforwardly, this website,www.neurophys.com pitches itselfas ‘‘clinical neurophysiology on the
internet’’. It does indeed cover thespectrum of neurophysiology from basicscience to neurophysiology on throughto clinical practice; however, there isclearly more of an emphasis on thephysiology of the nervous system thanon what we now accept as the realm of
clinical neurophysiology and its quanti-tative analysis of the nervous system.
There is some useful coverage offundamental neurophysiological princi-ples and neuroanatomy and its func-tional components with concise text andclear diagrammatic representations.This is helpful from an educationalpoint of view and providing a refresherof those neural pathways that you know
you should know. There are manyuseful links to the relevant neurophy-siological organisations, institutions,and journals. This site, however, appearsto rely on the array of various linksrather than on its own intrinsic content.
There is an attempt at comprehensivecoverage of EEG, EMG, and evokedpotentials, but overall the depth ofinformation available is limited. Use ofthe search engine for such topics asalpha coma and neuromyotonia wasalso disappointing.
The basic requirements of a good anduseful site are its design and layout,allowing easy use and retaining theuser’s focus while also providing thor-ough coverage of the subject matter. Onboth counts I found this site somewhatlacking. The graphics are dated andsome interactive content would be help-ful. There are also an annoying numberof broken links. The information avail-able is limited, with whole areas, suchas intraoperative monitoring and sleep,receiving scant attention.
Overall I found the site of limitedinterest. The positive aspects being inneurophysiological theory rather thanits treatment of clinical matters ofpractical interest and concern to theclinical neurophysiologist or neurol-ogist.
R MacDonaghDepartment of Clinical Neurophysiology, Leeds
General Infirmary, Leeds LS17 8TP, UK;[email protected]
Neuroimaging and cognitive impairment 1381
www.jnnp.com
group.bmj.com on May 20, 2016 - Published by http://jnnp.bmj.com/Downloaded from

www.neurophys.comClinical neurophysiology on the internet:
R MacDonagh
doi: 10.1136/jnnp.74.10.13812003 74: 1381 J Neurol Neurosurg Psychiatry
http://jnnp.bmj.com/content/74/10/1381Updated information and services can be found at:
These include:
serviceEmail alerting
box at the top right corner of the online article. Receive free email alerts when new articles cite this article. Sign up in the
CollectionsTopic Articles on similar topics can be found in the following collections
(21)JNNP Internet
Notes
http://group.bmj.com/group/rights-licensing/permissionsTo request permissions go to:
http://journals.bmj.com/cgi/reprintformTo order reprints go to:
http://group.bmj.com/subscribe/To subscribe to BMJ go to:
group.bmj.com on May 20, 2016 - Published by http://jnnp.bmj.com/Downloaded from
Related Documents