Neurocognitive Impairment Due to Early Life Arsenic Exposure Joseph Graziano, PhD Professor of Environmental Health Sciences And Pharmacology Mailman School of Public Health Columbia University

Welcome message from author
This document is posted to help you gain knowledge. Please leave a comment to let me know what you think about it! Share it to your friends and learn new things together.
Transcript

Neurocognitive Impairment Due to Early Life Arsenic Exposure
Joseph Graziano, PhDProfessor of Environmental Health Sciences
And PharmacologyMailman School of Public Health
Columbia University

Seminar Outline
• Background: Arsenicosis in Bangladesh
• Our Prospective Cohort Study in Adults
• Consequences of As Exposure in Children
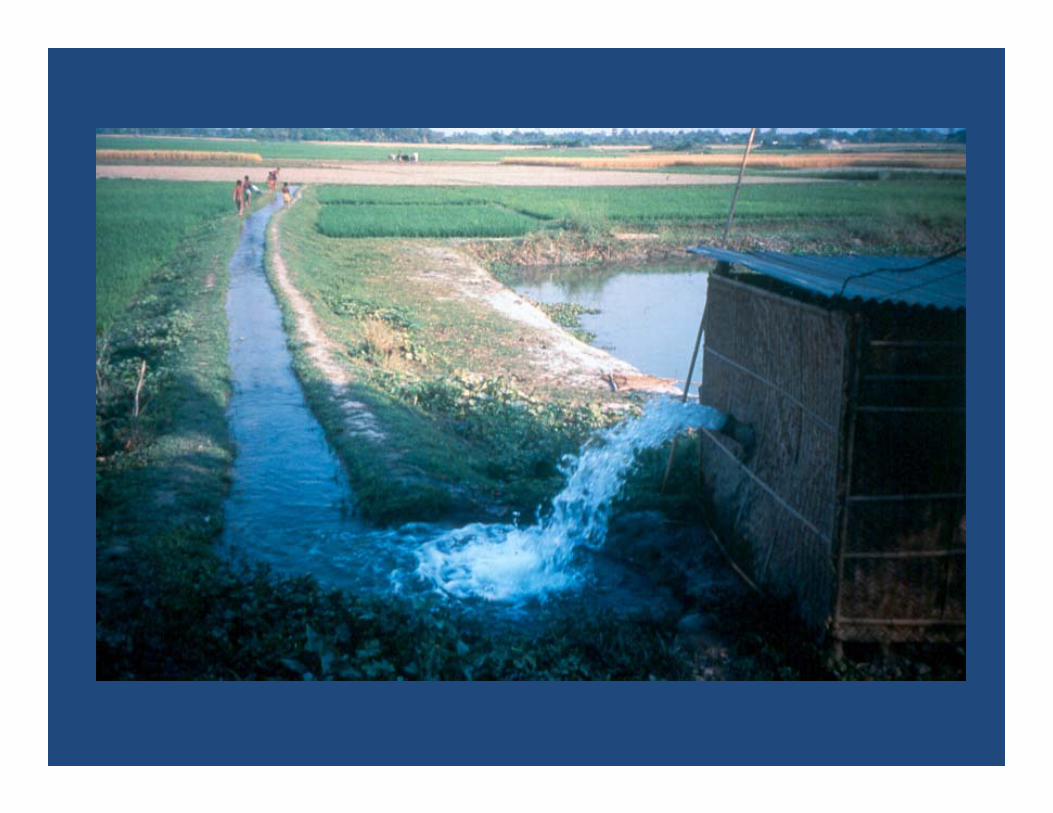
History of Arsenic Problem in Bangladesh1960’s‐70’s 1 million tube‐wells installed by UNICEF
1970’s‐80’s 3‐4 million tube‐wells installed privately97% of population drink tube‐well water
1993‐94 Patients with arsenicosis diagnosed
1996‐97 Arsenic detected in tube‐well water.10 million tube wells now in use.25‐40 million people estimated to have been exposedRecognized as major public health problem
2000 Launch of the Health Effects of Arsenic Longitudinal Study (HEALS)
2009‐12 Bangladesh government adopts a rural deep well drilling program

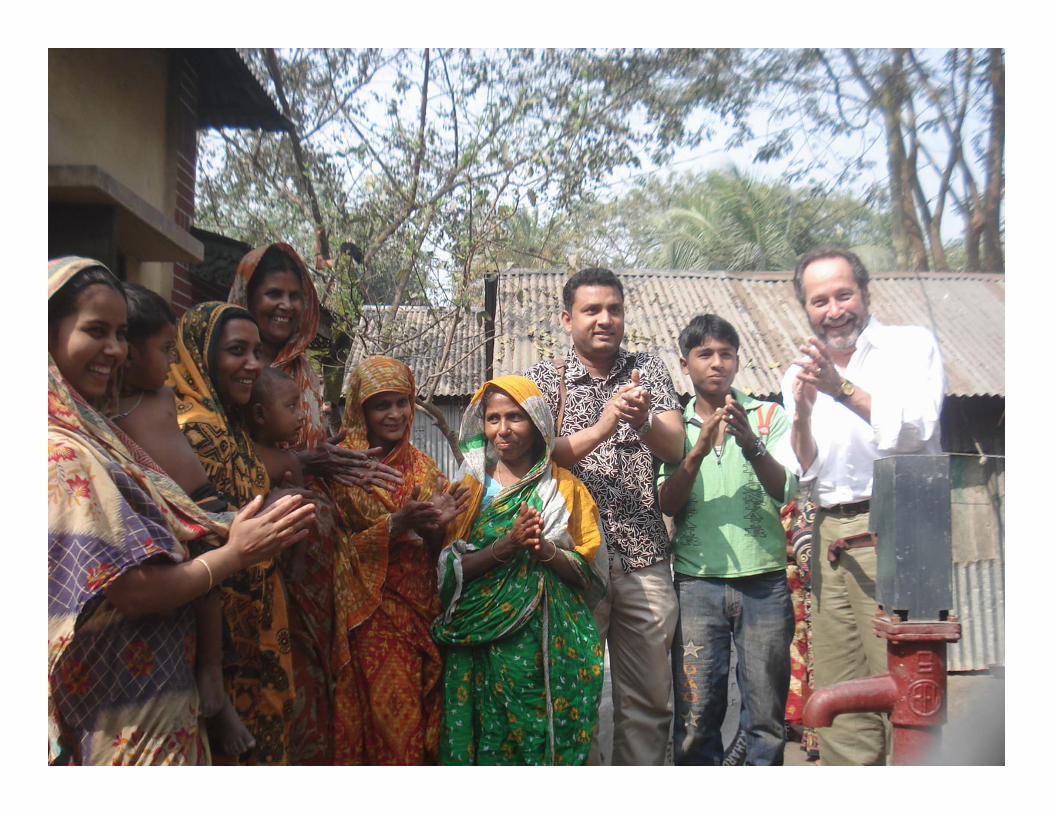
Tube wells are the major source of drinking water in Bangladesh and many other developing countries
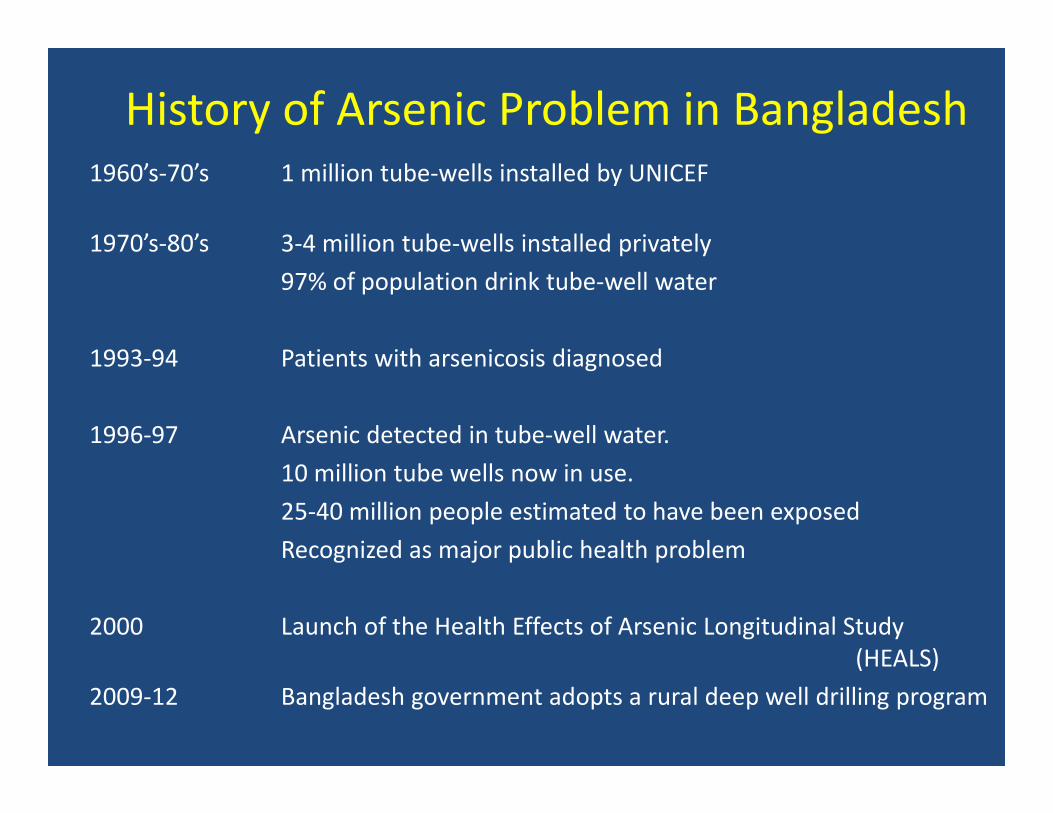
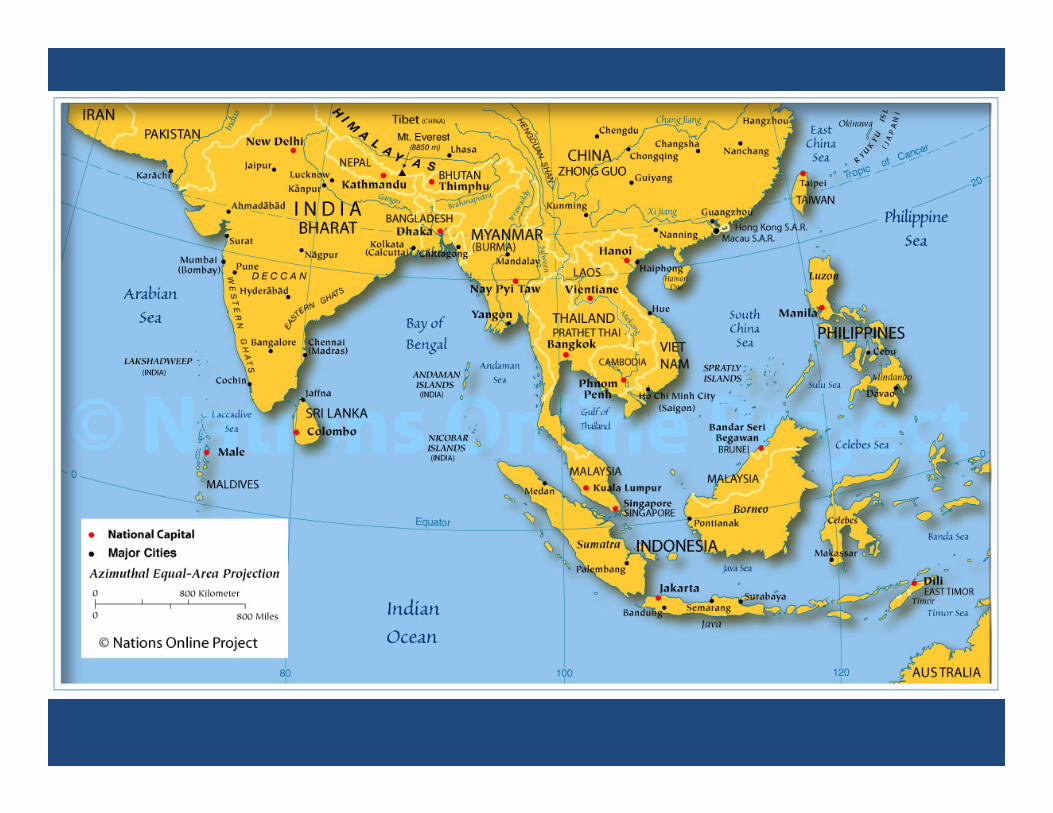
Arsenic in Groundwater: An International Problem
• Taiwan• China• Chile• Argentina• Mexico• United States
• India• Bangladesh• Nepal• Vietnam• Cambodia• Mongolia• Myanmar
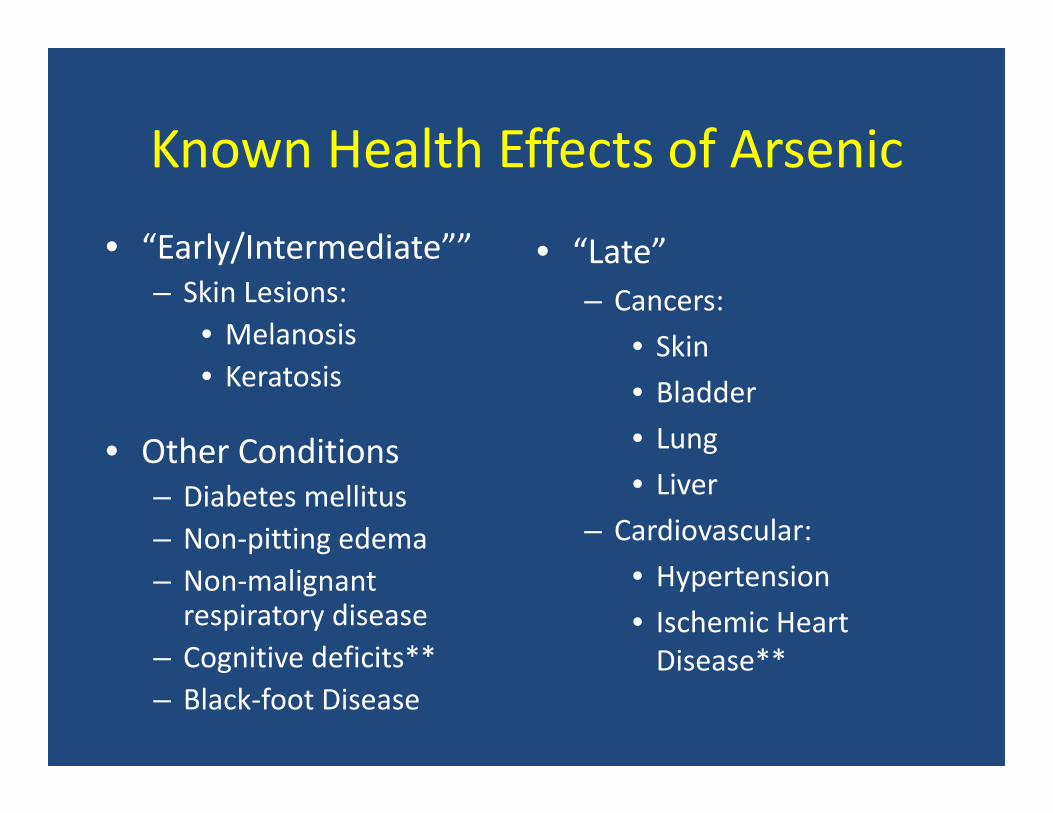
Known Health Effects of Arsenic• “Early/Intermediate””
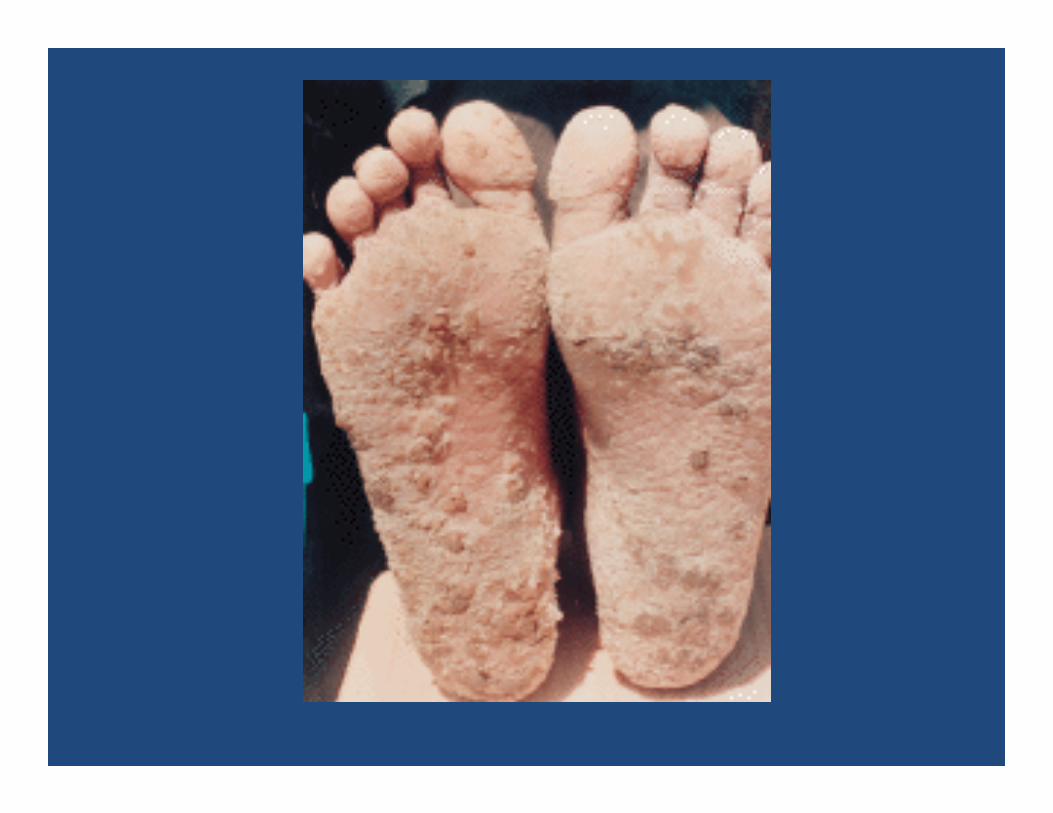
– Skin Lesions:• Melanosis• Keratosis
• Other Conditions– Diabetes mellitus– Non‐pitting edema– Non‐malignant respiratory disease
– Cognitive deficits**– Black‐foot Disease
• “Late”– Cancers:
• Skin• Bladder• Lung• Liver
– Cardiovascular:• Hypertension• Ischemic Heart Disease**
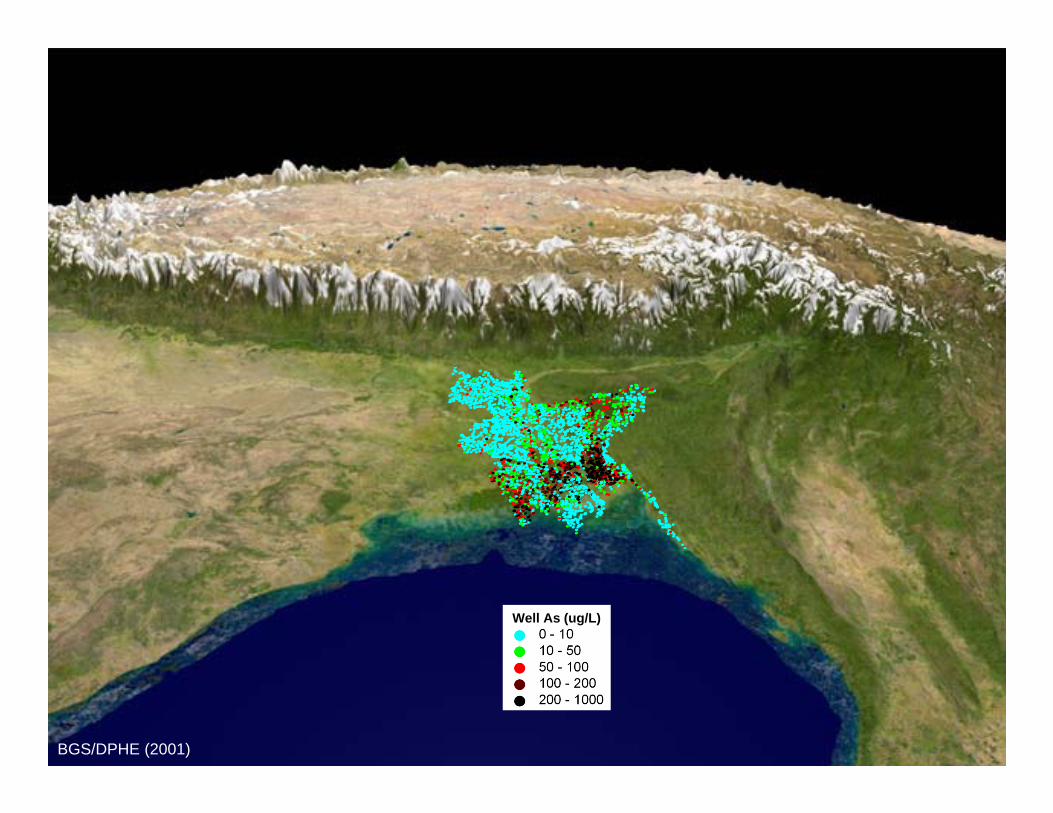
Well As (ug/L)
BGS/DPHE (2001)

0
200
400
600
800
1000
0 500 1000Well As (ug/L)
Dep
th (f
t)


Arsenic in 5,966 wells
Baseline
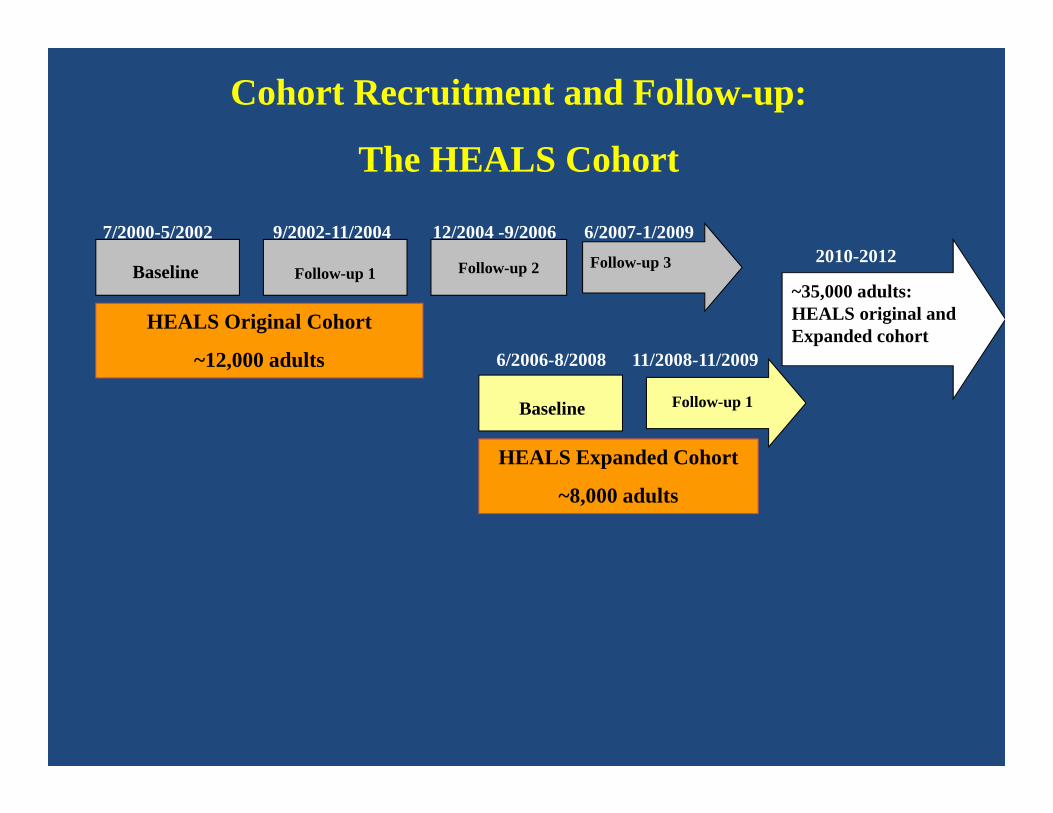
Cohort Recruitment and Follow-up:
The HEALS Cohort
Follow-up 1
7/2000-5/2002 9/2002-11/2004 12/2004 -9/2006 6/2007-1/2009Follow-up 3
HEALS Original Cohort
~12,000 adults 6/2006-8/2008 11/2008-11/2009
Follow-up 2
Baseline Follow-up 1
HEALS Expanded Cohort
~8,000 adults
2010-2012
~35,000 adults:HEALS original andExpanded cohort

Baseline
Cohort Recruitment and Follow-up
Follow-up 1
7/2000-5/2002 9/2002-11/2004 12/2004 -9/2006 6/2007-1/2009Follow-up 3
HEALS Original Cohort
~12,000 adults 6/2006-8/2008 11/2008-11/2009
Follow-up 2
Baseline Follow-up 1
HEALS Expanded Cohort
~8,000 adults
2010-2012
~35,000 adults:HEALS original andExpanded cohort
113 deaths 120 deaths 174 deaths
A validated verbal autopsy was used to classify deaths using WHO’s ICD-10

Table 2. Hazard ratio for mortality of HEALS participants in relation to baseline arsenic exposure, Bangladesh
Arsenic exposure No. of deaths
All-cause mortality* No. of
deathsChronic disease mortality*
HR 95% CI HR 95% CIWell water arsenic (μg/L)
0.1–10 74 1.00 Referent 58 1.00 Referent10.1–50 90 1.34 0.99, 1.82 69 1.33 0.94, 1.8750.1–150 98 1.09 0.81, 1.47 83 1.22 0.87, 1.70150.1–854 131 1.68 1.26, 2.23 101 1.68 1.21, 2.33
P for trend 0.003 0.005
Daily arsenic dose (μg/day)0.041–35.0 87 1.00 Referent 66 1.00 Referent35.1–163.0 97 1.10 0.83, 1.47 80 1.21 0.88, 1.67163.1–401.0 91 1.09 0.81, 1.46 76 1.22 0.88, 1.71401.1–4898.0 118 1.54 1.17, 2.04 89 1.58 1.15, 2.18
P for trend 0.004 0.007
Urinary total arsenic (μg/g Cr)7.0–105.0 83 1.00 Referent 64 1.00 Referent105.1–199.0 96 1.07 0.80, 1.43 80 1.17 0.84, 1.62199.1–352.0 100 1.22 0.91, 1.63 83 1.37 0.98, 1.90352.1–5000.0 105 1.45 1.09, 1.94 77 1.47 1.05, 2.06
P for trend 0.008 0.01HR=hazard ratio; CI=confidence interval; Cr=creatinine.* Multivariate estimates adjusted for age, sex, body mass index, systolic blood pressure, education, and smoking status.
All‐cause and chronic disease mortality
Argos et al, Lancet 376: 252-8, 2010


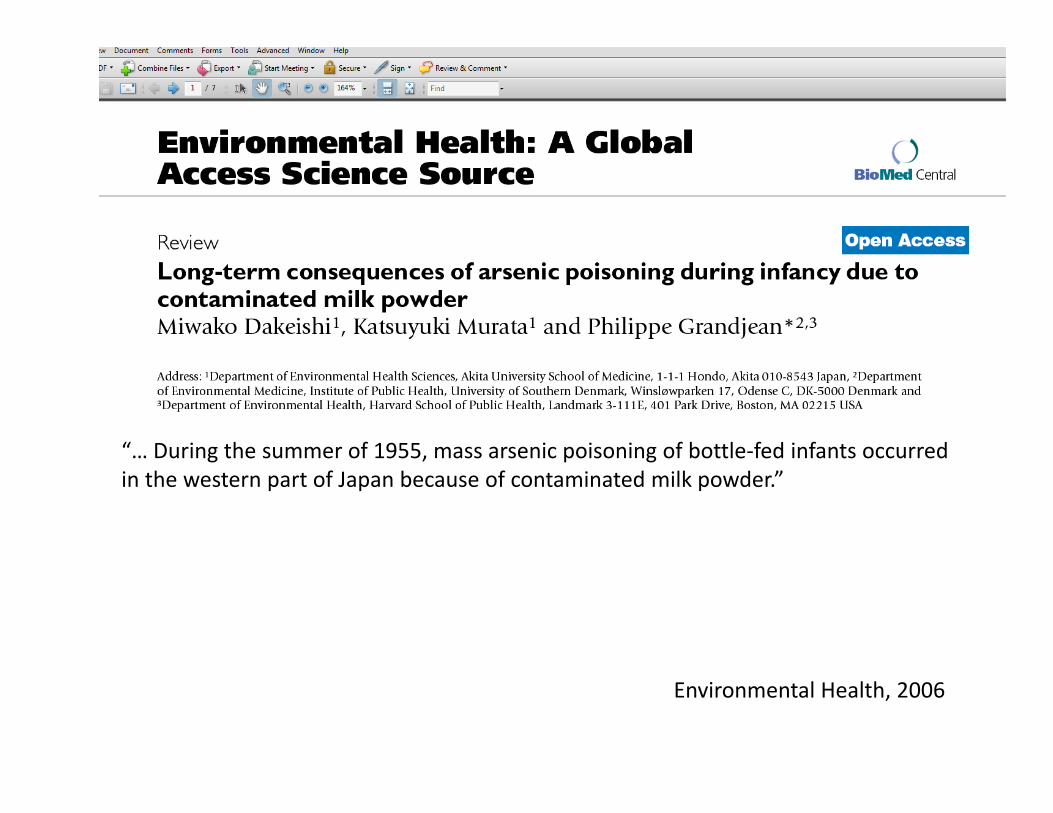
“… During the summer of 1955, mass arsenic poisoning of bottle‐fed infants occurred in the western part of Japan because of contaminated milk powder.”
Environmental Health, 2006
“…This experience provides clear‐cut evidence for….developmental neurotoxicity. At the present time, more than 600 surviving victims, now in their 50s, have been reported to suffer from….mental retardation, neurological diseases and other disabilities.”
Environmental Health, 2006
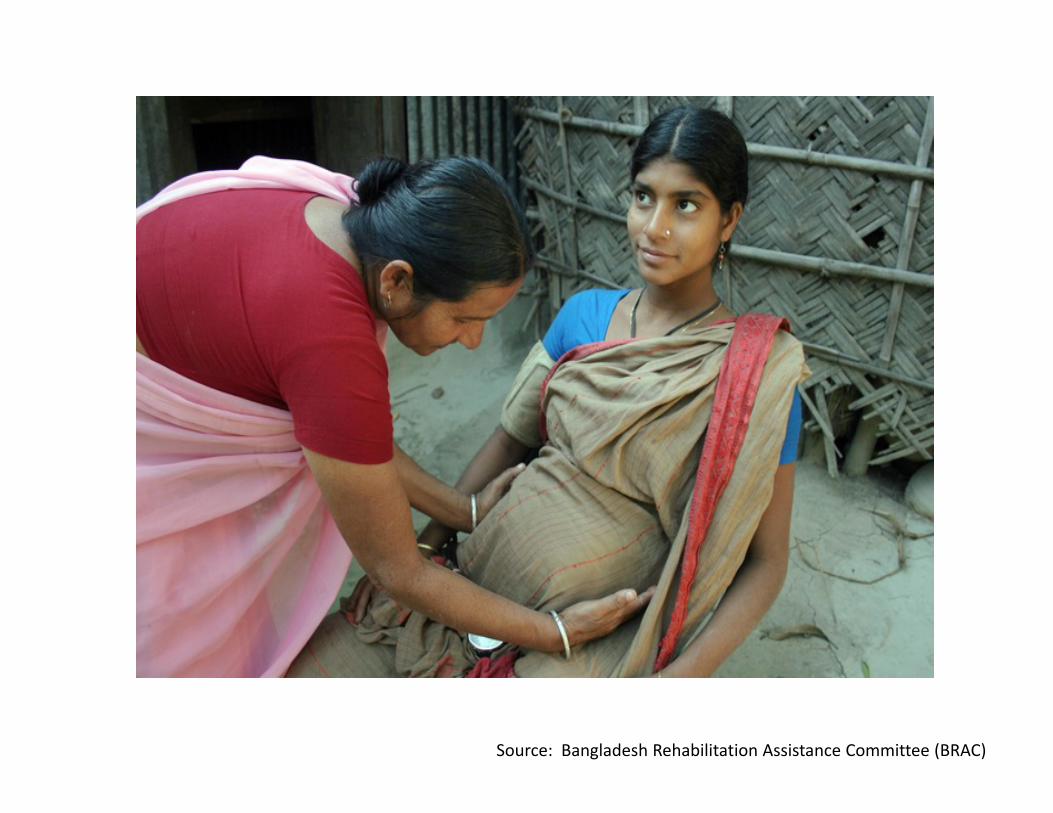
Source: Bangladesh Rehabilitation Assistance Committee (BRAC)
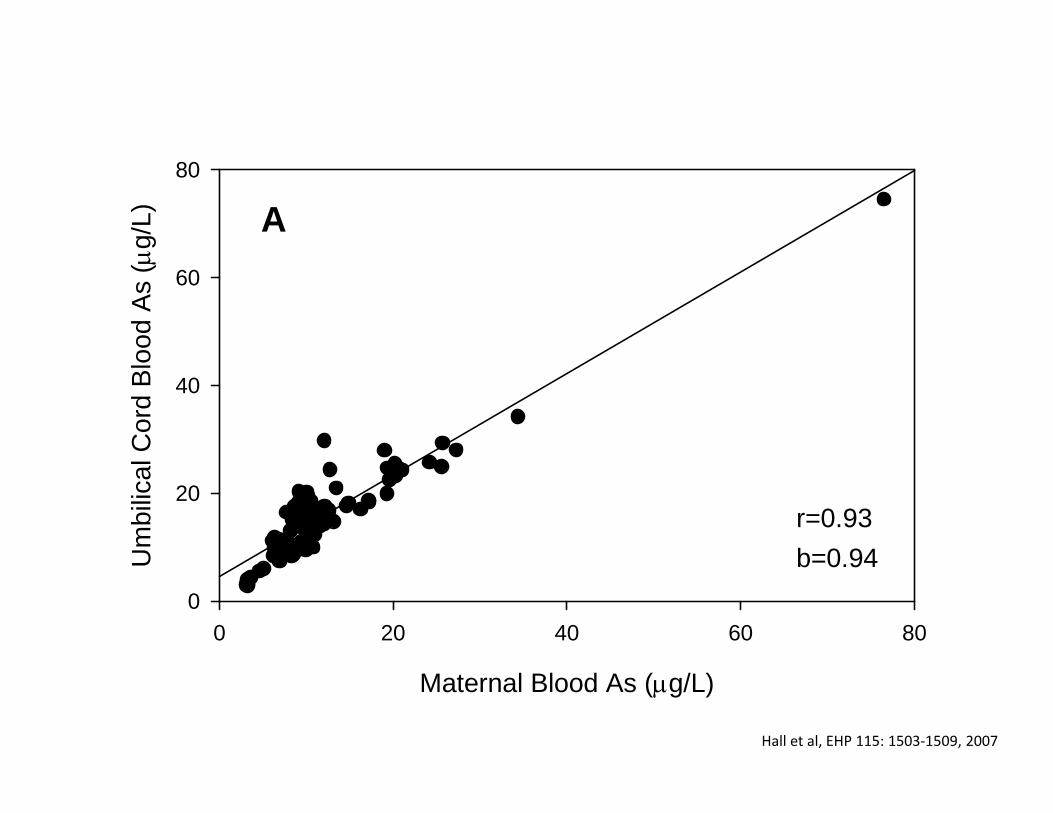
Maternal Blood As (μg/L)
0 20 40 60 80
Um
bilic
al C
ord
Bloo
d As
(μg/
L)
0
20
40
60
80
r=0.93b=0.94
A
Hall et al, EHP 115: 1503‐1509, 2007

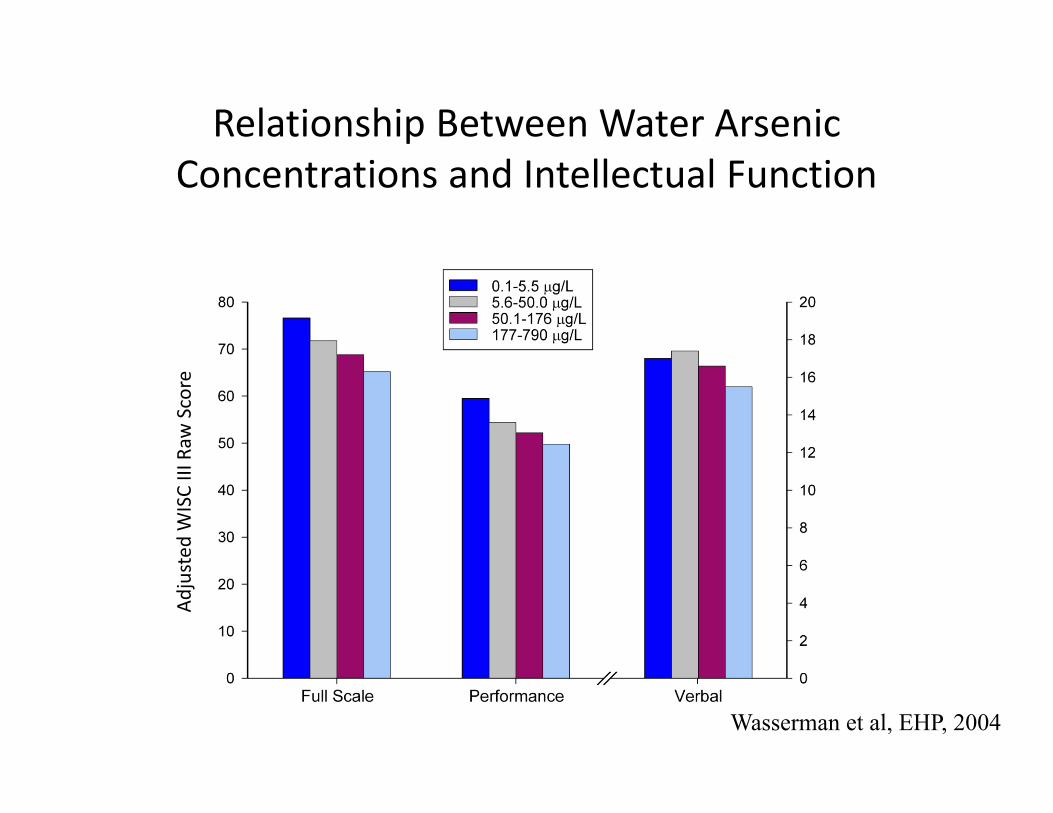
Relationship Between Water Arsenic Concentrations and Intellectual Function
Wasserman et al, EHP, 2004
Adjusted
WISC III Raw
Score
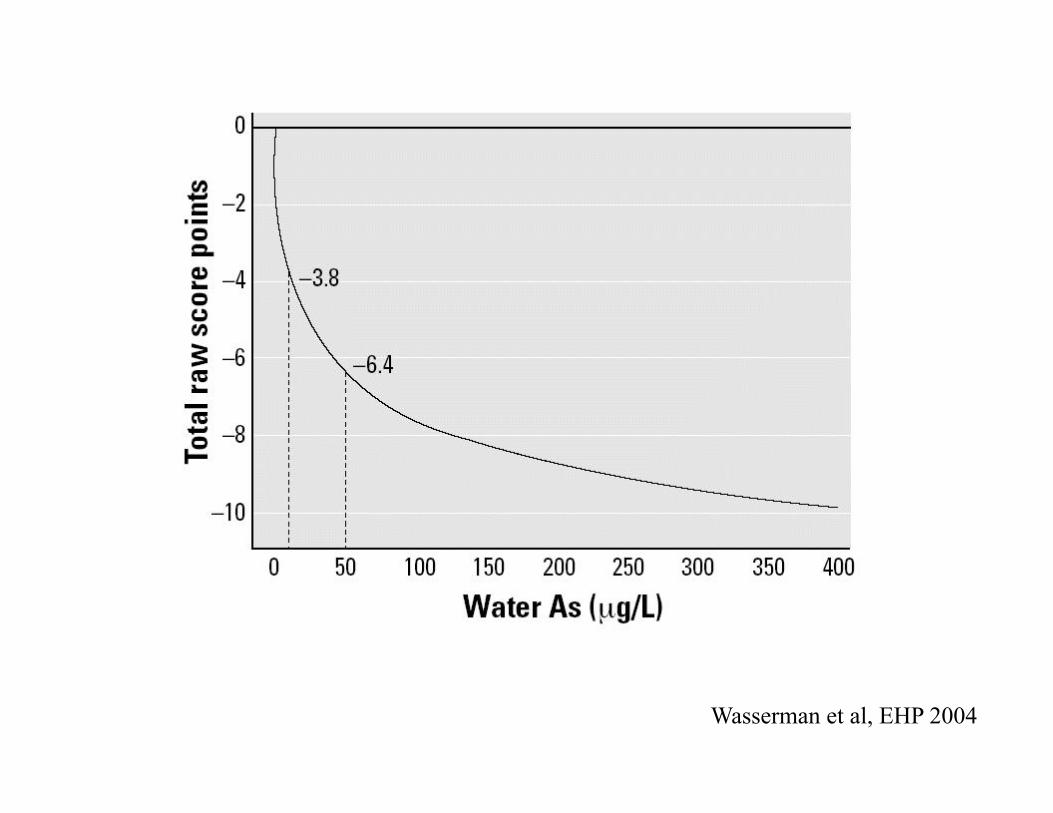
Wasserman et al, EHP 2004
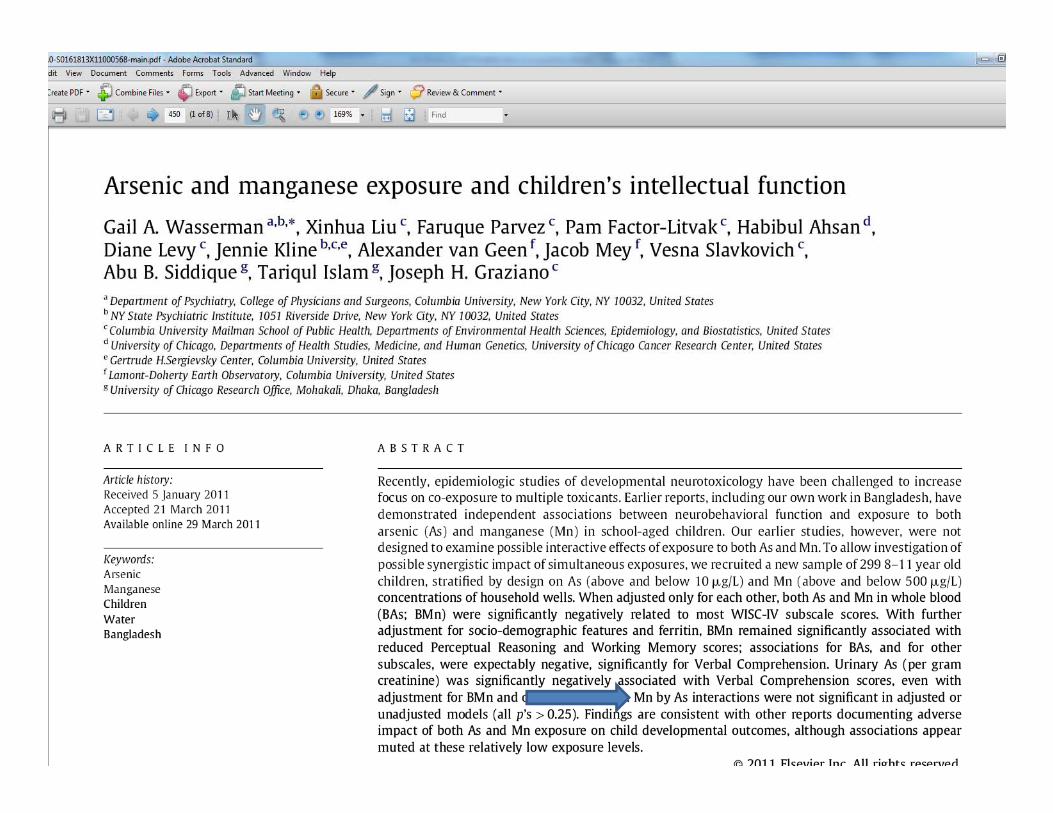
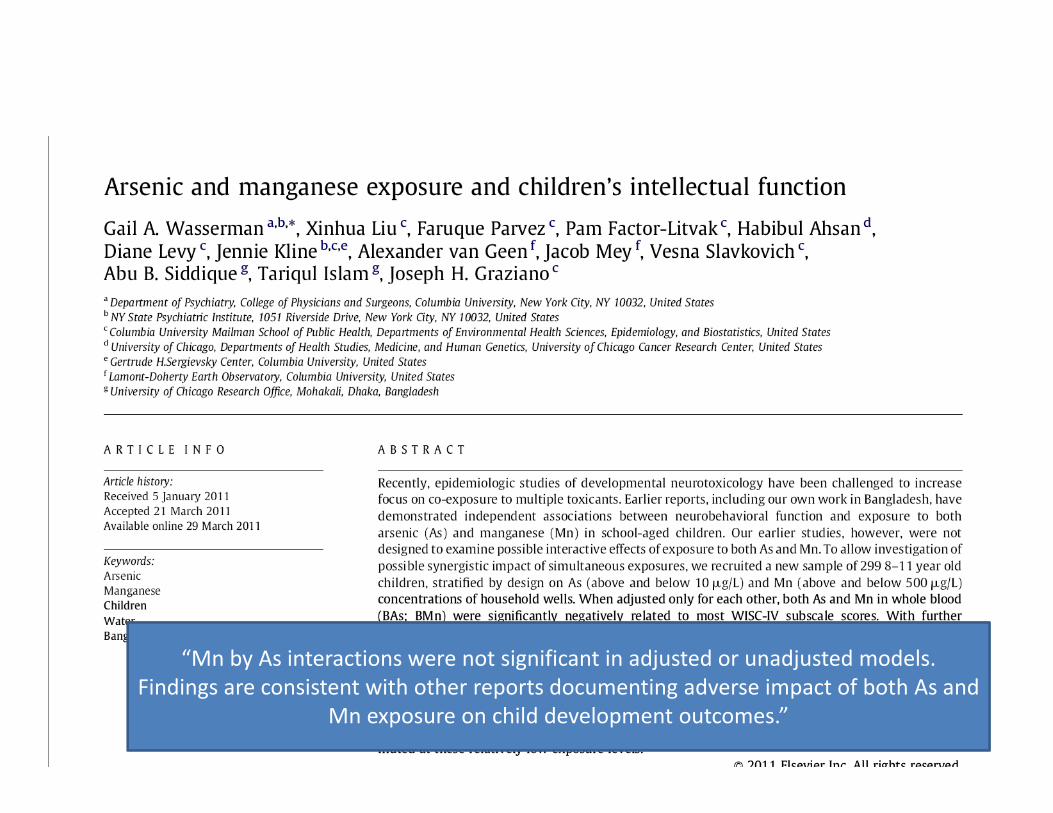
“Mn by As interactions were not significant in adjusted or unadjusted models. Findings are consistent with other reports documenting adverse impact of both As and
Mn exposure on child development outcomes.”


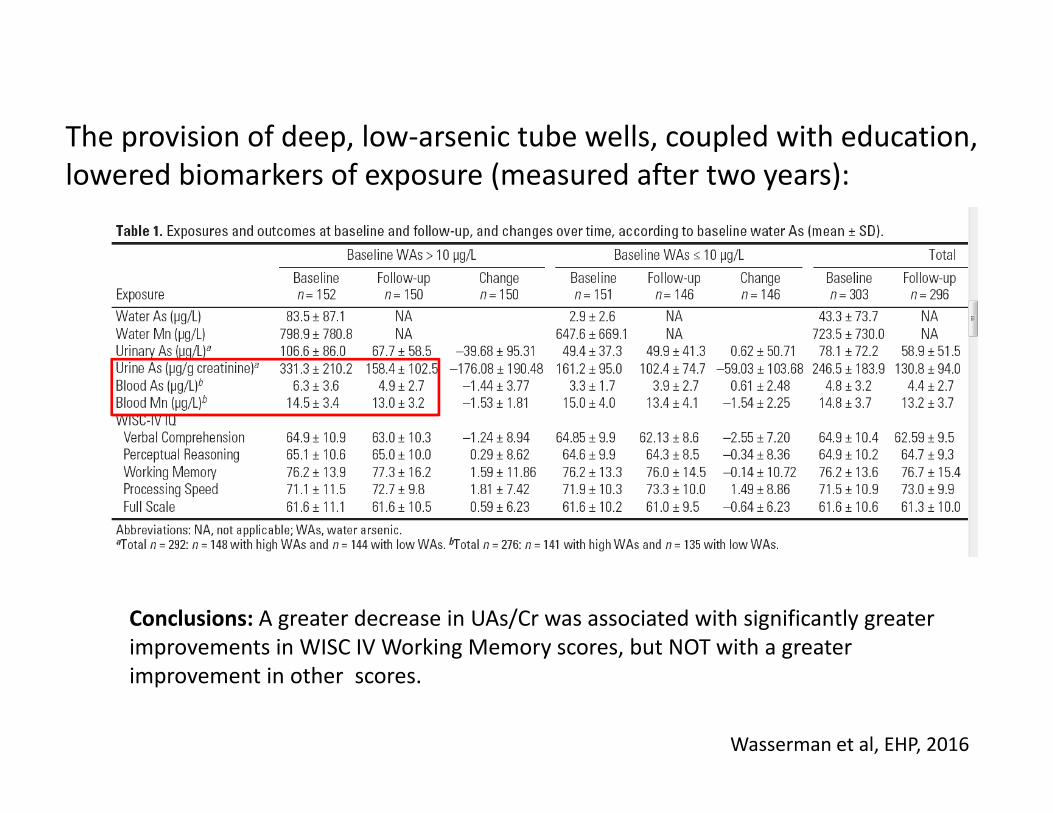
Conclusions: A greater decrease in UAs/Cr was associated with significantly greater improvements in WISC IV Working Memory scores, but NOT with a greater improvement in other scores.
The provision of deep, low‐arsenic tube wells, coupled with education, lowered biomarkers of exposure (measured after two years):
Wasserman et al, EHP, 2016

Elevated groundwater arsenic from natural sources
USGS, 2003 About 30,000 monitoring wells
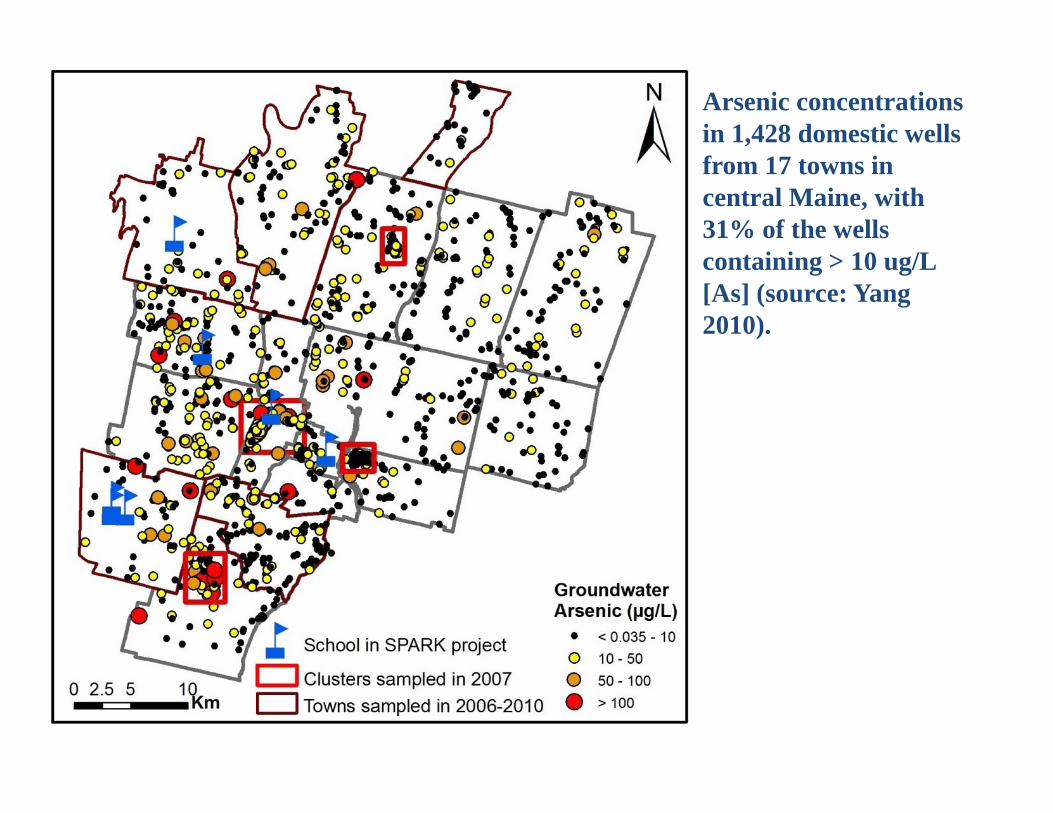
Arsenic concentrations in 1,428 domestic wells from 17 towns in central Maine, with 31% of the wells containing > 10 ug/L [As] (source: Yang 2010).
Environmental Health, 2014
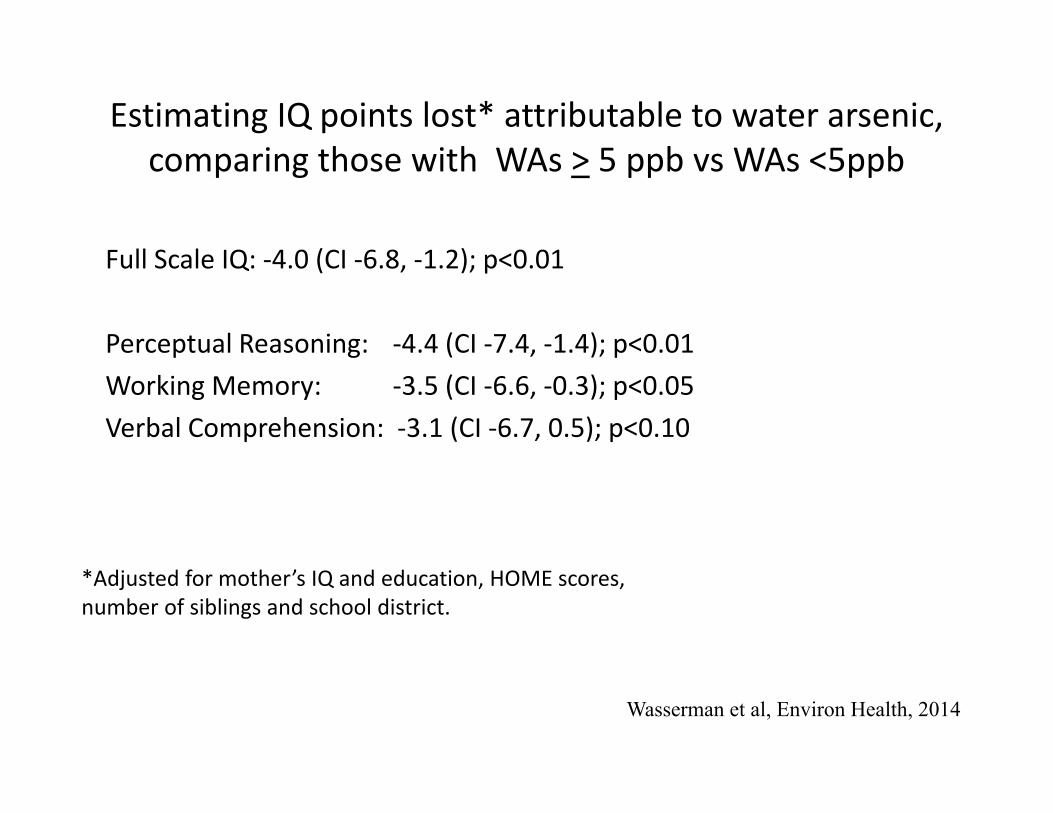
Estimating IQ points lost* attributable to water arsenic, comparing those with WAs > 5 ppb vs WAs <5ppb
Full Scale IQ: ‐4.0 (CI ‐6.8, ‐1.2); p<0.01
Perceptual Reasoning: ‐4.4 (CI ‐7.4, ‐1.4); p<0.01Working Memory: ‐3.5 (CI ‐6.6, ‐0.3); p<0.05Verbal Comprehension: ‐3.1 (CI ‐6.7, 0.5); p<0.10
Wasserman et al, Environ Health, 2014
*Adjusted for mother’s IQ and education, HOME scores, number of siblings and school district.

Arsenic in 5,966 wells

Ongoing: Lifetime Exposure and Health Outcomes in Adolescents
This studyInclusion criteria
HEALS
Baseline Follow‐up 4Follow‐up 3Follow‐up 2Follow‐up 1
Mom
Child
Outcomes: WISC IV, CANTAB, PFTs

0
50
100
150
200
250
Baseline Follow‐up 1 Follow‐up 2 Follow‐up3N Baseline Follow‐up 1 Follow‐up 2 Follow‐up 3
200 Low, 3.0 Low, 2.9 Low, 2.9 Low, 2.9
246 Mod, 26.5 Mod, 26.2 Mod, 26.3 Mod, 26.3
192 High, 148.2 High, 146.5 High, 146.2 High, 146.2
85 High, 200.8 Mod, 13.8 Mod, 12.1 Mod, 12.1
Water arsen
ic (u
g/L)
Mother’s water arsenic exposure over time

WAs<10 µg/Ln = 200
WAs 10‐50µg/Ln = 246
WAs>50 µg/Ln = 192
Measures Mean ± SD or % (n)
Mean ± SD or % (n)
Mean ± SD or % (n)
p‐value
Child characteristics
Male (%) 46 (92) 43.9 (108) 45.83 (88) 0.8828
Child age (years) 14.77 ± 0.73 14.78 ± 0.67 14.72 ± 0.67 0.6403
Years in school 6.78 ± 2.05 7.01 ± 2.0 6.63 ± 2.28 0.1404
Currently attending school (%) 84.9 (169/199) 86.1 (210/244) 80.2 (154) 0.2385
Exposure characteristics
Prenatal well water As (µg/L)Concurrent well water As (µg/L)
3.2 ± 2.97.2 ± 16.3
27.7 ± 11.229.7 ± 35.9
148.5 ±104.383.3 ± 93.3
<.0001
Biological measures n = 194 n = 243 n = 187
UAs (µg/L) 37.1 ± 32.9 78.0 ± 110.6 138.3 ± 180.1 <.0001
UAs/Cr (µg/g Cr) 81.3 ± 102.7 139.0 ± 113.1 275.7 ±324.1 <.0001
n = 195 n = 243 n = 185
BMn (µg/L) 11.8 ± 4.5 11.3 ± 3.4 11.2 ± 3.3 0.8933
BAs (µg/L) 2.5 ± 1.6 4.5 ± 3.2 7.9 ± 6.5 <.0001
BPb (µg/dL) 10.6 ± 4.8 9.5 ± 4.1 9.3 ± 4.2 0.0285
BCd (µg/L) 0.7 ± 0.3 0.6 ± 0.3 0.5 ± 0.2 <.0001
BSe (µg/L) 130.8 ± 17.0 133.3 ± 18.0 133.0 ± 19.4 0.3547
Selected Characteristics of the Adolescent Study
WAs<10 µg/Ln = 200
WAs 10‐50µg/Ln = 246
WAs>50 µg/Ln = 192
Measures Mean ± SD or % (n)
Mean ± SD or % (n)
Mean ± SD or % (n)
p‐value
Child characteristics
Male (%) 46 (92) 43.9 (108) 45.83 (88) 0.8828
Child age (years) 14.77 ± 0.73 14.78 ± 0.67 14.72 ± 0.67 0.6403
Years in school 6.78 ± 2.05 7.01 ± 2.0 6.63 ± 2.28 0.1404
Currently attending school (%) 84.9 (169/199) 86.1 (210/244) 80.2 (154) 0.2385
Exposure characteristics
Pre‐natal well water As (µg/L)Concurrent well water As (µg/L)
3.2 ± 2.97.2 ± 16.3
27.7 ± 11.229.7 ± 35.9
148.5 ±104.383.3 ± 93.3
<.0001<.0001
Biological measures n = 194 n = 243 n = 187
UAs (µg/L) 37.1 ± 32.9 78.0 ± 110.6 138.5 ± 180.1 <.0001
UAs/Cr (µg/g Cr) 81.3 ± 102.7 139 ± 113.1 275.7 ± 324.1 <.0001
n = 195 n = 243 n = 185
BMn (µg/L) 11.8 ± 4.5 11.3 ± 3.4 11.2 ± 3.3 0.8933
BAs (µg/L) 2.5 ± 1.6 4.5 ± 3.2 7.9 ± 6.5 <.0001
BPb (µg/dL) 10.6 ± 4.8 9.5 ± 4.1 9.3 ± 4.2 0.0285
BCd (µg/L) 0.7 ± 0.3 0.6 ± 0.3 0.5 ± 0.2 <.0001
BSe (µg/L) 130.8 ± 17.0 133.3 ± 18.0 133.0 ± 19.4 0.3547
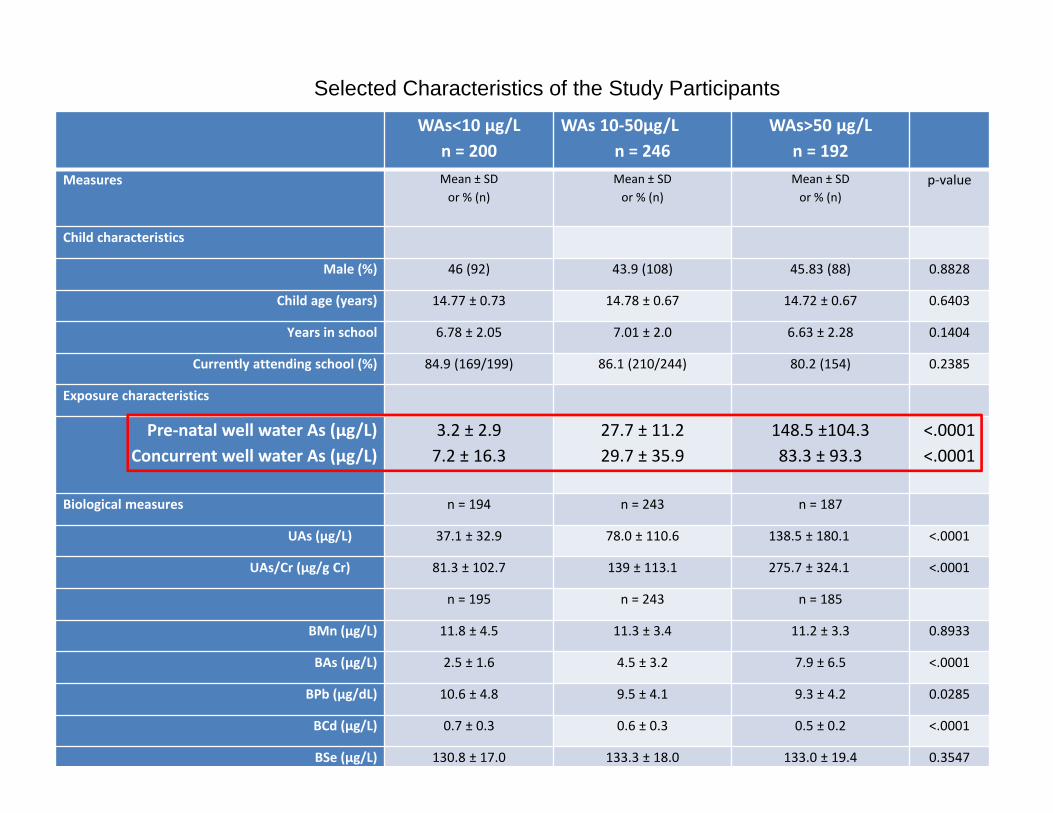
Selected Characteristics of the Study Participants

WAs<10 µg/Ln = 200
WAs 10‐50µg/Ln = 246
WAs>50 µg/Ln = 192
Measures Mean ± SD or % (n)
Mean ± SD or % (n)
Mean ± SD or % (n)
p‐value
Child characteristics
Male (%) 46 (92) 43.9 (108) 45.83 (88) 0.8828
Child age (years) 14.77 ± 0.73 14.78 ± 0.67 14.72 ± 0.67 0.6403
Years in school 6.78 ± 2.05 7.01 ± 2.0 6.63 ± 2.28 0.1404
Currently attending school (%) 84.9 (169/199) 86.1 (210/244) 80.2 (154) 0.2385
Exposure characteristics
Pre‐natal well water As (µg/L)Concurrent well water As (µg/L)
3.2 ± 2.97.2 ± 16.3
27.7 ± 11.229.7 ± 35.9
148.5 ±104.383.3 ± 93.3
<.0001<.0001
Biological measures n = 194 n = 243 n = 187
UAs (µg/L) 37.1 ± 32.9 78.0 ± 110.6 138.5 ± 180.1 <.0001
UAs/Cr (µg/g Cr) 81.3 ± 102.7 139 ±113.1 275.7 ± 324.1 <.0001
n = 195 n = 243 n = 185
BMn (µg/L) 11.8 ± 4.5 11.3 ± 3.4 11.2 ± 3.3 0.8933
BAs (µg/L) 2.5 ± 1.6 4.5 ± 3.2 7.9 ± 6.5 <.0001
BPb (µg/dL) 10.6 ± 4.8 9.5 ± 4.1 9.3 ± 4.2 0.0285
BCd (µg/L) 0.7 ± 0.3 0.6 ± 0.3 0.5 ± 0.2 <.0001
Selected Characteristics of the Study Participants

WAs<10 µg/Ln = 200
WAs 10‐50µg/Ln = 246
WAs>50 µg/Ln = 192
Measures Mean ± SD or % (n)
Mean ± SD or % (n)
Mean ± SD or % (n)
p‐value
Child characteristics
Male (%) 46 (92) 43.9 (108) 45.83 (88) 0.8828
Child age (years) 14.77 ± 0.73 14.78 ± 0.67 14.72 ± 0.67 0.6403
Years in school 6.78 ± 2.05 7.01 ± 2.0 6.63 ± 2.28 0.1404
Currently attending school (%) 84.9 (169/199) 86.1 (210/244) 80.2 (154) 0.2385
Exposure characteristics
Pre‐natal well water As (µg/L)Concurrent well water As (µg/L)
3.2 ± 2.97.2 ± 16.3
27.7 ± 11.229.7 ± 35.9
148.5 ±104.383.3 ± 93.3
<.0001<.0001
Biological measures n = 194 n = 243 n = 187
UAs (µg/L) 37.1 ± 32.9 78.0 ± 110.6 138.5 ± 180.1 <.0001
UAs/Cr (µg/g Cr) 81.3 ± 102.7 139.0 ± 113.1 275.7 ± 324.1 <.0001
n = 195 n = 243 n = 185
BMn (µg/L) 11.8 ± 4.5 11.3 ± 3.4 11.2 ± 3.3 0.8933
BAs (µg/L) 2.5 ± 1.6 4.5 ± 3.2 7.9 ± 6.5 <.0001BPb (µg/dL) 10.6 ± 4.8 9.5 ± 4.1 9.3 ± 4.2 0.0285
BCd (µg/L) 0.7 ± 0.3 0.6 ± 0.3 0.5 ± 0.2 <.0001
Selected Characteristics of the Study Participants

Adjusted Full Scale WISC Raw Scores by Group
Group 1 Group 2 Group 3 Group 4
Adj
uste
d Fu
ll S
cale
Raw
Sco
re
140
150
160
170
180
190
(Low WAs) (Mod WAs) (Hi WAs) (Hi→Mod WAs)
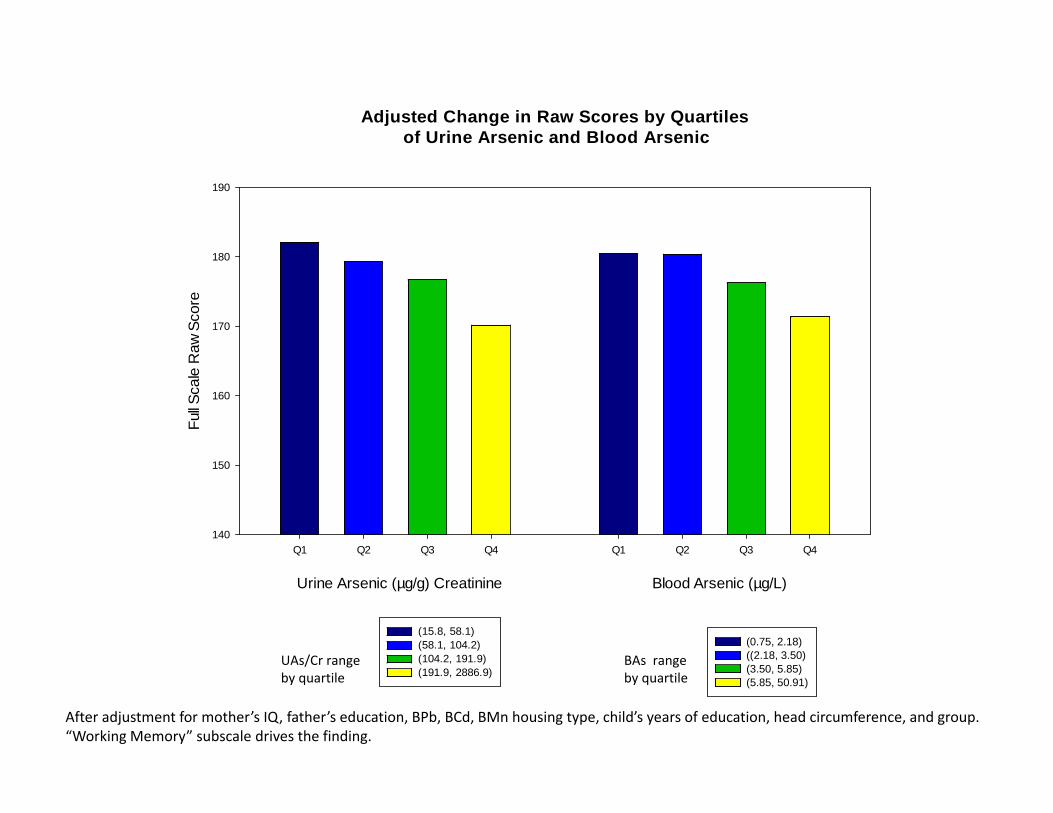
Adjusted Change in Raw Scores by Quartiles of Urine Arsenic and Blood Arsenic
Urine Arsenic (µg/g) Creatinine Blood Arsenic (µg/L)
Q1 Q2 Q3 Q4 Q1 Q2 Q3 Q4
Full S
cale
Raw
Sco
re
140
150
160
170
180
190
(15.8, 58.1)(58.1, 104.2) (104.2, 191.9)(191.9, 2886.9)
(0.75, 2.18)((2.18, 3.50)(3.50, 5.85)(5.85, 50.91)
UAs/Cr rangeby quartile
BAs rangeby quartile
After adjustment for mother’s IQ, father’s education, BPb, BCd, BMn housing type, child’s years of education, head circumference, and group.“Working Memory” subscale drives the finding.
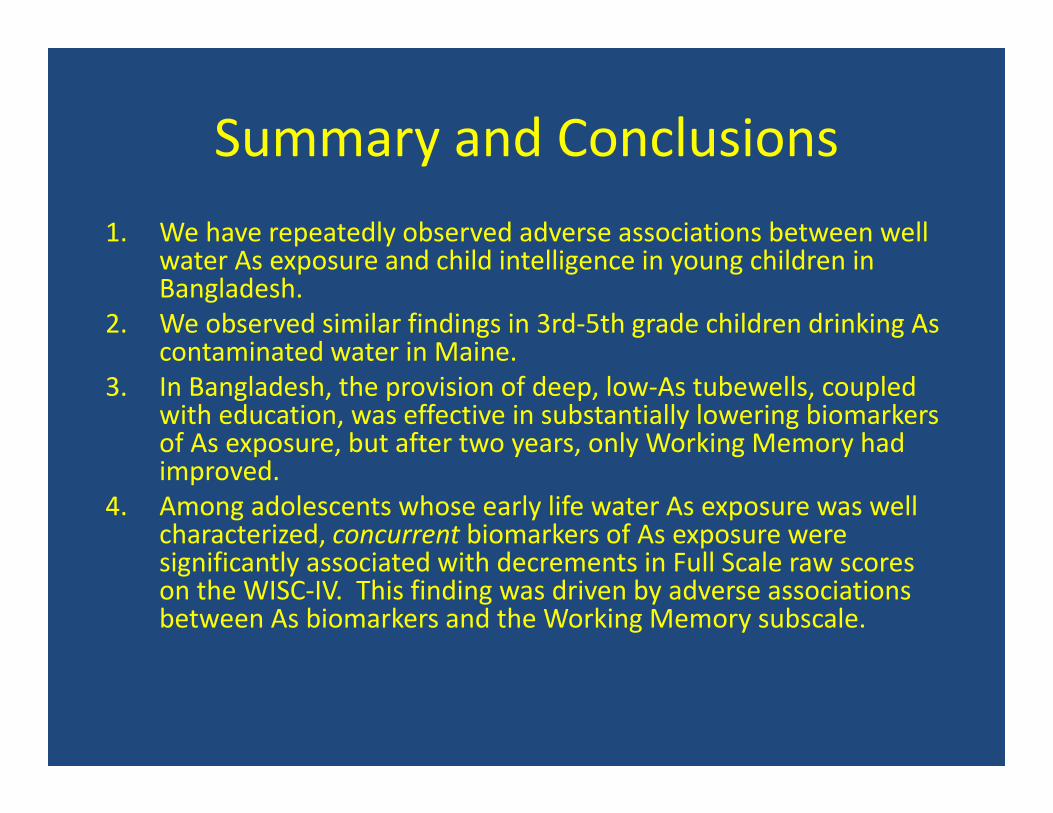
Summary and Conclusions1. We have repeatedly observed adverse associations between well
water As exposure and child intelligence in young children in Bangladesh.
2. We observed similar findings in 3rd‐5th grade children drinking As contaminated water in Maine.
3. In Bangladesh, the provision of deep, low‐As tubewells, coupled with education, was effective in substantially lowering biomarkers of As exposure, but after two years, only Working Memory had improved.
4. Among adolescents whose early life water As exposure was well characterized, concurrent biomarkers of As exposure were significantly associated with decrements in Full Scale raw scores on the WISC‐IV. This finding was driven by adverse associations between As biomarkers and the Working Memory subscale.
AcknowledgementsIn the United States• Gail Wasserman• Xinhua Liu• Diane Levy• Nancy LoIacono• Faruque Parvez• Pam Factor‐Litvak• Jennie Kline• Vesna Slavkovich• Jagoda Balac• David Santiago• Lex van Geen• Tyler Ellis• Yan Zheng• Habibul Ahsan (Univ. Chicago)• Yu Chen (NYU)
In Bangladesh• Tariqul Islam• Hasan Shahriar• Mohammed Uddin• Abu Siddique• Samiul Islam• Rebeka Sultana• Ruksana Sultana• Abul Kamal Samsuddin• Golam Sarwar• Study Participants
Superfund Research Program grant P42 ES 10349; NIEHS Center Grant P30 ES 09089Water Aid Bangladesh

Thank You
Related Documents