Neural mechanisms of the influence of popularity on adolescent ratings of music Gregory S. Berns a,b, ⁎, C. Monica Capra b , Sara Moore a , Charles Noussair b,c a Department of Psychiatry & Behavioral Sciences, Emory University School of Medicine, 101 Woodruff Circle, Suite 4000, Atlanta, GA 30322, USA b Economics Department, Emory University, Atlanta, GA, USA c Department of Economics, Tilburg University, Tilburg, The Netherlands abstract article info Article history: Received 3 June 2009 Revised 28 September 2009 Accepted 23 October 2009 Available online 29 October 2009 It is well-known that social influences affect consumption decisions. We used functional magnetic resonance imaging (fMRI) to elucidate the neural mechanisms associated with social influence with regard to a common consumer good: music. Our study population was adolescents, age 12–17. Music is a common purchase in this age group, and it is widely believed that adolescent behavior is influenced by perceptions of popularity in their reference group. Using 15-s clips of songs from MySpace.com, we obtained behavioral measures of preferences and neurobiological responses to the songs. The data were gathered with, and without, the overall popularity of the song revealed. Song popularity had a significant effect on the participants' likability ratings of the songs. fMRI results showed a strong correlation between the participants' rating and activity in the caudate nucleus, a region previously implicated in reward-driven actions. The tendency to change one's evaluation of a song was positively correlated with activation in the anterior insula and anterior cingulate, two regions that are associated with physiological arousal and negative affective states. Sensitivity to popularity was linked to lower activation levels in the middle temporal gyrus, suggesting a lower depth of musical semantic processing. Our results suggest that a principal mechanism whereby popularity ratings affect consumer choice is through the anxiety generated by the mismatch between one's own preferences and others'. This mismatch anxiety motivates people to switch their choices in the direction of the consensus. Our data suggest that this is a major force behind the conformity observed in music tastes in some teenagers. © 2009 Elsevier Inc. All rights reserved. Introduction It is well-known that social influences affect consumption decisions. In particular, a consumer's tendency to purchase a product is influenced by the choices made by his associative reference group (Bearden and Rose, 1990; Childers and Rao, 1992; Escalas and Bettman, 2005; Lascu and Zinkhan, 1999). Why do the actions of others affect a person's decisions? Following the pioneering work of Solomon Ash (Asch, 1951, 1952), social psychologists have identified several reasons. These include the desire to avoid social sanctions, the need to comply with a perceived request, and simply the drive to conform. With respect to the last reason, empirical research supports the conceptual distinction between informative and normative motivations to conform (Deutsch and Gerard, 1955), which translate roughly to the desire to behave accurately versus the desire to behave correctly in a social sense (Cialdini and Goldstein, 2004). On the other hand, it is also possible that information about the decisions of one's reference group influences one's actual preferences about the product. That is, observing others' choice of an item changes the intrinsic value that one attaches to that item. Indeed, there is evidence that preferences are susceptible to various influences such as the way information is provided or framed. This is consistent with the suggestion that preferences are not stable, but rather are constructed during a decision situation (Ariely et al., 2006; Bettman et al., 1998; Slovic, 1995). Thus, the mechanism whereby social influence affects purchasing decisions may be purely in altering actions (due to informational or normative reasons) without exercising any effect on underlying preferences, or alternatively, it may be through an effect on preferences themselves. In this paper we are particularly interested in identifying the mechanism whereby social information affects consumption deci- sions. Although several experiments have been designed to disaggre- gate the informational and normative motives to conform (Capra and Li, 2008; Carpenter, 2004; Cason and Mui, 1998) few people have studied the extent to which conformity is generated by changes in preferences (a recent exception in economics is Cooper and Rege, 2008). One problem is that informational, normative, and preferential processes may all be at work in specific situations, and the influence of each element may be difficult to isolate by only measuring decisions, even in controlled behavioral experiments. One method of bypassing this problem is to use brain imaging. This allows researchers to directly measure neurological activation during a decision task. The rapid evolution of the field of neuroeconomics has resulted in a wealth of data about distinct brain systems involved in NeuroImage 49 (2010) 2687–2696 ⁎ Corresponding author. Department of Psychiatry & Behavioral Sciences, Emory University School of Medicine, 101 Woodruff Circle, Suite 4000, Atlanta, GA 30322, USA. Fax: 404 727 3233. E-mail address: [email protected] (G.S. Berns). 1053-8119/$ – see front matter © 2009 Elsevier Inc. All rights reserved. doi:10.1016/j.neuroimage.2009.10.070 Contents lists available at ScienceDirect NeuroImage journal homepage: www.elsevier.com/locate/ynimg

Welcome message from author
This document is posted to help you gain knowledge. Please leave a comment to let me know what you think about it! Share it to your friends and learn new things together.
Transcript
NeuroImage 49 (2010) 2687–2696
Contents lists available at ScienceDirect
NeuroImage
j ourna l homepage: www.e lsev ie r.com/ locate /yn img
Neural mechanisms of the influence of popularity on adolescent ratings of music
Gregory S. Berns a,b,⁎, C. Monica Capra b, Sara Moore a, Charles Noussair b,c
a Department of Psychiatry & Behavioral Sciences, Emory University School of Medicine, 101 Woodruff Circle, Suite 4000, Atlanta, GA 30322, USAb Economics Department, Emory University, Atlanta, GA, USAc Department of Economics, Tilburg University, Tilburg, The Netherlands
⁎ Corresponding author. Department of PsychiatryUniversity School of Medicine, 101Woodruff Circle, SuiteFax: 404 727 3233.
E-mail address: [email protected] (G.S. Berns).
1053-8119/$ – see front matter © 2009 Elsevier Inc. Adoi:10.1016/j.neuroimage.2009.10.070
a b s t r a c t
a r t i c l e i n f oArticle history:Received 3 June 2009Revised 28 September 2009Accepted 23 October 2009Available online 29 October 2009
It is well-known that social influences affect consumption decisions. We used functional magnetic resonanceimaging (fMRI) to elucidate the neural mechanisms associated with social influence with regard to acommon consumer good: music. Our study population was adolescents, age 12–17. Music is a commonpurchase in this age group, and it is widely believed that adolescent behavior is influenced by perceptions ofpopularity in their reference group. Using 15-s clips of songs from MySpace.com, we obtained behavioralmeasures of preferences and neurobiological responses to the songs. The data were gathered with, andwithout, the overall popularity of the song revealed. Song popularity had a significant effect on theparticipants' likability ratings of the songs. fMRI results showed a strong correlation between theparticipants' rating and activity in the caudate nucleus, a region previously implicated in reward-drivenactions. The tendency to change one's evaluation of a song was positively correlated with activation in theanterior insula and anterior cingulate, two regions that are associated with physiological arousal andnegative affective states. Sensitivity to popularity was linked to lower activation levels in the middletemporal gyrus, suggesting a lower depth of musical semantic processing. Our results suggest that a principalmechanism whereby popularity ratings affect consumer choice is through the anxiety generated by themismatch between one's own preferences and others'. This mismatch anxiety motivates people to switchtheir choices in the direction of the consensus. Our data suggest that this is a major force behind theconformity observed in music tastes in some teenagers.
© 2009 Elsevier Inc. All rights reserved.
Introduction
It iswell-known that social influences affect consumption decisions.In particular, a consumer's tendency topurchase a product is influencedby the choices made by his associative reference group (Bearden andRose, 1990; Childers and Rao, 1992; Escalas and Bettman, 2005; Lascuand Zinkhan, 1999). Why do the actions of others affect a person'sdecisions? Following the pioneeringwork of Solomon Ash (Asch, 1951,1952), social psychologists have identified several reasons. Theseinclude the desire to avoid social sanctions, the need to comply with aperceived request, and simply the drive to conform.With respect to thelast reason, empirical research supports the conceptual distinctionbetween informative and normative motivations to conform (Deutschand Gerard, 1955), which translate roughly to the desire to behaveaccurately versus the desire to behave correctly in a social sense(Cialdini andGoldstein, 2004). On the other hand, it is also possible thatinformation about the decisions of one's reference group influencesone's actual preferences about the product. That is, observing others'choice of an item changes the intrinsic value that one attaches to that
& Behavioral Sciences, Emory4000, Atlanta, GA 30322, USA.
ll rights reserved.
item. Indeed, there is evidence that preferences are susceptible tovarious influences such as the way information is provided or framed.This is consistent with the suggestion that preferences are not stable,but rather are constructed during a decision situation (Ariely et al.,2006; Bettman et al., 1998; Slovic, 1995). Thus, the mechanismwhereby social influence affects purchasing decisions may be purelyin altering actions (due to informational or normative reasons)withoutexercising any effect on underlying preferences, or alternatively, it maybe through an effect on preferences themselves.
In this paper we are particularly interested in identifying themechanism whereby social information affects consumption deci-sions. Although several experiments have been designed to disaggre-gate the informational and normative motives to conform (Capra andLi, 2008; Carpenter, 2004; Cason and Mui, 1998) few people havestudied the extent to which conformity is generated by changes inpreferences (a recent exception in economics is Cooper and Rege,2008). One problem is that informational, normative, and preferentialprocesses may all be at work in specific situations, and the influence ofeach element may be difficult to isolate by only measuring decisions,even in controlled behavioral experiments.
Onemethod of bypassing this problem is to use brain imaging. Thisallows researchers to directly measure neurological activation duringa decision task. The rapid evolution of the field of neuroeconomics hasresulted in a wealth of data about distinct brain systems involved in
2688 G.S. Berns et al. / NeuroImage 49 (2010) 2687–2696
elements of individual choice (see, for example, Rangel et al., 2008).Based on these data, some consensus has arisen about the functions ofdifferent regions of the brain. For example, convergent evidence fromthese studies points to activation in dopaminergic receptive regions asassociated with value (Camerer et al., 2005; Glimcher et al., 2005;Hampton and O'Doherty, 2007; Knutson et al., 2007; Knutson et al.,2005; Montague and Berns, 2002). Similarly, the activation of theinsula has been associated with aversive states (Berns et al., 2006,2008; Chandrasekhar et al., 2008; Craig, 2003; Koyama et al., 2005;Peyron et al., 2000; Ploghaus et al., 2003; Porro et al., 2002). Incontrast, there is less consensus about the neural mechanisms ofsocial influence. However, using current knowledge of how the brainprocesses reward, it is possible to utilize fMRI technology todiscriminate between conformity that is merely in actions, and thuspresumably motivated by the discomfort of being different, andconformity that is generated by changes in valuation (see, forexample, Berns et al., 2005 or Klucharev et al., 2009).
Here, we study the effect of social influence by considering howinformation about the popularity ratings of particular songs influ-ences an individual's own evaluation of the songs. In our experiment,participants were asked to rate songs according to their ownpreference before and after observing a rating of how popular thesong was among a large reference group. To generate incentives toevaluate different songs in accordance with one's willingness topurchase the product, participants received a CD with the music theyrated most highly at the end of the session. The use of music as theconsumption good for the experiment has the methodologicaladvantage that it can be easily delivered and consumed while thesubject is being scanned. We chose adolescents from the ages of 12 to17 as our subject pool for two reasons. The first is that this cohort ofpeople is believed to be highly responsive to social influence(Steinberg and Monahan, 2007). The second is that consumers inthis age group are typically consumers of music, responsible for morethan one third of all single album consumption in the United Statesand perhaps a greater proportion when online digital purchases areincluded. We choose popularity ratings as our measure of groupopinion for two reasons. First, ratings for music are widely present on
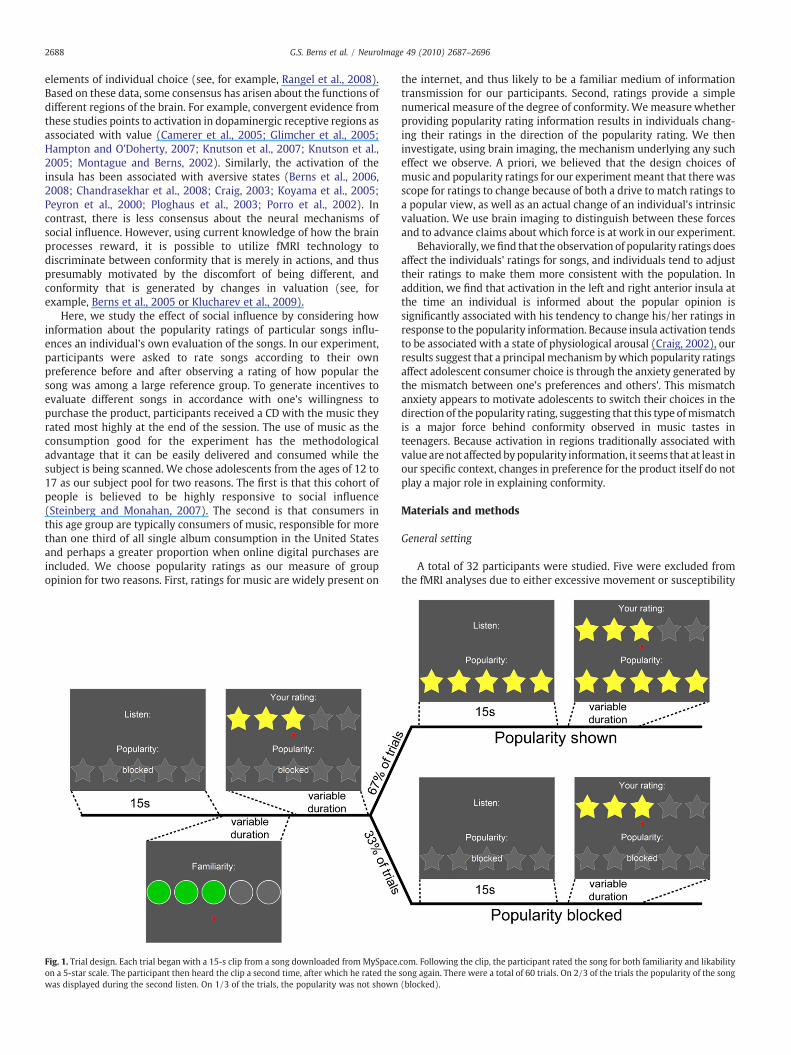
Fig. 1. Trial design. Each trial began with a 15-s clip from a song downloaded from MySpace.on a 5-star scale. The participant then heard the clip a second time, after which he rated thewas displayed during the second listen. On 1/3 of the trials, the popularity was not shown
the internet, and thus likely to be a familiar medium of informationtransmission for our participants. Second, ratings provide a simplenumerical measure of the degree of conformity. We measure whetherproviding popularity rating information results in individuals chang-ing their ratings in the direction of the popularity rating. We theninvestigate, using brain imaging, the mechanism underlying any sucheffect we observe. A priori, we believed that the design choices ofmusic and popularity ratings for our experimentmeant that there wasscope for ratings to change because of both a drive to match ratings toa popular view, as well as an actual change of an individual's intrinsicvaluation. We use brain imaging to distinguish between these forcesand to advance claims about which force is at work in our experiment.
Behaviorally, wefind that the observation of popularity ratings doesaffect the individuals' ratings for songs, and individuals tend to adjusttheir ratings to make them more consistent with the population. Inaddition, we find that activation in the left and right anterior insula atthe time an individual is informed about the popular opinion issignificantly associated with his tendency to change his/her ratings inresponse to the popularity information. Because insula activation tendsto be associated with a state of physiological arousal (Craig, 2002), ourresults suggest that a principal mechanism bywhich popularity ratingsaffect adolescent consumer choice is through the anxiety generated bythe mismatch between one's preferences and others'. This mismatchanxiety appears to motivate adolescents to switch their choices in thedirection of the popularity rating, suggesting that this type ofmismatchis a major force behind conformity observed in music tastes inteenagers. Because activation in regions traditionally associated withvalue are not affected bypopularity information, it seems that at least inour specific context, changes in preference for the product itself do notplay a major role in explaining conformity.
Materials and methods
General setting
A total of 32 participants were studied. Five were excluded fromthe fMRI analyses due to either excessive movement or susceptibility
com. Following the clip, the participant rated the song for both familiarity and likabilitysong again. There were a total of 60 trials. On 2/3 of the trials the popularity of the song(blocked).
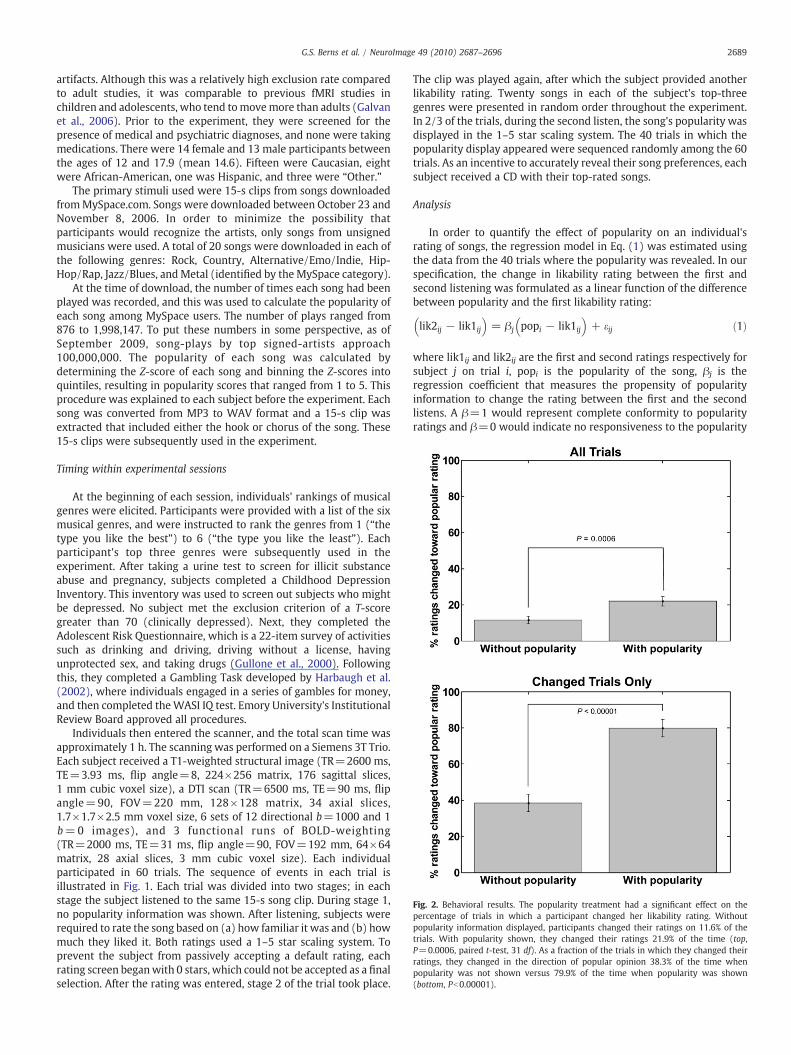
Fig. 2. Behavioral results. The popularity treatment had a significant effect on thepercentage of trials in which a participant changed her likability rating. Withoutpopularity information displayed, participants changed their ratings on 11.6% of thetrials. With popularity shown, they changed their ratings 21.9% of the time (top,P=0.0006, paired t-test, 31 df). As a fraction of the trials in which they changed theirratings, they changed in the direction of popular opinion 38.3% of the time whenpopularity was not shown versus 79.9% of the time when popularity was shown(bottom, Pb0.00001).
2689G.S. Berns et al. / NeuroImage 49 (2010) 2687–2696
artifacts. Although this was a relatively high exclusion rate comparedto adult studies, it was comparable to previous fMRI studies inchildren and adolescents, who tend tomovemore than adults (Galvanet al., 2006). Prior to the experiment, they were screened for thepresence of medical and psychiatric diagnoses, and none were takingmedications. There were 14 female and 13 male participants betweenthe ages of 12 and 17.9 (mean 14.6). Fifteen were Caucasian, eightwere African-American, one was Hispanic, and three were “Other.”
The primary stimuli used were 15-s clips from songs downloadedfromMySpace.com. Songs were downloaded between October 23 andNovember 8, 2006. In order to minimize the possibility thatparticipants would recognize the artists, only songs from unsignedmusicians were used. A total of 20 songs were downloaded in each ofthe following genres: Rock, Country, Alternative/Emo/Indie, Hip-Hop/Rap, Jazz/Blues, andMetal (identified by the MySpace category).
At the time of download, the number of times each song had beenplayed was recorded, and this was used to calculate the popularity ofeach song among MySpace users. The number of plays ranged from876 to 1,998,147. To put these numbers in some perspective, as ofSeptember 2009, song-plays by top signed-artists approach100,000,000. The popularity of each song was calculated bydetermining the Z-score of each song and binning the Z-scores intoquintiles, resulting in popularity scores that ranged from 1 to 5. Thisprocedure was explained to each subject before the experiment. Eachsong was converted from MP3 to WAV format and a 15-s clip wasextracted that included either the hook or chorus of the song. These15-s clips were subsequently used in the experiment.
Timing within experimental sessions
At the beginning of each session, individuals' rankings of musicalgenres were elicited. Participants were provided with a list of the sixmusical genres, and were instructed to rank the genres from 1 (“thetype you like the best”) to 6 (“the type you like the least”). Eachparticipant's top three genres were subsequently used in theexperiment. After taking a urine test to screen for illicit substanceabuse and pregnancy, subjects completed a Childhood DepressionInventory. This inventory was used to screen out subjects who mightbe depressed. No subject met the exclusion criterion of a T-scoregreater than 70 (clinically depressed). Next, they completed theAdolescent Risk Questionnaire, which is a 22-item survey of activitiessuch as drinking and driving, driving without a license, havingunprotected sex, and taking drugs (Gullone et al., 2000). Followingthis, they completed a Gambling Task developed by Harbaugh et al.(2002), where individuals engaged in a series of gambles for money,and then completed theWASI IQ test. Emory University's InstitutionalReview Board approved all procedures.
Individuals then entered the scanner, and the total scan time wasapproximately 1 h. The scanning was performed on a Siemens 3T Trio.Each subject received a T1-weighted structural image (TR=2600 ms,TE=3.93 ms, flip angle=8, 224×256 matrix, 176 sagittal slices,1 mm cubic voxel size), a DTI scan (TR=6500 ms, TE=90 ms, flipangle=90, FOV=220 mm, 128×128 matrix, 34 axial slices,1.7×1.7×2.5 mm voxel size, 6 sets of 12 directional b=1000 and 1b=0 images), and 3 functional runs of BOLD-weighting(TR=2000 ms, TE=31 ms, flip angle=90, FOV=192 mm, 64×64matrix, 28 axial slices, 3 mm cubic voxel size). Each individualparticipated in 60 trials. The sequence of events in each trial isillustrated in Fig. 1. Each trial was divided into two stages; in eachstage the subject listened to the same 15-s song clip. During stage 1,no popularity information was shown. After listening, subjects wererequired to rate the song based on (a) how familiar it was and (b) howmuch they liked it. Both ratings used a 1–5 star scaling system. Toprevent the subject from passively accepting a default rating, eachrating screen beganwith 0 stars, which could not be accepted as a finalselection. After the rating was entered, stage 2 of the trial took place.
The clip was played again, after which the subject provided anotherlikability rating. Twenty songs in each of the subject's top-threegenres were presented in random order throughout the experiment.In 2/3 of the trials, during the second listen, the song's popularity wasdisplayed in the 1–5 star scaling system. The 40 trials in which thepopularity display appeared were sequenced randomly among the 60trials. As an incentive to accurately reveal their song preferences, eachsubject received a CD with their top-rated songs.
Analysis
In order to quantify the effect of popularity on an individual'srating of songs, the regression model in Eq. (1) was estimated usingthe data from the 40 trials where the popularity was revealed. In ourspecification, the change in likability rating between the first andsecond listening was formulated as a linear function of the differencebetween popularity and the first likability rating:
lik2ij − lik1ij
� �= βj popi − lik1ij
� �+ eij ð1Þ
where lik1ij and lik2ij are the first and second ratings respectively forsubject j on trial i, popi is the popularity of the song, βj is theregression coefficient that measures the propensity of popularityinformation to change the rating between the first and the secondlistens. A β=1 would represent complete conformity to popularityratings and β=0 would indicate no responsiveness to the popularity
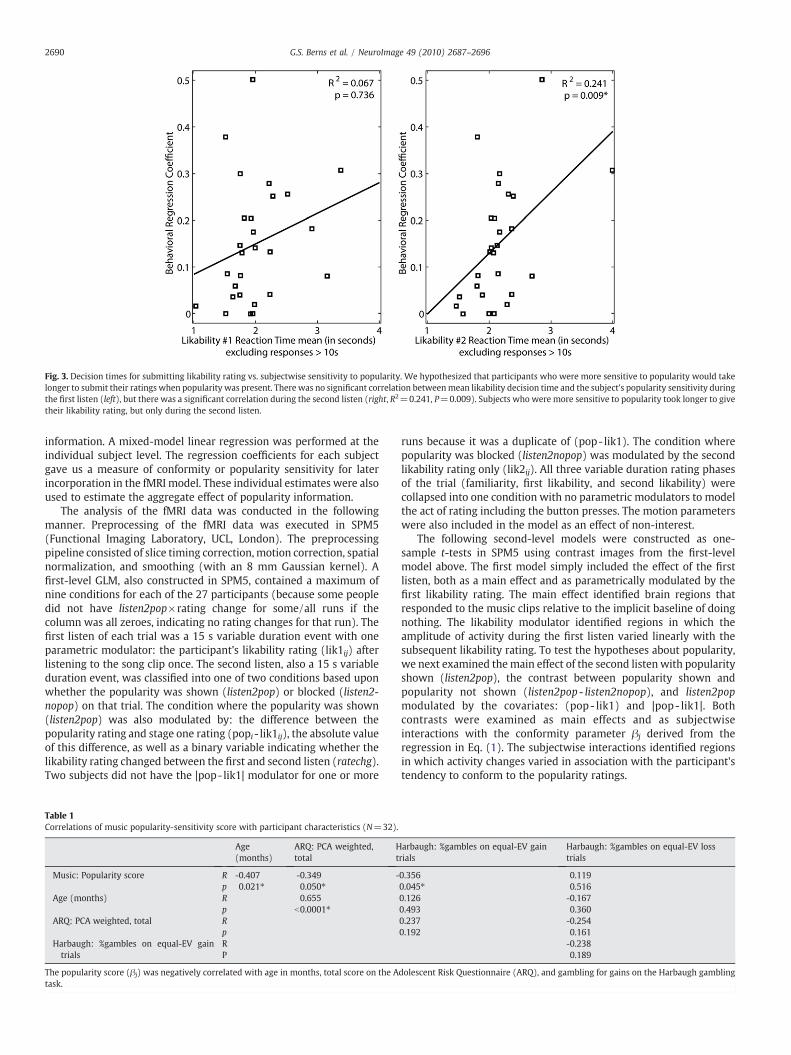
Fig. 3. Decision times for submitting likability rating vs. subjectwise sensitivity to popularity. We hypothesized that participants who were more sensitive to popularity would takelonger to submit their ratings when popularity was present. There was no significant correlation betweenmean likability decision time and the subject's popularity sensitivity duringthe first listen (left), but there was a significant correlation during the second listen (right, R2=0.241, P=0.009). Subjects who were more sensitive to popularity took longer to givetheir likability rating, but only during the second listen.
2690 G.S. Berns et al. / NeuroImage 49 (2010) 2687–2696
information. A mixed-model linear regression was performed at theindividual subject level. The regression coefficients for each subjectgave us a measure of conformity or popularity sensitivity for laterincorporation in the fMRI model. These individual estimates were alsoused to estimate the aggregate effect of popularity information.
The analysis of the fMRI data was conducted in the followingmanner. Preprocessing of the fMRI data was executed in SPM5(Functional Imaging Laboratory, UCL, London). The preprocessingpipeline consisted of slice timing correction,motion correction, spatialnormalization, and smoothing (with an 8 mm Gaussian kernel). Afirst-level GLM, also constructed in SPM5, contained a maximum ofnine conditions for each of the 27 participants (because some peopledid not have listen2pop×rating change for some/all runs if thecolumn was all zeroes, indicating no rating changes for that run). Thefirst listen of each trial was a 15 s variable duration event with oneparametric modulator: the participant's likability rating (lik1ij) afterlistening to the song clip once. The second listen, also a 15 s variableduration event, was classified into one of two conditions based uponwhether the popularity was shown (listen2pop) or blocked (listen2-nopop) on that trial. The condition where the popularity was shown(listen2pop) was also modulated by: the difference between thepopularity rating and stage one rating (popi- lik1ij), the absolute valueof this difference, as well as a binary variable indicating whether thelikability rating changed between the first and second listen (ratechg).Two subjects did not have the |pop-lik1| modulator for one or more
Table 1Correlations of music popularity-sensitivity score with participant characteristics (N=32).
Age(months)
ARQ: PCA weighted,total
Ht
Music: Popularity score R -0.407 -0.349 -p 0.021⁎ 0.050⁎
Age (months) R 0.655p b0.0001⁎
ARQ: PCA weighted, total Rp
Harbaugh: %gambles on equal-EV gaintrials
RP
The popularity score (βj) was negatively correlated with age in months, total score on the Atask.
runs because it was a duplicate of (pop-lik1). The condition wherepopularity was blocked (listen2nopop) was modulated by the secondlikability rating only (lik2ij). All three variable duration rating phasesof the trial (familiarity, first likability, and second likability) werecollapsed into one condition with no parametric modulators to modelthe act of rating including the button presses. The motion parameterswere also included in the model as an effect of non-interest.
The following second-level models were constructed as one-sample t-tests in SPM5 using contrast images from the first-levelmodel above. The first model simply included the effect of the firstlisten, both as a main effect and as parametrically modulated by thefirst likability rating. The main effect identified brain regions thatresponded to the music clips relative to the implicit baseline of doingnothing. The likability modulator identified regions in which theamplitude of activity during the first listen varied linearly with thesubsequent likability rating. To test the hypotheses about popularity,we next examined themain effect of the second listen with popularityshown (listen2pop), the contrast between popularity shown andpopularity not shown (listen2pop - listen2nopop), and listen2popmodulated by the covariates: (pop- lik1) and |pop- lik1|. Bothcontrasts were examined as main effects and as subjectwiseinteractions with the conformity parameter βj derived from theregression in Eq. (1). The subjectwise interactions identified regionsin which activity changes varied in association with the participant'stendency to conform to the popularity ratings.
arbaugh: %gambles on equal-EV gainrials
Harbaugh: %gambles on equal-EV losstrials
0.356 0.1190.045⁎ 0.5160.126 -0.1670.493 0.3600.237 -0.2540.192 0.161
-0.2380.189
dolescent Risk Questionnaire (ARQ), and gambling for gains on the Harbaugh gambling
2691G.S. Berns et al. / NeuroImage 49 (2010) 2687–2696
Finally, a first-level finite impulse response (FIR) model was alsoused to extract timecourse responses in regions of interest identified bythe aforementioned contrasts. The FIRmodel contained nine 2-s bins foreach of three listening conditions: listen1, listen2pop, and listen2nopop.
Results
Individual ratings and social influence
The mean likability rating was 2.40 (sd 1.15), indicating a widerange of appeal and good use of the full rating scale. The meanfamiliarity was 2.05 (sd 1.20), indicating that, on average, participantsdid not recognize the songs. There was, however, a positivecorrelation between likability and familiarity (R2=0.274, Pb0.001,31 df). The two panels in Fig. 2 illustrate the percentage of individualswho changed their ratings between the first and second listens. Thepopularity information had a significant effect on participants' ratingsof howmuch they liked the songs. The upper panel of the figure showsthat when no popularity information was given, participants changedtheir ratings in 11.6% of the trials. However, when popularity wasshown, they changed their ratings 21.9% of the time (P=0.0006,paired t-test, 31 df). The lower panel in the figure displays thepercentage of time (out of the trials in which the rating was changed)that the rating was changed in the direction of the popularity.Conditional on a change in rating, it was in the direction of theobserved popularity rating 38.3% of the time when the rating was notdisplayed versus 79.9% of the time when the popularity was shown(Pb0.00001). The figure clearly shows that the popularity ratinginfluenced individual ratings.
To measure the effects of popularity on the music ratings, weestimated Eq. (1) for each participant in all trials in which popularitywas observed. When the model was estimated at the individual level,individual subject β's ranged from 0 to 0.5, with a mean of 0.15
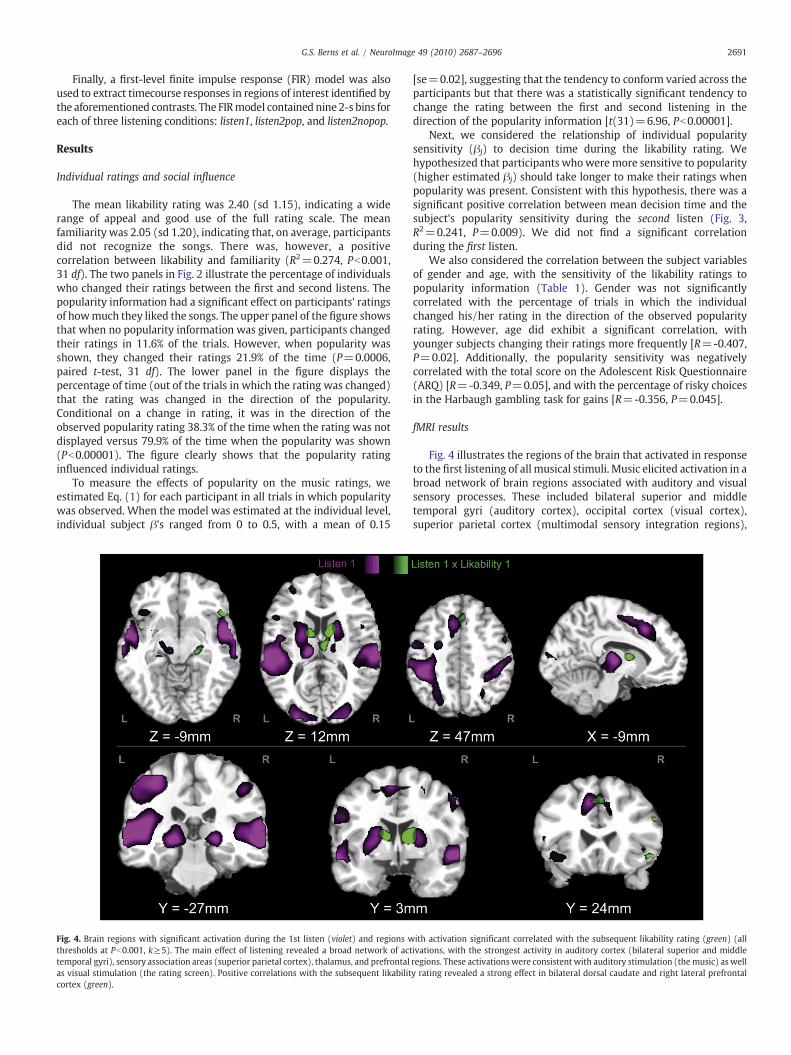
Fig. 4. Brain regions with significant activation during the 1st listen (violet) and regions wthresholds at Pb0.001, k≥5). The main effect of listening revealed a broad network of acttemporal gyri), sensory association areas (superior parietal cortex), thalamus, and prefrontalas visual stimulation (the rating screen). Positive correlations with the subsequent likabilitcortex (green).
[se=0.02], suggesting that the tendency to conform varied across theparticipants but that there was a statistically significant tendency tochange the rating between the first and second listening in thedirection of the popularity information [t(31)=6.96, Pb0.00001].
Next, we considered the relationship of individual popularitysensitivity (βj) to decision time during the likability rating. Wehypothesized that participants whowere more sensitive to popularity(higher estimated βj) should take longer to make their ratings whenpopularity was present. Consistent with this hypothesis, there was asignificant positive correlation between mean decision time and thesubject's popularity sensitivity during the second listen (Fig. 3,R2=0.241, P=0.009). We did not find a significant correlationduring the first listen.
We also considered the correlation between the subject variablesof gender and age, with the sensitivity of the likability ratings topopularity information (Table 1). Gender was not significantlycorrelated with the percentage of trials in which the individualchanged his/her rating in the direction of the observed popularityrating. However, age did exhibit a significant correlation, withyounger subjects changing their ratings more frequently [R=-0.407,P=0.02]. Additionally, the popularity sensitivity was negativelycorrelated with the total score on the Adolescent Risk Questionnaire(ARQ) [R=-0.349, P=0.05], and with the percentage of risky choicesin the Harbaugh gambling task for gains [R=-0.356, P=0.045].
fMRI results
Fig. 4 illustrates the regions of the brain that activated in responseto the first listening of all musical stimuli. Music elicited activation in abroad network of brain regions associated with auditory and visualsensory processes. These included bilateral superior and middletemporal gyri (auditory cortex), occipital cortex (visual cortex),superior parietal cortex (multimodal sensory integration regions),
ith activation significant correlated with the subsequent likability rating (green) (allivations, with the strongest activity in auditory cortex (bilateral superior and middleregions. These activations were consistent with auditory stimulation (themusic) as welly rating revealed a strong effect in bilateral dorsal caudate and right lateral prefrontal
Table 2Brain regions correlating with likability during the first listen (Pb0.001 and cluster size ≥5).
Label BA MNI Talairach T Size Correlationdirection
x y z x y z
Bilateral Caudate 12 6 9 12 6 8 6.23 197 PositiveR Inferior/Middle Frontal 9 57 21 27 56 22 24 5.12 17 PositiveR Inferior Frontal 47 51 24 −9 50 23 -9 4.29 12 PositiveR Sublobar/Parahippocamp 21 −15 −12 21 -15 -9 4.02 13 PositiveL Cingulate 32 −3 24 42 -3 25 37 3.99 35 PositiveR Superior Temporal 22 69 −39 12 68 -37 13 3.83 7 PositiveR Middle Temporal 21 57 −30 −3 56 -29 -1 3.68 6 PositiveL Supramarginal 40 -42 -51 36 -42 -48 36 4.45 10 NegativeR Middle Frontal 30 24 33 30 25 29 4.44 7 NegativeL Middle Occipital 37 -54 -69 3 -53 -67 6 4.31 10 NegativeR Supramarginal 40 54 -42 33 53 -39 32 4.23 50 NegativeL Insula 13 -45 -12 6 -45 -11 6 4.17 17 NegativeL Postcentral 2 -48 -24 30 -48 -22 29 4.12 19 NegativeR Postcentral 2 42 -24 33 42 -22 31 4.07 7 NegativeR Frontal 6 21 -6 57 21 -3 53 3.97 13 NegativeL Inferior Parietal 40 -57 -51 42 -56 -47 41 3.72 7 Negative
Table 4
2692 G.S. Berns et al. / NeuroImage 49 (2010) 2687–2696
thalamus, and basal ganglia (caudate nucleus and putamen). Theactivity in these regions was in comparison to the implicit baseline ofno stimulation and was previously expected to yield a broad patternof activity. In contrast, the correlation of activity during the first listenwith the subsequent likability rating revealed a much more restrictednetwork (Table 2). Greater activation was associated with a higherrating for the song. The activation data in the table are from during thefirst listen, but before the first rating was actually submitted. Theregions showing activity correlated with likability were largelydistinct from the auditory network and were restricted to bilateralcaudate nuclei, and right lateral prefrontal cortices (middle andinferior gyri). Negative correlations with likability were observed inbilateral supramarginal gyri, left insula, and several small frontalregions.
To test the hypothesis that popularity information changesintrinsic preferences, we used the mask generated by the positivecorrelation of likability with listen1 (Table 2) to measure the effect ofpopularity during listen2. At the usual threshold of Pb0.001, we didnot observe any significant positive correlations of activity with lis-ten2pop×(pop- lik1) within these regions. To guard against type IIerrors, we relaxed the threshold to Pb0.05 but still did not observeany significant positive correlations within these regions. Thissuggests that the effect of popularity was not exerted through achange in intrinsic preference for the music itself. We did, however,observe correlations of listen2pop×(pop- lik1) in other regionsincluding occipital cortex, right frontal and ACC (Table 3). Similarly,we found correlations of listen2pop×|pop- lik1| in regions outside ofthose identified by the “likability” network. These include significantpositive correlations in the left medial PFC and bilateral inferior PFC,and negative correlations in left parietal and temporal regions (Table4). The binary variable that coded trials during listen2pop in which thesubject changed her rating was significantly positively correlatedwithactivity only in bilateral middle PFC [MNI coordinates: 51,45,15(T=4.38, k=8, Pb0.001) and -39,30,18 (T=3.72, k=5, P=0.001)].
Table 3Brain regions showing a significant correlation with popularity shown (listen2pop) andthe covariate (pop- lik1) (Pb0.001 and cluster size ≥5).
Label BA MNI Talairach T Size Correlationdirection
x y z x y z
L Middle Occipital 19 -45 -78 6 -45 -75 9 3.82 31 PositiveR Middle Occipital 33 -75 3 33 -73 6 3.72 47 PositiveR Middle Frontal 42 39 -3 42 38 -4 4.15 49 NegativeR Superior Frontal 10 30 57 27 30 56 22 3.73 40 NegativeR Cingulate 9 6 27 36 6 28 32 3.52 52 Negative
The only region that was significantly negatively correlated was in theventral striatum [MNI coordinates: 0,12,-6 (T=3.96, k=8,Pb0.001)]. This latter finding means that ventral striatal activitydecreased when subjects changed their rating during the secondlisten (with popularity shown).
As either the informative or normative view of social influencewould predict, subjects who displayed behavioral evidence ofchanging their music ratings in response to popularity informationalso showed evidence of different neural responses to popularity. Thesubjectwise sensitivity to popularity exhibited significant interactionswith the presence/absence of popularity information during thesecond listen (Fig. 5 and Table 5). Using the difference, [listen2pop-listen2nopop], and interacting this with the subjectwise popularitysensitivity (βj), we found a positive interaction in bilateral anteriorinsula, ACC/SMA, and frontal poles. Given the known roles of theanterior insula and ACC in the cortical pain matrix, this suggests thatfeelings of anxiety accompanied the act of conforming. Furtherexamination of this interaction showed that much of the effect wasdriven by the subjectwise differences in activation to listen2pop (Fig. 6and Table 6). Interestingly, the negative interaction, listen2pop×βj,revealed significant differences in the middle temporal gyrus. Time-course extraction showed a sustained activation during the listeningperiod consistent with auditory processing, but the popularity-sensitive individuals showed significantly less activation. This suggeststhat sensitivity to popularity is also linked to less active listening.
Discussion
To our knowledge, this is the first neuroimaging study of the effectof popularity on the preference for a consumer good. Previous studiesof conformity have focused on perceptual effects (Berns et al., 2005)
Brain regions showing a significant correlation with popularity shown (listen2pop) andthe covariate |pop- lik1| (Pb0.001 and cluster size ≥5).
Label BA MNI Talairach Size Correlationdirection
x y z x y z T
L Medial Frontal 10 -3 57 18 -3 56 14 4.51 193 PositiveL Inferior Frontal 47 -54 21 0 -53 20 -1 4.14 74 PositiveR Inferior Frontal 51 33 -9 50 32 -9 3.72 38 PositiveL Inferior Parietal 25 -48 -36 36 -47 -33 35 5.19 174 NegativeL Precuneus -12 -39 42 -12 -36 40 5.02 375 NegativeL Middle Temporal -45 -75 18 -45 -72 20 4.40 188 NegativeR Precuneus 21 -63 24 21 -60 25 4.35 351 NegativeL Parahippocampal -21 -42 -6 -21 -41 -3 4.25 45 NegativeR Insula 22 48 -3 -3 48 -3 -2 4.08 105 Negative
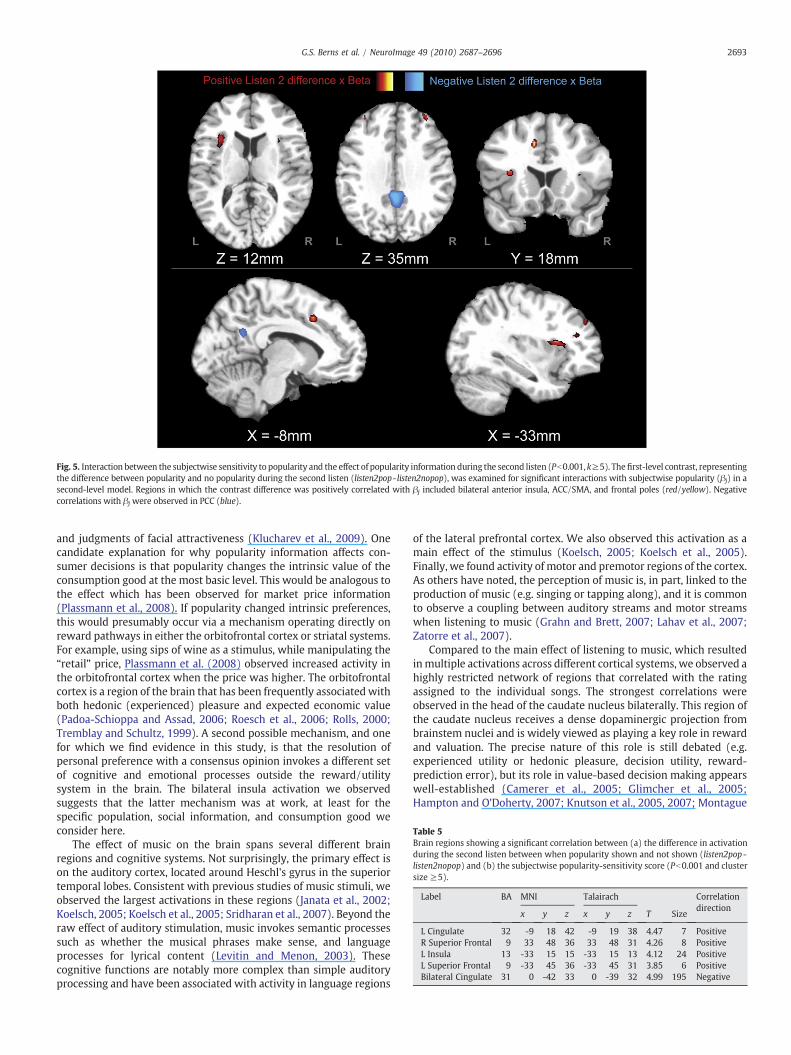
Fig. 5. Interaction between the subjectwise sensitivity to popularity and the effect of popularity information during the second listen (Pb0.001, k≥5). Thefirst-level contrast, representingthe difference between popularity and no popularity during the second listen (listen2pop- listen2nopop), was examined for significant interactions with subjectwise popularity (βj) in asecond-level model. Regions in which the contrast difference was positively correlated with βj included bilateral anterior insula, ACC/SMA, and frontal poles (red/yellow). Negativecorrelations with βj were observed in PCC (blue).
Table 5Brain regions showing a significant correlation between (a) the difference in activationduring the second listen between when popularity shown and not shown (listen2pop -listen2nopop) and (b) the subjectwise popularity-sensitivity score (Pb0.001 and clustersize ≥5).
Label BA MNI Talairach Correlationdirection
x y z x y z T Size
L Cingulate 32 -9 18 42 -9 19 38 4.47 7 PositiveR Superior Frontal 9 33 48 36 33 48 31 4.26 8 PositiveL Insula 13 -33 15 15 -33 15 13 4.12 24 PositiveL Superior Frontal 9 -33 45 36 -33 45 31 3.85 6 PositiveBilateral Cingulate 31 0 -42 33 0 -39 32 4.99 195 Negative
2693G.S. Berns et al. / NeuroImage 49 (2010) 2687–2696
and judgments of facial attractiveness (Klucharev et al., 2009). Onecandidate explanation for why popularity information affects con-sumer decisions is that popularity changes the intrinsic value of theconsumption good at the most basic level. This would be analogous tothe effect which has been observed for market price information(Plassmann et al., 2008). If popularity changed intrinsic preferences,this would presumably occur via a mechanism operating directly onreward pathways in either the orbitofrontal cortex or striatal systems.For example, using sips of wine as a stimulus, while manipulating the“retail” price, Plassmann et al. (2008) observed increased activity inthe orbitofrontal cortex when the price was higher. The orbitofrontalcortex is a region of the brain that has been frequently associated withboth hedonic (experienced) pleasure and expected economic value(Padoa-Schioppa and Assad, 2006; Roesch et al., 2006; Rolls, 2000;Tremblay and Schultz, 1999). A second possible mechanism, and onefor which we find evidence in this study, is that the resolution ofpersonal preference with a consensus opinion invokes a different setof cognitive and emotional processes outside the reward/utilitysystem in the brain. The bilateral insula activation we observedsuggests that the latter mechanism was at work, at least for thespecific population, social information, and consumption good weconsider here.
The effect of music on the brain spans several different brainregions and cognitive systems. Not surprisingly, the primary effect ison the auditory cortex, located around Heschl's gyrus in the superiortemporal lobes. Consistent with previous studies of music stimuli, weobserved the largest activations in these regions (Janata et al., 2002;Koelsch, 2005; Koelsch et al., 2005; Sridharan et al., 2007). Beyond theraw effect of auditory stimulation, music invokes semantic processessuch as whether the musical phrases make sense, and languageprocesses for lyrical content (Levitin and Menon, 2003). Thesecognitive functions are notably more complex than simple auditoryprocessing and have been associated with activity in language regions
of the lateral prefrontal cortex. We also observed this activation as amain effect of the stimulus (Koelsch, 2005; Koelsch et al., 2005).Finally, we found activity of motor and premotor regions of the cortex.As others have noted, the perception of music is, in part, linked to theproduction of music (e.g. singing or tapping along), and it is commonto observe a coupling between auditory streams and motor streamswhen listening to music (Grahn and Brett, 2007; Lahav et al., 2007;Zatorre et al., 2007).
Compared to the main effect of listening to music, which resultedinmultiple activations across different cortical systems, we observed ahighly restricted network of regions that correlated with the ratingassigned to the individual songs. The strongest correlations wereobserved in the head of the caudate nucleus bilaterally. This region ofthe caudate nucleus receives a dense dopaminergic projection frombrainstem nuclei and is widely viewed as playing a key role in rewardand valuation. The precise nature of this role is still debated (e.g.experienced utility or hedonic pleasure, decision utility, reward-prediction error), but its role in value-based decision making appearswell-established (Camerer et al., 2005; Glimcher et al., 2005;Hampton and O'Doherty, 2007; Knutson et al., 2005, 2007; Montague
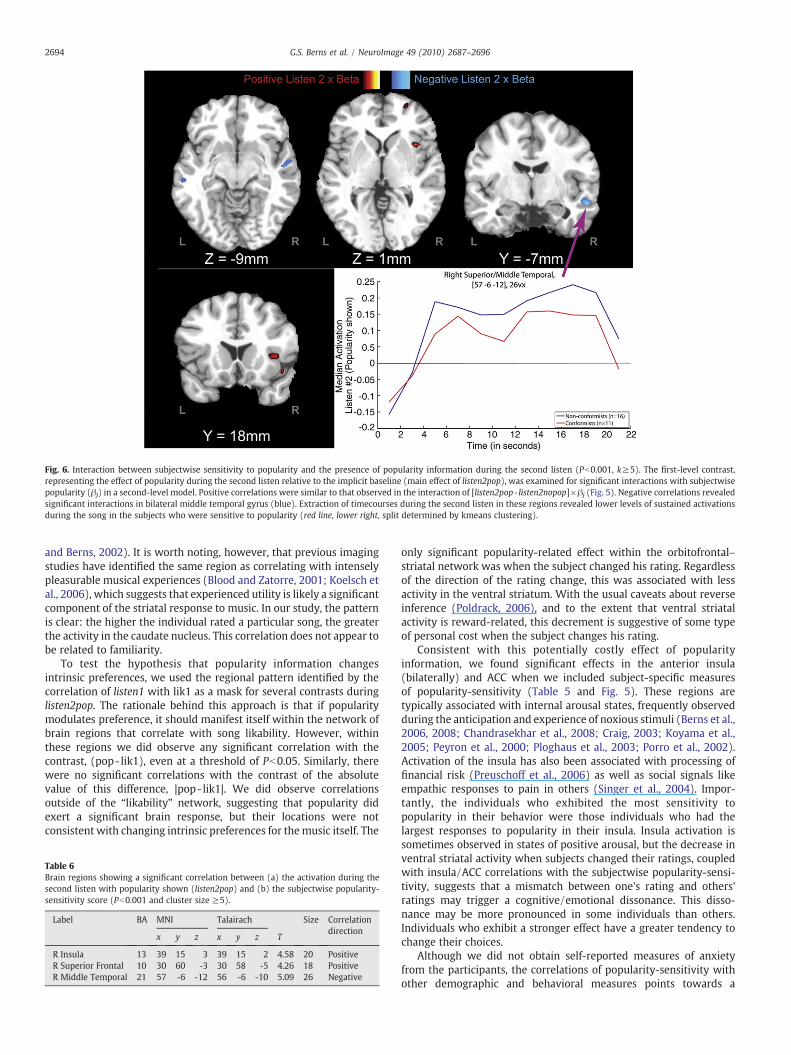
Fig. 6. Interaction between subjectwise sensitivity to popularity and the presence of popularity information during the second listen (Pb0.001, k≥5). The first-level contrast,representing the effect of popularity during the second listen relative to the implicit baseline (main effect of listen2pop), was examined for significant interactions with subjectwisepopularity (βj) in a second-level model. Positive correlations were similar to that observed in the interaction of [listen2pop- listen2nopop]×βj (Fig. 5). Negative correlations revealedsignificant interactions in bilateral middle temporal gyrus (blue). Extraction of timecourses during the second listen in these regions revealed lower levels of sustained activationsduring the song in the subjects who were sensitive to popularity (red line, lower right, split determined by kmeans clustering).
2694 G.S. Berns et al. / NeuroImage 49 (2010) 2687–2696
and Berns, 2002). It is worth noting, however, that previous imagingstudies have identified the same region as correlating with intenselypleasurable musical experiences (Blood and Zatorre, 2001; Koelsch etal., 2006), which suggests that experienced utility is likely a significantcomponent of the striatal response to music. In our study, the patternis clear: the higher the individual rated a particular song, the greaterthe activity in the caudate nucleus. This correlation does not appear tobe related to familiarity.
To test the hypothesis that popularity information changesintrinsic preferences, we used the regional pattern identified by thecorrelation of listen1 with lik1 as a mask for several contrasts duringlisten2pop. The rationale behind this approach is that if popularitymodulates preference, it should manifest itself within the network ofbrain regions that correlate with song likability. However, withinthese regions we did observe any significant correlation with thecontrast, (pop- lik1), even at a threshold of Pb0.05. Similarly, therewere no significant correlations with the contrast of the absolutevalue of this difference, |pop- lik1|. We did observe correlationsoutside of the “likability” network, suggesting that popularity didexert a significant brain response, but their locations were notconsistent with changing intrinsic preferences for themusic itself. The
Table 6Brain regions showing a significant correlation between (a) the activation during thesecond listen with popularity shown (listen2pop) and (b) the subjectwise popularity-sensitivity score (Pb0.001 and cluster size ≥5).
Label BA MNI Talairach Size Correlationdirection
x y z x y z T
R Insula 13 39 15 3 39 15 2 4.58 20 PositiveR Superior Frontal 10 30 60 -3 30 58 -5 4.26 18 PositiveR Middle Temporal 21 57 -6 -12 56 -6 -10 5.09 26 Negative
only significant popularity-related effect within the orbitofrontal–striatal network was when the subject changed his rating. Regardlessof the direction of the rating change, this was associated with lessactivity in the ventral striatum. With the usual caveats about reverseinference (Poldrack, 2006), and to the extent that ventral striatalactivity is reward-related, this decrement is suggestive of some typeof personal cost when the subject changes his rating.
Consistent with this potentially costly effect of popularityinformation, we found significant effects in the anterior insula(bilaterally) and ACC when we included subject-specific measuresof popularity-sensitivity (Table 5 and Fig. 5). These regions aretypically associated with internal arousal states, frequently observedduring the anticipation and experience of noxious stimuli (Berns et al.,2006, 2008; Chandrasekhar et al., 2008; Craig, 2003; Koyama et al.,2005; Peyron et al., 2000; Ploghaus et al., 2003; Porro et al., 2002).Activation of the insula has also been associated with processing offinancial risk (Preuschoff et al., 2006) as well as social signals likeempathic responses to pain in others (Singer et al., 2004). Impor-tantly, the individuals who exhibited the most sensitivity topopularity in their behavior were those individuals who had thelargest responses to popularity in their insula. Insula activation issometimes observed in states of positive arousal, but the decrease inventral striatal activity when subjects changed their ratings, coupledwith insula/ACC correlations with the subjectwise popularity-sensi-tivity, suggests that a mismatch between one's rating and others'ratings may trigger a cognitive/emotional dissonance. This disso-nance may be more pronounced in some individuals than others.Individuals who exhibit a stronger effect have a greater tendency tochange their choices.
Although we did not obtain self-reported measures of anxietyfrom the participants, the correlations of popularity-sensitivity withother demographic and behavioral measures points towards a
2695G.S. Berns et al. / NeuroImage 49 (2010) 2687–2696
dissonance mechanism. We found significant negative correlationsof popularity sensitivity with age, engagement in risky activities onthe Adolescent Risk Questionnaire (ARQ), and lottery preferences onthe Harbaugh gambling task. Although age and ARQ are positivelycorrelated with each other, the direction of these correlations showsthat the participants who were most influenced by the musicpopularity ratings were relatively young, did not engage indrinking/drugs/sex, and were risk-averse over financial gains. Theconsistent direction of these correlations suggests that thesesubjects were more risk-averse across a variety of domains. Thisrisk aversion may lead an individual to refrain from high-risk/highsensation teen activities like sex and drugs, while simultaneouslybeing averse to financial gambles, and also being sensitive tobehaving differently than what is considered popular. Indeed, theconfluence of findings paints a picture of an anxious type of person.This interpretation is also consistent with a growing body of datathat implicate the anterior insula in interoceptive processing,especially in the presence of threatening stimuli (Craig, 2002;Critchley et al., 2004).
Although there are very few imaging studies of conformity per se,our results seem, in part, consistent with others' findings. In aprevious study, our group found evidence for conformity-relatedactivity changes in occipital and parietal areas during a task of mentalrotation, but we also found activation of the amygdala whenindividuals went against the group opinion (Berns et al., 2005). Thisstudy was quite different in both the task and the incentives, yet theamygdala is another key structure in the arousal circuits of the brain.Anterior insula activation has also been associated with Machiavellianpersonality traits when social norms are enforced by the threat ofpunishment during a financial transfer game (Spitzer et al., 2007), andwhen subjects received unfair offers during the ultimatum game(Sanfey et al., 2004). In addition, ACC activity was greater inindividuals sensitive to popularity in our study. ACC activation hasalso been observed in prior studies in individuals who experiencesocial exclusion in a ball-tossing game (Eisenberger et al., 2003) andin a study of neural responses to conformity and facial attractiveness(Klucharev et al., 2009). This last result was interpreted as represent-ing the conflict between individual and group opinion. Such a conflictcould also explain our findings if subjects found it distressing toconform to popular opinion. Unlike Klucharev et al., however, we didnot observe ACC correlation with the contrast listen2pop×|pop- lik1|,which may reflect differences in the medium of decision making(faces vs. music) or that our task was anchored in a consumptiondecision for music (i.e. incentive compatibility), or that the ACCresponse was present only in subjects who were sensitive topopularity information.
Our finding that popularity is not associated with striatalactivation suggests that music popularity ratings do not affectadolescents' preferences over music (if striatal activation can beinterpreted as representing reward value). Clearly, we do not knowwhether a lack of a preference effect would be carried over to differentconsumption goods and age cohorts. However, based on our studyand previous researchmentioned above, it seems that onemechanismby which social influence affects behavior is through generatingmismatch anxiety. The mechanism may be operative and influencebehavior in a broad class of environments. There are at least twointeresting implications of our neurobiological study of conformitythat we believe may help economists in formulating models ofconformity. The first is that mimicking others seems to be, at least inpart, motivated by the need to avoid the disutility from being acontrarian rather than by the pursuit of a positive utility from doingthe same thing as others. The second is that anxiety associated withconformity is a cost that perhaps economists should take into accountwhen performing welfare calculations.
Finally, we found significantly lower levels of activation in themiddle temporal gyrus of subjects who were sensitive to the
popularity information. The timecourse of activity in this regionshowed a sustained activation during the song and strongly suggests amusical semantic process (Koelsch, 2005). Conformists had loweractivity across the whole song period relative to non-conformists,indicating that their sensitivity to popularity was also related to thedegree to which they may have paid attention to the musicalsemantics of the song itself, which includes chord progressions,rhythm and lyrics.
Acknowledgments
We are grateful to the National Institute on Drug Abuse (NIDA) forgrant support of this project (R01DA016434 andR01DA20116 toG.S.B.).
References
Ariely, D., Loewenstein, G., Prelec, D., 2006. Tom Sawyer and the construction of value. J.Econ. Behav. Org. 60, 1–10.
Asch, S.E., 1951. Effects of group pressure upon the modification and distortion ofjudgements. In: Guetzkow, H.S. (Ed.), Groups, Leadership and Men. Research inHuman Relations. Carnegie Press, Pittsburgh, pp. 177–190.
Asch, S.E., 1952. Social Psychology. Prentice-Hall, Inc., New York.Bearden, W.O., Rose, R.L., 1990. Attention to social comparison information: an
individual difference factor affecting consumer conformity. J. Consum. Res. 16,461–471.
Berns, G.S., Chappelow, J.C., Zink, C.F., Pagnoni, G., Martin-Skurski, M.E., Richards, J.,2005. Neurobiological correlates of social conformity and independence duringmental rotation. Biol. Psychiatry 58, 245–253.
Berns, G.S., Chappelow, J.C., Cekic, M., Zink, C.F., Pagnoni, G., Martin-Skurski, M.E., 2006.Neurobiological substrates of dread. Science 312, 754–758.
Berns, G.S., Capra, C.M., Chappelow, J., Moore, S., Noussair, C., 2008. Nonlinearneurobiological probabilityweighting functions for aversive outcomes. NeuroImage39, 2047–2057.
Bettman, R.J., Luce, M.F., Payne, J.W., 1998. Constructive consumer choice processes. J.Consum. Res. 25, 187–217.
Blood, A.J., Zatorre, R.J., 2001. Intensely pleasurable responses to music correlate withactivity in brain regions implicated in reward and emotion. Proc. Natl. Acad. Sci. U. S. A.98, 11818–11823.
Camerer, C., Loewenstein, G., Prelec, D., 2005. Neuroeconomics: how neuroscience caninform economics. J. Econ. Lit. XLIII 9–64.
Capra, C.M., Li, L., 2008. Conformity in contribution games: gender and group effects.Emory University Working Paper.
Carpenter, J., 2004. When in Rome: conformity and the provision of public goods. J.Socio-Econ. 33, 395–408.
Cason, T.N., Mui, V.-L., 1998. Social influence in the sequential dictator game. J. Math.Psychol. 42, 248–265.
Chandrasekhar, P.V., Capra, C.M., Moore, S., Noussair, C., Berns, G.S., 2008. Neurobio-logical regret and rejoice functions for aversive outcomes. NeuroImage 39,1472–1484.
Childers, T., Rao, A., 1992. The influence of familial and peer-based reference groups onconsumer decisions. J. Consum. Res. 19, 198–211.
Cialdini, R.B., Goldstein, N.J., 2004. Social influence: compliance and conformity. Annu.Rev. Psychol. 55, 591–621.
Cooper, D., Rege, M., 2008. Social interaction effects and choice under uncertainty: anexperimental study. Florida State University Working Paper.
Craig, A.D., 2002. How do you feel? Interoception: the sense of the physiologicalcondition of the body. Nat. Rev. Neurosci. 3, 655–666.
Craig, A.D., 2003. Pain mechanisms: labeled lines versus convergence in centralprocessing. Annu. Rev. Neurosci. 26, 1–30.
Critchley, H.D., Wiens, S., Rotshtein, P., Ohman, A., Dolan, R.J., 2004. Neural systemssupporting interoceptive awareness. Nat. Neurosci. 7, 189–195.
Deutsch, M., Gerard, H.B., 1955. A study of normative and informational socialinfluences upon individual judgment. J. Abnorm. Soc. Psychol. 51, 629–636.
Eisenberger, N.I., Lieberman, M.D., Williams, K.D., 2003. Does rejection hurt? An fMRIstudy of social exclusion. Science 302, 290–292.
Escalas, J., Bettman, J.R., 2005. Self-construal, reference groups, and brand meaning. J.Consum. Res. 32, 378–389.
Galvan, A., Hare, T.A., Parra, C.E., Penn, J., Voss, H., Glover, G., Casey, B.J., 2006. Earlierdevelopment of the accumbens relative to orbitofrontal cortex might underlie risk-taking behavior in adolescents. J. Neurosci. 26, 6885–6892.
Glimcher, P.W., Dorris, M.C., Bayer, H.M., 2005. Physiological utility theory and theneuroeconomics of choice. Games Econ. Behav. 52, 213–256.
Grahn, J.A., Brett, M., 2007. Rhythm and beat perception in motor areas of the brain. J.Cogn. Neurosci. 19, 893–906.
Gullone, E., Moore, S., Moss, S., Boyd, C., 2000. The adolescent risk-taking questionnaire:development and psychometric evaluation. J. Adolesc. Res. 15, 231–250.
Hampton, A.N., O'Doherty, J.P., 2007. Decoding the neural substrates of reward-related decision-making with functional MRI. Proc. Natl. Acad. Sci. U. S. A. 104,1377–1382.
Harbaugh, W.T., Krause, K., Vesterlund, L., 2002. Risk attitudes of children and adults:choices over small and large probability gains and losses. Exp. Econ. 5, 53–84.
2696 G.S. Berns et al. / NeuroImage 49 (2010) 2687–2696
Janata, P., Birk, J.L., van Horn, J.D., Leman, M., Tillman, B., Bharucha, J.J., 2002. The corticaltopography of tonal structures underlying western music. Science 298, 2167–2170.
Klucharev, V., Hytönen, K., Rijpkema, M., Smidts, A., Fernández, G., 2009. Reinforcementlearning signal predicts social conformity. Neuron 61, 140–151.
Knutson, B., Taylor, J., Kaufman, M., Peterson, R., Glover, G., 2005. Distributed neuralrepresentation of expected value. J. Neurosci. 25, 4806–4812.
Knutson, B., Rick, S., Wimmer, G.E., Prelec, D., Loewenstein, G., 2007. Neural predictorsof purchases. Neuron 53, 147–156.
Koelsch, S., 2005. Neural substrates of processing syntax and semantics in music. Curr.Opin. Neurobiol. 15, 207–212.
Koelsch, S., Fritz, T., Schulze, K., Alsop, D., Schlaug, G., 2005. Adults and childrenprocessing music: an fMRI study. NeuroImage 25, 1068–1076.
Koelsch, S., Fritz, T., Von Cramon, D.Y., Muller, K., Friederici, A.D., 2006. Investigatingemotion with music: an fMRI study. Hum. Brain Mapp. 27, 239–250.
Koyama, T., McHaffie, J.G., Laurienti, P.J., Coghill, R.C., 2005. The subjective experience ofpain: where expectations become reality. Proc. Natl. Acad. Sci. U. S. A. 102,12950–12955.
Lahav, A., Saltzman, E., Schlaug, G., 2007. Action representation of sound: audiomotorrecognitionnetworkwhile listening to newly acquired actions. J.Neurosci. 27, 308–314.
Lascu, D.N., Zinkhan, G., 1999. Consumer conformity: review and applications formarketing theory and practice. J. Mark. Theory Pract. 7, 1–12.
Levitin, D.J., Menon, V., 2003. Musical structure is processed in “language” areas of thebrain: a possible role for Brodmann Area 47 in temporal coherence. NeuroImage 20.
Montague, P.R., Berns, G.S., 2002. Neural economics and the biological substrates ofvaluation. Neuron 36, 265–284.
Padoa-Schioppa, C., Assad, J.A., 2006. Neurons in the orbitofrontal cortex encodeeconomic value. Nature 441, 223–226.
Peyron, R., Laurent, B., Garcia-Larrea, L., 2000. Functional imaging of brain responses topain. A review and meta-analysis. Neurophysiol. Clin. 30, 263–288.
Plassmann, H., O'Doherty, J., Shiv, B., Rangel, A., 2008. Marketing actions can modulateneural representations of experienced pleasantness. Proc. Natl. Acad. Sci. U. S. A.105, 1050–1054.
Ploghaus, A., Becerra, L., Borras, C., Borsook, D., 2003. Neural circuitry underlying painmodulation: expectation, hypnosis, placebo. Trends Cogn. Sci. 7, 197–200.
Poldrack, R.A., 2006. Can cognitive processes be inferred from neuroimaging data?Trends Cogn. Sci. 10, 59–63.
Porro, C.A., Barardi, P., Pagnoni, G., Serafini, M., Facchin, P., Maieron, M., Nichelli, P.,2002. Does anticipation of pain affect cortical nociceptive systems? J. Neurosci. 22,3206–3214.
Preuschoff, K., Bossaerts, P., Quartz, S.R., 2006. Neural differentiation of expectedreward and risk in human subcortical structures. Neuron 51, 381–390.
Rangel, A., Camerer, C., Montague, P.R., 2008. A framework for studying theneurobiology of value-based decision making. Nat. Rev. Neurosci. 9, 545–556.
Roesch, M.R., Taylor, A.R., Schoenbaum, G., 2006. Encoding of time-discounted rewardsin orbitofrontal cortex is independent of value representation. Neuron 51, 509–520.
Rolls, E.T., 2000. The orbitofrontal cortex and reward. Cereb. Cortex 10, 284–294.Sanfey, A.G., Rilling, J.K., Aronson, J.A., Nystrom, L.E., Cohen, J.D., 2004. The neural basis
of economic decision-making in the Ultimatum Game. Science 300, 1755–1758.Singer, T., Seymour, B., O'Doherty, J., Kaube, H., Dolan, R.J., Frith, C.D., 2004. Empathy for
pain involves the affective but not sensory components of pain. Science 303,1157–1162.
Slovic, P., 1995. The construction of preference. Am. Psychol. 50, 364–371.Spitzer, M., Fischbacher, U., Herrnberger, B., Gron, G., Fehr, E., 2007. The neural
signature of social norm compliance. Neuron 56, 185–196.Sridharan, D., Levitin, D.J., Chafe, C.H., Berger, J., Menon, V., 2007. Neural dynamics of
event segmentation in music: converging evidence for dissociable ventral anddorsal networks. Neuron 55, 521–532.
Steinberg, L., Monahan, K.C., 2007. Age differences in resistance to peer influence. Dev.Psychol. 43, 1531–1543.
Tremblay, L., Schultz, W., 1999. Relative reward preference in primate orbitofrontalcortex. Nature 398, 704–708.
Zatorre, R.J., Chen, J.L., Penhume, V.B., 2007. When the brain plays music: auditory–motor interactions in music perception and production. Nat. Rev. Neurosci. 8,547–558.
Related Documents