INSTITUTIONEN FÖR PSYKOLOGI Neural Correlates of Emotional Retrieval Orientation An electrophysiological investigation into strategic retrieval processing of emotional memories Emelie Stiernströmer Magisteruppsats HT 2010 Handledare: Mikael Johansson

Welcome message from author
This document is posted to help you gain knowledge. Please leave a comment to let me know what you think about it! Share it to your friends and learn new things together.
Transcript
INSTITUTIONEN FÖR PSYKOLOGI
Neural Correlates of Emotional Retrieval Orientation
An electrophysiological investigation into strategic retrieval processing of emotional
memories
Emelie Stiernströmer
Magisteruppsats HT 2010
Handledare: Mikael Johansson
2
ABSTRACT
Retrieval Orientation refers to the differential processing of memory retrieval cues
according to the sought after information (Rugg & Wilding, 2000). The study manipulated
the orientation effect by varying the retrieval demand on a block basis using two
emotional source recognition conditions and a non-emotional old-new recognition
condition. Event-Related Potentials (ERPs) evoked by new faces in the two emotional
conditions differed reliably from those of the non-emotional condition. The ERPs of the
former conditions were more negative than those of the latter non-emotional condition
from 200-400 and 500 -700msec post-stimulus, showing a frontal and mid centre parietal
distribution respectively. From 900 -1100msec the critical ERPs from the former conditions
were more positive going than the later non-emotional condition, showing a frontal
distribution. Valence congruent relationships were additionally found between emotional
retrieval orientation, emotional memory retrieval and degrees of wellbeing.
I would like to thank my supervisor Mikael Johansson for giving me the opportunity
to conduct this study as well as for his patience, creative and much appreciated
comments. I would also like to thank Arthur Schneider for his helpful linguistic
comments and Kenneth Holmqvist at Lund University’s Humanist laboratory for
allowing me to conduct my study at their EEG/ERP lab.
3
The present study is a neuropsychological investigation into the concept of retrieval
orientation - a memory retrieval process denoting the differential processing of retrieval
cues according to the form of the sought after information (Rugg & Wilding, 2000). The
primary aim of this study is to characterize amplitude differences in the brain’s
electrophysiological response to ‘new’ (previously unstudied) items in memory recognition
tests, using two emotional source recognition exclusion tasks and a third non-emotional
old-new recognition inclusion task.
The study adds to contemporary research fields by questioning (1) whether the
orientation effect can be extended to source recognition tasks in which the retrieval
demands vary by means of emotion, supporting the existence of an “emotional retrieval
orientation”. (2) Whether the emotional orientation effect will prove to be valence specific,
indicating that searching for positive memories establishes unique ERP correlates of
positive orientation, different from the ERP correlates created when searching for negative
memories. If in fact an emotional orientation effect can be established (be it valence-
specific or in general) the study will furthermore question (3) a potential valence congruent
relationship between the emotional orientation effect and emotional memory performance.
The study also contributes to contemporary research by questioning (4) a valence
congruent relationship between emotional orientation and wellbeing.
Attempting to elucidate these questions, the current study converges on several
relevant research fields. The first section contains an elaboration of episodic memory
containing several important sub-sections relevant for an understanding of episodic
memory retrieval. From episodic memory, a transition is made to retrieval processes – the
processes engaged when attempting to retrieve information. This section is fundamental to
the study since it attempts to elucidate the concept of retrieval orientation. The following
two sections concern emotional memory and memory binding. While the former section
introduces research literature demonstrating differences between emotional and non-
emotional memories, the latter section introduces the concept of memory binding and its
neural mechanisms. The last section adheres to the discussion on depression and mood
disorders and its biased effect on emotional memory. While it is beyond the scope of this
study to provide a detailed overview of either of these research fields, the discussion will be
limited to only the general aspects pertinent to this study necessary for an understanding
of the current study.
4
Episodic Memory
Remembering a prior personal event, be it emotional or non-emotional, requires
retrieving information concerning the event from our episodic memory, i.e. memories for
personal events belonging to a specific temporal and spatial context (Tulving, 1983, 2002).
Retrieving this information entails an interaction between a retrieval cue and a memory
trace. Together they reconstruct either selective parts or all aspects of the event in
question. To maximize the likelihood of the interactions between the retrieval cue and the
specific stored memory representation, two conditions must be met. First, one must be in a
certain cognitive state, referred to as ‘ a retrieval mode’ (Tulving, 1983), and second, a
retrieval cue must successfully trigger the probed-for memory (Tulving, 1983). These
notions are presented in principles such as The Transfer Appropriate Processing principle and
Encoding Specificity (Tulving & Thomposon, 1973; Morris et al. 1977). Generally speaking,
while the former principle proposes that memory is best when retrieved under
circumstances identical to the original experience, the latter proposes that retrieval cues
are more effective when they are processed in a manner that more closely resembles the
nature of the encoded information.
On a neuronal level the initial experience of an event (i.e. the encoding) elicits a
widely distributed pattern of activity in the neocortex, reflecting sensory and higher order
cognitive processes (McClelland, McNaughton, & O’Reilley, 1995). These neocortical
patterns are represented in a sparse format in the hippocampus, a process referred to as
pattern separation (McClelland et al. 1995). Each event receives its own hippocampal index
and each event is thereby bound into a coherent memory trace that is kept separate from
other memory traces for other events. A later re-presentation of the event (i.e. by a
retrieval cue) leads up to a partial re-instatement of the original pattern of cortical activity
during encoding. The overlap between this activity and the pattern of stored activity in the
hippocampal index causes the hippocampal representation to be re-activated. This re-
activation then causes a full reinstatement of the event at the cortical level (Norman, &
O’Reilly, 2003). This full reinstatement of cortical activity is what is said to constitute the
basis for an episodic memory experience (Rugg, Johnson, Park, & Uncapher, 2008). Memory
retrieval is possible, however, even when the overlap between a retrieval cue and the
memory trace is less than perfect. This is due to the effectiveness of hippocampus, in
generating what is termed pattern completion. Pattern completion implies that activity
5
that only partially overlaps with the hippocampal index may be sufficient to enable a
reinstatement of the stored memory (McClelland et al., 1995; Schacter, Norman & Koutstaal,
1998).
Interactions between medial temporal lobe (MTL) and prefrontal cortex (PFC) are
imperative for the encoding and retrieval of episodic memory. It is assumed that the PFC
exerts cognitive control by maintaining task-relevant processing and inhibiting task-
irrelevant processing (Miller & Cohen, 2001). Dorsolateral and ventrolateral (VLPFC;
Petrides & Mackey, 2006) prefrontal cortices are vital regions of the PFC for the encoding
and retrieval of episodic memory (Simons & Spiers, 2003; Wagner, 2002). Both VLPFC and
DLPFC support the organisation and evaluation of information before encoding. While the
former specifies retrieval cues in order to activate relevant hippocampal memory traces
during retrieval (Simons & Spiers, 2003), the latter is assumed to mediate the monitoring
and evaluation of the retrieved memories that are maintained by the VLPFC (Simons &
Spiers, 2003; Wagner, 2002).
Retrieving an episodic memory often entails retrieving contextual details associated
with that event, for instance, the context in which the event occurred. Such memories are
referred to as source memories, since they entail information that identifies the condition
(i.e. the emotional context in which a specific event occurred) under which memories were
acquired, such as the spatial, temporal and social context (Johnson, Hashroudi & Lindsay,
1993).
Source- Monitoring Framework (SMF; Johnson et al. 1993; Schacter et al. 1998),
emphasizing the strategic use of memory, proclaims that source memories can be attained
by taking into account the distribution of numerous qualitative characteristics of a memory
trace. These characteristics should differ from events of different origins. A good
illustration is a memory trace for a heard word. A heard word will contain more perceptual
information than the memory trace for an imagined heard word (Johnson, Foley, Leach,
1988). Consequently, one strategy a person could adopt in order to distinguish the real from
an imagined word is to evaluate the amount of perceptual detail in the memory trace. This
selective focus on certain kinds of task-relevant information is an example of Strategic
Retrieval Processing. The term refers to processes engaged during memory retrieval in
accordance with the specific demands of the type of memory judgement that is required.
6
Retrieval Processes: Retrieval Orientation
Retrieval processing is the term given to processes engaged when attempting to
retrieve information from episodic memory. Rugg & Wilding (2002) presented an influential
four-way classification of retrieval processes (retrieval effort, retrieval mode, retrieval
success and retrieval orientation) along with a discussion on how to index their neural
activity using Event Related brain Potentials (ERPs).
ERPs have been proven particularly useful for the study of memory retrieval because
of the ease with which neural activity associated with different forms of retrieval can be
compared. ERPs are small voltage changes in the electroencephalogram (EEG) that are
induced by sensory, cognitive or motor processes (Friedman & Johnsson, 2000; Luck, 2005).
Given the high temporal resolution in milliseconds on ERPs they offer an estimate of the
time required to perform a cognitive operation, for example to differentiate classes of
stimuli (e.g. old and new items in a memory recognition task). A comparison of the scalp
distributions of ERP effects can be used to investigate whether different classes of stimulus
can evoke different patters of neural activity. Differences in scalp distributions may
indicate that those stimuli engage functionally different processes (Luck, 2005).
Of particular interest for the current study is the process, referred to as retrieval
orientation. This is a strategic retrieval process referring to the differential processing of
retrieval cues according to the form of the sought after information. Adopting specific
retrieval orientations allegedly permit us to focus retrieval attempts on a selective subset of
the memories that are encoded in a given spatio-temporal context (Herron & Rugg, 2003).
While the research literature on retrieval orientation is still fairly scarce, the majority
of research into this field has come from ERP studies using a variety of source memory tasks
(i.e. tasks that require explicit recovery of contextual detail about the study episode). In
support of each other, these empirical studies suggest that the neural activity elicited by
physically identical cues does indeed vary with the nature of the information being sought
(Wilding & Nobre, 2001; Ranganath & Paller, 1999, 2000; Bridger, Herron, Elward, & Widling,
2009; Herron & Rugg, 2003; Dzulkifli, Sharpe, & Wilding, 2004; Dzulkifli & Wilding, 2005;
Stenberg, Johansson & Rosén, 2005). Other studies have used simpler old-new recognition
tasks demonstrating the same findings (Herron & Rugg, 2004; Robb & Rugg, 2002; Rugg,
Allan & Birch, 2000; Hornberger, Morcom, & Rugg, 2004).
7
The research literature on retrieval orientation, established using various kinds of
retrieval demands and stimuli, has reported diverse findings (Dzulkifli, Sharpe, & Wilding,
2004; Dzulkifli & Wilding, 2005; Herron & Rugg, 2003; Hornberger, Morcom, & Rugg, 2004;
Hornberger, Rugg, & Henson, 2006; Johnson, Kounios & Nolde, 1997; Ranganath & Paller,
1999, 2000; Robb & Rugg, 2002; Stenberg, Johansson & Rosén, 2005; Rugg, Allan & Birch,
2000; Bridger, et al., 2009). Yet it is the diversity in these results that supports the notion of
strategic retrieval processing in that they all support the idea that the processes that are
indexed vary according to specific task demands, just as would be suggested if they index
strategic retrieval processing operations.
Indexing the strategic orientation effects requires further clarification. To reveal the
neural correlates of different orientation effects, one must contrast physically identical
retrieval cues either across memory tasks that differ in task retrieval demands or across
‘new’ test items differing from the material encoded at study (Rugg & Wilding, 2000). The
rationale behind this argument is that in such contrast, any differences between the neural
activities can then be attributed to processes that are engaged strategically according to the
specific retrieval demands of the task. The orientation effect is thereby not confounded
with other retrieval processes (Rugg & Wilding, 2000) such as retrieval effort or retrieval
success.
Following an understanding of what retrieval orientation is, as well as how its neural
correlates are indexed, it seems only reasonable to understand why; why are we able to
adopt specific retrieval orientations? The research literature suggests two contrasting
accounts. One posits that the orientation process confers benefits on subsequent memory
retrieval (Dzulkifli, Herron & Wilding, 2006; Herron & Rugg, 2003; Bridger et al. 2009). The
other account posits that the orientation process is a compensatory effect (Dzulkifli, Sharpe
& Wilding, 2004). While the former account is supported by findings showing that the
degree to which orientation is engaged is positively correlated with response accuracy, the
latter account instead posits that the degree to which orientation is engaged is not
positively correlated with response accuracy but with relative task difficulty. Moreover, the
two contrasting accounts, both attempting to explain why we adopt retrieval orientation,
suggest this ability is either related to its facilitating effects on memory retrieval or is the
result of the brain’s compensating for a higher degree of difficulty when retrieving specific
information from stored memory traces.
8
As stated previously, the ERP correlates of orientation effect is differently manifested
depending on retrieval qualities and stimulus material employed. Accordingly, the
establishment of an orientation effect using one form of episodic quality will differ from
other orientations established by means of another episodic quality.
An overview of (eight) studies illustrating the diversity in the ERP correlates of
retrieval orientation will now be presented in order to aid an understanding of this
retrieval process’s different manifestations.
In 2002, Robb & Rugg published a study in which they manipulated the orientation
effect by varying the study material using pictures and words. Test difficulty was
manipulated by varying study list length and study-test delay to create easy and hard
retrieval conditions for each class of material. Regardless of difficulty, ERPs elicited by ‘new’
test words differed markedly according to whether the study items were words or pictures.
This effect was evident from around 300-1800msec post-stimulus and took the form of a
topographically widespread, temporally sustained negativity in the waveforms elicited
during the picture condition relative to the word condition.
Another study conducted by Herron & Rugg (2003), used pictures and words
interwoven within a single study block. In separate test phases, instructions were to
respond positively to test words corresponding to either studied pictures or studied words.
The effect of the instructions was to induce differences in ‘new’ items ERPs resembling
those reported in Robb & Rugg (2002). The ERP effect identified took the form of a greater
negativity for critical ERPs when pictures rather than words were the sought for material.
The effect was apparent from around 300msec post-stimulus lasting until about 1800msec.
The differences were the largest at central midline sites and lasted for 500-600msec.
The study by Hornberger et al. (2004) used a simpler old-new recognition memory test
in two experiments of which the first used study material consisting of pictures and their
corresponding names and the second consisted of auditory words and pictures when the
test items were visual words. The ERP orientation effect had an onset around 300msec post-
stimulus lasting until approximately 800msec and demonstrated a rather diffuse scalp
distribution that remained statistically invariant with time. Collectively, their study (two
experiments) indicated that the critical ERPs were more negative going when pictures
rather than auditory words were the targeted material. By contrast, when memory was
cued by pictorial material the effect was reversed: waveforms were more negative when
9
words were targeted for retrieval. The ERP effects observed for the pictorial material were
similar to those elicited by the verbal material in respect of their time course and overall
magnitude. However the scalp topographies of the two classes of material differed: the
effect elicited by words demonstrated a more anterior and symmetrical distribution
compared to the pictorial material.
In a similar study, Hornberger, Rugg & Henson (2005) varied the encoding procedure
such that participants either encoded pictures or auditory words. A subsequent old-new
recognition retrieval task tested participants on visual words. The ERP orientation effect
evoked by ‘new’ words encoded as pictures were more negative than words encoded orally.
The difference appeared around 450msec post-stimulus onset, with a duration of 1200msec
showing a centrally located maxima. The study was in line with previous studies by Robb &
Rugg, 2002, Herron & Rugg, 2003; Hornberger et al., 2004). There were no reliable
topographic differences thus indicating that the results did not reflect different
distributions of underlying neural generators.
Rather than using an old-new recognition task, Dzulkifli & Wilding (2004) used
recognition memory exclusion tasks with visually presented verbal material at both
encoding and retrieval. The retrieval task was separated by means of a function task and a
drawing task. The ERP orientation effect evoked by ‘new’ words in the function target
designation were more positive than those from the drawing target designation from 500-
900msec post-stimulus onset and the differences were larger over the right hemisphere
from 700-900msec.
Rugg, Allen & Birch (2000) also used an exclusion recognition tasks but by means of an
alphabetic judgement (shallow study) task and a sentence generation (deep) study task.
Their findings revealed an ERP orientation effect, which, in line with previous studies took
a different form depending on task. ERPs elicited by ‘new’ words in the shallow study task
exhibited more positive going waveforms compared to the deep study task. The differences
were apparent from 300 to 1400msec post-stimulus onset and the differences were maximal
over the frontal and central sites.
The study Dzulkifli et al. (2004) investigated orientation using exclusion tasks in
which participants focused on retrieval of either phonological or semantic associates that
were generated in the preceding encoding task. The ERP orientation effect evoked by ‘new’
words were apparent from 300-1400msec post-stimulus and were more prominent at
10
anterior than at posterior locations. They took the form of a relatively greater positivity for
the critical ERPs when the task required responses only to old words subjected to
phonological encoding rather than semantical encoding. The scalp distribution did not
differ between the tasks.
The most recent study on retrieval orientation, conducted by Bridger et al. (2009),
used two verbal memory exclusion tasks with differing retrieval demands. Participants
were instructed to retrieve information concerning the item presented at test, by judging
whether it had previously been encoded in (a) a function task or (b) a drawing task. Their
aim was to investigate the ERP orientation effect by correlating it to response accuracy. The
ERPs for the high accuracy group shows that, at midline posterior sites from around
700msec post-stimulus onset, ERPs associated with ‘new’ items in the function target
designation were relatively more positive going than those associated with the drawing
target designation. In line with previous studies their study showed an extended time
course with little evidence of changes in the distribution of the ERP effect over time.
Notably, the above presentation of prior investigations into retrieval orientation
highlights the various manifestations of the ERP orientation effect by (1) different scalp
distribution, polarity, temporal profile, and (2) how effect relates to difficulty and
performance. While the stimulus material differs between studies, none of these studies
presented above, or in fact any studies on retrieval orientation have, to our knowledge,
used emotion as episodic retrieval material, neither pictorial nor verbal forms (visually or
orally presented).
Emotional Memory
The definition of emotion may vary, however, for the purpose of the current study
emotion is defined as a multimodal phenomena that involves changes in subjective
experiences, physiology (including brain mechanisms) and action tendencies (Gross, 1998).
Emotions occur in response to internal or external stimuli that are meaningful to the
organism’s survival, wellbeing and active goals.
Memory is often enhanced for events or items that are emotionally significant
(Christianson, 1992) and the enhancement has been attributed to interactions between the
amygdala and other neural areas such as the hippocampus and prefrontal cortex (PFC)
(Cahill & McGaugh, 1996).
11
On a biological level, the reason for the enhancement of emotional memories may
simply be evolutionary. An enhanced memory of emotional events can from an adaptive
perspective be explained in that it increases the probability that survival-relevant
information will be available in the future (Hamann, 2001). On a cognitive level, factors such
as increased rehearsal, enhanced attention and increased elaboration are probably some of
the memory advantages observed in enhanced emotional memory. These advantages do
not, however, suffice as a complete explanation. A more ample account can instead be
found on a neuronal level: specific mechanisms for emotional stimuli that are not engaged
by non-emotional stimuli have been shown to exist (McGaugh, 2000) at the neuronal level.
The memory bias for emotional memories has been empirically supported. Relative to
emotionally neutral stimuli, free recall is greater for pictures, words and stories with
emotional negative or positive content (Phelps, LaBar, & Spenser, 1997; Danion, Kauffmann-
Muller, Grange, Zimmermann, & Greth, 1995; Hamann, Ely, Grafton, & Kilts, 1999).
Contextual information is additionally more likely to be retrieved incidentally and to
capture more attention when it is emotionally valenced (Maratos & Rugg, 2001).
The valence of an event (i.e. whether it is pleasurable or aversive) seems to be an
important factor when it comes to the emotional memory performance, with negative
events being remembered in greater details than positive. For instance, in recognition
memory tasks negative events are often remembered better than positive events, as
reflected by higher hit rates, higher judged vividness and greater confidence in memory
accuracy (Kensinger & Schacter, 2006; Oschsner, 2000; Johansson, Mecklinger, & Treese,
2004). Last but not least, when examining what people remember about public events,
negative emotions appear to be superior (Levine & Bluck, 2004). Another remark in relation
to emotional memory relates to confabulation (i.e. the production of fabricated, distorted or
misinterpreted memories about one’s self or the world without the conscious intention to
deceive) for which emotions seems to play a significant role (for reviews see DeLuca, 2000).
Memory Binding
To retrieve information of a prior event, the brain must not only encode the specific
aspects of an event, but it must additionally bind these different aspects of the event
together in a manner that specifies the spatiotemporal context in which they were
encountered. This ability to bind separate aspects to a unified whole depends on a large
12
network of brain regions, especially the MTL and PFC, which, as previously stated, facilitate
the encoding and retrieval of episodic memories (Zimmer, Mecklinger & Lindenberger,
2006).
While the discussion on binding (i.e. how we combine separate stimulus features to
form an unified object representation) is most often centred to perception, it is also highly
relevant for the discussion of memory. By considering memories as sets of separate features
(rather than holistic units) we assume the presence of some kind of binding. Memory
binding hence refers to the processes by which distinct aspects of memory are linked
together to form a coherent episode (Zimmer, Mecklinger & Lindenberger, 2006)
Binding of Items and Contexts model (BIC; Diana, Yonelinas & Ranaganath, 2007)
proposes that MTL sub-regions differ fundamentally in the types of information they
receive and process, e.g. items, contexts and bindings. Accordingly, the peririhinal cortex
(PRc) receives detailed information about specific items that are to be remembered (i.e.
‘what’ information), whereas the parahippocampal cortex (PHc) receives detailed
information about the spatial context in which each item was encountered (i.e. ‘where’
information). The information about what and where –two key attributes of episodic
memories- then converges in the hippocampus. The BIC model suggested that the PRc and
PHc encode item and context information and the hippocampus in turn encodes
representations of item-context associations.
Within memory binding, a main distinction can be made between different types of
binding. For example, one can distinguish within “item-binding” from between “between-
item binding”. Within-item information is information belonging to the object, e.g. object
colour and it is associated with familiarity while the “between-item” is associated with
recollection (between-item). Familiarity refers to the phenomenal experience that a
particular item has been encountered before, without retrieving contextual information,
whereas recollection refers to the conscious retrieval of an item together with contextual
information that specifies the previous episode (Jacoby & Dallas, 1981; Mandler, 1980;
Yonelinas, 2002).
On a neuronal level, familiarity (within-item) is mediated by perirhinal structures,
whereas hippocampal processing is involved in recollection (between-item). These MTL
structures provide the mechanisms required to bind contents represented in modality
specific processing areas (Zimmer, Mecklinger & Lindenberger, 2006).
13
Mood Disorders & Memory
Cognition plays a central role in the degree to which people are affected by negative
experiences. In cognitive studies investigating mood-congruent recall bias in depression it
is suggested that depressed individuals recall more negative than positive words on explicit
memory tasks. In such tasks participants typically perform an encoding task, which entails
studying lists of words. They are then asked to recall these words in subsequent retrieval
tasks.
Cognitive theorists attempting to explain the memory bias towards negative material
in depression suggests that they engage in strategic elaboration of negative information
(Williams, Watts, MacLeod, & Mathews, 1997). In other words, they engage in increased
elaboration of negative material, either during or following the initial encoding phase,
which increases the accessibility and ease of retrieval of negative concepts. This is
empirically supported: depression is positively correlated with a tendency to respond to
negative life events and negative mood states by ruminating about the event or the mood
(Lyubomirsky & Nolen-Hoeksema, 1993; Nolen-Hoeksema, 2000; Nolen- Hoeksema, Morrow,
& Fredickson, 1993). Taken together, elaboration of and ruminating on negative events
increases the accessibility and the likelihood of facilitated retrieval of negative memories,
which ultimately results in a malicious circle of rumination, mood-congruent recall bias
and depressed mood states (Lyubomirsky, Caldwell, & Nolen-Hoeksem, 1998).
Cognitive control, implicating the PFC, commonly refers to top-down support for task
relevant processes (MacDonald et al. 2000), i.e. processes that permit information
processing and behaviour to vary adaptively depending on current goals. A related term is
emotion regulation, which denotes cognitive and behavioural processes influencing the
occurrence, intensity, duration and expression of emotions (Gross, 1998). These processes
may support up-regulation or down-regulation of positive or negative emotions. Deficits in
the cognitive control of emotions may lead to difficulties attending to and processing new
information, thereby hindering the use of more adaptive emotion regulation strategies,
which in turn may have a negative impact on wellbeing (Campbell-Sills & Barlow, 2009).
Depressed individuals appear to have a decreased cognitive control, mainly when
processing emotional stimuli (Dozois & Dobson, 2001; Gotlib, Krasnoperova, Yue &
Joormann, 2004; Koster, De Raedt, Goeleven, Franck & Crombez, 2005). Consequently, the
neural mechanisms supporting cognitive controls may be altered among depressed
14
individuals. While the lateral PFC (LPFC) is allegedly involved in cognitive control,
especially when competing responses have been inhibited or new information is selected
(Aron & Poldrack, 2005), the VLPFC is suggested to alter emotional responses. This
modulation transpires through an attentional biasing mechanism, which acts on sub-
cortical regions such as the amygdala (Wager, Davidson, Huges, Lindquist & Ochsner, 2008).
In support of this account, studies have shown that individuals diagnosed with depression
have reduced neural responses compared to healthy controls, particularly in VLPFC regions
(Dichter, Felder & Smoski, 2009; Wang et al. 2008).
Research Objectives
The present study is an electrophysiological attempt to investigate episodic memory.
On a more general level it concerns the retrieval of episodic source memories (elaborated in
the opening section) and more specifically it refers to retrieval orientation – a retrieval
processes engaged when we attempt to retrieve an episodic memory.
The present study builds on the research presented above, i.e. the research
supporting the existence of retrieval orientation but also the extensive research stressing
the uniqueness of emotional memory and the biasing of emotional memory in relation to
mood-disorders. The novel contribution offered by the present study, to investigate
whether retrieval orientation can be extended to include emotional source memories,
justifies the section on memory binding presented earlier, in that encoding of emotional
source memories requires the binding (within- item and between- item binding) of
different aspects of an event in a manner specifying the spatiotemporal context (e.g. an
emotional context to a natural face).
Episodic memory constitutes our personal life history in which our emotions play a
pivotal role. Emotions, however we chose to define and defy them, enhance and alter (e.g.
by means of confabulation) our memory in both positive and negative ways which
subsequently impact on, among other things, our wellbeing. Emotions not only change the
brain neural mechanisms. They also alter the body’s physiological response. Intuitively this
points to the importance of the current investigation. If entering a cognitive state of
orientation, in which we set out to search for an emotional memory of specific valence,
leaves behind a specific neural correlate associated with emotional memory and wellbeing,
this may be of interest to clinicians attempting to comprehend and find solutions to the
15
vicious circle of depression. In addition to this more clinical application, the establishment
of an emotional retrieval orientation effect is of interest for scientific purposes, by adding
to the neuropsychological literature on emotional memory.
The key question in this study is the nature of the critical ERP correlates elicited by
‘new’ previously unstudied test items (faces) recorded on a block basis from the retrieval
phase of two pictorial emotional source exclusion conditions and one non-emotional
inclusion condition. Two exclusions tasks with varying emotional source requirements in
addition to an inclusion task will be employed (for further reading on inclusion-exclusion
tasks see Jacoby, 1991). While the retrieval phases are varied in order to manipulate the
orientation effect, the encoding phase for each task is kept constant.
Experimental Hypotheses
There are four experimental predictions: (1) Amplitude differences elicited by the
critical ERPs, (i.e. those elicited by ‘new’ faces in each test task) will be reliably
differentiated on the basis of test type (emotional source exclusion recognition tests vs.
inclusion). (2) The amplitude differences elicited by the critical ERPs will furthermore be
reliably differentiated according to valence retrieval demands, demonstrating the existence
of valence specific emotional orientations. (3) There will be a valence congruent
relationship between emotional retrieval orientation and emotional memory as indicated
by a positive correlation between the positive orientation effect and the retrieval of
positive memories. (4) The ERP correlates of emotional orientation will, in addition to the
latter hypothesis, show a valence congruent relationship to wellbeing.
Evidence for the degree to which orientation was engaged is shown by, i.e.
operationalized by the magnitude of the voltage differences between the ERPs elicited by
‘new’ faces in exclusion positive and exclusion negative compared with the inclusion
condition. The magnitude of these voltage differences is assumed to be the neural
correlates of differences in cue processing engaged by the different retrieval instructions.
Evidence for the degree to which memory performance was engaged is
operationalized by means of ability to detect both positive and negative targets (c.f. Bridger
et al. 2009), as well as the relative ability to retrieve positive rather than negative targets.
More precisely, this latter relative memory measurement reflects a facilitated ability to
retrieve positive rather than negative memories.
16
The experimental predictions presented here will be attained by first selecting scalp
sites at which the ERP amplitude difference is most representative. Memory performance
and degrees of wellbeing will thereafter be plotted against the critical ERP indexes of the
degree to which the orientation effect is engaged.
The current study chooses to use pictorial stimuli rather than visually or orally
presented verbal stimuli. The motivation being that pictorial stimuli, concepts, are much
more likely to be remembered if they are presented as pictures rather than words, as
postulated by The Picture Superiority Effect (Madigan, 1983). Additionally, pictorial stimuli are
likely to be more effective at engaging emotional processing than verbal stimuli due to
their highly concrete nature and cognitive immediacy (Smith, Dolan & Rugg, 2004). The use
of pictures to provide emotionally valenced contexts may therefore lend greater power to
the identification of emotion effects on the retrieval than what is afforded by verbal stimuli.
The current study furthermore used faces rather than objects as items. The
motivation being that (a) faces are not associated with the same potential confound of
semantic relatedness such as words (Maratos et al., 2001) and (b) the processing of facial
expression is critical for our daily-life interactions and therefore the face categories used
can expected to be equally relevant for all participants.
METHOD
Participants
Thirtysix healthy right-handed individuals (24 females), mean age 28.5 years (ranging
20-56) participated in the study. Six participants (3 females) were excluded from the
analyses: two resulting from computer problems, three from insufficient behavioural
performance and one participant was excluded due to defective electrodes. While
participants responded to flyers posted around Lund’s university campus, no requirement
of enrolment at the university was made.
Participants were given a movie voucher (110 SEK (11€) as compensation for their
participation. Each person provided written informed consent upon arriving at the
laboratory and they were informed that the study investigated brain activation during
retrieval of emotional memories.
17
Material
360 neutral female faces selected from four different standardised databases were
used. Two of these were online databases: (1) OSLO (unknown reference), (2) FACES
(unknown reference). (3) AR face database (Martinez & Benavente, 1998) and (4) NIM-STIM
(Tottenham, N., Tanaka, J., Leon, A.C., McCarry, T., Nurse, M., Hare, T.A., Marcus, D.J.,
Westerlund, A., Casey, B.J., Nelson, C.A. (2009). The facial images were frontal views with
hair, neck and ears visible. The background colour (black), position of the face and size of
the image was modified in Photoshop to be standardized for all faces. The faces were
balanced in terms of data base origin, age (20-25, 25-30, 30-35, 35-40) ethnicity (Caucasian
white, Mediterranean, African American or Asian) and thereafter sorted into six sets, each
set, containing 60 faces (balanced according to data base, age and ethnicity). 360 of the most
common female names were selected from the Swedish statistical central bureau and
appeared in white on a black background, using font Arial. Each name was randomly paired
with a face.
A selection of 180 emotional contexts (Lang, Bradley & Cuthbert, 2008), selected from
and based on the IAPS data base ratings, were used to induce emotion upon the neutral
face. 90 images depicted positive emotions and 90 depicted negative. Only one sexual
(negatively valenced) depiction was included in the image set. Cutoff scores excluding the
most negative depictions (1.0 to 2.0) were used to reduce the likelihood of participants
looking away due to the extreme nature of the images. Cutoff scores were also used for the
positive emotions but rather to exclude the least positive (ranging between 5-7) to make the
two groups more comparable in terms of valence and arousal. Thus, whereas the former
negative values ranged from valence ratings of 2 to 5 the later positive ranged from 7 to 9.
Negative and positive contexts were categorized into five categories according to
depiction. For negative images the categories used were (1) weapons, (2) unpleasant
animals, (3) unpleasant scenes, (4) unpleasant nature, (5) unpleasant images of people. For
positive images the categories used were (1) sports and entertainment, (2) pleasant animals,
(3) pleasant children, (4) pleasant nature and sweets and (5) pleasant images of family
scenes. The images were additionally sorted into three set types, each containing 30
contexts of which six images were taken from each of the above stated categories (50%
negative).
18
Following the electrode application, the participant was seated in front of the
computer screen and undertook nine study-test blocks. While the study procedure
remained constant the test requirements varied according to test type. One third of the
tests were comprised of a recognition inclusion test task, one-third an exclusion negative
test task and the remaining third an exclusion positive test task. The order of which these
test types appeared was randomised. Each study phase comprised 40 faces and 40 female
names randomly paired with 40 emotional contexts (of which 50% were negative and 50%
positive). Each test phase consisted single-handedly of faces of which 50% were old
previously studied faces and 50% new faces. All stimuli were presented using E‐prime
version 2.0.1.06 (Psychology software).
The distance between participants and computer screen were approximately 70 cm.
The pictorial stimuli were presented on black background on a computer monitor (11x13
inches). Each study trial was initiated with a fixation cross (500msec) followed by a black
screen serving as a baseline (500msec). A face appeared in the centre of the screen with a
female name beneath it, for duration of 1000msec. Following the disappearance of the face,
an emotional context appeared in the centre of the screen for 1000msec. Next the same face
and the same name then re-appeared together with the emotional context. While the name
appeared below the face to the right, the emotional context appeared to the right of face for
a duration of 4000msec. Each test trial was initiated with a fixation cross (500msec) followed
by a face appearing on a black background in the centre of the screen for a duration of
500msec. A 3000msec test response window followed, during which instructions were to
respond by pressing selected keys on the keyboard. Response keys (nr. 1 and 3 on the
computer keyboard) were alternated with each participant. All participants were instructed
to remain as still and relaxed as possible during the testing procedure. Short breaks were
available between blocks.
Study Task Procedure
Instructions were given both orally and in written form, appearing both in paper form
and on the computer screen before the initiation of each study procedure. The study
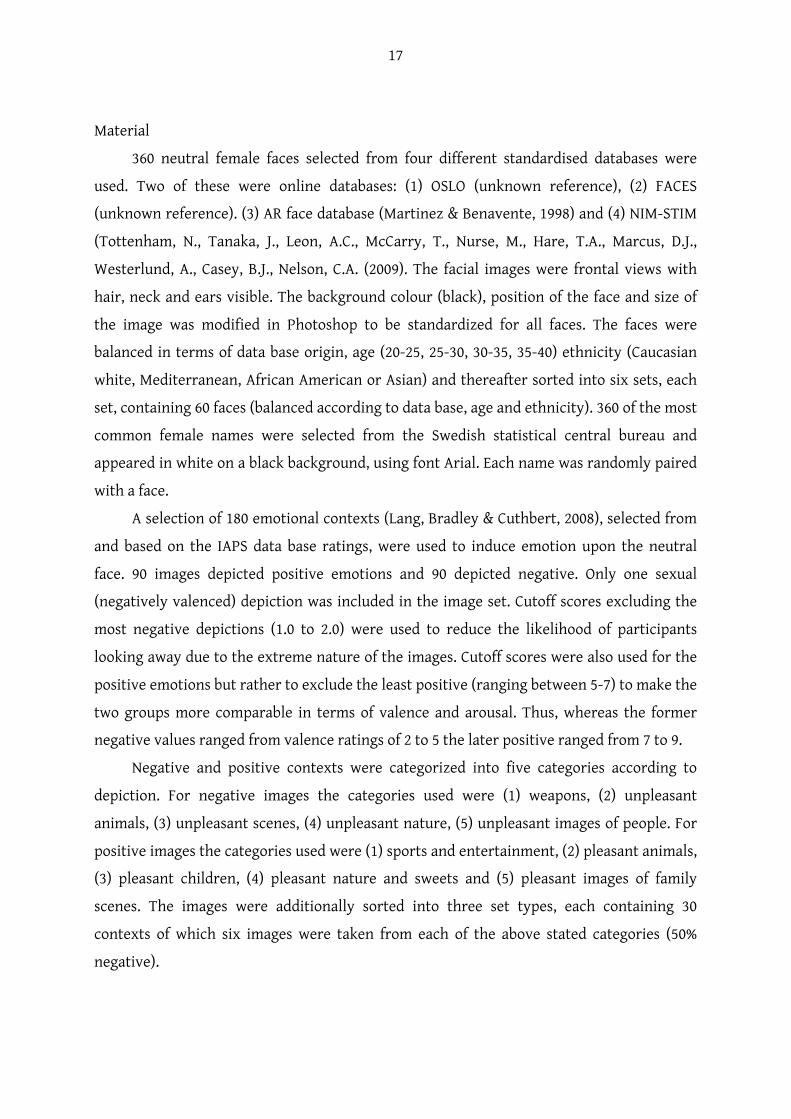
(encoding) procedure was administered in three parts (Fig.1). First, a face and a name
appeared centred on the screen. Participants were instructed to combine the face with the
name by sub-vocally stating the name of the person (e.g. “this is Gabriella”). Second, an
19
emotional image, hereafter referred to as an emotional context, appeared centred on the
screen. At this point, participants were to note the emotional valence of what the picture
depicted, again by sub-vocally stating what was depicted (e.g. a dangerous shark). Thirdly,
the face, the name and the emotional context re-appeared conjointly on the screen. The
instructions were to combine the face and the name with the emotional context, by sub-
vocally generating a brief story in which they paired that specific face with that specific
context (e.g. Gabriella is afraid of dangerous sharks). This biding of a face to an emotional
context was used to induce emotion upon the originally neutral face.
Figure 1. An illustration of the study procedure: For each run each participant must bind a neutral face to an emotional context, by which he/she induce emotion upon a neutral face. Each run is composed of 40 faces and 40 emotional contexts, of which half are negative.
Test Task Procedure
Test instructions were given both orally and in written form, appearing both on paper
before initiating the experiment as well as on the computer screen before initiating each
test procedure. Participants were informed that there would be 50% new faces mixed up
with the previously shown faces and that their task was to judge each face separately. They
were also informed that, unlike the study procedure, the retrieval requirements would vary
with each test block but that informative instructions would be given on the screen
indicating which requirements to fulfil for the upcoming test.
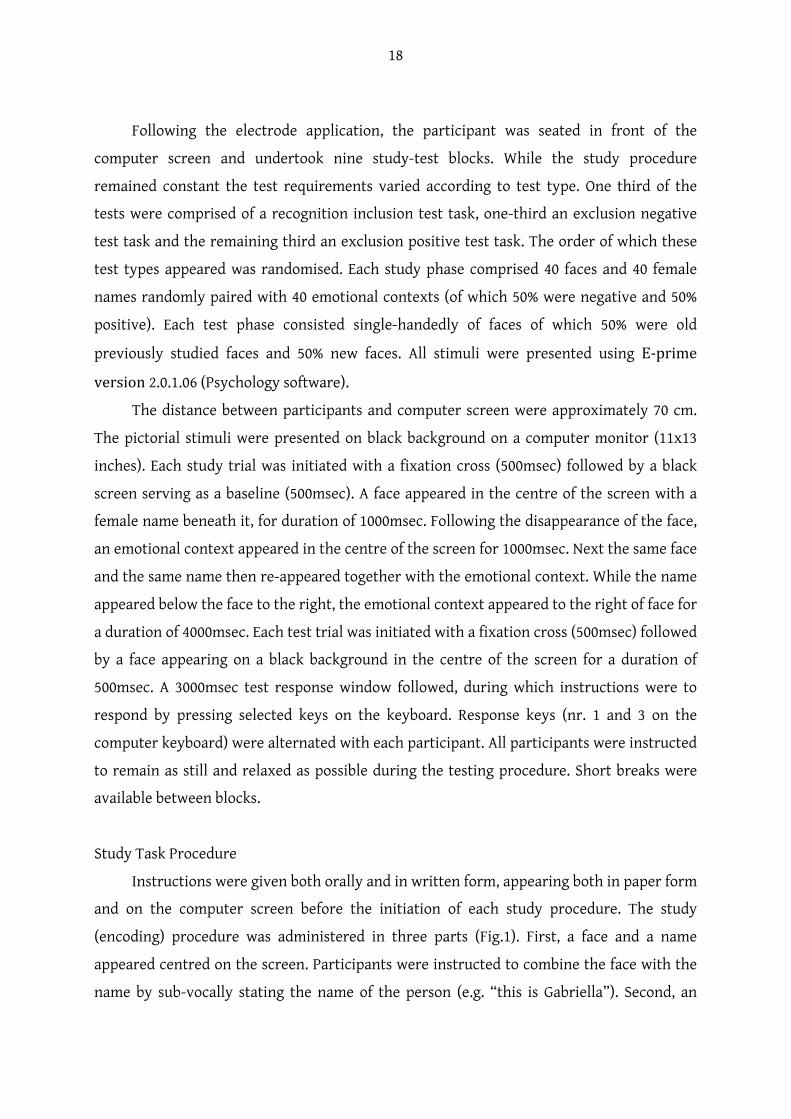
For the inclusion test, subjects were required simply to respond “ old” or “new” to the
face appearing on the screen using the marked keys on the keyboard. For the exclusion
20
negative test (Fig.2), subjects were required to respond “old” only to faces that previously
had been shown, and importantly only to those faces to which a negative emotional context
had been paired. For all remaining faces the participant must respond “new”. For the
exclusion positive test, subjects were required to respond “old” only to faces that had
previously been shown and paired with a positive valence context. The remaining faces
were to be judged as “new”. Thus, for the two exclusion tests, in order to fulfil the
requirements of being classified as “old” the face must (a) have been seen in the foregoing
study trial and (b) be congruent with the valence demand of the test type.
Figure 2 An illustration of the recognition testing procedure. Each run is composed of 40 faces of which 50% are new never before seen faces. Retrieval demands vary by means of recognition test: inclusion, exclusion positive or exclusion negative.
Positive and Negative Context Images
Independent sample t-testing was conducted on the 180 images to compare the mean
scores of valence and arousal ratings for negative and positive images. T-tests revealed a
significant difference in the mean scores between negative (M = 3.20, SD = .50) and positive
(M = 7.50, SD = .37) image valence ratings: t(178) =- 65,81, p = .00). There was no significant
difference in mean scores between negative (M = 5.06, SD = .78) and positive (M = 5.21, SD =
.86) image arousal ratings: t(178) = -1.27, p = .21).
Analyses of variance were conducted to compare the mean scores, in terms of valence
and arousal, for the three sets of negative and positive images. For the negative images, the
analysis revealed that there was no significant difference in mean scores between the three
sets, neither for valence (F = .14, p = .87) nor for arousal (F = . 57, p = .57). As for the positive
images, the analysis showed no significant difference between the three sets of positive
images in terms of valence (F = .41, p = .67) or arousal (F = .33, p = .72).
21
Memory Performance Measures
The experimental design was set up to collect three different types of memory
measures based on behavioural responses for each participant.
The Target Positive measure [Target Hits exclusion positive – FA exclusion positive]
was used to demonstrate the ability to detect positive targets, that is, successfully
classifying ‘old’ positive faces as ‘old’ and deriving the face from a positive context (cf.
Bridger et al. 2009). The Target Negative measure [Target Hits exclusion negative – FA
exclusion negative] was used to demonstrate the ability to detect negative targets, that is,
successfully classifying ‘old’ negative faces as ‘old’ and deriving the face from a negative
context (cf. Bridger et al. 2009). The measure of Relative Memory performance [Target
Negative - Target positive] was used to illustrate an increased ability to retrieve positively
valenced memories rather than negative.
High scores generally were taken as evidence for better memory performance on that
particular valence. For the differential memory measure, a positive score indicated a biased
ability to retrieve positive rather than negative memories whereas a negative score indicted
a biased ability to retrieve negative rather than positive memories.
Wellbeing: Self-Assessment Scores
After finishing the memory test and EEG recordings, participants engaged in four self-
measurement questionnaires using pen and paper. The self-assessment questionnaires
employed were: Beck Depression Inventory (BDI-II; Beck, Steer & Brown, 1996), Montgomery
Åsberg Rating Scale (MADRS; Svanborg & Åseberg, 1994), Positive and Negative Affect Scale
(PANAS; Watson, Clark, & Tellegen, 1988) and The State- Trait Anxiety Inventory (STAI;
Spielberger, Gorsuch,& Lushene, 1970).
(1) BDI-II is a 21-item scale assessing the symptoms and summing the responses
scores experience of depression. (2) MADRS consists of 9 items, which measures nine
different symptoms of depression, rated on a seven-point scale. As with the former, severity
of depression is assessed by summing up the scores. Both self-assessment questionnaires
are widely used instruments for evaluating the severity of depressive symptoms in
psychiatric patients. Both closely adhere with the diagnostic criteria for major depressive
episode in the 4th edition of the Diagnostic and Statistical Manual of Mental Disorders (DSM-
IV; American Psychiatric Association, 1994). (3) PANAS is a self- assessment scale developed
22
to measure the largely independent structures of positive and negative affect and it has
been shown to be effective at differentiating between depression and anxiety in clinical
samples (Clark & Watson, 1991). It is a 20-item questionnaire consisting of affect adjectives,
10 of which are positive affect terms (e.g. active, enthusiastic) and the remaining 10 are
negative affect terms (e.g. nervous, guilty). Each adjective is rated on a 5-point scale
ranging from “very slightly or not at all” to “extremely” and subjects are asked to rate the
extent to which they feel this way. The version employed in the present study asked to rate
the extent to which they felt this way in general. (4) STAI-II is a 20-item self-report scale for
measuring trait anxiety. People are asked to describe how they feel in general and results
reflect relatively stable individual differences in anxiety pre-dispositions that are
impervious to situational stress. The items are rated on a scale of 1-4. Total scores ranges
from 20-80. The version employed in the present study asked to rate the extent to which
they felt this way in general, thus STAI-II.
The current study used a relatively small sample size of a non-clinical population to
establish degrees of wellbeing using clinical self-assessment questionnaires measuring
severity of depression and anxiety. Traditional cutoffscores, used when assessing severity of
depression by clinicians were furthermore ignored. Instead, the current study interpreted
low scores as indicative of a higher degree of wellbeing and vice versa. An exception was
PANAS positive Affect Scale for which higher scores were taken as indicative of higher degrees
wellbeing.
EEG Recording and Analysis
EEG was recorded using a 64 channel Quick Cap based on the 10-20 system, a SynAmps
2 amplifier, and the NeuroScan Acquire software. Impedance was kept below 5 KΩ. VEOG,
above and below the left eye, and HEOG, outside the outer canthi measured the
electrooculogram (EOG). The electrodes were referenced to a central reference electrode
online, and were re-referenced to averaged mastoids offline. The ground reference was a
frontal cap-mounted electrode. The sampling rate was 250 Hz, and an online band-pass
filter with cut-off frequencies of 0.1 to 70 Hz was used. A notch filter was used set at 50 Hz.
Bad channel signals (no more then five per participant) were replaced offline using
spherical spline interpolation with the surrounding electrodes.
23
Statistical analyses
The behavioural and electrophysiological data were analysed with independent t-test,
paired sample t-tests, univariate ANOVA and Spearmann’s correlations and repeated
measure ANOVA. The Greenhouse-Geisser adjustment was used when data violated the
assumption of sphericity (Greenhouse & Geisser, 1959). Main effects were followed up with
subsidiary pairwise comparison using a Bonferroni correction. Effect sizes were viewed in
light of Cohen’s interpretation (1998).
RESULTS
A preliminary consultation of the topographic maps (Fig.3), suggested an emotional
orientation effect with a time course of 200-to 1100msec post-stimulus onset. The ERPs of
emotional orientation (exclusion conditions vs. inclusion) gave rise to more negative going
ERPs from around 200-700msec. From around 900 -1100msec the ERP of both positive and
negative orientation were perceived as more positive than inclusion.
Tendencies towards valence specific orientation effect as evinced by the slightly more
negative going ERPs in the negative orientation condition (i.e. exclusion negative vs.
inclusion) compared to the positive (i.e. exclusion positive vs. inclusion) were mainly found
in the first time window (Fig.3). As to the distribution of the effect, the topographic maps
indicated an initial frontal distribution from 200-400msec, followed by a central- parietal
distribution from 500-700msec, after which a frontal distribution re-appeared at
approximately 900-1100msec.
These presumptions, based on visual consultations were subsequently tested
statistically and the outcome of the statistical analyses of the ERP memory orientation
effects in the three time windows were described below starting with the earliest course of
events and ending with correlation analyses. Behavioural data will be presented first after
which the electrophysiological data will follow.
Behavioural Data
Correct Rejections of New Items
Table 1 displays the probabilities of correct responses to each class of test faces in the
three memory tasks. Correct rejections (CR) were calculated separately for inclusion,
exclusion positive and exclusion negative. Paired sample t-tests were conducted on CR
24
between two exclusion tasks confirming a non-significant result, t(29) = -.74, p = .47. In
addition, comparing CR between inclusion and the two exclusion tasks revealed a non-
significant result for both exclusion positive t(29) = 1.44, p = .16, and exclusion negative,
t(29) = 1.1, p = .29.
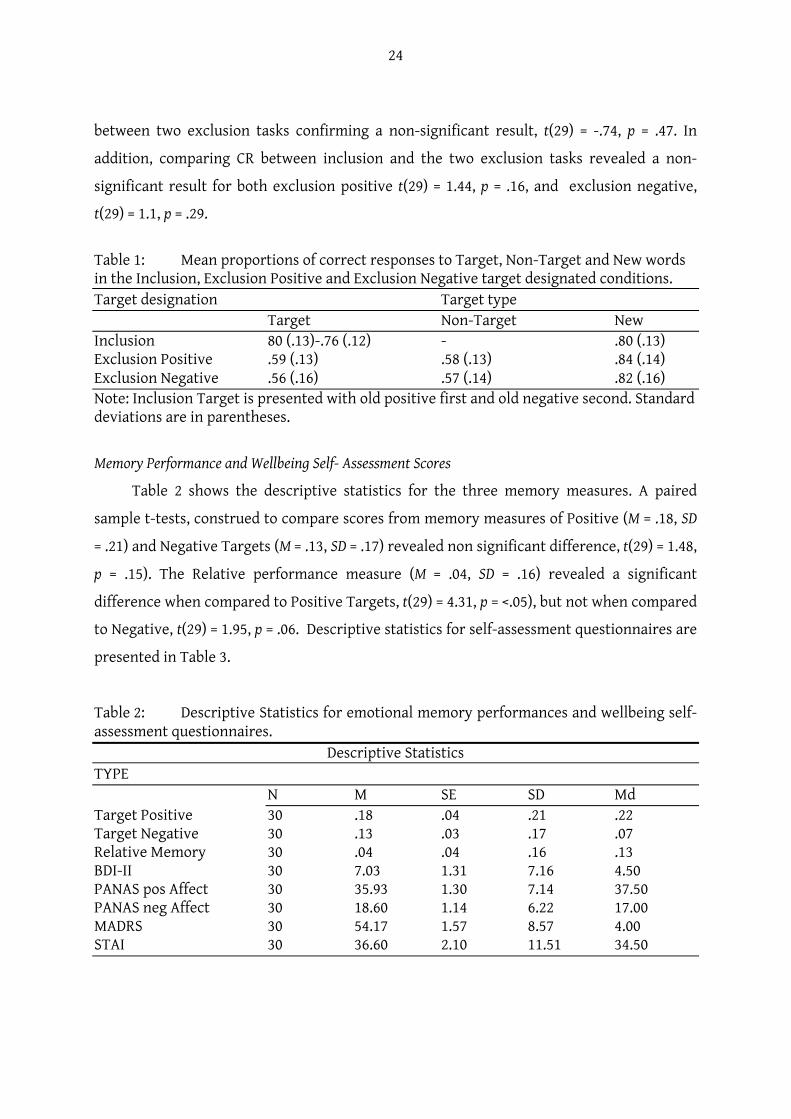
Table 1: Mean proportions of correct responses to Target, Non-Target and New words in the Inclusion, Exclusion Positive and Exclusion Negative target designated conditions. Target designation Target type Target Non-Target New Inclusion 80 (.13)-.76 (.12) - .80 (.13) Exclusion Positive .59 (.13) .58 (.13) .84 (.14) Exclusion Negative .56 (.16) .57 (.14) .82 (.16) Note: Inclusion Target is presented with old positive first and old negative second. Standard deviations are in parentheses.
Memory Performance and Wellbeing Self- Assessment Scores
Table 2 shows the descriptive statistics for the three memory measures. A paired
sample t-tests, construed to compare scores from memory measures of Positive (M = .18, SD
= .21) and Negative Targets (M = .13, SD = .17) revealed non significant difference, t(29) = 1.48,
p = .15). The Relative performance measure (M = .04, SD = .16) revealed a significant
difference when compared to Positive Targets, t(29) = 4.31, p = <.05), but not when compared
to Negative, t(29) = 1.95, p = .06. Descriptive statistics for self-assessment questionnaires are
presented in Table 3.
Table 2: Descriptive Statistics for emotional memory performances and wellbeing self-assessment questionnaires.
Descriptive Statistics TYPE
N M SE SD Md Target Positive 30 .18 .04 .21 .22 Target Negative 30 .13 .03 .17 .07 Relative Memory 30 .04 .04 .16 .13 BDI-II 30 7.03 1.31 7.16 4.50 PANAS pos Affect 30 35.93 1.30 7.14 37.50 PANAS neg Affect 30 18.60 1.14 6.22 17.00 MADRS 30 54.17 1.57 8.57 4.00 STAI 30 36.60 2.10 11.51 34.50
25
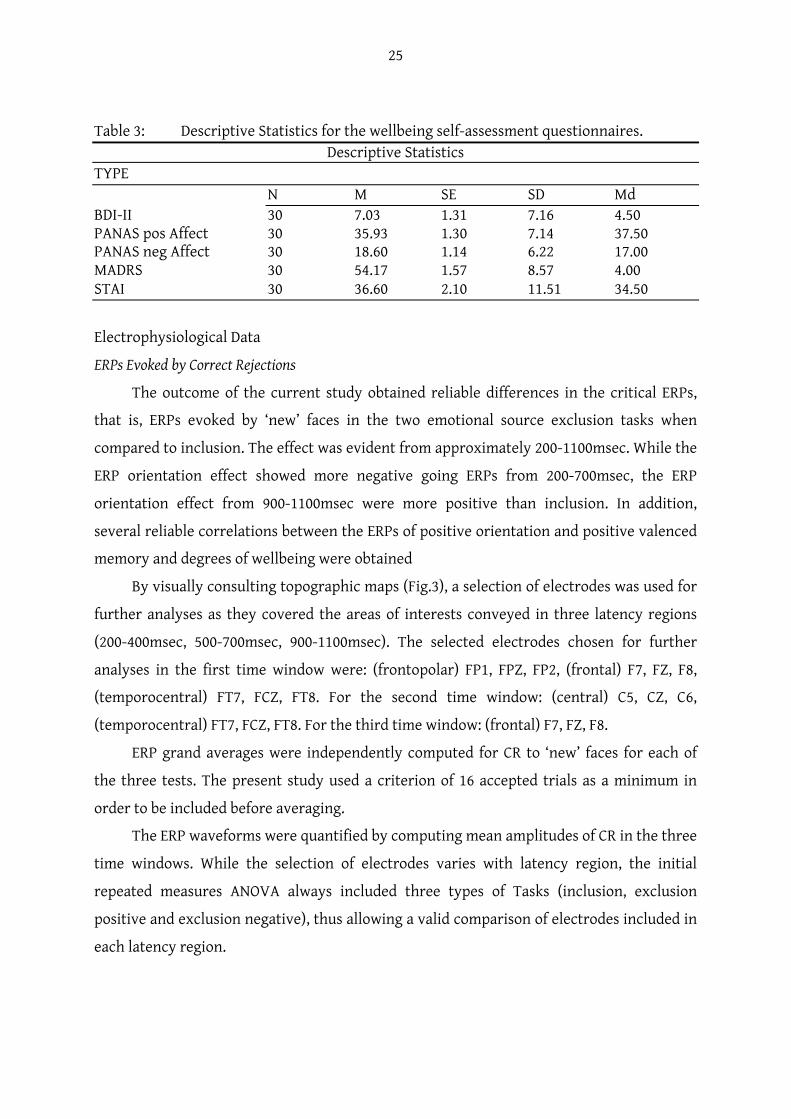
Table 3: Descriptive Statistics for the wellbeing self-assessment questionnaires. Descriptive Statistics
TYPE N M SE SD Md
BDI-II 30 7.03 1.31 7.16 4.50 PANAS pos Affect 30 35.93 1.30 7.14 37.50 PANAS neg Affect 30 18.60 1.14 6.22 17.00 MADRS 30 54.17 1.57 8.57 4.00 STAI 30 36.60 2.10 11.51 34.50
Electrophysiological Data
ERPs Evoked by Correct Rejections
The outcome of the current study obtained reliable differences in the critical ERPs,
that is, ERPs evoked by ‘new’ faces in the two emotional source exclusion tasks when
compared to inclusion. The effect was evident from approximately 200-1100msec. While the
ERP orientation effect showed more negative going ERPs from 200-700msec, the ERP
orientation effect from 900-1100msec were more positive than inclusion. In addition,
several reliable correlations between the ERPs of positive orientation and positive valenced
memory and degrees of wellbeing were obtained
By visually consulting topographic maps (Fig.3), a selection of electrodes was used for
further analyses as they covered the areas of interests conveyed in three latency regions
(200-400msec, 500-700msec, 900-1100msec). The selected electrodes chosen for further
analyses in the first time window were: (frontopolar) FP1, FPZ, FP2, (frontal) F7, FZ, F8,
(temporocentral) FT7, FCZ, FT8. For the second time window: (central) C5, CZ, C6,
(temporocentral) FT7, FCZ, FT8. For the third time window: (frontal) F7, FZ, F8.
ERP grand averages were independently computed for CR to ‘new’ faces for each of
the three tests. The present study used a criterion of 16 accepted trials as a minimum in
order to be included before averaging.
The ERP waveforms were quantified by computing mean amplitudes of CR in the three
time windows. While the selection of electrodes varies with latency region, the initial
repeated measures ANOVA always included three types of Tasks (inclusion, exclusion
positive and exclusion negative), thus allowing a valid comparison of electrodes included in
each latency region.
26
Further statistical actions were taken to investigate which of these selected electrodes
best represented the (orientation) effect, whether orientation had been established for both
positively and negatively valenced memories and whether a difference between them were
to be found. This was attained subtracting the exclusion value from the baseline condition
(i.e. inclusion) for both exclusion positive and exclusion negative on the above stated
electrodes and separately for each time window. The electrodes presenting the strongest
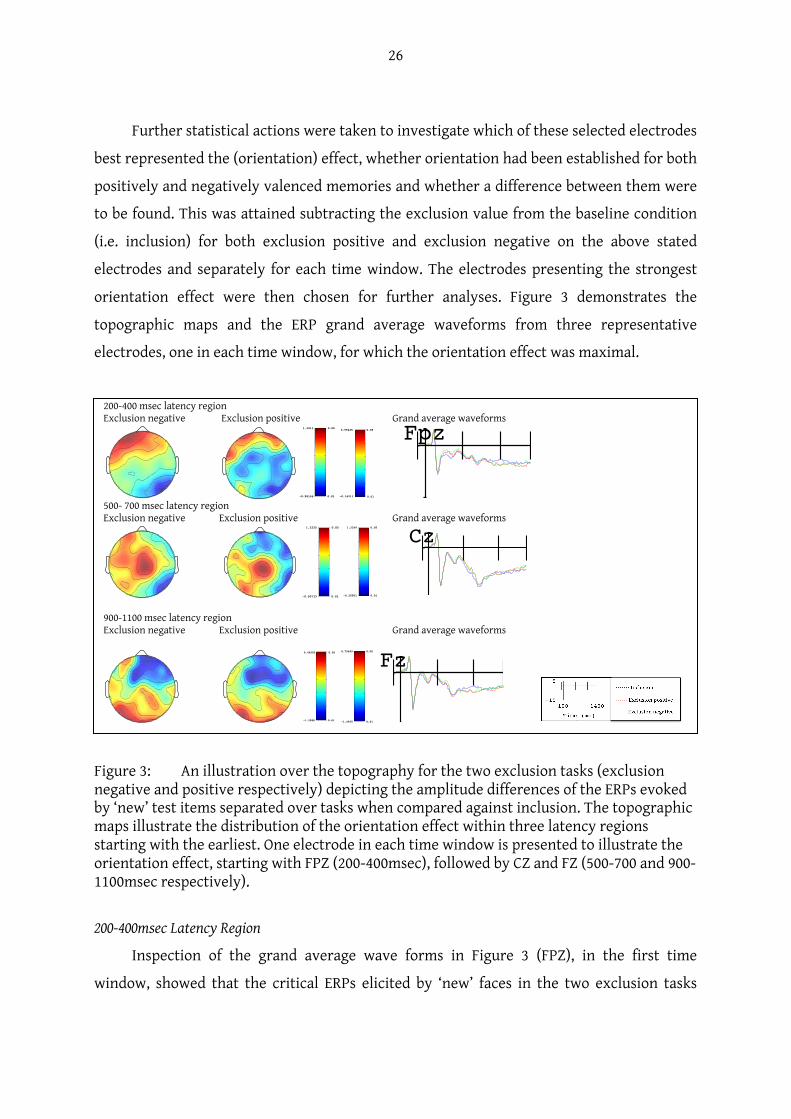
orientation effect were then chosen for further analyses. Figure 3 demonstrates the
topographic maps and the ERP grand average waveforms from three representative
electrodes, one in each time window, for which the orientation effect was maximal.
Figure 3: An illustration over the topography for the two exclusion tasks (exclusion negative and positive respectively) depicting the amplitude differences of the ERPs evoked by ‘new’ test items separated over tasks when compared against inclusion. The topographic maps illustrate the distribution of the orientation effect within three latency regions starting with the earliest. One electrode in each time window is presented to illustrate the orientation effect, starting with FPZ (200-400msec), followed by CZ and FZ (500-700 and 900-1100msec respectively).
200-400msec Latency Region
Inspection of the grand average wave forms in Figure 3 (FPZ), in the first time
window, showed that the critical ERPs elicited by ‘new’ faces in the two exclusion tasks
FIGURE INDEX 200-400 msec latency region Exclusion negative Exclusion positive Grand average waveforms
500- 700 msec latency region Exclusion negative Exclusion positive Grand average waveforms
900-1100 msec latency region Exclusion negative Exclusion positive Grand average waveforms
Figure 1: Topographic maps (exclusion negative and exclusion positive respectively) depicting the time course of test effects for ERPs evoked by ‘new’ test items separated over exclusion tasks and compared against inclusion. The figure illustrates the topography of the orientation effect within three latency regions starting with the earliest. Grand average depict the critical ERPs separated over the three tasks. One electrode in each time window is presented ot illustrate the orientation effect, starting with FPZ (200-400 msec), followed by CZ and FZ (500-700 and 900-1100 msec respectively).
!"#$!!
!%"&'!((
%"%&
%"%!
!"#$%%$
!!"&'%&&
!"!$
!"!&
!"#
!"#$$%
!&"%&'##
&"&%
&"&!
!"##$%
!&"'((&!
&"&(
&"&!
!"#
!"##$!%
!&"'())
!"!$
!"!&
!"#$%&&
!'"(&)$
!"!$
!"!'
!"#
27
appeared to differ from inclusion by eliciting more negative going ERPs at approximately
200 msec post-stimulus onset, lasting until approximately 400msec. The topographic maps
(Fig.3) in the first time window furthermore showed a frontal distribution for both
exclusion tasks. Subsequently, the electrodes chosen for further analysis were:
(frontopolar) FP1, FPZ, FP2, (frontal) F7, FZ, F8, (temporocentral) FT7, FCZ, FT8.
The effects were analysed using data from a 3x3x3 (Task, Anterior Posterior
dimension and Hemisphere) repeated measure ANOVA, which revealed a main effect on
TASK F(2,58) = 5.86, p = .01, partial eta squared= .17, confirming that the ERP amplitude
elicited by the critical ERPs could be differentiated by means of test.
As evident in Table 4, pairwise comparisons showed a large effect sizes for both
exclusion tasks. However, while comparing the two exclusion tasks with each other
revealed numerical differences, neither reliable significance nor substantial effect sizes
were found.
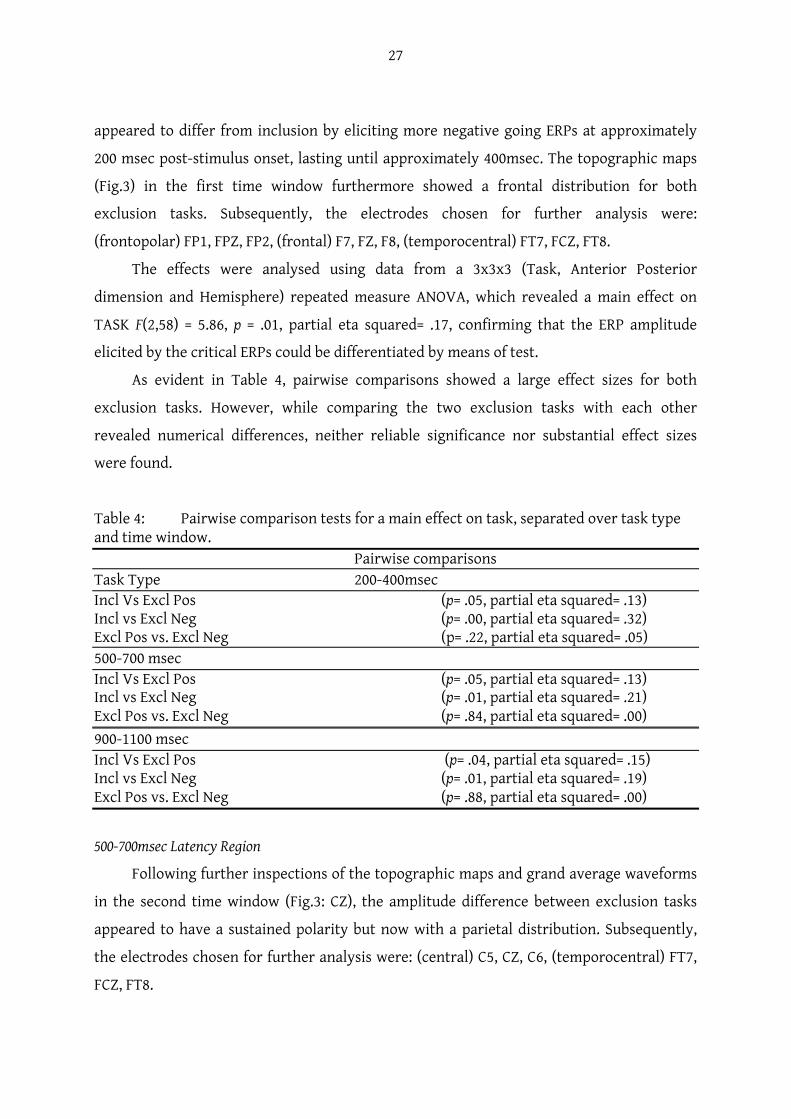
Table 4: Pairwise comparison tests for a main effect on task, separated over task type and time window.
Pairwise comparisons Task Type 200-400msec Incl Vs Excl Pos (p= .05, partial eta squared= .13) Incl vs Excl Neg (p= .00, partial eta squared= .32) Excl Pos vs. Excl Neg (p= .22, partial eta squared= .05) 500-700 msec Incl Vs Excl Pos (p= .05, partial eta squared= .13) Incl vs Excl Neg (p= .01, partial eta squared= .21) Excl Pos vs. Excl Neg (p= .84, partial eta squared= .00) 900-1100 msec Incl Vs Excl Pos (p= .04, partial eta squared= .15) Incl vs Excl Neg (p= .01, partial eta squared= .19) Excl Pos vs. Excl Neg (p= .88, partial eta squared= .00)
500-700msec Latency Region
Following further inspections of the topographic maps and grand average waveforms
in the second time window (Fig.3: CZ), the amplitude difference between exclusion tasks
appeared to have a sustained polarity but now with a parietal distribution. Subsequently,
the electrodes chosen for further analysis were: (central) C5, CZ, C6, (temporocentral) FT7,
FCZ, FT8.
28
A 3x2x3 repeated measure ANOVA revealed an interaction between Task and Anterior
Posterior dimension, F(2,58) = 3.20, p = .05, partial eta squared = .10, as well as an interaction
between Task and Hemisphere, F (4,16) = 3.13, p = .02, partial eta squared = .10.
Follow up analyses of these two-way interaction effects revealed the following effects:
(1) For inclusion vs. exclusion positive an effect was found for Task and Hemisphere, F (2,58)
= 4.91, p = .01, partial eta squared = .15; (2) For inclusion vs. exclusion negative, the effect
was evident for Task and Anterior Posterior dimension, F(1,29) = 7.22, p = .01, partial eta
squared = .20, as well for Task on Hemisphere, F(2,58) = 3.89, p= .03, partial eta squared =
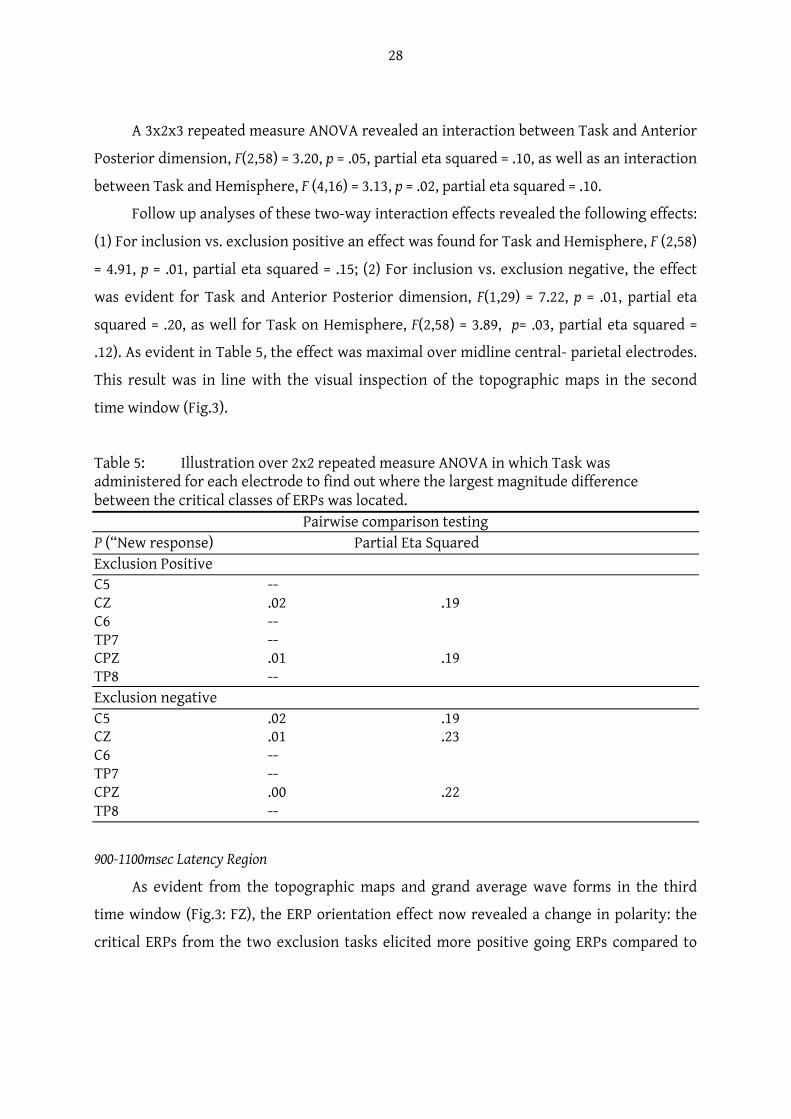
.12). As evident in Table 5, the effect was maximal over midline central- parietal electrodes.
This result was in line with the visual inspection of the topographic maps in the second
time window (Fig.3).
Table 5: Illustration over 2x2 repeated measure ANOVA in which Task was administered for each electrode to find out where the largest magnitude difference between the critical classes of ERPs was located.
Pairwise comparison testing P (“New response) Partial Eta Squared Exclusion Positive C5 -- CZ .02 .19 C6 -- TP7 -- CPZ .01 .19 TP8 -- Exclusion negative C5 .02 .19 CZ .01 .23 C6 -- TP7 -- CPZ .00 .22 TP8 --
900-1100msec Latency Region
As evident from the topographic maps and grand average wave forms in the third
time window (Fig.3: FZ), the ERP orientation effect now revealed a change in polarity: the
critical ERPs from the two exclusion tasks elicited more positive going ERPs compared to
29
inclusion. In addition, the orientation effect now re-appeared as a frontal distribution. The
electrodes chosen for further analysis were: (frontal) F7, FZ, F8.
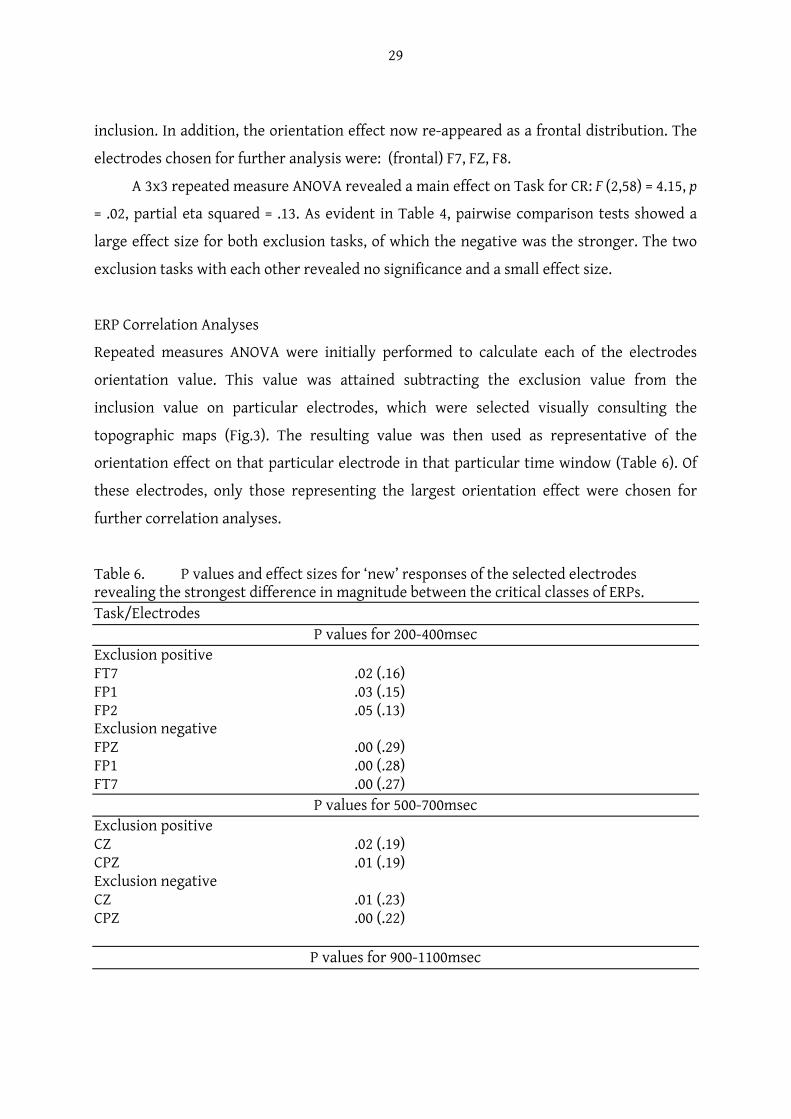
A 3x3 repeated measure ANOVA revealed a main effect on Task for CR: F (2,58) = 4.15, p
= .02, partial eta squared = .13. As evident in Table 4, pairwise comparison tests showed a
large effect size for both exclusion tasks, of which the negative was the stronger. The two
exclusion tasks with each other revealed no significance and a small effect size.
ERP Correlation Analyses
Repeated measures ANOVA were initially performed to calculate each of the electrodes
orientation value. This value was attained subtracting the exclusion value from the
inclusion value on particular electrodes, which were selected visually consulting the
topographic maps (Fig.3). The resulting value was then used as representative of the
orientation effect on that particular electrode in that particular time window (Table 6). Of
these electrodes, only those representing the largest orientation effect were chosen for
further correlation analyses.
Table 6. P values and effect sizes for ‘new’ responses of the selected electrodes revealing the strongest difference in magnitude between the critical classes of ERPs. Task/Electrodes
P values for 200-400msec Exclusion positive FT7 .02 (.16) FP1 .03 (.15) FP2 .05 (.13) Exclusion negative FPZ .00 (.29) FP1 .00 (.28) FT7 .00 (.27)
P values for 500-700msec Exclusion positive CZ .02 (.19) CPZ .01 (.19) Exclusion negative CZ .01 (.23) CPZ .00 (.22)
P values for 900-1100msec
30
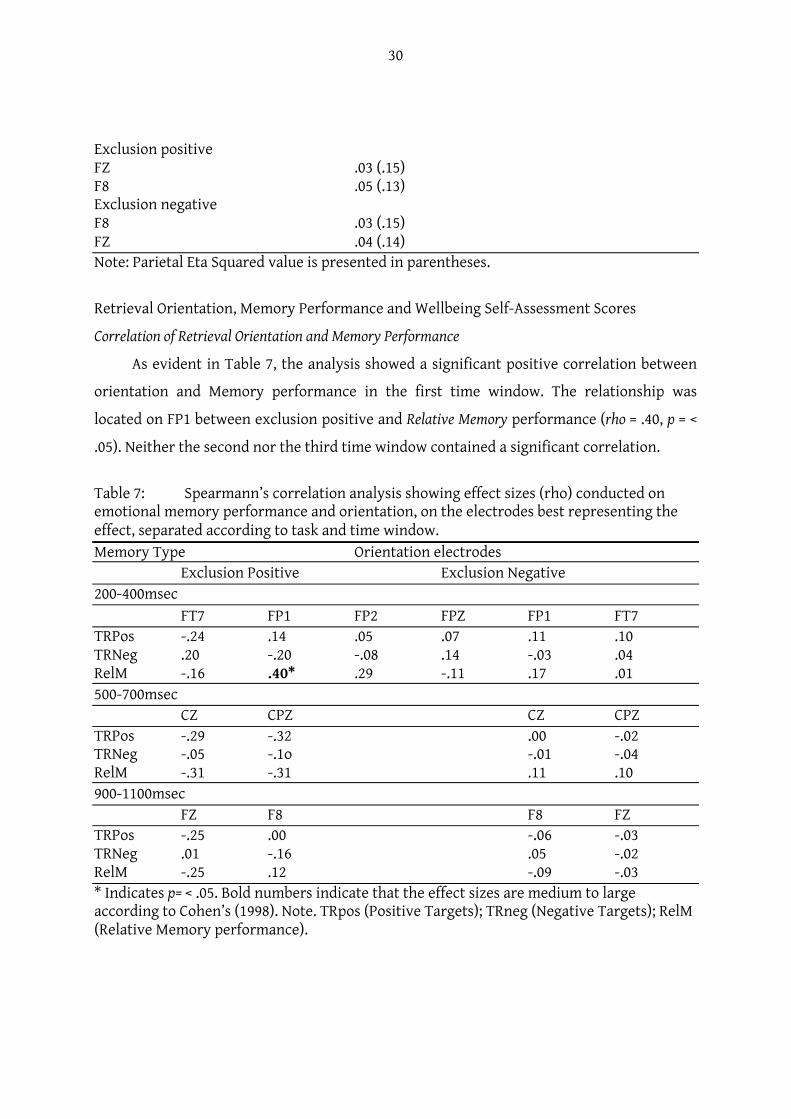
Exclusion positive FZ .03 (.15) F8 .05 (.13) Exclusion negative F8 .03 (.15) FZ .04 (.14) Note: Parietal Eta Squared value is presented in parentheses.
Retrieval Orientation, Memory Performance and Wellbeing Self-Assessment Scores
Correlation of Retrieval Orientation and Memory Performance
As evident in Table 7, the analysis showed a significant positive correlation between
orientation and Memory performance in the first time window. The relationship was
located on FP1 between exclusion positive and Relative Memory performance (rho = .40, p = <
.05). Neither the second nor the third time window contained a significant correlation.
Table 7: Spearmann’s correlation analysis showing effect sizes (rho) conducted on emotional memory performance and orientation, on the electrodes best representing the effect, separated according to task and time window. Memory Type Orientation electrodes Exclusion Positive Exclusion Negative 200-400msec
FT7 FP1 FP2 FPZ FP1 FT7 TRPos -.24 .14 .05 .07 .11 .10 TRNeg .20 -.20 -.08 .14 -.03 .04 RelM -.16 .40* .29 -.11 .17 .01 500-700msec
CZ CPZ CZ CPZ TRPos -.29 -.32 .00 -.02 TRNeg -.05 -.1o -.01 -.04 RelM -.31 -.31 .11 .10 900-1100msec
FZ F8 F8 FZ TRPos -.25 .00 -.06 -.03 TRNeg .01 -.16 .05 -.02 RelM -.25 .12 -.09 -.03 * Indicates p= < .05. Bold numbers indicate that the effect sizes are medium to large according to Cohen’s (1998). Note. TRpos (Positive Targets); TRneg (Negative Targets); RelM (Relative Memory performance).
31
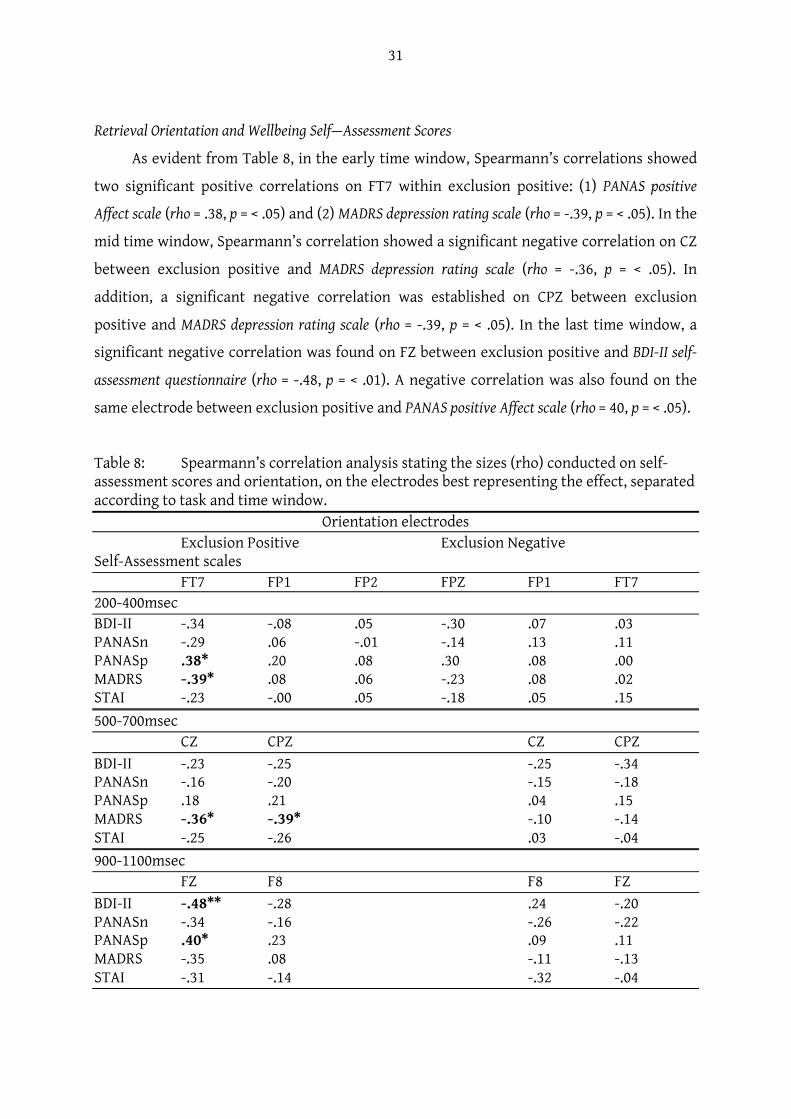
Retrieval Orientation and Wellbeing Self—Assessment Scores
As evident from Table 8, in the early time window, Spearmann’s correlations showed
two significant positive correlations on FT7 within exclusion positive: (1) PANAS positive
Affect scale (rho = .38, p = < .05) and (2) MADRS depression rating scale (rho = -.39, p = < .05). In the
mid time window, Spearmann’s correlation showed a significant negative correlation on CZ
between exclusion positive and MADRS depression rating scale (rho = -.36, p = < .05). In
addition, a significant negative correlation was established on CPZ between exclusion
positive and MADRS depression rating scale (rho = -.39, p = < .05). In the last time window, a
significant negative correlation was found on FZ between exclusion positive and BDI-II self-
assessment questionnaire (rho = -.48, p = < .01). A negative correlation was also found on the
same electrode between exclusion positive and PANAS positive Affect scale (rho = 40, p = < .05).
Table 8: Spearmann’s correlation analysis stating the sizes (rho) conducted on self-assessment scores and orientation, on the electrodes best representing the effect, separated according to task and time window.
Orientation electrodes Exclusion Positive Exclusion Negative Self-Assessment scales
FT7 FP1 FP2 FPZ FP1 FT7 200-400msec BDI-II -.34 -.08 .05 -.30 .07 .03 PANASn -.29 .06 -.01 -.14 .13 .11 PANASp .38* .20 .08 .30 .08 .00 MADRS -.39* .08 .06 -.23 .08 .02 STAI -.23 -.00 .05 -.18 .05 .15 500-700msec
CZ CPZ CZ CPZ BDI-II -.23 -.25 -.25 -.34 PANASn -.16 -.20 -.15 -.18 PANASp .18 .21 .04 .15 MADRS -.36* -.39* -.10 -.14 STAI -.25 -.26 .03 -.04 900-1100msec
FZ F8 F8 FZ BDI-II -.48** -.28 .24 -.20 PANASn -.34 -.16 -.26 -.22 PANASp .40* .23 .09 .11 MADRS -.35 .08 -.11 -.13 STAI -.31 -.14 -.32 -.04
32
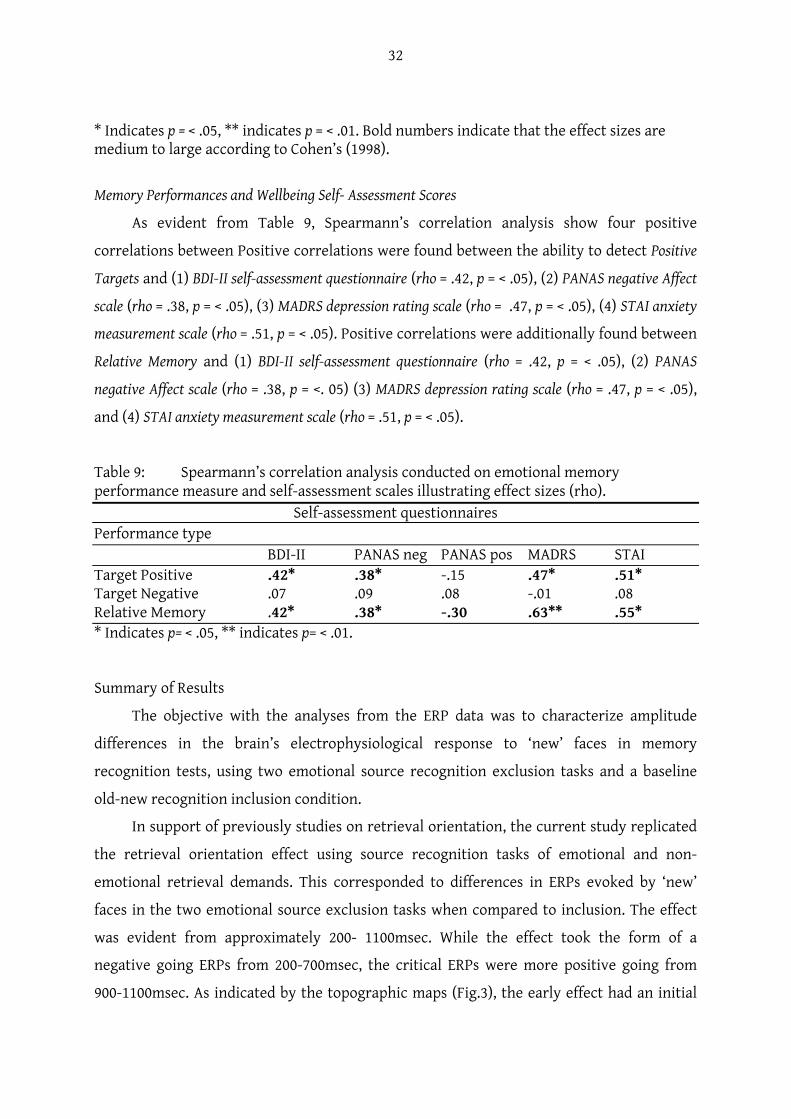
* Indicates p = < .05, ** indicates p = < .01. Bold numbers indicate that the effect sizes are medium to large according to Cohen’s (1998).
Memory Performances and Wellbeing Self- Assessment Scores
As evident from Table 9, Spearmann’s correlation analysis show four positive
correlations between Positive correlations were found between the ability to detect Positive
Targets and (1) BDI-II self-assessment questionnaire (rho = .42, p = < .05), (2) PANAS negative Affect
scale (rho = .38, p = < .05), (3) MADRS depression rating scale (rho = .47, p = < .05), (4) STAI anxiety
measurement scale (rho = .51, p = < .05). Positive correlations were additionally found between
Relative Memory and (1) BDI-II self-assessment questionnaire (rho = .42, p = < .05), (2) PANAS
negative Affect scale (rho = .38, p = <. 05) (3) MADRS depression rating scale (rho = .47, p = < .05),
and (4) STAI anxiety measurement scale (rho = .51, p = < .05).
Table 9: Spearmann’s correlation analysis conducted on emotional memory performance measure and self-assessment scales illustrating effect sizes (rho).
Self-assessment questionnaires Performance type BDI-II PANAS neg PANAS pos MADRS STAI Target Positive .42* .38* -.15 .47* .51* Target Negative .07 .09 .08 -.01 .08 Relative Memory .42* .38* -.30 .63** .55* * Indicates p= < .05, ** indicates p= < .01.
Summary of Results
The objective with the analyses from the ERP data was to characterize amplitude
differences in the brain’s electrophysiological response to ‘new’ faces in memory
recognition tests, using two emotional source recognition exclusion tasks and a baseline
old-new recognition inclusion condition.
In support of previously studies on retrieval orientation, the current study replicated
the retrieval orientation effect using source recognition tasks of emotional and non-
emotional retrieval demands. This corresponded to differences in ERPs evoked by ‘new’
faces in the two emotional source exclusion tasks when compared to inclusion. The effect
was evident from approximately 200- 1100msec. While the effect took the form of a
negative going ERPs from 200-700msec, the critical ERPs were more positive going from
900-1100msec. As indicated by the topographic maps (Fig.3), the early effect had an initial
33
frontal distribution, followed by a mid centre parietal distribution after which a frontal
distribution re-appeared. The correlation analysis revealed a positive relationship between
ERP correlates of positive orientation and positive valenced memory performance in the
first latency region. A positive correlation between the ERP correlates of positive
orientation and wellbeing was found in all three latency regions.
DISCUSSION
The critical ERPs, elicited by ‘new’ test faces attracting correct responses, varied
according to task requirements, thereby supporting the most central hypothesis predicting
that the concept of retrieval orientation could be extended to include emotion as an
episodic quality. For clarification, differences in critical ERPs found in exclusion positive
task will here on be referred to as the ERP correlates of positive orientation effect and the
critical ERPs found in exclusion negative as ERP correlates of negative orientation effect.
The second hypothesis, concerning potential valence specific orientation effects, was
rejected. While there were numerical ERP amplitude differences evoked by ’new’ faces in
both orientation conditions, showing slightly more going ERPs for negative orientation
primarily in the first time window (Fig.3), the differences were not statistically significant.
The third hypothesis predicted a valence congruent relationship between emotional
retrieval orientation and emotional memory, as evinced by a positive correlation between
the two variables. The hypothesis was confirmed (Table 7). The significant correlation
between ERP correlates of positive orientation and relative memory performance
established in the first time window were of a positive nature. Hence, the stronger the
establishment of the ERP correlates of positive orientation effect, the better relative
memory performance for retrieving positive targets.
The fourth hypothesis was an extension of the latter, reflecting the existence of a
valence congruent relationship between orientation and memory, by which it was
hypothesized that such congruent associations would additionally adhere to wellbeing. This
hypothesis was confirmed (Table 8). While the direction of the relationship was negative,
the conclusion after inverting the self-assessment scores was that the stronger the
establishment of the ERP correlates of a positive RO the higher degree of wellbeing
At the present moment we offer no conclusive explanation for why the second
hypothesis predicting a valence specific retrieval orientation effect did not sustain
34
statistical support in either time window (Table 4). A valence specific orientation effect
would have implied that, when searching for positive valenced memories, this would lead
to an establishment of a unique orientation that could be separated from the an orientation
effect established when searching for negative valenced memories. A potential reason why
the current study fell short in achieving the aforementioned is speculative at best. Perhaps
a between-subject design, in which valence is separated on a group basis, would attained a
statistically reliable effect. Perhaps did the within- subject block design employed in the
current study created an emotional valenced transfer effect, which negatively influenced
the results.
Emotional Retrieval Orientation
Robust differences between ERPs elicited by ‘new’ items have been reported in several
studies (Dzulkifli, Sharpe, & Wilding, 2004; Dzulkifli & Wilding, 2005; Herron & Rugg, 2003;
Hornberger, Morcom, & Rugg, 2004; Hornberger, Rugg, & Henson, 2006; Johnson et al. 1997;
Ranganath & Paller, 1999, 2000; Robb & Rugg, 2002; Stenberg, Johansson & Rosén, 2005;
Rugg, Allan & Birch, 2000; Bridger, Herron, Elward, & Widling, 2009). However, to our
knowledge there have been no published reports of whether the effect can be extended to
include emotion.
The current study successfully contributed with the first empirical support of an
emotional retrieval orientation. The motivation for introducing emotion into the concept of
retrieval orientation was based on the fact that emotion in memory literature holds a
unique position, be it from an evolutionary, cognitive or from a neuronal perspective.
Emotional memories, being more durable, are supported by neural mechanisms different
from neural mechanisms supporting non-emotional memories (see introduction). Thus, it
would seem highly likely that the processing of a retrieval cue would be different when the
information being probed is of a emotional character (i.e. the exclusion tasks) compared to
when the information being probed for is of a non-emotional character (i.e. the inclusion
tasks), as shown in prior exclusion studies presented in the introduction. Additionally, the
effect appears to have an earlier onset compared to previous studies using non-emotional
material (see introduction). The reason may be explained using an evolutionary
perspective: a predisposition to prepare for retrieval or emotional memories compared to
non-emotional episodic qualities.
35
Correct Rejections to New Faces
The orientation effect was indexed using correctly classified ‘new’ faces only. As
discussed in the introduction, the orientation effect can therefore not be a reflection of
processing associated with or contingent upon positive recognition judgements such as
retrieval success.
Furthermore, the behavioural analysis revealed no significant difference in levels of
difficulty across tasks. The effect of orientation was successfully obtained despite
equivalent levels of CR across target designation as well as between emotional valence
designations. This is imperative since it suggests that any differences between ERPs elicited
by unstudied faces separated according to target designation were unlikely to reflect
different levels of difficulty across tasks. This interpretation is supported by previous
studies (Rubb and Rugg 2002; Wilding, 1998; Hornberger, Rugg & Henson, 2004) (see also
Dzulkifli, Sharpe & Wilding 2004). The current study did, however, not take reaction times
into account and therefore there is a possibility that reaction time differed between tasks,
which could have affected the results. Nonetheless, with a few exceptions, other studies
have found no relationships between the magnitude of the orientation effect and difference
in reaction times (Rugg et al. 2000; Hornberger et al. 2004).
Findings from the current study suggest an early and a late orientation effect. An
early emotional orientation effect was apparent from 200msec post-stimulus onset and
remained until approximately 700msec. The ERPs evoked by CR within this time frame were
more negative going than were the ERPs evoked by CR in the inclusion condition.
In terms of the distribution of effect, an initial frontal distribution was evident from
200-400 msec, followed by a mid centre parietal distribution from 500-700msec. The last
time window, 900-1100msec, showed a re-appearance of the initial frontal distribution. This
change in distribution can be taken as evidence for an engagement of functionally different
processes during emotional retrieval orientation.
The study additionally demonstrated a second later orientation effect was at around
900msec and lasted until approximately 1100msec. The direction of the critical ERPs was
now more positive than compared to inclusion and, as opposed to the effect evident from
200-700msec. While not statistically reliable the ERP orientation effect in this last time
window appeared to be frontally distributed. The extended time course (approximately
1100msec) of the emotional orientation effect found in the present study is in line with
36
previous studies on orientation, in which the general time course is approximately 300 to
1500msec (Wilding, 1999; Bridger et al. 2009; Dzulkifli, Sharpe & Wilding, 2004; Herron &
Rugg, 2003; Hornberger, Rugg & Henson, 2005).
Concerning the comparison of the scalp distributions stated above, different
distributions of ERP effects could be used to investigate whether different classes of
stimulus evoke different patterns of neural activity. In contrast to previous orientation
studies in which no change in distribution was found (see introduction), the current
emotional orientation effect showed an initial frontal distribution, which than changed into
a mid-centre parietal distribution, followed by the re-appeared of the initial frontal
distribution. While the change in distribution is contrary to some of the previous
orientation studies (i.e. Hornberger, Rugg & Henson, 2005; Dzulkifli et al. 2004; Bridger et al.
2009), the distribution of prior orientation effects commonly show frontal and central
distributions (Herron & Rugg, 2003; Hornberger, Rugg & Henson, 2005; Rugg, Allan & Birch,
2000).
The findings in the current study indicate that the differences between the critical
ERPs were most pronounced in the first time window. The reason may be explained as the
initial engaging in a retrieval orientation process. When the brain first begins to selectively
search for a particular memory trace with a particular episodic quality (emotion), prompted
by a retrieval cue (a face). It would seem likely that the initiation of such strategic retrieval
processing would leave behind a relatively strong neural imprint.
In addition to the effect being strongest in the first time window, the ERP correlates
for negative orientation compared to the ERP correlates for positive orientation showed a
stronger effect, in all time windows. This may be supported by the fact that negative items
also seem more likely to be remembered with specific details than with positive memories.
Negative memories benefits from a focus on memory for detail (Kensinger, 2007), which
makes sense within an evolutionary framework. A primary function of emotion is to guide
action (Lazarus, 1991) and thus it is logical that attention would be focused on potentially
threatening information and that memory mechanisms would ensure that details predictive
of an events affective relevance would be encoded precisely.
As presented in the introduction, PFC plays an important role in episodic memories
and anterior scalp distributions of retrieval orientation have been associated with and draw
support from generator or generators positioned in PFC (Wilding, 1999). Empirical studies
37
focusing on memory retrieval have supported the idea that the functional integrity of PFC
is necessary for strategic retrieval processing (see Ranganath & Paller, 2000). Therefore,
there may be good reasons to believe that the differences found in the current study
between the critical ERPs at frontal scalp locations (in the first and last time window) may
reflect activity in the prefrontal cortex related to the emotional orientation effect found in
the current study. It has furthermore been proposed that processes supporting the retrieval
of contextual information become available around 900msec (Yonelinas & Jacoby, 1994), at
which time the current study shows the re-appearance of the frontal distribution.
The most economical explanation for the differences between the critical ERPs
evoked by the two classes of ‘new’ faces in the current study is that they are an index of the
engagement of different retrieval orientations (emotional and non-emotional) and that the
degree to which the task-specific retrieval processes are engaged is not modified by task
difficulty. The findings presented here are taken in support of the proposal that people
process retrieval cues differently according to the form of the sought after information,
here illustrated using emotional vs. non-emotional pictorial stimuli. This allows us to focus
retrieval attempts on only a selective subset of memories, which optimizes its effectiveness
as a retrieval cue. This follows from the suggestion that episodic memory retrieval is
facilitated when overlap between cue and target processing is high, as embodied in
theoretical principles such as the transfer appropriate processing and encoding specificity
(see introduction). Consequently, the findings presented here further support the notion
that retrieval orientation engages strategic source monitoring processes.
Emotional Retrieval Orientation and Emotional Memory Performance
The current study predicted that the ERP correlates of positive orientation would be
positively related to the retrieval of positive memory, demonstrating a congruent
relationship between emotional orientation and emotional memory retrieval. The rationale
for such prediction stems from empirical studies demonstrating the mood-congruent
memory recall bias, stating that depressed individuals present a memory bias towards
negative memories (see introduction). The congruence between mood and the facilitated
ability to retrieve emotional memories raises the question whether this biased effect
additionally could influence the brains electrophysiological response when processing an
emotional retrieval cue according to a specific valence demand.
38
The results indicated valence congruent relationship between ERP correlates of
positive orientation and relative memory performance. In other words, the ERP correlates
of positive orientation effect facilitated the retrieval of positive relative to negative
memories. What could a relationship between positive orientation effect and positive
memory represent? If a positively valenced emotional retrieval orientation effect facilitates
the detection of positive targets relative to negative this would extend the notion of mood-
congruent memory recall bias to include strategic memory retrieval processes.
In the current study, the ERP correlates of negative orientation presented neither
reliable correlations nor reasonable effect sizes in relation to memory performance in any
of the three latency regions. A speculative reason underlying the absence of such may be
related to the relatively healthy degree of wellbeing in the sample size employed which
again would support the notion of mood-congruent memory recall bias.
Emotional Retrieval Orientation and Wellbeing Self-Assessment Scores
The current study predicted a valence congruent relationship between orientation
and wellbeing: i.e. that the ERP correlates of positive orientation would be negatively
correlated with the self-assessment questionnaires. As in the former hypothesis, the
rationale for such prediction stems from the fact that depressed individuals present a
memory bias towards negative memories and the current study sought to extend such bias
to include the orientation effect.
The finding confirmed negative correlations between the positive orientation effect
and self-assessment questionnaires which signified that the stronger the orientation effect,
the lower the self-assessment scores. When inverting the scores, results implied that the
stronger the orientation the higher the degree of wellbeing. In fact, considering all
correlations made between orientation and wellbeing it was evident that the stronger the
orientation effect is, the higher the degree of wellbeing.
The predictions addressed questions concerning what implication an emotional
retrieval orientation effect could have for our wellbeing, or put differently, what
implications could our wellbeing have for the establishment of emotional retrieval
orientation. Could perhaps a larger establishment of negative retrieval orientation be
indicative of depression? If so, the establishment of orientation effects may be used as a
39
supplementary method of diagnosing mood disorders or at least as a measure indicating
tendencies towards depression.
Reflecting on the absence of reliable correlations between the ERP correlates of
negative orientation and wellbeing (in line with above presented correlations with
memory), a credible presumption is that the outcome would be different had the current
study employed a clinical sample. For one must remember that the sample size used in the
current study, whilst speaking of higher and lower degree of wellbeing as assessed by the
self-assessment scores, the scoring of the participants as at a healthy level. As a result of the
participants not scoring high enough, the scores were treated independently of the
traditional cutoff scores.
Focusing solely on the relationship between emotional memory performance and
wellbeing, it was evident that those participants who had the lower degree of wellbeing
showed the best performance on positively valenced memories. While not explicitly part of
the experimental predictions, the findings that memory and wellbeing is correlated in this
particular way was highly surprising. These findings are contrary to the notion of mood-
congruent recall. Could it possibly be that those with a lower degree of wellbeing (while not
being clinically depressed) compensate by attending more to the positive targets and thus
show a higher performance for such? The reason why these results are in contrast to the
traditional findings may be due to the simple reason that the current study used a rather
small sample size of a non-clinical population and it did not use the accompanying
traditional cutoff scores. As previously stated, the clinical tests employed in this study may
simply not be sensitive enough to be used in the current context by means of sample type
and sample size.
To summarise, the important aspects of the current findings are (1), support for that
participants adopted different retrieval orientations depending on the emotional or non-
emotional nature of the information that must be retrieved to satisfy the task requirement,
even when the tasks were of equal difficulty. Constraining the processing of retrieval cues
to match the encoded information should be beneficial in that it would increase the
likelihood of successful recognition or rejection of test items. While the first of its kind to
include emotion as an episodic source memory retrieval quality, the findings support
previously reported ERP retrieval orientation effects. (2) Support for a valence congruent
relationship between positive retrieval orientation and the ability to retrieve positive
40
emotional memories. (3) Support for a valence congruent relationship between orientation
and wellbeing.
The establishment of the emotional retrieval orientation effect here presented is of
high reliability since the effect was evident in three latency regions. The usage of a baseline
condition (i.e. inclusion) to which the differences were compared further support the
validity of the present findings. Merely comparing source memory recognition (exclusions)
conditions would not adequately explain any possible ERP difference found across retrieval
tasks.
Limitations of the current study
In the current study, a few remarks were made in relation to the emotional stimulus
material, particularly the employment of “neutral faces”. One may go so far as to question
the existence of a “neutral" human face. Some eyes just seem to smile at you while others
scare. Such individual differences may negatively influence the results. If a natural face is
perceived as negative yet paired with a positive image, an incongruency effect may effect
the later retrieval processing. While the problem may never be completely avoided, future
studies may gain by using computerized faces. Today’s technology could likely create a
credible computerized neutral human face, which would further standardize the stimulus
material.
Another remark valid for most studies of emotional memory is that you examined
short-lived emotional reactions to stimuli. This happens, for instance, when showing
pictures of a gun presented within a safe laboratory environment. One could question
whether such mnemonic influences are comparable to those that arise when you
experience highly arousing events in real life. Most of us would agree that a picture of a
loaded gun would fail to induce a comparable response as having a gun really pointed at
your face.
Other difficulties in emotional memory studies concern the comparing of emotionally
valenced images. For instance, a positive valenced image, as positive as it may be, rarely can
measure up to a highly negative. As stated in the introduction, negative valence seems to be
remembered with more details compared to positive information and, while such bias
makes perfect sense from an evolutionary perspective, it creates problems for designing
experiments of emotional memory. One way of decreasing the difference between
41
emotionally valenced images could be to select which particular negative emotions one
takes into account (e.g. disgust, fear or sadness). The present study fell short in doing so.
Future Directions
Since the literature on retrieval orientation is already very scarce, further research on
emotional retrieval orientation is needed in order to fully comprehend its characterization.
A fruitful step would be further investigations into whether an emotional orientation
effect, as in line with Bridger et al. (2009), serves as a facilitating mechanism. This would be
achieved using a median split to correlate high and low relative memory performance (of
positive and negative nature) with the neural correlates of positive and negative retrieval
orientation.
Another idea is to extend the previous study using emotional words (visually and/or
orally presented) in order to see whether the manifestation of the emotional orientation
effect differs from the one established using pictorial stimuli. As stated in the introduction,
while verbal material has already been used to investigate the orientation effect, none has
used non- emotional verbal material (in either format). The interest in comparing verbal vs.
pictorial emotional stimuli arises from the notion that pictures, in contrast to words, stand
in a relation of likeness to the object they represent. Intuitively one could assume that
pictures are perceived in a different way than words, being essentially based on linguistic
conventions.
While the current study, using a non-clinical population, found correlations between
the ERP correlates of positive orientation, memory performance and wellbeing, none was
found within negative orientation. If positive orientation facilitates positive memory
retrieval and wellbeing in a healthy population (thereby possibly explaining the absence of
correlations within a negative orientation effect), future studies may look to clinical
populations, comparing the manifestation of positive and negative orientation effects in
clinical and non-clinical samples. From this perspective, the establishment of positive and
negative emotional orientation effects may be used indicative of mental health, which
would be useful for clinicians working with mood-disorders.
Another possibility would be to include emotion regulation as a variable, investigating
whether different regulatory strategies affect differently the neural correlates of
orientation. The interest being the importance of cognitive control of emotion for human
42
adaptive functioning and the notion that a deficiency in the cognitive control effecting
emotion regulation is a common factor in mood-disorders.
REFERENCES
Aron, A.R., Poldrack, R.A. (2005). The cognitive neuroscience of response inhibition:
relevance for genetic research in attention-deficit/hyper activity disorder. Biological
Psychiatry, 57, 1285-1292.
Beck AT, Steer RA, Brown GK: Manual for Beck Depression Inventory II (BDI-II). San Antonio, TX,
Psychoogy Corporation, 1996.
Bridger, E.K., Herron, J.E., Elward, R.L., Wildring, E.L., (2009). Neural Correlates of Individual
Differences in Strategic Retrieval Processing. Journal of Experimental Psychology:
Learning, Memory and Cognition. 35:5, 1175-1186.
Cahill, L., & McGaugh, J.L. (1998). Mechanisms of emotional arousal and lasting declarative
memory. Trends in Neuroscience, 2, 352-363.
Campbell-Sills, L., & Barlow, D.H. (2009). In J.J. Gross (Eds). Handbook of emotion regulation
(pp. 542-560). New York: Guildford Press.
Christianson, S.A. (1992). The handbook of emotion and memory. Hillsdale, Nj: Erlbaum.
Cohen, J. W. (1988). Statistical power analysis for the behavioural science (2nd edn). Hillsdale, NJ:
Lawrence Erlbaum Associates.
Danion, J.M., Kauffmann-Muller, D., Grange, D., Zimmermann, M.A., Greth, P. (1995).
Affective valence of words, explicit and implicit memory in clinical depression. Journal
of Affective Disorders, 34, 227-234.
DeLuca, J. (2000). A cognitive perspective on confabulation. Neuro- Psychoanalysis, 2, 119–132.
Diana, R.A., Yonelinas, A.P., & Ranganath, C. (2007). Imaging recollection and familiarity in
the medial temporal lobe: A three- component model. Trends in Cognitive Sciences, 11,
379–386. representation of context. Trends in Cognitive Sciences, 12, 24–30.
Dichter, G.S, Felder, J.N., Smoski, M.J. (2009). Affective context interferes with cognitive
control in unipolar depression: an fMRI investigation, Journal of Affective Disorders, 114,
131-142.
Dozois, D.J.A., & Dobson, K.S. (2001). Information processing and cognitive organization in
unipolar depression: specificity and comorbidity issues. Journal of abnormal psychology,
110, 236-246.
43
Dzulkifli, M.A., Sharpe, H.L., & Wilding, E.L. (2004). Separating item-related
electrophysiological indices of retrieval effort and retrieval orientation. Brain and
Cognition, 55, 433-443.
Dzulkifli, M.A., & Wilding, E.L. (2005). Electrophysiological indices of strategic episodic
retrieval processing. Neuropsychologia, 43, 1152-1162.
Friedman, D., & Johnson, J.R. (2002). Event-related potential (ERP) studies of memory
encoding and retrieval: a selective review. Microscopy Research and Technique, 51, 6-28.
Gotlib, I.H., Krasnoperova, E., Yue, D.N., Joormann, J. (2004). Attentional biases for negative
interpersonal stimuli in clinical depression. Journal of abnormal psychology, 113: 127-
135.
Greenhouse, G.W., & Geisser, S. (1959). On methods in the analysis of profile data.
Psychometrika, 49, 95-112.
Hamann, S.B., Ely, T.D., Grafton, S.T., & Kilts, C.D. (1999). Amygdala activity related to
enhanced memory for pleasant and aversive stimuli. Nature Neuroscience, 2, 289-293.
Hamann, S.B. (2001). Cognitive and neural mechanisms of emotional memory. trends in
Cognitive Science, 5, 394-400.
Herron, J.E., & Rugg, M.D. (2003). Retrieval orientation and the control of recollection.
Journal of Cognitive Neuroscience, 15, 843-854.
Hornberger, M., Rugg, M.D., & Henson, R.N. (2006). ERP correlates of retrieval orientation:
Direct versus indirect memory tasks. Brain Research, 1071, 124-136.
Hornberger, M., Morcom, A.M., & Rugg, M.D. (2004). Neural correlates of retrieval
orientation: Effects of study-test similarity. Journal of Cognitive Neuroscience, 16, 1196-
1210.
Jacoby, L.L. (1991). A process dissociation framework: Separating automatic from
intentional uses of memory. Journal of Memory and Language, 20, 513-541.
Jacoby, L. L. & Dallas, M. (1981). On the relationship between autobiographical memory and
perceptual learning. Journal of Experimental Psychology: General, 110, 306-340.
Johansson, M., Mecklinger, A., Treese, AC. (2004). Journal of Cognitive Neuroscience, 16(10),
1840-1853.
Johnson, M.K., Foley, M.A., Leach, K. (1998). The consequence for memory of imagining in
another person’s voice. Memory and Cognition, 16, 337-42.
Johnson, M.K., Hashtroudi, S., Lindsay D.S. (1993). Source monitoring. Psychological Bulletin,
44
1143-28.
Johnson, M.K., Kounios, J., & Nolde, S.F. (1997). Electrophysiological brain activity and
memory source monitoring. NeuroReport, 8, 1317-1320.
Kensinger, E. A. (2007) Negative Emotion Enhances Memory Accuracy: Behavioral and
Neuroimaging Evidence. Current Directions in Psychological Science, 16(4), 213-218.
Kensinger, E.A., & Schacter, D.L. (2006). When the red sox shocked the Yankees: comparing
negative and positive memories. Psychonomic Bulletin & Review, 13(5), 757-763.
Koster, E.H.W., De Raedt, R., Goeleven, E., Franck, E., Crombez, G. (2005). Mood-congruent
attentional bias in dysphoria: maintained attention to and impaired disengagement
from negative information. Emotion, 5, 446-455.
Lang, P.J., Bradley, M.M., & Cuthbert, B.N. (2008). International affective picture system (IAPS):
Affective ratings of pictures and instruction manual. Technical Report A-8. University of
Florida, Gainesville, FL.
Lazarus, Richard (1991). Cognition and Motivation in Emotion, American Psychologist
46, 362–67.
Levine, L.J., & Bluck, S. (2004). Painting with broad strokes: Happiness and the malleability
of event memory. Cognition and Emotion, 18, 559-574.
Luck, S.J. (2005). An introduction to the event-related potential technique. Cambridge, MA:
MIT Press.
Lyubomirsky, S., Caldwell, N. D., & Nolen-Hoeksema, S. (1998). Effects of ruminative and
distracting responses to depressed mood on retrieval of autobiographical memories.
Journal of Personality and Social Psychology, 75, 166 –177.
Lyubomirsky, S., & Nolen-Hoeksema, S. (1993). Self-perpetuating properties of dysphoric
rumination. Journal of Personality and Social Psychology, 65, 339 –349.
Lyubomirsky, S., Caldwell, N.D., & Nolen-Hoeksema, S. (1998). Effects of ruminative and
distracting response to depressed mood on retrieval of autobiographical memories.
Journal of Personality and Social Psychology, 65, 339–349.
Madigan, S. (1983). Picture Memory. In, J.C. Yuille (Eds.). Imagery, memory and cognition:
Essays in honor of Allan Paivio (pp.65-89). Hillsdale NJ; Erlbaum.
Mandler, G. (1980). Recognizing: The judgement of previous occurrence. Psychologica
Review, 87, 252-271.
Maratos, E.J., & Rugg, M.D. (2001). Electrophysiological correlates of the retrieval of
45
emotional and non-emotional context. Journal of Cognitive Neuroscience, 13, 877-891.
Maratos, E.J., Dolan, R.J., Morris, J.S., Henson, R.N., & Rugg, M.D. (2001). Neural activity
associated with episodic memory for emotional context. Neuropsychologia, 39, 910-920.
Martinez, A.M., & Benavante, R. (1998). The AR face databse. CVC Technical Report #24.
McClelland, J.L., McNaughton, B.L., & O’Reilly, R.C. (1995). Why there are complementary
learning systems in the hippocampus and neocortex: Insights from the successes and
failures of connectionist models of learning and memory. Psychological Review, 102(3),
419-457.
McGaugh, J.L., (2000). Memory: a century of consolidation. Science, 287. 248-251.
Miller, E.K., & Cohen, J.D. (2001). An integrative theory of prefrontal cortex function. Annual
Review of Neuroscience, 24, 167-202.
Morris, C.D. et al. (1977). Levels of processing versus transfer appropriate processing. Journal
of Verbal Learning and Verbal Behaviour, 16, 519-533.
Nadel, L.N., & Moscovitch, M. (1997). Memory consolation, retrograde amnesia and the
hipppocampal complex. Current Opinion in Neurobiology, 7, 217-227.
Nolen-Hoeksema, S., Morrow, J., & Fredrickson, B. L. (1993). Response styles and the
duration of episodes of depressed mood. Journal of Abnormal Psychology, 102, 20–28.
Nolen-Hoeksema, S. (2000). The role of rumination in depressive disorders
and mixed anxiety/depressive symptoms. Journal of Abnormal Psychology, 109, 504 –511.
Norman, K.A., & O’reilly, R.C. (2003). Modelling hippocampla and neocortical contributions
to recognition memory: a complementary –learning systems approach. Psychological
Review, 110 (4), 611-46.
Ochsner, K.N. (2000). Are affective events richly recollected or simply familiar? The
experience and processes of recognizing feelings past. Journal of Experimental
Psychology: General, 129(2), 242-261.
Petrides, M., & Mackey, S. (2006). The orbitofrontal cortex: sulcal and gyral morphology and
architecture. In D.H. Zald & S.L. Rauch (Eds.). The orbitofrontal cortex (pp. 19-38). New
York: Oxford University Press.
Ranganath, C., & Paller, K.A. (1999). Frontal brain potentials during recognition are
modulated by requirements to retrieve perceptual details. Neuron, 22, 605-613.
Ranganath, C., & Paller, K.A. (2000). Neural correlates of memory retrieval and evaluation.
Cognitive brain research, 9. 209-222.
46
Robb, W.G.K., & Rugg, M.D. (2002). Electrophysiological dissociation of retrieval orientation
and retrieval effort. Psychonomic Bulletin and Review, 9, 583- 589.
Rugg, D.M., Allan, K., Birch, C.S. (2000). Electrophysiological evidence for the modulation of
Retrieval Orientation by depths of study processing. Journal of Cognitive Neuroscience,
12(4), 664-678.
Rugg, M., Johnson, J.D., Park, H., & Uncapher, M.R. (2008). Encoding – retrieval overlap in
human episodic memory: A functional neuroimaging perspective. In W. Sossin,
J.-C. Lacaille, V. Castelluci, & S.Belleville (Eds.) The essence of memory (vol. 169, pp. 339
352). Elsevier, B.V.
Rugg. M.D., Wilding, E.L. (2000). Retrieval processing and episodic memory. Trends in
cognitive sciences, 4(3), 108-115.
Schacter, D.L., Norman, K.A.,, & Koutstaal, W. (1998). The cognitive neuroscience of
constructive memory. Annual Review of Psychology, 49, 289-318.
Simons, J.S., & Spiers, H.J. (2003). Prefrontal and medial temporal lobe interactions in long
term memory. Nature Review Neuroscience, 4(8), 637-648.
Smith, A.P.R., Dolan, R. J., & Rugg, M.D., (2004). Event-Related Potential Correlates of the
Retrieval of Emotional and Non-emotional Context. Journal of Cognitive Neuroscience,
16(5), 760-775.
Spielberger, C. D., Gorsuch, R.L., and Lushene. R.E. (1970). Manual for the State-Trait
Anxiety Inventory. Palo Alto, CA: Consulting Psychologists Press.
Stenberg, G., Johansson, M., & Rosén, I. (2006). Conceptual and perceptual memory:
Retrieval orientations reflected in event-related potentials. Acta Psychologica, 122, 174
205.
Svanborg, P., & Åsberg, M. (1994). A new self-rating scale for depression and anxiety states
based on the Comprehensive Psychopathological Rating Scale. Acta Psychiatrica
Scandinavica, 89, 21-28.
Thompson, S.S. & McCarrther, R. (1964). "What and WhereAre the Primary Affects? Some
Evidence for a Theory. Perceptual and Motor Skills, 18, 119-158).
Tottenham, N., Tanaka, J., Leon, A.C., McCarry, T., Nurse, M., Hare, T.A., Marcus, D.J.,
Westerlund, A., Casey, B.J., Nelson, C.A. (2009). The NimStim set of facial expressions:
judgments from untrained research participants. Psychiatry Research, 168(3):242-9.
Tulving, E. (1983) Elements of episodic memory. New York: Oxford University Press.
47
Tulving, E. (2002). Episodic memory and common sense: how far apart? In A.Baddele, M.
Conway, & J.P. Aggleton (Eds.), Episodic memory: new directions in research (pp. 269-288).
New York: Oxford University Press.
Tulving, E. and Thomson, D.M. (1973). Encoding specificity and retrieval processes in
episodic memory. Psychological Review, 80, 353-373.
Zimmer, Hubert, D., Mecklinger, A., Lindeberger, U. (2006). Levels of binding: types,
mechanisms and functions of binding in remembering. In Zimmer, Hubert, D.,
Mecklinger, A., Lindeberger, U. (Eds), Handbook of binding and memory. Perspectives from
cognitive neuroscience (pp. 5-22). Oxford University Press.
Wagner, A. (2002). Cognitive control of episodic memory. In L.R. Squire & D.L. Schacter
(Eds.), Neuropsychology of memory (3 ed., pp.174-192). New York: Guilford Press.
Wager, T.D., Davidson, M.L., Huges, B.L., Lindquist, M.A., Ochsner, K.N. (2008) Prefrontal-
subcortical pathways mediating successful emotion regulation. Neuron, 59, 1037-1050.
Wang, L., LaBar, K.S., Smoski, M., Rosenthal, M.Z., Dolcos, F., Lynch, T.R., et al. (2008).
Prefrontal mechanisms for executive control over emotional distraction are altered in
major depression. Psychiatry Research, 163: 143-155.
Watson, D., Clark, L.A., & Tellegen, A. (1988). Development and validation of brief measures
of positive and negative affect: The PANAS scales. Journal of Personality and Social
Psychology, 54(6), 1063-1070.
Wilding, E.L., (1999). Separating retrieval strategies from retrieval success: An event related
potential study of source memory. Neuropsychologia, 37, 441-454.
Wilding, E.L. & Nobre, A.C. (2001). Task-switching and memory retrieval processing:
Electrophysiological evidence. NeuroReport, 12, 3613-3617.
Williams, J. M. G.,Watts, F. N., MacLeod, C., & Mathews, A. (1997). Cognitive psychology and
emotional disorders (2nd ed.). New York: Wiley.
Yonelinas, A.P. (2002). The nature of recollection and familiarity: A review of 30 years of
research. Journal of Memory and Language, 46, 441-517.
Yonelinas, A.P., & Jacoby, L.L. (1994). Dissociations of processes in recognition memory –
Effects of interference and of response speed. Canadian Journal of Experimental
Psychology, 48, 516-535.
Related Documents