ORIGINAL ARTICLES Neural Abnormalities during Cognitive Generation of Affect in Treatment-Resistant Depression Veena Kumari, Martina T. Mitterschiffthaler, John D. Teasdale, Gin S. Malhi, Richard G. Brown, Vincent Giampietro, Michael J. Brammer, Lucia Poon, Andrew Simmons, Steven C.R. Williams, Stuart A. Checkley, and Tonmoy Sharma Background: Dysfunctions in brain regions known to be involved in affect and mood states are thought to be implicated in depression and may have a role in deter- mining the type and symptoms of this illness. Methods: Functional magnetic resonance imaging was used to elucidate neural correlates of cognitive generation of affect, using a previously published paradigm of evok- ing affect with picture-caption pairs, in patients with unipolar, treatment-resistant depression. Results: Compared with control participants, patients showed relatively decreased response in the anterior cingulate (rostral; right) with both negative and positive picture-caption pairs and in the medial frontal gyrus and hippocampus (all left) with positive picture-caption pairs. They demonstrated increased response in the inferior (right) and middle temporal gyri (left) with negative picture-caption pairs, and in the parahippocampal gyrus (right), inferior frontal gyrus (left), subgenual cingulate (right), striatum (right), and brain stem (left) with positive picture-caption pairs. Conclusions: Reduced medial/middle prefrontal and hip- pocampal activity may account for positive affect distur- bances and temporal lobe hyperactivity for negative affect disturbances in treatment-resistant depression. The results also corroborate previous observations from resting positron emission tomography studies and further eluci- date the association between hypoactive rostral cingulate and nonresponsiveness to treatment in depression. Biol Psychiatry 2003;54:777–791 © 2003 Society of Biologi- cal Psychiatry Key Words: Depression, functional magnetic resonance imaging, affective processing Introduction A dvances in neuroimaging have greatly facilitated our investigations of the neural correlates of mental phenomena in psychiatric disorders (Andreasen 1997), for example the mapping of brain changes associated with affective disturbances seen in depression (Mayberg et al 1997). The symptoms of depression include both anxiety (Lader 1983) and an inability to experience pleasure, known as anhedonia (Snaith 1993). Hyposensitivity to both positive and negative affect–toned stimuli (Wexler et al 1994) has been reported in individuals suffering from depression. There is evidence that left frontal (Robinson et al 1984; Starkstein and Robinson 1991) and basal ganglia lesions (Starkstein et al 1988) can lead to symptoms of depression. Abnormalities in other regions that are known to modulate affect and mood states, such as the amygdala, striatum, thalamus, cingulate gyrus, or orbitofrontal lobe, have also been implicated in depressive disorders (Brody et al 2001; Byrun et al 1999). There are suggestions that various brain regions, alone or in combination, may have somewhat different roles in determining the frequency, type, or symptoms of depression (Brody et al 2001; Byrun et al 1999; Paradiso et al 1999a; Starkstein et al 1988). A well-known neural model of depression (Mayberg 1997) implicates limbic– cortical dysregulation in this disorder, where the function of the rostral anterior cingulate plays a critical role in treatment responsiveness (Mayberg et al 1997). Previous studies in healthy individuals using positron emission tomography (PET) (George et al 1995; Lane et al 1997a, 1997b; Paradiso et al 1997; Pardo et al 1993; Partiot et al 1995; Schneider et al 1995) and, more recently, with functional magnetic resonance imaging (fMRI) (Canli et al 1998; Teasdale et al 1999), have advanced our understanding of mood and affective distur- bances in depression. There are, however, limited reports on the neural basis of (abnormal) affect modulation in depressed patients using PET (Mayberg et al 1999) or using fMRI (Beauregard et al 1998; Sheline et al 2001). Furthermore, previous studies of depression using PET or From the Section of Cognitive Psychopharmacology (VK, MTM), Department of Psychology (VK, RGB), Brain Image Analysis Unit (VG, MJB), Neuroimaging Research Group (AS, SCRW), Department of Psychiatry (SAC), Royal Bethlem Hospital (LP), Institute of Psychiatry, King’s College, London, and Cognition and Brain Sciences Unit (JDT), Medical Research Council, Cam- bridge, United Kingdom; Mood Disorders Unit at The Prince of Wales Hospital and School of Psychiatry at the University of New South Wales (GSM), Sydney, Australia; Clinical Neuroscience Research Centre (TS), Dartford, Kent, United Kingdom. Address reprint requests to Tonmoy Sharma, M.R.C.Psych., Director, Clinical Neuroscience Research Centre, 7 Twisleton Court, Priory Hill, Dartford, Kent, DA1 2EN, UK. Received April 4, 2002; revised September 23, 2002; accepted October 1, 2002. © 2003 Society of Biological Psychiatry 0006-3223/03/$30.00 doi:10.1016/S0002-3223(02)01785-7

Welcome message from author
This document is posted to help you gain knowledge. Please leave a comment to let me know what you think about it! Share it to your friends and learn new things together.
Transcript
ORIGINAL ARTICLES
Neural Abnormalities during Cognitive Generation ofAffect in Treatment-Resistant Depression
Veena Kumari, Martina T. Mitterschiffthaler, John D. Teasdale, Gin S. Malhi,Richard G. Brown, Vincent Giampietro, Michael J. Brammer, Lucia Poon,Andrew Simmons, Steven C.R. Williams, Stuart A. Checkley, and Tonmoy Sharma
Background: Dysfunctions in brain regions known to beinvolved in affect and mood states are thought to beimplicated in depression and may have a role in deter-mining the type and symptoms of this illness.
Methods: Functional magnetic resonance imaging wasused to elucidate neural correlates of cognitive generationof affect, using a previously published paradigm of evok-ing affect with picture-caption pairs, in patients withunipolar, treatment-resistant depression.
Results: Compared with control participants, patientsshowed relatively decreased response in the anteriorcingulate (rostral; right) with both negative and positivepicture-caption pairs and in the medial frontal gyrus andhippocampus (all left) with positive picture-caption pairs.They demonstrated increased response in the inferior(right) and middle temporal gyri (left) with negativepicture-caption pairs, and in the parahippocampal gyrus(right), inferior frontal gyrus (left), subgenual cingulate(right), striatum (right), and brain stem (left) with positivepicture-caption pairs.
Conclusions: Reduced medial/middle prefrontal and hip-pocampal activity may account for positive affect distur-bances and temporal lobe hyperactivity for negative affectdisturbances in treatment-resistant depression. The resultsalso corroborate previous observations from restingpositron emission tomography studies and further eluci-date the association between hypoactive rostral cingulateand nonresponsiveness to treatment in depression. BiolPsychiatry 2003;54:777–791 © 2003 Society of Biologi-cal Psychiatry
Key Words: Depression, functional magnetic resonanceimaging, affective processing
Introduction
Advances in neuroimaging have greatly facilitated ourinvestigations of the neural correlates of mental
phenomena in psychiatric disorders (Andreasen 1997), forexample the mapping of brain changes associated withaffective disturbances seen in depression (Mayberg et al1997). The symptoms of depression include both anxiety(Lader 1983) and an inability to experience pleasure,known as anhedonia (Snaith 1993). Hyposensitivity toboth positive and negative affect–toned stimuli (Wexler etal 1994) has been reported in individuals suffering fromdepression.
There is evidence that left frontal (Robinson et al 1984;Starkstein and Robinson 1991) and basal ganglia lesions(Starkstein et al 1988) can lead to symptoms of depression.Abnormalities in other regions that are known to modulateaffect and mood states, such as the amygdala, striatum,thalamus, cingulate gyrus, or orbitofrontal lobe, have alsobeen implicated in depressive disorders (Brody et al 2001;Byrun et al 1999). There are suggestions that various brainregions, alone or in combination, may have somewhatdifferent roles in determining the frequency, type, orsymptoms of depression (Brody et al 2001; Byrun et al1999; Paradiso et al 1999a; Starkstein et al 1988). Awell-known neural model of depression (Mayberg 1997)implicates limbic–cortical dysregulation in this disorder,where the function of the rostral anterior cingulate plays acritical role in treatment responsiveness (Mayberg et al1997).
Previous studies in healthy individuals using positronemission tomography (PET) (George et al 1995; Lane et al1997a, 1997b; Paradiso et al 1997; Pardo et al 1993;Partiot et al 1995; Schneider et al 1995) and, morerecently, with functional magnetic resonance imaging(fMRI) (Canli et al 1998; Teasdale et al 1999), haveadvanced our understanding of mood and affective distur-bances in depression. There are, however, limited reportson the neural basis of (abnormal) affect modulation indepressed patients using PET (Mayberg et al 1999) orusing fMRI (Beauregard et al 1998; Sheline et al 2001).Furthermore, previous studies of depression using PET or
From the Section of Cognitive Psychopharmacology (VK, MTM), Department ofPsychology (VK, RGB), Brain Image Analysis Unit (VG, MJB), NeuroimagingResearch Group (AS, SCRW), Department of Psychiatry (SAC), RoyalBethlem Hospital (LP), Institute of Psychiatry, King’s College, London, andCognition and Brain Sciences Unit (JDT), Medical Research Council, Cam-bridge, United Kingdom; Mood Disorders Unit at The Prince of Wales Hospitaland School of Psychiatry at the University of New South Wales (GSM),Sydney, Australia; Clinical Neuroscience Research Centre (TS), Dartford,Kent, United Kingdom.
Address reprint requests to Tonmoy Sharma, M.R.C.Psych., Director, ClinicalNeuroscience Research Centre, 7 Twisleton Court, Priory Hill, Dartford, Kent,DA1 2EN, UK.
Received April 4, 2002; revised September 23, 2002; accepted October 1, 2002.
© 2003 Society of Biological Psychiatry 0006-3223/03/$30.00doi:10.1016/S0002-3223(02)01785-7
fMRI have investigated depressed patients either during aresting state or with exposure to negative mood–inducingmaterials, but not using positive mood induction.
This study set out to examine the neural correlates ofcognitive generation of negative and positive affect usingan established paradigm (Teasdale et al 1999) in patientswith treatment-resistant depression. Previous studies(Izard 1993; Partiot et al 1995) have indicated twodifferent routes for the production of specific affectiveresponses: 1) the route generating affective responses tosimple and perceptual associative aspects of stimuli; and2) the route generating affective responses based on themeaning or the interpretation of stimuli. For the purpose ofthe present study, we employed activation tasks thatemphasized the latter route because of its relevance tocognitive behavior therapy of depression (Beck 1976; Oeiand Sullivan 1999; Thase et al 2000). The primary aimwas to investigate the neural responses to such affect-inducing stimuli in patients with known resistance to drugtreatment and compare them with those of healthy partic-ipants. A secondary aim was to replicate our earlierfindings (Teasdale et al 1999) showing involvement of themedial frontal lobe in cognitive generation of positive andnegative affect in healthy participants.
We hypothesized that depressed patients will showreduced sensitivity to stimuli eliciting positive affect butmay show reduced (if hyporesponsive), or enhanced (byvirtue of anxiety) sensitivity to stimuli eliciting negativeaffect. An alteration in the activation of the medialprefrontal cortex in the depressed group was hypothesized.More specifically, we hypothesized reduced activation ofthis region in the patient group for the task conditionaimed at generating positive affect, but reduced or en-hanced activation (in line with the hypotheses proposedearlier for the behavioral effects) for the task conditionaimed at generating negative affect, relative to the activa-tions seen in healthy participants. We also predicted thatpatients should reveal altered pattern of brain activation inareas implicated in treatment resistance in this population,particularly the rostral anterior cingulate (Mayberg et al1997). We, however, maintained an exploratory approachand conducted post hoc analyses to assess the potentialcontribution of all other regions as well towards affectdisturbances in this sample of patients.
Methods and Materials
ParticipantsSix female patients (age range, 36–52 years) with major depres-sion, diagnosed using the Structured Clinical Interview forDSM-IV (SCID), patient version (First et al 1995) and sixhealthy female control individuals (age range, 32–55 years; allright-handed) participated in this study. Patients were recruited
through the in-patient and out-patient services at the MaudsleyHospital, London. Patients had known resistance to pharmaco-therapy. They had been treated several times with differentclasses of drugs, including serotonin-specific reuptake inhibitors,tricyclics, and monoamine inhibitors, with insufficient treatmentresponse. Three patients had a family history of unipolar depres-sion. Two patients had also undergone multiple sessions ofelectroconvulsive therapy (ECT) and were awaiting psychosur-gery. The remaining patients were offered ECT (one of thisgroup had a father whose depression did not improve with ECT)or psychosurgery. The duration of current episode was more than2 years in all cases. Only female patients with treatment-resistantdepression screened for lack of severe cognitive impairmentwere included. This was to keep the sample as homogenous aspossible within practical constraints and to rule out cognitiveimpairment confounding the results. Control participants werescreened for a history of neurologic or psychiatric disease (withSCID, nonpatient version) and recruited through local advertise-ments. The study was approved by the Ethics Committee of theInstitute of Psychiatry and Maudsley Hospital, London. Allparticipants provided written informed consent after the studyprocedures were explained to them.
Clinical Assessments
All participants were screened for cognitive impairment usingthe Dementia Rating Scale (Mattis 1988) and assessed with theBeck Depression Inventory (Beck et al 1961) and the FawcettClark Pleasure Scale (Fawcett et al 1983). In addition, patientswere assessed with the 21-item Hamilton Depression RatingScale (Hamilton 1960). Table 1 presents demographic andclinical characteristics of all participants.
Experimental Design and Procedure
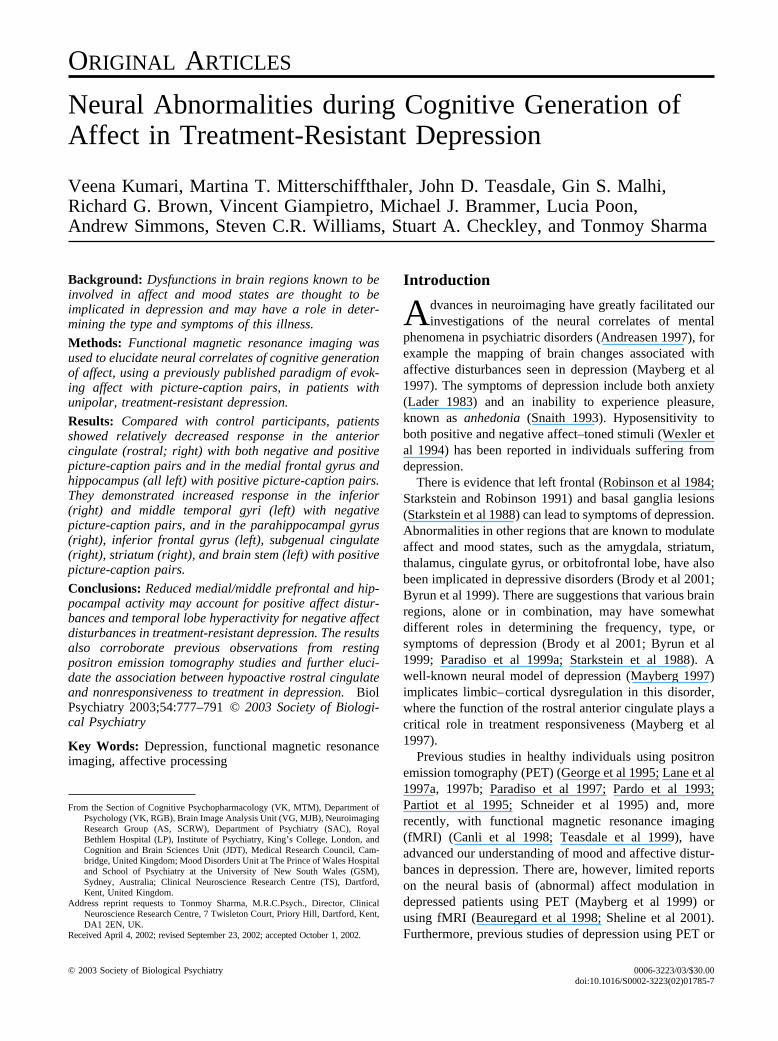
The experimental design and procedure were the same asreported by Teasdale et al (1999). All participants were presentedwith pictures, projected onto a screen at the end of a scanner bed,below each of which was a caption. The caption combined withthe content of the picture to produce positive or negative affect(experimental picture-caption pairs) or was irrelevant and pro-duced little if any emotional response (reference picture-caption
Table 1. Demographic and Clinical Characteristics ofDepressed Patients and Control Participants
Patients Control Subjects
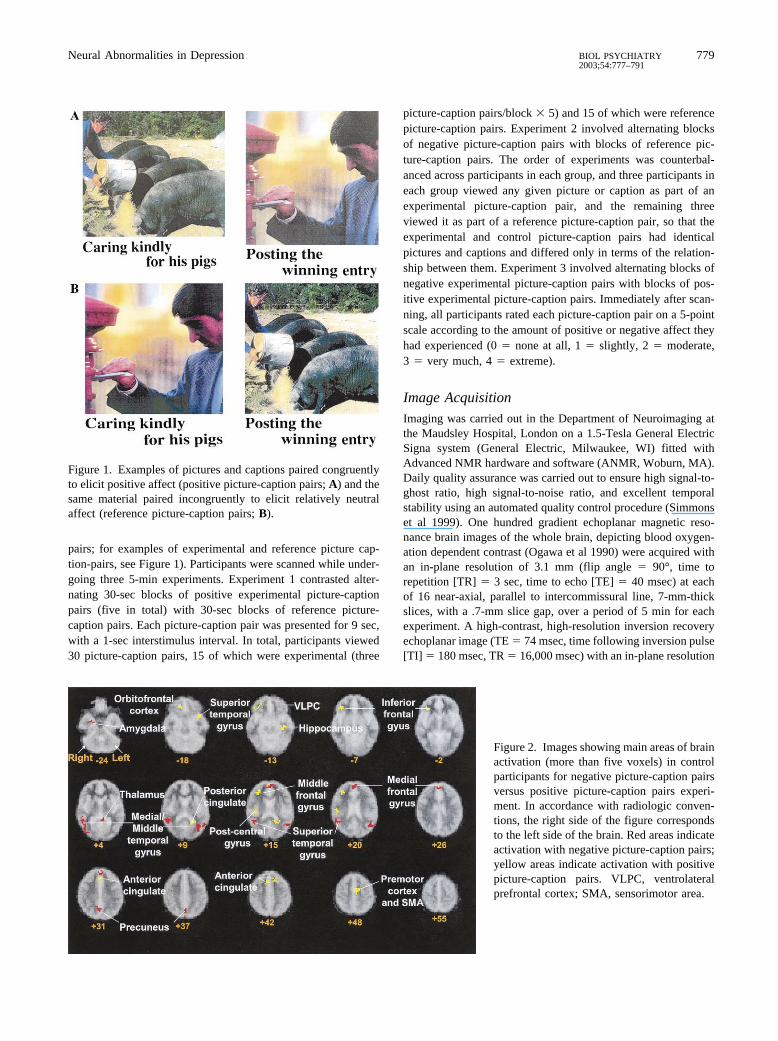
Age (years) 47.00 (3.59) 44.00 (2.44)Dementia Rating 142.17 (2.04) 142.33 (1.97)Pleasure Scorea 2.68 (.55) 4.07 (.50)BDI Score 34.00 (2.45) 5.87 (3.88)HAM-D Score 19.33 (1.03) —
Data are presented as mean (SD). BDI, Beck Depression Inventory; HAM-D,Hamilton Depression Scale.
aPleasure score on the Fawcett Clark Scale.
778 V. Kumari et alBIOL PSYCHIATRY2003;54:777–791
pairs; for examples of experimental and reference picture cap-tion-pairs, see Figure 1). Participants were scanned while under-going three 5-min experiments. Experiment 1 contrasted alter-nating 30-sec blocks of positive experimental picture-captionpairs (five in total) with 30-sec blocks of reference picture-caption pairs. Each picture-caption pair was presented for 9 sec,with a 1-sec interstimulus interval. In total, participants viewed30 picture-caption pairs, 15 of which were experimental (three
picture-caption pairs/block � 5) and 15 of which were referencepicture-caption pairs. Experiment 2 involved alternating blocksof negative picture-caption pairs with blocks of reference pic-ture-caption pairs. The order of experiments was counterbal-anced across participants in each group, and three participants ineach group viewed any given picture or caption as part of anexperimental picture-caption pair, and the remaining threeviewed it as part of a reference picture-caption pair, so that theexperimental and control picture-caption pairs had identicalpictures and captions and differed only in terms of the relation-ship between them. Experiment 3 involved alternating blocks ofnegative experimental picture-caption pairs with blocks of pos-itive experimental picture-caption pairs. Immediately after scan-ning, all participants rated each picture-caption pair on a 5-pointscale according to the amount of positive or negative affect theyhad experienced (0 � none at all, 1 � slightly, 2 � moderate,3 � very much, 4 � extreme).
Image Acquisition
Imaging was carried out in the Department of Neuroimaging atthe Maudsley Hospital, London on a 1.5-Tesla General ElectricSigna system (General Electric, Milwaukee, WI) fitted withAdvanced NMR hardware and software (ANMR, Woburn, MA).Daily quality assurance was carried out to ensure high signal-to-ghost ratio, high signal-to-noise ratio, and excellent temporalstability using an automated quality control procedure (Simmonset al 1999). One hundred gradient echoplanar magnetic reso-nance brain images of the whole brain, depicting blood oxygen-ation dependent contrast (Ogawa et al 1990) were acquired withan in-plane resolution of 3.1 mm (flip angle � 90°, time torepetition [TR] � 3 sec, time to echo [TE] � 40 msec) at eachof 16 near-axial, parallel to intercommissural line, 7-mm-thickslices, with a .7-mm slice gap, over a period of 5 min for eachexperiment. A high-contrast, high-resolution inversion recoveryechoplanar image (TE � 74 msec, time following inversion pulse[TI] � 180 msec, TR � 16,000 msec) with an in-plane resolution
Figure 1. Examples of pictures and captions paired congruentlyto elicit positive affect (positive picture-caption pairs; A) and thesame material paired incongruently to elicit relatively neutralaffect (reference picture-caption pairs; B).
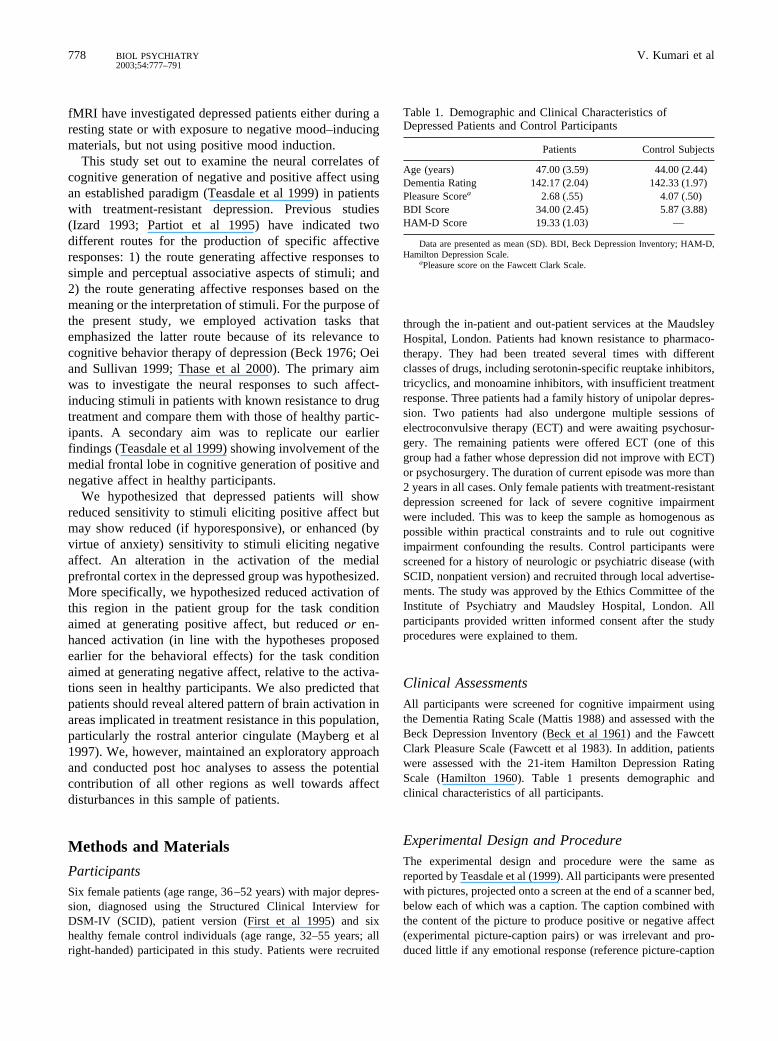
Figure 2. Images showing main areas of brainactivation (more than five voxels) in controlparticipants for negative picture-caption pairsversus positive picture-caption pairs experi-ment. In accordance with radiologic conven-tions, the right side of the figure correspondsto the left side of the brain. Red areas indicateactivation with negative picture-caption pairs;yellow areas indicate activation with positivepicture-caption pairs. VLPC, ventrolateralprefrontal cortex; SMA, sensorimotor area.
Neural Abnormalities in Depression 779BIOL PSYCHIATRY2003;54:777–791
of 1.5 mm and 3-mm slice thickness, .3-mm slice gap, was alsoacquired from each subject.
Data AnalysisAFFECT RATINGS. Affect rating for picture-caption pairs
evoking positive and negative affect (scores for this dimensionentered as negative values, i.e., minus sign, to differentiate themfrom the scores for positive affect) and for reference picture-caption pairs (collapsed across all three experiments) in de-pressed patients and control participants were analyzed by two(Group: patients, comparison participants) � three (Valence:positive picture-caption pair, reference picture-caption pairs,negative picture-caption pairs) analyses of variance, followed byexploration of lower-order interactions and simple main effects.
FUNCTIONAL MRI. The effects of small amounts of subjectmotion during data acquisition were corrected by a two-stageprocess involving realignment and regression (Brammer et al1997). Following correction of each realigned time series on thevector of estimated translations and rotations in three dimensions(Rabe-Hesketh et al 1997), the time series data at each voxelwere fitted to a sinusoidal regression model consisting of sineand cosine terms at the frequency of alternation of the twoexperimental conditions (Bullmore et al 1996; this gave infor-mation about both the amplitude and the phase of responses). Thefitting process consisted of two stages and was designed toensure that significant autocorrelations were removed from theresiduals before estimation of model parameters and their stan-dard errors to avoid underestimation of standard errors and thepossibility of an inflated type I error (Bullmore et al 1996). Thetest statistic computed after this fitting process was the funda-mental power quotient (FPQ)—the power of the response di-vided by its SE. The model fitted was essentially a truncatedFourier series, and the power of the response at a given frequencyrepresented the parameter of interest.
Each observed fMRI time series was randomly permuted 10times, and the FPQ was re-estimated after these permutations.Data randomization is thought to represent an excellent method
of producing a null distribution for statistical testing (Edginton1980). This resulted in 10 parametric maps of FPQ estimatedunder the null hypothesis that the FPQ was not determined by theblock periodic experimental design. The two-stage model (Rabe-Hesketh et al 1997) mentioned above acts to ensure that thepotential problem of residual autocorrections in the observed butnot permuted time series is addressed as confirmed by directexperimentation at both the individual level (Bullmore et al1996) and the group level (Brammer et al 1997). All parametricmaps were then registered in the standard space of Talairach andTournoux (1988) and smoothed by a two-dimensional Gaussianfilter (7.2 mm). Generic brain activation maps identifying intra-cerebral voxels with large median power of activation over allparticipants in each group were constructed by a permutation testprocedure (Brammer et al 1997); voxel-wise one-tailed proba-bility of type 1 error p � .005.
Between-group differences in mean power of response wereestimated (separately for each experiment) at each voxel byfitting a one-way analysis of variance model to generate a map ofthe main effect of group at each voxel. This map was thresholdedto generate a set of spatially contiguous three-dimensionalclusters of suprathreshold voxel statistics, and the sum of eachthree-dimensional cluster was tested against its nonparametri-cally ascertained null distribution (Bullmore et al 1999a); clus-terwise one-tailed p � .005. The general advantages of usingcomputational inference to test null hypotheses about spatialstatistics in brain imaging are rehearsed in Bullmore et al(1999b). Spatial statistics are generally more sensitive andinvolve a smaller number of tests than voxel statistics, but theirtheoretical distributions under the null hypothesis may be overlyconservative.
Results
Affect Ratings
There was a highly significant effect of Valence [F(2,20)� 59.44, p � .0001]. The positive picture-caption pairs
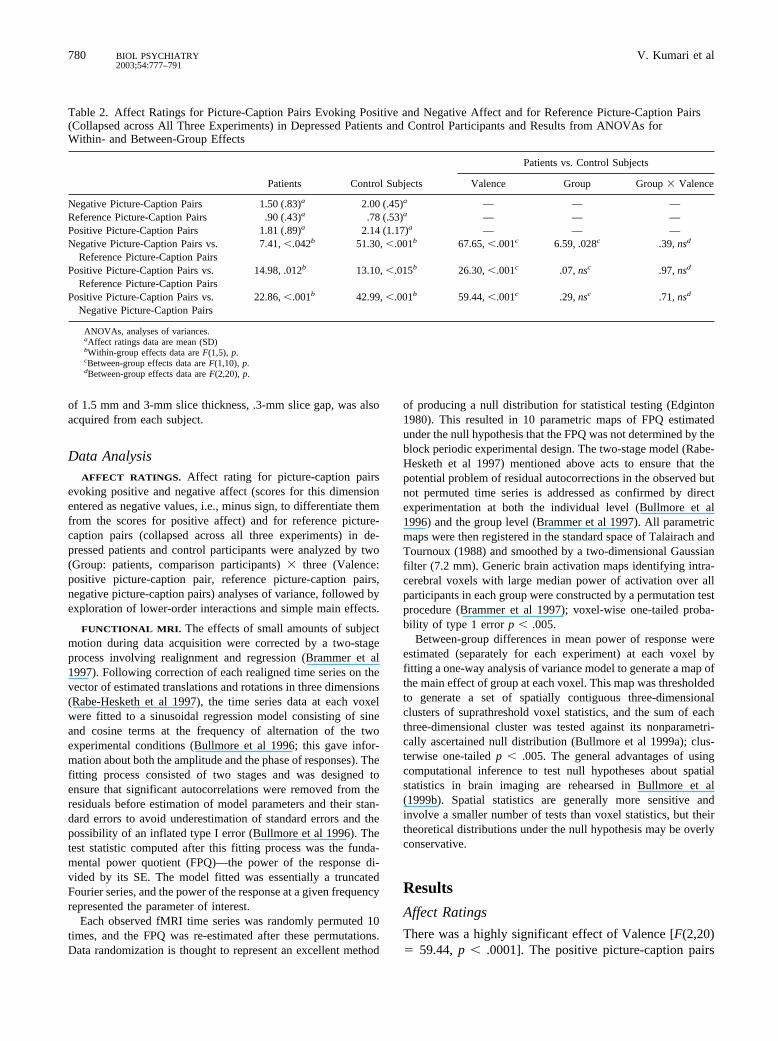
Table 2. Affect Ratings for Picture-Caption Pairs Evoking Positive and Negative Affect and for Reference Picture-Caption Pairs(Collapsed across All Three Experiments) in Depressed Patients and Control Participants and Results from ANOVAs forWithin- and Between-Group Effects
Patients Control Subjects
Patients vs. Control Subjects
Valence Group Group � Valence
Negative Picture-Caption Pairs 1.50 (.83)a 2.00 (.45)a — — —Reference Picture-Caption Pairs .90 (.43)a .78 (.53)a — — —Positive Picture-Caption Pairs 1.81 (.89)a 2.14 (1.17)a — — —Negative Picture-Caption Pairs vs.
Reference Picture-Caption Pairs7.41, �.042b 51.30, �.001b 67.65, �.001c 6.59, .028c .39, nsd
Positive Picture-Caption Pairs vs.Reference Picture-Caption Pairs
14.98, .012b 13.10, �.015b 26.30, �.001c .07, nsc .97, nsd
Positive Picture-Caption Pairs vs.Negative Picture-Caption Pairs
22.86, �.001b 42.99, �.001b 59.44, �.001c .29, nsc .71, nsd
ANOVAs, analyses of variances.aAffect ratings data are mean (SD)bWithin-group effects data are F(1,5), p.cBetween-group effects data are F(1,10), p.dBetween-group effects data are F(2,20), p.
780 V. Kumari et alBIOL PSYCHIATRY2003;54:777–791
evoked positive affect and the negative picture-captionpairs evoked negative affect in both patients and controlsubjects. The affect ratings varied between �2.00 (nega-tive side) to 2.14 (positive side), out of a possible 5, for thecontrol group and between �1.50 to 1.81 for the patientgroup, suggesting that our procedure induced only mildlevels of positive and negative affect in both groups.Patients seemed to show slightly weaker affect modulationthan control subjects, but neither Group nor Group �Valence effect attained statistical significance (Fs � 2);however, post-hoc analyses indicated that patients, ascompared with control subjects, showed lower ratings forboth negative picture-caption pairs and reference picture-caption pairs (see Table 2 for details).
Functional MRI
WITHIN-GROUP EFFECTS. The regions showing signif-icant activation (p � .005) in control participants inresponse to negative and positive picture-caption pairs,relative to reference pairs, are given in Table 3. As can beseen, for the negative picture-caption pairs � referencepicture-caption pairs contrast, the medial and middlefrontal gyri, anterior cingulate, thalamus, cuneus, andcerebellum were the main activated regions; and for the
positive picture-caption pairs � reference picture-captionpairs contrast, medial frontal gyrus, premotor cortex, andcerebellum were the main activated regions in this group.
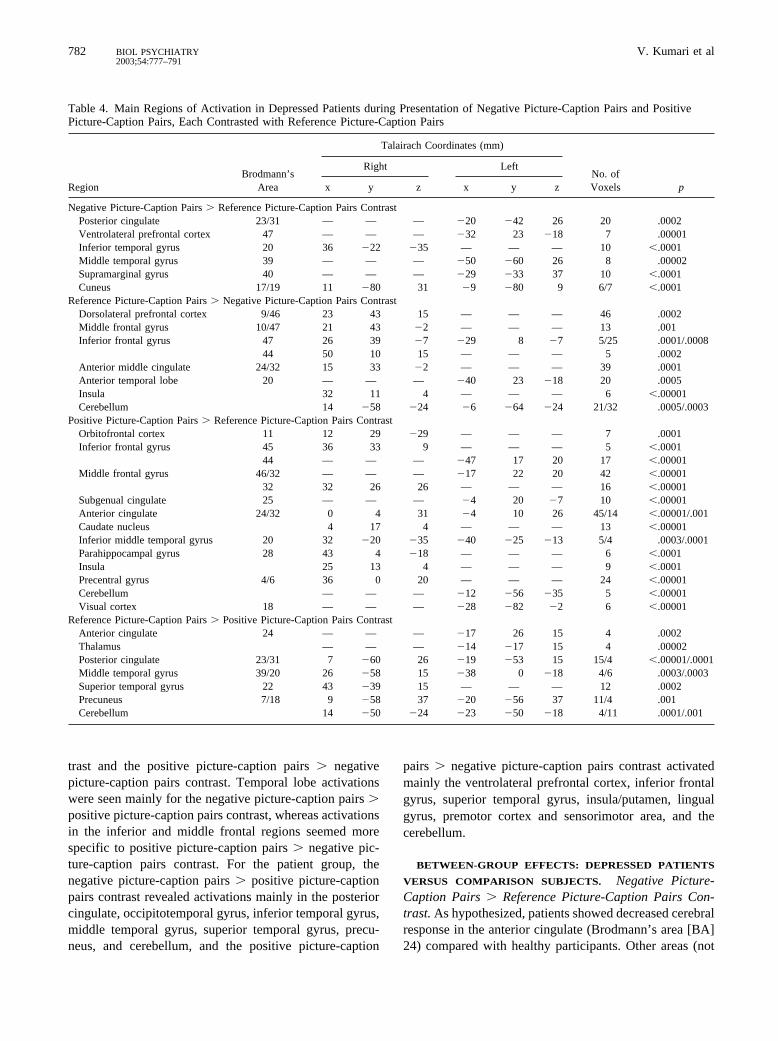
The regions showing significant activation in depressedparticipants in response to negative and positive picture-caption pairs, relative to reference pairs, are given in Table4. This group showed activation mainly in the posteriorcingulate, inferior and middle temporal gyri, and cuneusfor the negative picture-caption pairs � reference picture-caption pairs contrast; and it showed activation in theorbitofrontal cortex, inferior frontal gyrus, middle frontalgyrus, subgenual cingulate, caudate nucleus, insula, inferiortemporal gyrus, parahippocampal gyrus, precentral gyrus,cerebellum, and the visual cortex for the positive picture-caption pairs � reference picture-caption pairs contrast.
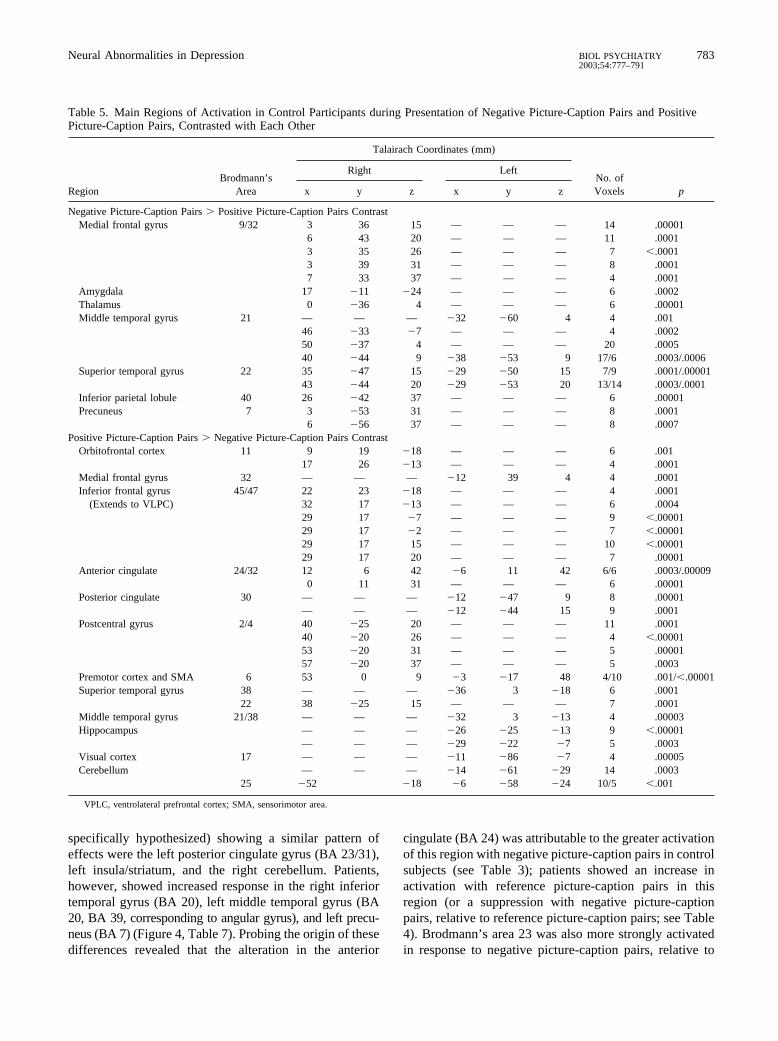
The area significantly activated with negative and pos-itive picture-caption pairs, relative to each other, forcontrol participants are shown in Table 5 and Figure 2(activations with more than five voxels), and for depressedpatients in Table 6 and Figure 3 (activations with morethan five voxels). As shown in Table 5 and Figure 2,control subjects showed very closely located activationswithin the medial frontal gyrus for both the negativepicture-caption pairs � positive picture-caption pairs con-
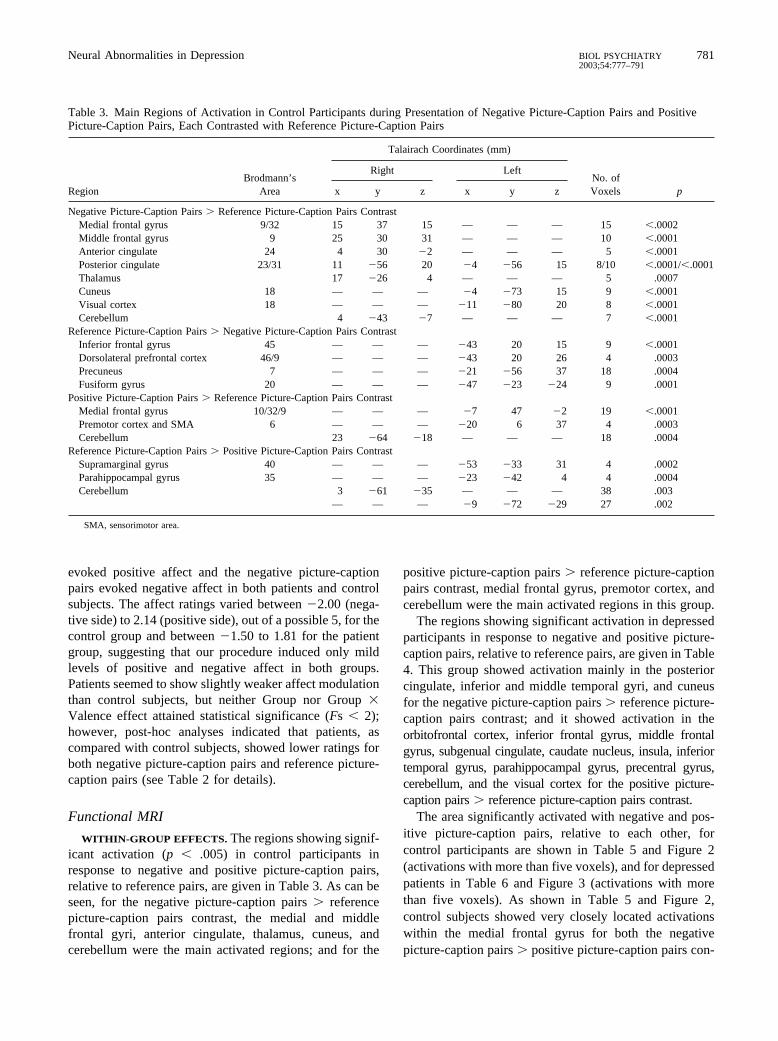
Table 3. Main Regions of Activation in Control Participants during Presentation of Negative Picture-Caption Pairs and PositivePicture-Caption Pairs, Each Contrasted with Reference Picture-Caption Pairs
RegionBrodmann’s
Area
Talairach Coordinates (mm)
No. ofVoxels p
Right Left
x y z x y z
Negative Picture-Caption Pairs � Reference Picture-Caption Pairs ContrastMedial frontal gyrus 9/32 15 37 15 — — — 15 �.0002Middle frontal gyrus 9 25 30 31 — — — 10 �.0001Anterior cingulate 24 4 30 �2 — — — 5 �.0001Posterior cingulate 23/31 11 �56 20 �4 �56 15 8/10 �.0001/�.0001Thalamus 17 �26 4 — — — 5 .0007Cuneus 18 — — — �4 �73 15 9 �.0001Visual cortex 18 — — — �11 �80 20 8 �.0001Cerebellum 4 �43 �7 — — — 7 �.0001
Reference Picture-Caption Pairs � Negative Picture-Caption Pairs ContrastInferior frontal gyrus 45 — — — �43 20 15 9 �.0001Dorsolateral prefrontal cortex 46/9 — — — �43 20 26 4 .0003Precuneus 7 — — — �21 �56 37 18 .0004Fusiform gyrus 20 — — — �47 �23 �24 9 .0001
Positive Picture-Caption Pairs � Reference Picture-Caption Pairs ContrastMedial frontal gyrus 10/32/9 — — — �7 47 �2 19 �.0001Premotor cortex and SMA 6 — — — �20 6 37 4 .0003Cerebellum 23 �64 �18 — — — 18 .0004
Reference Picture-Caption Pairs � Positive Picture-Caption Pairs ContrastSupramarginal gyrus 40 — — — �53 �33 31 4 .0002Parahippocampal gyrus 35 — — — �23 �42 4 4 .0004Cerebellum 3 �61 �35 — — — 38 .003
— — — �9 �72 �29 27 .002
SMA, sensorimotor area.
Neural Abnormalities in Depression 781BIOL PSYCHIATRY2003;54:777–791
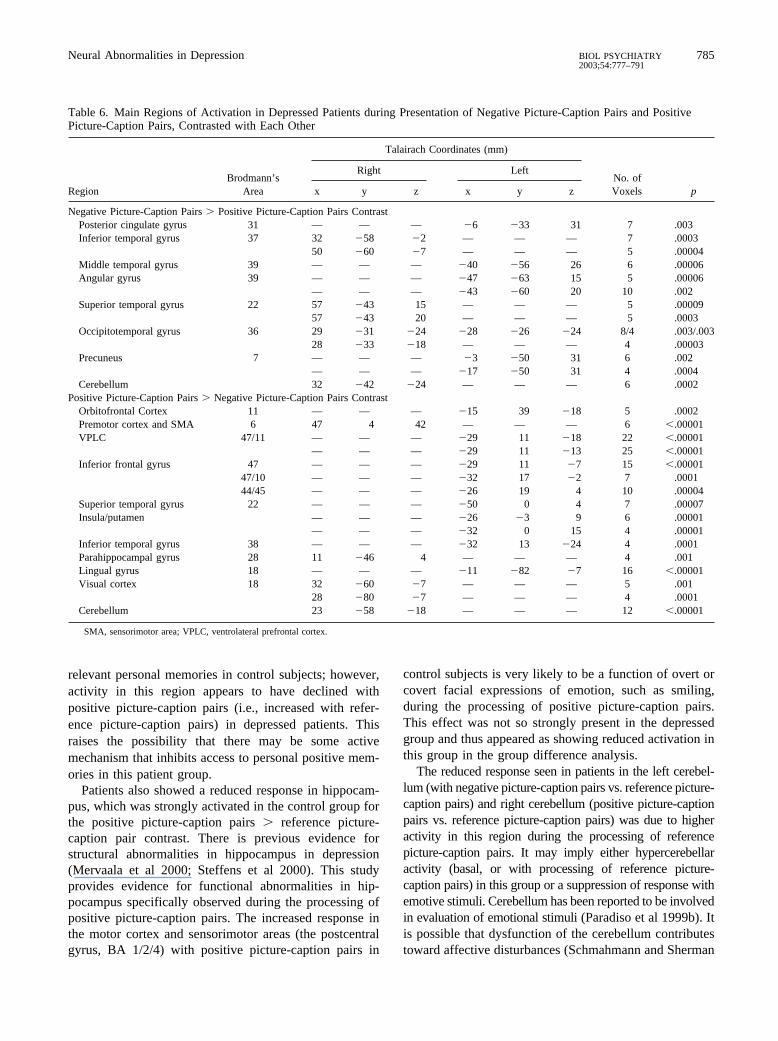
trast and the positive picture-caption pairs � negativepicture-caption pairs contrast. Temporal lobe activationswere seen mainly for the negative picture-caption pairs �positive picture-caption pairs contrast, whereas activationsin the inferior and middle frontal regions seemed morespecific to positive picture-caption pairs � negative pic-ture-caption pairs contrast. For the patient group, thenegative picture-caption pairs � positive picture-captionpairs contrast revealed activations mainly in the posteriorcingulate, occipitotemporal gyrus, inferior temporal gyrus,middle temporal gyrus, superior temporal gyrus, precu-neus, and cerebellum, and the positive picture-caption
pairs � negative picture-caption pairs contrast activatedmainly the ventrolateral prefrontal cortex, inferior frontalgyrus, superior temporal gyrus, insula/putamen, lingualgyrus, premotor cortex and sensorimotor area, and thecerebellum.
BETWEEN-GROUP EFFECTS: DEPRESSED PATIENTS
VERSUS COMPARISON SUBJECTS. Negative Picture-Caption Pairs � Reference Picture-Caption Pairs Con-trast. As hypothesized, patients showed decreased cerebralresponse in the anterior cingulate (Brodmann’s area [BA]24) compared with healthy participants. Other areas (not
Table 4. Main Regions of Activation in Depressed Patients during Presentation of Negative Picture-Caption Pairs and PositivePicture-Caption Pairs, Each Contrasted with Reference Picture-Caption Pairs
RegionBrodmann’s
Area
Talairach Coordinates (mm)
No. ofVoxels p
Right Left
x y z x y z
Negative Picture-Caption Pairs � Reference Picture-Caption Pairs ContrastPosterior cingulate 23/31 — — — �20 �42 26 20 .0002Ventrolateral prefrontal cortex 47 — — — �32 23 �18 7 .00001Inferior temporal gyrus 20 36 �22 �35 — — — 10 �.0001Middle temporal gyrus 39 — — — �50 �60 26 8 .00002Supramarginal gyrus 40 — — — �29 �33 37 10 �.0001Cuneus 17/19 11 �80 31 �9 �80 9 6/7 �.0001
Reference Picture-Caption Pairs � Negative Picture-Caption Pairs ContrastDorsolateral prefrontal cortex 9/46 23 43 15 — — — 46 .0002Middle frontal gyrus 10/47 21 43 �2 — — — 13 .001Inferior frontal gyrus 47 26 39 �7 �29 8 �7 5/25 .0001/.0008
44 50 10 15 — — — 5 .0002Anterior middle cingulate 24/32 15 33 �2 — — — 39 .0001Anterior temporal lobe 20 — — — �40 23 �18 20 .0005Insula 32 11 4 — — — 6 �.00001Cerebellum 14 �58 �24 �6 �64 �24 21/32 .0005/.0003
Positive Picture-Caption Pairs � Reference Picture-Caption Pairs ContrastOrbitofrontal cortex 11 12 29 �29 — — — 7 .0001Inferior frontal gyrus 45 36 33 9 — — — 5 �.0001
44 — — — �47 17 20 17 �.00001Middle frontal gyrus 46/32 — — — �17 22 20 42 �.00001
32 32 26 26 — — — 16 �.00001Subgenual cingulate 25 — — — �4 20 �7 10 �.00001Anterior cingulate 24/32 0 4 31 �4 10 26 45/14 �.00001/.001Caudate nucleus 4 17 4 — — — 13 �.00001Inferior middle temporal gyrus 20 32 �20 �35 �40 �25 �13 5/4 .0003/.0001Parahippocampal gyrus 28 43 4 �18 — — — 6 �.0001Insula 25 13 4 — — — 9 �.0001Precentral gyrus 4/6 36 0 20 — — — 24 �.00001Cerebellum — — — �12 �56 �35 5 �.00001Visual cortex 18 — — — �28 �82 �2 6 �.00001
Reference Picture-Caption Pairs � Positive Picture-Caption Pairs ContrastAnterior cingulate 24 — — — �17 26 15 4 .0002Thalamus — — — �14 �17 15 4 .00002Posterior cingulate 23/31 7 �60 26 �19 �53 15 15/4 �.00001/.0001Middle temporal gyrus 39/20 26 �58 15 �38 0 �18 4/6 .0003/.0003Superior temporal gyrus 22 43 �39 15 — — — 12 .0002Precuneus 7/18 9 �58 37 �20 �56 37 11/4 .001Cerebellum 14 �50 �24 �23 �50 �18 4/11 .0001/.001
782 V. Kumari et alBIOL PSYCHIATRY2003;54:777–791
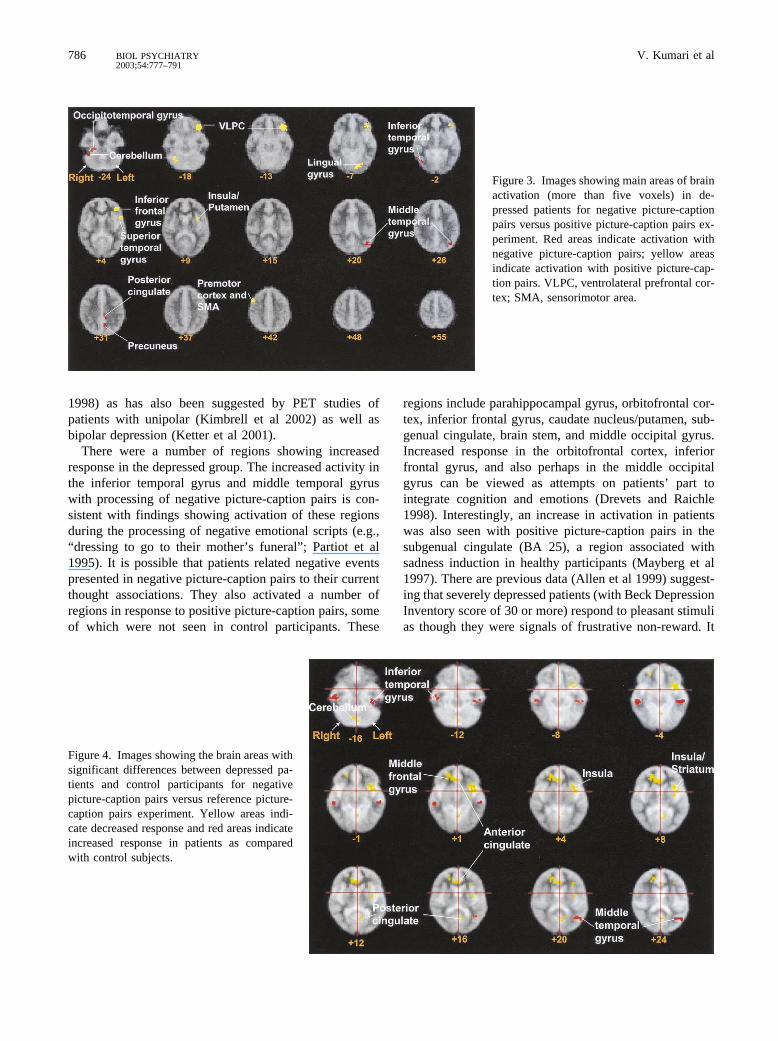
specifically hypothesized) showing a similar pattern ofeffects were the left posterior cingulate gyrus (BA 23/31),left insula/striatum, and the right cerebellum. Patients,however, showed increased response in the right inferiortemporal gyrus (BA 20), left middle temporal gyrus (BA20, BA 39, corresponding to angular gyrus), and left precu-neus (BA 7) (Figure 4, Table 7). Probing the origin of thesedifferences revealed that the alteration in the anterior
cingulate (BA 24) was attributable to the greater activationof this region with negative picture-caption pairs in controlsubjects (see Table 3); patients showed an increase inactivation with reference picture-caption pairs in thisregion (or a suppression with negative picture-captionpairs, relative to reference picture-caption pairs; see Table4). Brodmann’s area 23 was also more strongly activatedin response to negative picture-caption pairs, relative to
Table 5. Main Regions of Activation in Control Participants during Presentation of Negative Picture-Caption Pairs and PositivePicture-Caption Pairs, Contrasted with Each Other
RegionBrodmann’s
Area
Talairach Coordinates (mm)
No. ofVoxels p
Right Left
x y z x y z
Negative Picture-Caption Pairs � Positive Picture-Caption Pairs ContrastMedial frontal gyrus 9/32 3 36 15 — — — 14 .00001
6 43 20 — — — 11 .00013 35 26 — — — 7 �.00013 39 31 — — — 8 .00017 33 37 — — — 4 .0001
Amygdala 17 �11 �24 — — — 6 .0002Thalamus 0 �36 4 — — — 6 .00001Middle temporal gyrus 21 — — — �32 �60 4 4 .001
46 �33 �7 — — — 4 .000250 �37 4 — — — 20 .000540 �44 9 �38 �53 9 17/6 .0003/.0006
Superior temporal gyrus 22 35 �47 15 �29 �50 15 7/9 .0001/.0000143 �44 20 �29 �53 20 13/14 .0003/.0001
Inferior parietal lobule 40 26 �42 37 — — — 6 .00001Precuneus 7 3 �53 31 — — — 8 .0001
6 �56 37 — — — 8 .0007Positive Picture-Caption Pairs � Negative Picture-Caption Pairs Contrast
Orbitofrontal cortex 11 9 19 �18 — — — 6 .00117 26 �13 — — — 4 .0001
Medial frontal gyrus 32 — — — �12 39 4 4 .0001Inferior frontal gyrus 45/47 22 23 �18 — — — 4 .0001
(Extends to VLPC) 32 17 �13 — — — 6 .000429 17 �7 — — — 9 �.0000129 17 �2 — — — 7 �.0000129 17 15 — — — 10 �.0000129 17 20 — — — 7 .00001
Anterior cingulate 24/32 12 6 42 �6 11 42 6/6 .0003/.000090 11 31 — — — 6 .00001
Posterior cingulate 30 — — — �12 �47 9 8 .00001— — — �12 �44 15 9 .0001
Postcentral gyrus 2/4 40 �25 20 — — — 11 .000140 �20 26 — — — 4 �.0000153 �20 31 — — — 5 .0000157 �20 37 — — — 5 .0003
Premotor cortex and SMA 6 53 0 9 �3 �17 48 4/10 .001/�.00001Superior temporal gyrus 38 — — — �36 3 �18 6 .0001
22 38 �25 15 — — — 7 .0001Middle temporal gyrus 21/38 — — — �32 3 �13 4 .00003Hippocampus — — — �26 �25 �13 9 �.00001
— — — �29 �22 �7 5 .0003Visual cortex 17 — — — �11 �86 �7 4 .00005Cerebellum — — — �14 �61 �29 14 .0003
25 �52 �18 �6 �58 �24 10/5 �.001
VPLC, ventrolateral prefrontal cortex; SMA, sensorimotor area.
Neural Abnormalities in Depression 783BIOL PSYCHIATRY2003;54:777–791
reference picture-caption pairs, in control participants thanin depressed patients. The alteration in the right cerebel-lum in depressed patients was due to increased activity inthis region with reference picture-caption pairs, relative tonegative picture-caption pairs (see Table 4; no suchactivity was seen in control subjects, see Table 3). Asimilar pattern was seen for left insula/striatum (i.e.,higher activity during the reference picture-caption pairs,relative to negative picture-caption pairs).
The inferior temporal gyrus and middle temporal gyruswere activated in association with negative picture-captionpairs (relative to reference picture-caption pairs) only inthe depressed group (Table 4). Precuneus was activeduring the processing of reference picture-caption pairs inthe control group (Table 3), and thus appeared as a regionwith greater response in depressed patients in the groupdifference analysis of the negative picture-caption pairs �reference picture-caption pairs contrasts; see Table 7).
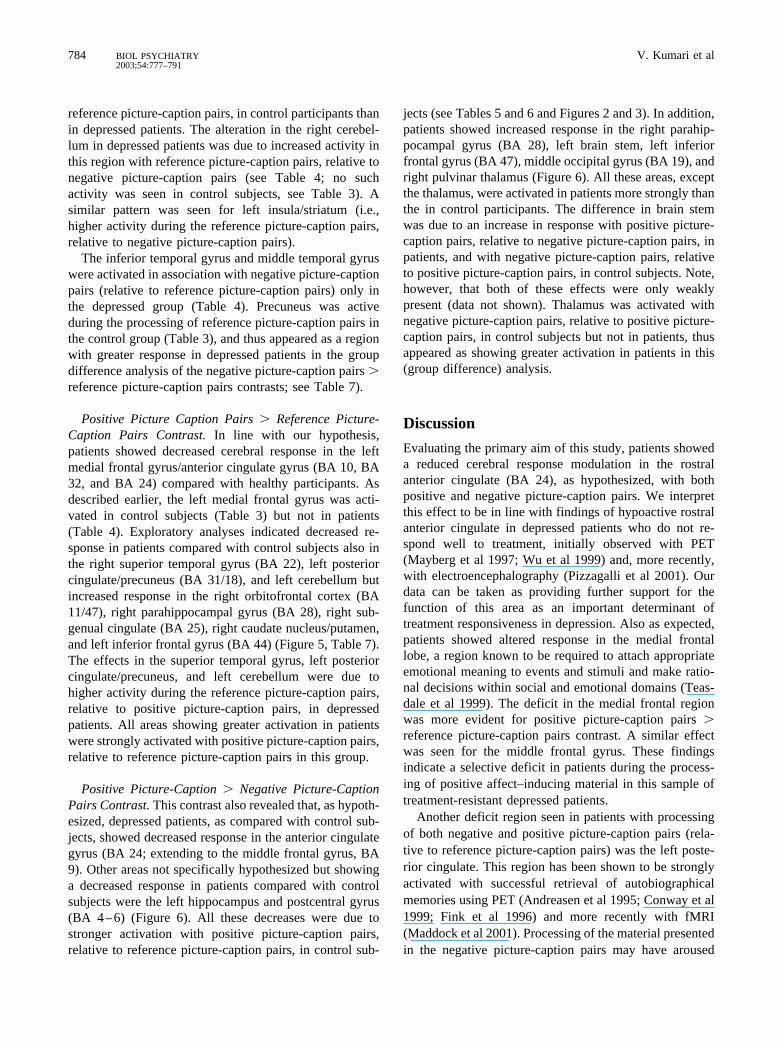
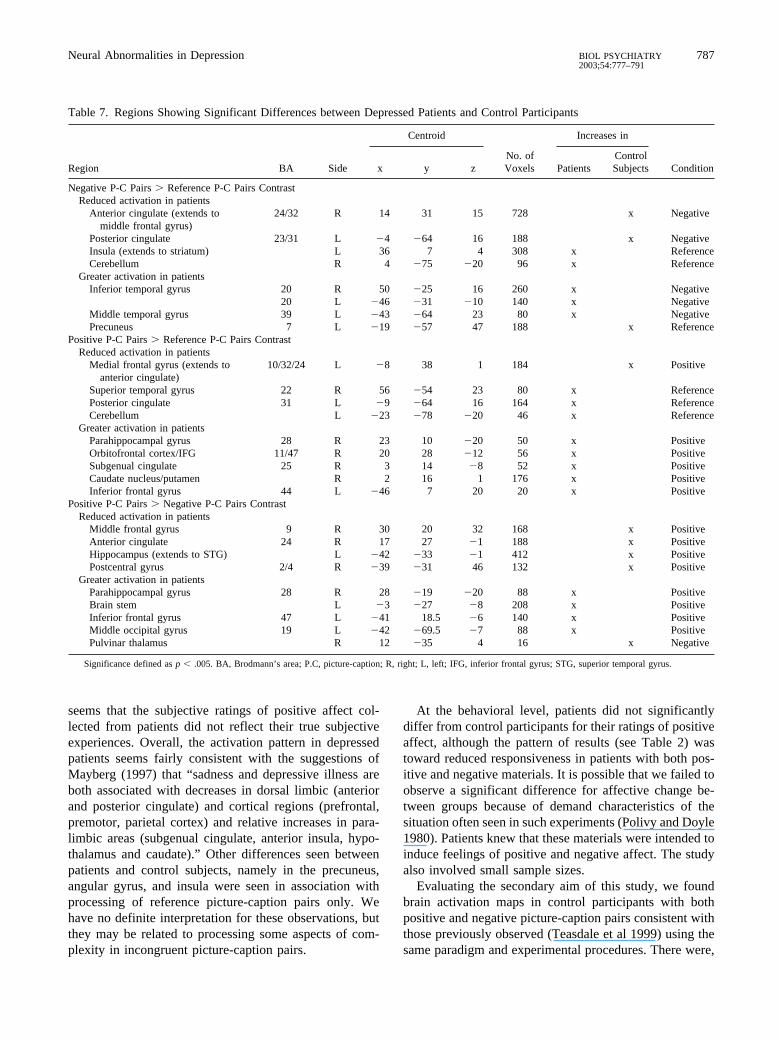
Positive Picture Caption Pairs � Reference Picture-Caption Pairs Contrast. In line with our hypothesis,patients showed decreased cerebral response in the leftmedial frontal gyrus/anterior cingulate gyrus (BA 10, BA32, and BA 24) compared with healthy participants. Asdescribed earlier, the left medial frontal gyrus was acti-vated in control subjects (Table 3) but not in patients(Table 4). Exploratory analyses indicated decreased re-sponse in patients compared with control subjects also inthe right superior temporal gyrus (BA 22), left posteriorcingulate/precuneus (BA 31/18), and left cerebellum butincreased response in the right orbitofrontal cortex (BA11/47), right parahippocampal gyrus (BA 28), right sub-genual cingulate (BA 25), right caudate nucleus/putamen,and left inferior frontal gyrus (BA 44) (Figure 5, Table 7).The effects in the superior temporal gyrus, left posteriorcingulate/precuneus, and left cerebellum were due tohigher activity during the reference picture-caption pairs,relative to positive picture-caption pairs, in depressedpatients. All areas showing greater activation in patientswere strongly activated with positive picture-caption pairs,relative to reference picture-caption pairs in this group.
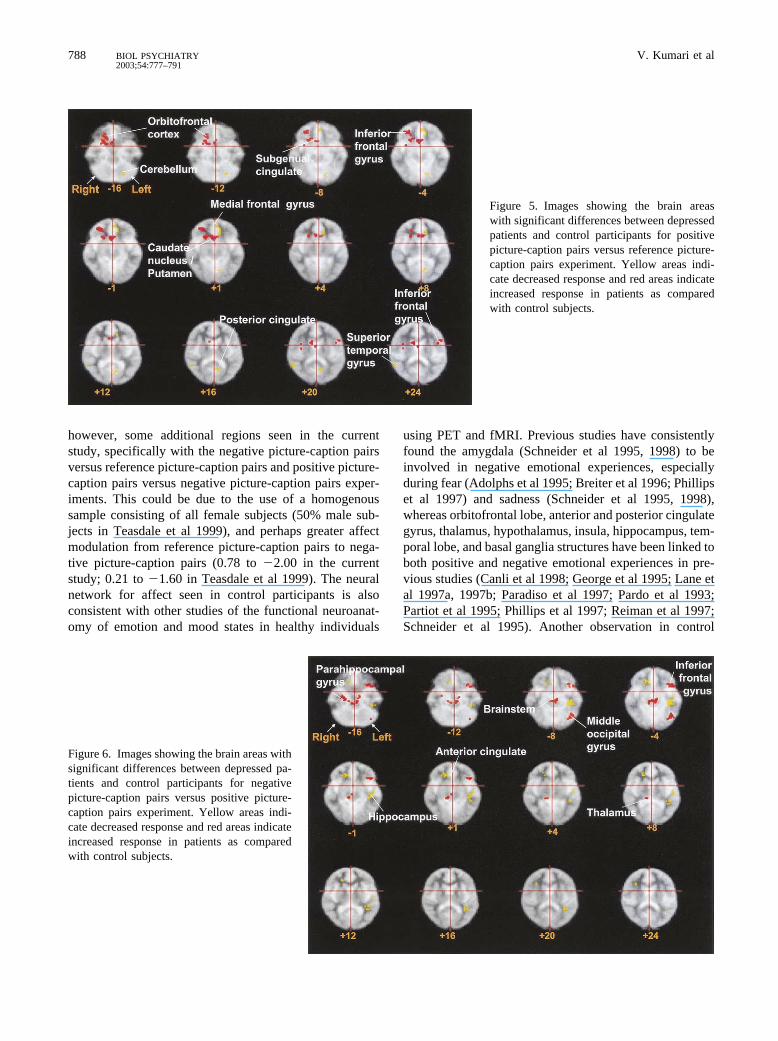
Positive Picture-Caption � Negative Picture-CaptionPairs Contrast. This contrast also revealed that, as hypoth-esized, depressed patients, as compared with control sub-jects, showed decreased response in the anterior cingulategyrus (BA 24; extending to the middle frontal gyrus, BA9). Other areas not specifically hypothesized but showinga decreased response in patients compared with controlsubjects were the left hippocampus and postcentral gyrus(BA 4–6) (Figure 6). All these decreases were due tostronger activation with positive picture-caption pairs,relative to reference picture-caption pairs, in control sub-
jects (see Tables 5 and 6 and Figures 2 and 3). In addition,patients showed increased response in the right parahip-pocampal gyrus (BA 28), left brain stem, left inferiorfrontal gyrus (BA 47), middle occipital gyrus (BA 19), andright pulvinar thalamus (Figure 6). All these areas, exceptthe thalamus, were activated in patients more strongly thanthe in control participants. The difference in brain stemwas due to an increase in response with positive picture-caption pairs, relative to negative picture-caption pairs, inpatients, and with negative picture-caption pairs, relativeto positive picture-caption pairs, in control subjects. Note,however, that both of these effects were only weaklypresent (data not shown). Thalamus was activated withnegative picture-caption pairs, relative to positive picture-caption pairs, in control subjects but not in patients, thusappeared as showing greater activation in patients in this(group difference) analysis.
Discussion
Evaluating the primary aim of this study, patients showeda reduced cerebral response modulation in the rostralanterior cingulate (BA 24), as hypothesized, with bothpositive and negative picture-caption pairs. We interpretthis effect to be in line with findings of hypoactive rostralanterior cingulate in depressed patients who do not re-spond well to treatment, initially observed with PET(Mayberg et al 1997; Wu et al 1999) and, more recently,with electroencephalography (Pizzagalli et al 2001). Ourdata can be taken as providing further support for thefunction of this area as an important determinant oftreatment responsiveness in depression. Also as expected,patients showed altered response in the medial frontallobe, a region known to be required to attach appropriateemotional meaning to events and stimuli and make ratio-nal decisions within social and emotional domains (Teas-dale et al 1999). The deficit in the medial frontal regionwas more evident for positive picture-caption pairs �reference picture-caption pairs contrast. A similar effectwas seen for the middle frontal gyrus. These findingsindicate a selective deficit in patients during the process-ing of positive affect–inducing material in this sample oftreatment-resistant depressed patients.
Another deficit region seen in patients with processingof both negative and positive picture-caption pairs (rela-tive to reference picture-caption pairs) was the left poste-rior cingulate. This region has been shown to be stronglyactivated with successful retrieval of autobiographicalmemories using PET (Andreasen et al 1995; Conway et al1999; Fink et al 1996) and more recently with fMRI(Maddock et al 2001). Processing of the material presentedin the negative picture-caption pairs may have aroused
784 V. Kumari et alBIOL PSYCHIATRY2003;54:777–791
relevant personal memories in control subjects; however,activity in this region appears to have declined withpositive picture-caption pairs (i.e., increased with refer-ence picture-caption pairs) in depressed patients. Thisraises the possibility that there may be some activemechanism that inhibits access to personal positive mem-ories in this patient group.
Patients also showed a reduced response in hippocam-pus, which was strongly activated in the control group forthe positive picture-caption pairs � reference picture-caption pair contrast. There is previous evidence forstructural abnormalities in hippocampus in depression(Mervaala et al 2000; Steffens et al 2000). This studyprovides evidence for functional abnormalities in hip-pocampus specifically observed during the processing ofpositive picture-caption pairs. The increased response inthe motor cortex and sensorimotor areas (the postcentralgyrus, BA 1/2/4) with positive picture-caption pairs in
control subjects is very likely to be a function of overt orcovert facial expressions of emotion, such as smiling,during the processing of positive picture-caption pairs.This effect was not so strongly present in the depressedgroup and thus appeared as showing reduced activation inthis group in the group difference analysis.
The reduced response seen in patients in the left cerebel-lum (with negative picture-caption pairs vs. reference picture-caption pairs) and right cerebellum (positive picture-captionpairs vs. reference picture-caption pairs) was due to higheractivity in this region during the processing of referencepicture-caption pairs. It may imply either hypercerebellaractivity (basal, or with processing of reference picture-caption pairs) in this group or a suppression of response withemotive stimuli. Cerebellum has been reported to be involvedin evaluation of emotional stimuli (Paradiso et al 1999b). Itis possible that dysfunction of the cerebellum contributestoward affective disturbances (Schmahmann and Sherman
Table 6. Main Regions of Activation in Depressed Patients during Presentation of Negative Picture-Caption Pairs and PositivePicture-Caption Pairs, Contrasted with Each Other
RegionBrodmann’s
Area
Talairach Coordinates (mm)
No. ofVoxels p
Right Left
x y z x y z
Negative Picture-Caption Pairs � Positive Picture-Caption Pairs ContrastPosterior cingulate gyrus 31 — — — �6 �33 31 7 .003Inferior temporal gyrus 37 32 �58 �2 — — — 7 .0003
50 �60 �7 — — — 5 .00004Middle temporal gyrus 39 — — — �40 �56 26 6 .00006Angular gyrus 39 — — — �47 �63 15 5 .00006
— — — �43 �60 20 10 .002Superior temporal gyrus 22 57 �43 15 — — — 5 .00009
57 �43 20 — — — 5 .0003Occipitotemporal gyrus 36 29 �31 �24 �28 �26 �24 8/4 .003/.003
28 �33 �18 — — — 4 .00003Precuneus 7 — — — �3 �50 31 6 .002
— — — �17 �50 31 4 .0004Cerebellum 32 �42 �24 — — — 6 .0002
Positive Picture-Caption Pairs � Negative Picture-Caption Pairs ContrastOrbitofrontal Cortex 11 — — — �15 39 �18 5 .0002Premotor cortex and SMA 6 47 4 42 — — — 6 �.00001VPLC 47/11 — — — �29 11 �18 22 �.00001
— — — �29 11 �13 25 �.00001Inferior frontal gyrus 47 — — — �29 11 �7 15 �.00001
47/10 — — — �32 17 �2 7 .000144/45 — — — �26 19 4 10 .00004
Superior temporal gyrus 22 — — — �50 0 4 7 .00007Insula/putamen — — — �26 �3 9 6 .00001
— — — �32 0 15 4 .00001Inferior temporal gyrus 38 — — — �32 13 �24 4 .0001Parahippocampal gyrus 28 11 �46 4 — — — 4 .001Lingual gyrus 18 — — — �11 �82 �7 16 �.00001Visual cortex 18 32 �60 �7 — — — 5 .001
28 �80 �7 — — — 4 .0001Cerebellum 23 �58 �18 — — — 12 �.00001
SMA, sensorimotor area; VPLC, ventrolateral prefrontal cortex.
Neural Abnormalities in Depression 785BIOL PSYCHIATRY2003;54:777–791
1998) as has also been suggested by PET studies ofpatients with unipolar (Kimbrell et al 2002) as well asbipolar depression (Ketter et al 2001).
There were a number of regions showing increasedresponse in the depressed group. The increased activity inthe inferior temporal gyrus and middle temporal gyruswith processing of negative picture-caption pairs is con-sistent with findings showing activation of these regionsduring the processing of negative emotional scripts (e.g.,“dressing to go to their mother’s funeral”; Partiot et al1995). It is possible that patients related negative eventspresented in negative picture-caption pairs to their currentthought associations. They also activated a number ofregions in response to positive picture-caption pairs, someof which were not seen in control participants. These
regions include parahippocampal gyrus, orbitofrontal cor-tex, inferior frontal gyrus, caudate nucleus/putamen, sub-genual cingulate, brain stem, and middle occipital gyrus.Increased response in the orbitofrontal cortex, inferiorfrontal gyrus, and also perhaps in the middle occipitalgyrus can be viewed as attempts on patients’ part tointegrate cognition and emotions (Drevets and Raichle1998). Interestingly, an increase in activation in patientswas also seen with positive picture-caption pairs in thesubgenual cingulate (BA 25), a region associated withsadness induction in healthy participants (Mayberg et al1997). There are previous data (Allen et al 1999) suggest-ing that severely depressed patients (with Beck DepressionInventory score of 30 or more) respond to pleasant stimulias though they were signals of frustrative non-reward. It
Figure 3. Images showing main areas of brainactivation (more than five voxels) in de-pressed patients for negative picture-captionpairs versus positive picture-caption pairs ex-periment. Red areas indicate activation withnegative picture-caption pairs; yellow areasindicate activation with positive picture-cap-tion pairs. VLPC, ventrolateral prefrontal cor-tex; SMA, sensorimotor area.
Figure 4. Images showing the brain areas withsignificant differences between depressed pa-tients and control participants for negativepicture-caption pairs versus reference picture-caption pairs experiment. Yellow areas indi-cate decreased response and red areas indicateincreased response in patients as comparedwith control subjects.
786 V. Kumari et alBIOL PSYCHIATRY2003;54:777–791
seems that the subjective ratings of positive affect col-lected from patients did not reflect their true subjectiveexperiences. Overall, the activation pattern in depressedpatients seems fairly consistent with the suggestions ofMayberg (1997) that “sadness and depressive illness areboth associated with decreases in dorsal limbic (anteriorand posterior cingulate) and cortical regions (prefrontal,premotor, parietal cortex) and relative increases in para-limbic areas (subgenual cingulate, anterior insula, hypo-thalamus and caudate).” Other differences seen betweenpatients and control subjects, namely in the precuneus,angular gyrus, and insula were seen in association withprocessing of reference picture-caption pairs only. Wehave no definite interpretation for these observations, butthey may be related to processing some aspects of com-plexity in incongruent picture-caption pairs.
At the behavioral level, patients did not significantlydiffer from control participants for their ratings of positiveaffect, although the pattern of results (see Table 2) wastoward reduced responsiveness in patients with both pos-itive and negative materials. It is possible that we failed toobserve a significant difference for affective change be-tween groups because of demand characteristics of thesituation often seen in such experiments (Polivy and Doyle1980). Patients knew that these materials were intended toinduce feelings of positive and negative affect. The studyalso involved small sample sizes.
Evaluating the secondary aim of this study, we foundbrain activation maps in control participants with bothpositive and negative picture-caption pairs consistent withthose previously observed (Teasdale et al 1999) using thesame paradigm and experimental procedures. There were,
Table 7. Regions Showing Significant Differences between Depressed Patients and Control Participants
Region BA Side
Centroid
No. ofVoxels
Increases in
Conditionx y z PatientsControlSubjects
Negative P-C Pairs � Reference P-C Pairs ContrastReduced activation in patients
Anterior cingulate (extends tomiddle frontal gyrus)
24/32 R 14 31 15 728 x Negative
Posterior cingulate 23/31 L �4 �64 16 188 x NegativeInsula (extends to striatum) L 36 7 4 308 x ReferenceCerebellum R 4 �75 �20 96 x Reference
Greater activation in patientsInferior temporal gyrus 20 R 50 �25 16 260 x Negative
20 L �46 �31 �10 140 x NegativeMiddle temporal gyrus 39 L �43 �64 23 80 x NegativePrecuneus 7 L �19 �57 47 188 x Reference
Positive P-C Pairs � Reference P-C Pairs ContrastReduced activation in patients
Medial frontal gyrus (extends toanterior cingulate)
10/32/24 L �8 38 1 184 x Positive
Superior temporal gyrus 22 R 56 �54 23 80 x ReferencePosterior cingulate 31 L �9 �64 16 164 x ReferenceCerebellum L �23 �78 �20 46 x Reference
Greater activation in patientsParahippocampal gyrus 28 R 23 10 �20 50 x PositiveOrbitofrontal cortex/IFG 11/47 R 20 28 �12 56 x PositiveSubgenual cingulate 25 R 3 14 �8 52 x PositiveCaudate nucleus/putamen R 2 16 1 176 x PositiveInferior frontal gyrus 44 L �46 7 20 20 x Positive
Positive P-C Pairs � Negative P-C Pairs ContrastReduced activation in patients
Middle frontal gyrus 9 R 30 20 32 168 x PositiveAnterior cingulate 24 R 17 27 �1 188 x PositiveHippocampus (extends to STG) L �42 �33 �1 412 x PositivePostcentral gyrus 2/4 R �39 �31 46 132 x Positive
Greater activation in patientsParahippocampal gyrus 28 R 28 �19 �20 88 x PositiveBrain stem L �3 �27 �8 208 x PositiveInferior frontal gyrus 47 L �41 18.5 �6 140 x PositiveMiddle occipital gyrus 19 L �42 �69.5 �7 88 x PositivePulvinar thalamus R 12 �35 4 16 x Negative
Significance defined as p � .005. BA, Brodmann’s area; P.C, picture-caption; R, right; L, left; IFG, inferior frontal gyrus; STG, superior temporal gyrus.
Neural Abnormalities in Depression 787BIOL PSYCHIATRY2003;54:777–791
however, some additional regions seen in the currentstudy, specifically with the negative picture-caption pairsversus reference picture-caption pairs and positive picture-caption pairs versus negative picture-caption pairs exper-iments. This could be due to the use of a homogenoussample consisting of all female subjects (50% male sub-jects in Teasdale et al 1999), and perhaps greater affectmodulation from reference picture-caption pairs to nega-tive picture-caption pairs (0.78 to �2.00 in the currentstudy; 0.21 to �1.60 in Teasdale et al 1999). The neuralnetwork for affect seen in control participants is alsoconsistent with other studies of the functional neuroanat-omy of emotion and mood states in healthy individuals
using PET and fMRI. Previous studies have consistentlyfound the amygdala (Schneider et al 1995, 1998) to beinvolved in negative emotional experiences, especiallyduring fear (Adolphs et al 1995; Breiter et al 1996; Phillipset al 1997) and sadness (Schneider et al 1995, 1998),whereas orbitofrontal lobe, anterior and posterior cingulategyrus, thalamus, hypothalamus, insula, hippocampus, tem-poral lobe, and basal ganglia structures have been linked toboth positive and negative emotional experiences in pre-vious studies (Canli et al 1998; George et al 1995; Lane etal 1997a, 1997b; Paradiso et al 1997; Pardo et al 1993;Partiot et al 1995; Phillips et al 1997; Reiman et al 1997;Schneider et al 1995). Another observation in control
Figure 5. Images showing the brain areaswith significant differences between depressedpatients and control participants for positivepicture-caption pairs versus reference picture-caption pairs experiment. Yellow areas indi-cate decreased response and red areas indicateincreased response in patients as comparedwith control subjects.
Figure 6. Images showing the brain areas withsignificant differences between depressed pa-tients and control participants for negativepicture-caption pairs versus positive picture-caption pairs experiment. Yellow areas indi-cate decreased response and red areas indicateincreased response in patients as comparedwith control subjects.
788 V. Kumari et alBIOL PSYCHIATRY2003;54:777–791
participants from the present study deserving some com-ment is that the medial frontal activation seen for thenegative and positive picture-caption pairs, contrastedwith reference picture-caption pairs, was right and leftsided, respectively (see Table 3). Although supporting thehemispheric asymmetry of emotions (Davidson 1995),these results were not evident when positive picture-caption pairs and negative picture-caption pairs weredirectly contrasted with each other (see Figure 2). Onepossible interpretation for this observation may be thatpositive and negative emotions are thought to follow alateralized pattern only at matching arousal levels (Canli etal 1998). Perhaps the arousal potential of positive andnegative picture-caption pairs changed to different levelsfor the experiment contrasting them directly against eachother.
In conclusion, to our knowledge, this study providesfMRI evidence for the first time for reduced cerebralresponse in the rostral anterior cingulate during cognitiveaffect processing in patients suffering from a treatment-resistant form of depression. The reduced response in themedial/middle frontal gyri and hippocampus, mainly withthe processing of positive picture-caption pairs, indicatesabnormalities in processing and attaching meaning topositive events in this form of depression. This study,however, involved only a small number of patients andexamined a large number of regions, and thus it may haveproduced some false results. Furthermore, all patients,although considered to be clinically nonresponsive to drugtherapy (and ECT in some cases), were still given a rangeof antidepressants, and this might have masked somedepression-related effects (for example, hyperactivation ofthe amygdala; Sheline et al 2001). The findings obtainedin this study need to be replicated with larger samples andextended to examine brain activation patterns in otherforms of depression and the effects of cognitive behavioraltherapy and drug treatments on brain responses usingexperimental paradigms with social and personal rele-vance.
ReferencesAdolphs R, Tranel D, Damasio H, Damasio AR (1995): Fear and
the human amygdala. J Neurosci 15:5879–5891.
Allen BA, Trinder J, Brennan (1999): Startle modulation inclinical depression: Preliminary findings. Biol Psychiatry4:542–550.
Andreasen NC (1997): Linking mind with the brain in the studyof mental illnesses: A project for scientific psychopathology.Science 275:1568–1593.
Andreasen NC, O’Leary DS, Cizadlo T, Arndt S, Rezai K,Watkins GL, et al (1995): Remembering the past: Two facetsof episodic memory explored with positron emission tomog-raphy. Am J Psychiatry 275:1576–1585.
American Psychiatric Association (1994): Diagnostic and statis-tical manual of mental disorders, 4th ed. Washington, DC:APA.
Beauregard M, Leroux J-M, Bergman S, Arzoumanion Y,Beaudoin G, Beaudoin P, Stip E (1998): The functionalneuroanatomy of major depression: An fMRI study using anemotional activation paradigm. Neuroreport 9:3253–3258.
Beck AT (1976): Cognitive Therapy and the Emotional Disor-ders. New York: International Universities Press.
Beck AT, Ward CH, Mendeson M, Mock J, Arbough J (1961):An inventory for measuring depression. Arch Gen Psychiatry4:53–63.
Brammer M, Bullmore ET, Simmons A, Williams SCR, GrasbyPM, Howard RJ, et al (1997): Generic brain activationmapping in fMRI: A nonparametric approach. Magn ResImaging 15:736–770.
Breiter HC, Etcoff NL, Whalen PJ, Kennedy WA, Rauch SL,Buckner RL, et al (1996): Response and habituation of thehuman amygdala during visual processing of facial expres-sion. Neuron 17:875–887.
Brody AL, Barsom MW, Bota RG, Saxena S (2001): Prefrontal-subcortical and limbic circuit mediation of major depressivedisorder. Semin Clin Neuropsychiatry 6:102–112.
Bullmore ET, Brammer M, Williams SCR, Rabe-Hesketh S,Janot M, David A, et al (1996): Statistical methods ofestimation and inference for functional MR image analysis.Magn Res Med 35:261–277.
Bullmore ET, Brammer MJ, Rabe-Hesketh S, Curtis VA, MorrisRG, Williams SCR, et al (1999a): Methods for diagnosis andtreatment of stimulus correlated motion in generic brainactivation studies using fMRI. Hum Brain Mapp 7:38–48.
Bullmore ET, Suckling J, Overmeyer S, Rabe-Hesketh S, TaylorE, Brammer MJ (1999b): Global, voxel, and cluster tests, fora difference between two groups of structural MR images ofthe brain. IEEE Trans Med Imaging 18:31–42.
Byrun CE, Ahearn EP, Krishan KRR (1999): A neuroanatomicmodel for depression. Prog Neuropsychopharmacol BiolPsychiatry 23:175–193.
Canli T, Desmond JE, Zhao Z, Glover G, Gabrieli JDE (1998):Hemispheric asymmetry for emotional stimuli detected withfMRI. Neuroreport 9:3233–3239.
Conway MA, Turk DA, Miller SL, Logan J, Nebes RD, MeltzerCC, et al (1999): A positron emission tomography (PET)study of autobiographical memory retrieval. Memory 7:679–702.
Davidson RJ (1995): Cerebral asymmetry, emotion and affectivestyle. In: Davidson RJ, Hughdal K, editors. Brain Asymmetry.Cambridge, MA: MIT Press, 361–387.
Drevets WC, Raichle ME (1998): Reciprocal suppression ofregional cerebral blood flow during emotional versus highercognitive processes: Implications for interactions betweenemotion and cognition. Cogn Emotion 12:353–385.
Edginton ES (1980): Randomisation Tests. New York: MarcelDekker.
Fawcett J, Clark DC, Scheftner WA, Gibbsons RD (1983):Assessing anhedonia in psychiatric patients. The PleasureScale. Arch Gen Psychiatry 140:1027–1030.
Neural Abnormalities in Depression 789BIOL PSYCHIATRY2003;54:777–791

Fink GR, Markowitch HJ, Reinkemeier M, Bruckbauer T,Kessler J, Heiss WD (1996): Cerebral representations ofone’s own past: Neural network involved in autobiographicalmemory. J Neurosci 16:4275–4282.
First MB, Spitzer RL, Gibbon M, Williams JBW (1995):Structured Clinical Interview for DSM-IV Axis I Disorders,Patient Edition (SCID-P). New York: New York StatePsychiatric Institute, Biometrics Research version 2.
George MS, Ketter TA, Parekh PI, Horowitz B, Herscovitch P,Post RM (1995): Brain activity during transient sadness andhappiness in healthy women. Am J Psychiatry 152:341–351.
Hamilton M (1960): A rating scale for depression. J NeurolNeurosurg Psychiatry 23:56–62.
Izard CE (1993): Four systems of emotion activation: Cognitiveand non-cognitive processes. Psychol Rev 100:68–90.
Ketter TA, Kimbrell TA, George MS, Dunn RT, Speer AM,Benson BE, et al (2001): Effects of mood and subtype oncerebral glucose metabolism in treatment-resistant bipolardisorder. Biol Psychiatry 49:97–109.
Kimbrell TA, Ketter TA, George MS, Little JT, Benson BE,Willis MW, et al (2002): Regional cerebral glucose utilizationin patients with a range of severities of unipolar depression.Biol Psychiatry 51:237–252.
Lader M (1983): Anxiety and depression. In: Gale A, EdwardsJA, editors. Physiological Correlates of Human Behaviour.London: Academic Press.
Lane RD, Reiman EM, Athern GL, Davidson RJ, Schwartz GE(1997a): Neuroanatomical correlates of happiness, sadnessand disgust. Am J Psychiatry 154:926–933.
Lane RD, Reiman EM, Bradley MM, Lang PJ, Athern GL,Davidson RJ, et al (1997b): Neuroanatomical correlates ofpleasant and unpleasant emotion. Neuropsychologia35:1437–1444.
Maddock RJ, Garrett AS, Buonocore MH (2001): Rememberingfamiliar people: The posterior cingulate cortex and autobio-graphical memory retrieval. Neuroscience 104:667–676.
Mattis S (1988): Dementia Rating Scale. Odessa, FL: Psycho-logical Assessment Resources, Inc.
Mayberg H (1997): Limbic-cortical dysregulation: A proposedmodel of depression. J Neuropsychiatry 9:471–481.
Mayberg H, Brannan SK, Mahrin RK, Jerabek PA, Brickman JS,Silva A, et al (1997): Cingulate function in depression: Apotential predictor of treatment response. Neuroreport8:1957–1061.
Mayberg HS, Liotti ML, Brannan SK, McGinnis S, Mahurin RK,Jerabek PA, et al (1999): Reciprocal limbic-cortical functionand negative mood: Converging PET findings in depressionand normal sadness. Am J Psychiatry 156:675–682.
Mervaala E, Fohr J, Kononen M, Valkonen-Korhonen M, VainioP, Partanen K, et al (2000): Quantitative MRI of the hip-pocampus and amygdala in severe depression. Psychol Med30:117–125.
Oei TP, Sullivan LM (1999): Cognitive changes followingrecovery from depression in a group cognitive-behaviourtherapy program. Aust N Z J Psychiatry 33:407–415.
Ogawa S, Lee TM, Kay AR, Tank DW (1990): Brain magneticresonance imaging with contrast dependent blood oxygen-ation. Proc Nat Acad Sci U S A 87:8868–8872.
Paradiso S, Chemrinski E, Yazici KM, Tartaro A, Robinson RG(1999a): Frontal lobe syndrome reassessed: Comparison ofpatients with lateral or medial frontal brain damage. J NeurolNeurosurg Psychiatry 67:664–667.
Paradiso S, Johnson DL, Andreasen NC, O’Leary DS, WatkinsGL, Ponto LL, et al (1999b): Cerebral blood flow changesassociated with attribution of emotional valence to pleasant,unpleasant, and neutral visual stimuli in a PET study ofnormal subjects. Am J Psychiatry 156:1618–1629.
Paradiso S, Robinson RG, Andreasen NC, Downhill JE, David-son RJ, Kirchner PT, et al (1997): Emotional activation oflimbic circuitry in elderly normal subjects in a PET study.Am J Psychiatry 154:384–389.
Pardo JV, Pardo PJ, Raichle ME (1993): Neural correlates ofself-induced dysphoria. Am J Psychiatry 150:713–719.
Partiot A, Grafman J, Sadato N, Wachs J, Hallett M (1995):Brain activations during the generation of non-emotional andemotional plans. Neuroreport 6:1269–1272.
Phillips ML, Young AW, Senior C, Brammer M, Andrew C,Calder AJ, et al (1997): A specific neural substrate forperceiving facial expressions of disgust. Nature 389:495–498.
Pizzagalli D, Pascual-Marqui RD, Nitschke JB, Oakes TR,Larson CL, Abercrombie HC, et al (2001): Anterior cingulateactivity as a predictor of degree of treatment response inmajor depression: Evidence from brain electrical tomographyanalysis. Am J Psychiatry 158:405–415.
Polivy J, Doyle C (1980): Laboratory inductions of mood statesthrough the reading of self-referent mood statements: Affec-tive changes or demand characteristics? J Abnorm Psychol89:286–290.
Rabe-Hesketh S, Bullmore ET, Brammer MJ (1997): The anal-ysis of functional magnetic resonance images. Stat MethodsMed Res 6:215–237.
Reiman EM, Lane RD, Ahern GL, Schwartz GE, Davidson RJ,Friston KJ, et al (1997): Neuroanatomical correlates ofexternally and internally generated human emotion. Am JPsychiatry 154:918–925.
Robinson RG, Kubos KL, Starr LB, Rao K, Price TR (1984):Mood disorders in stroke patients: Importance of the locationof lesion. Brain 107:81–93.
Schmahmann JD, Sherman JC (1998): The cerebellar cognitiveaffective syndrome. Brain 121:2202–2205.
Schneider F, Gur RE, Mozley LH, Smith RJ, Mozley PD,Censists DM, et al (1995): Mood effects on limbic blood flowcorrelate with emotional self-rating: A PET study with O-15labeled water. Psychiatry Res 61:265–283.
Schneider F, Weisee U, Salloum JB, Grodd W, Muller-GartnerHW (1998): Differential amygdala activation in schizophre-nia during sadness. Schizophr Res 34:133–142.
Sheline YI, Barch DM, Donnelly JM, Ollinger JM, Snyder AZ,Mintun MA (2001): Increased amygdala response to maskedemotional faces in depressed subjects resolves with antidepres-sant treatment: An fMRI study. Biol Psychiatry 50:651–658.
Simmons A, Moore E, Williams SCR (1999): Quality control forfunctional magnetic resonance imaging using automated dataanalysis and Shewhart charting. Magn Res Med 41:1274–1278.
Snaith P (1993): Anhedonia: A neglected symptom of psycho-pathology. Psychol Med 23:957–966.
Starkstein SE, Robinson RG (1991): The role of the frontal lobes
790 V. Kumari et alBIOL PSYCHIATRY2003;54:777–791
in affective disorder following stroke. In: Levin HJ, Eisen-berg HM, Benton AL, editors, Frontal Lobe Function andDysfunction. New York: Oxford University Press.
Starkstein SE, Robinson RG, Berthier ML, Parikh RM, Price TR(1988): Differential mood changes following basal ganglia vsthalamic changes. Arch Neurol 45:725–730.
Steffens DC, Byrum CE, McQuoid DR, Greenberg DL, PayneME, Blitchington TF, et al (2000): Hippocampal volume ingeriatric depression. Biol Psychiatry 48:301–309.
Talairach J, Tournoux P (1988): Co-planar Stereotaxic Atlas ofthe Human Brain. Stuttgart: Thieme.
Teasdale JD, Howard R, Cox S, Ha Y, Brammer M, Williams S,et al (1999): Functional MRI study of the cognitive genera-tion of affect. Am J Psychiatry 156:209–215.
Thase ME, Friedman ES, Berman SR, Fasiczka AL, Lis JA,Howland RH, et al (2000): Is cognitive behavior therapy justa ‘nonspecific’ intervention for depression? A retrospectivecomparison of consecutive cohorts treated with cognitivebehavior therapy or supportive counseling and pill placebo. JAffect Disord 57:63–71.
Wexler BE, Levenson L, Warrenburg S, Price LH (1994):Decreased perceptual sensitivity to emotion-evoking stimuliin depression. Psychiatry Res 51:127–138.
Wu J, Buchsbaum MS, Gillin JC, Tang C, Cadwell S, WiegandM, et al (1999): Prediction of antidepressant effects of sleepdeprivation by metabolic rates in the ventral anterior cingu-late and medial prefrontal cortex. Am J Psychiatry 156:1149–1158.
Neural Abnormalities in Depression 791BIOL PSYCHIATRY2003;54:777–791
Related Documents