Networks in System Architecture • Network research history • Example complex systems represented as networks • Network models – Forming – Analyzing • Some fundamental questions Networks_Intro.ppt © Daniel E. Whitney 1/44

Welcome message from author
This document is posted to help you gain knowledge. Please leave a comment to let me know what you think about it! Share it to your friends and learn new things together.
Transcript
Networks in System Architecture
• Network research history • Example complex systems represented as
networks • Network models
– Forming – Analyzing
• Some fundamental questions
Networks_Intro.ppt © Daniel E. Whitney 1/44
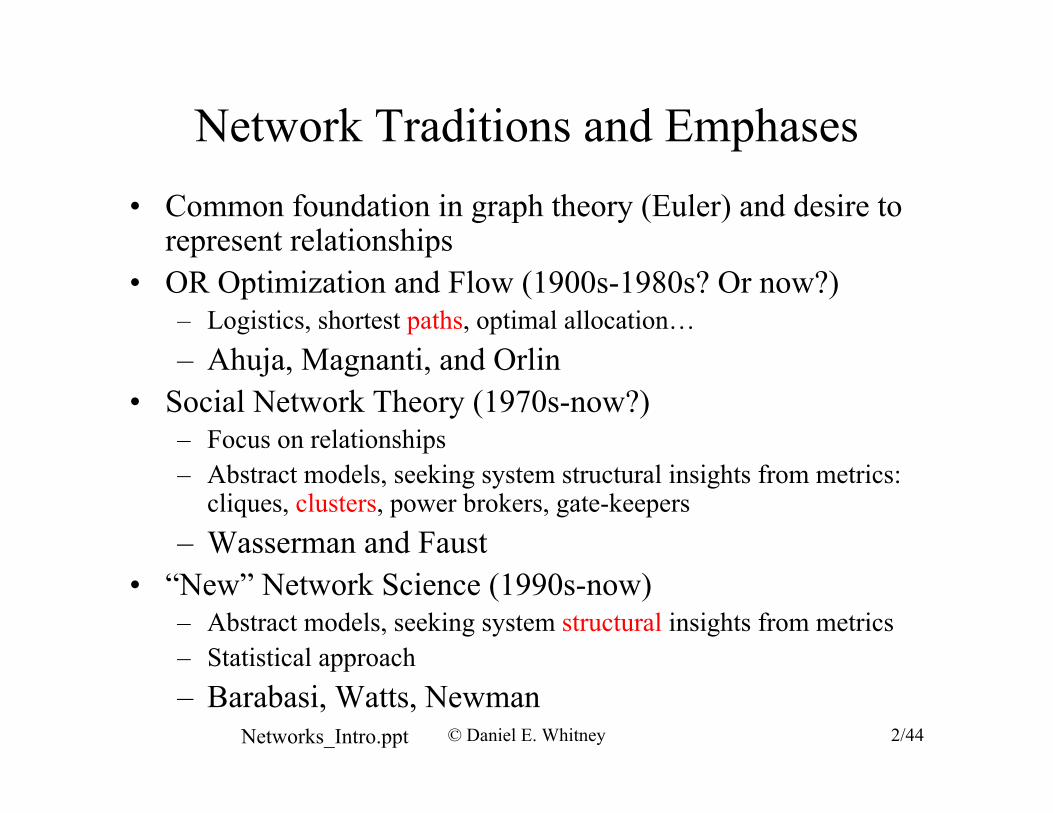
Network Traditions and Emphases
• Common foundation in graph theory (Euler) and desire to represent relationships
• OR Optimization and Flow (1900s-1980s? Or now?) – Logistics, shortest paths, optimal allocation… – Ahuja, Magnanti, and Orlin
• Social Network Theory (1970s-now?) – Focus on relationships – Abstract models, seeking system structural insights from metrics:
cliques, clusters, power brokers, gate-keepers – Wasserman and Faust
• “New” Network Science (1990s-now) – Abstract models, seeking system structural insights from metrics – Statistical approach – Barabasi, Watts, Newman
Networks_Intro.ppt © Daniel E. Whitney 2/44
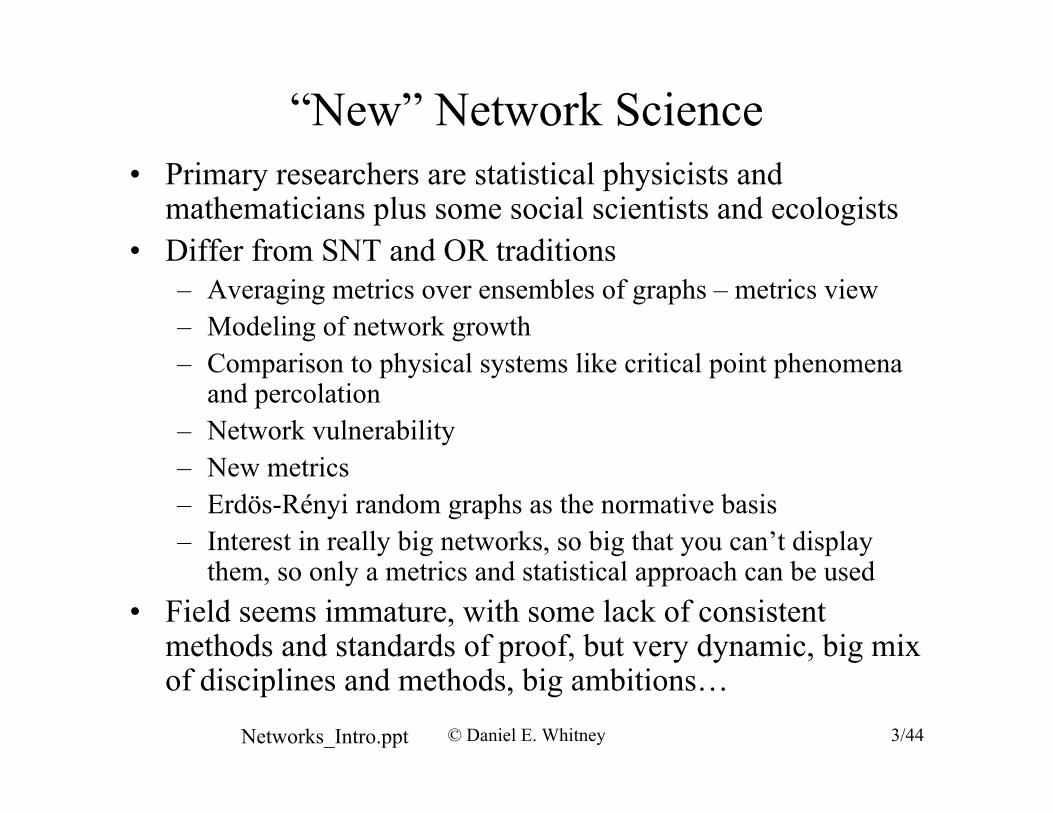
“New” Network Science• Primary researchers are statistical physicists and
mathematicians plus some social scientists and ecologists • Differ from SNT and OR traditions
– Averaging metrics over ensembles of graphs – metrics view – Modeling of network growth – Comparison to physical systems like critical point phenomena
and percolation – Network vulnerability – New metrics – Erdös-Rényi random graphs as the normative basis – Interest in really big networks, so big that you can’t display
them, so only a metrics and statistical approach can be used • Field seems immature, with some lack of consistent
methods and standards of proof, but very dynamic, big mix of disciplines and methods, big ambitions…
Networks_Intro.ppt © Daniel E. Whitney 3/44
Why Study Networks?
• Many systems are networks • Networks capture relationships • Networks have structure (possibly random) • Various metrics exist that capture various
aspects of this structure • In some cases the structure or the metrics
can be related to important properties of the system or its behavior
Networks_Intro.ppt © Daniel E. Whitney 4/44
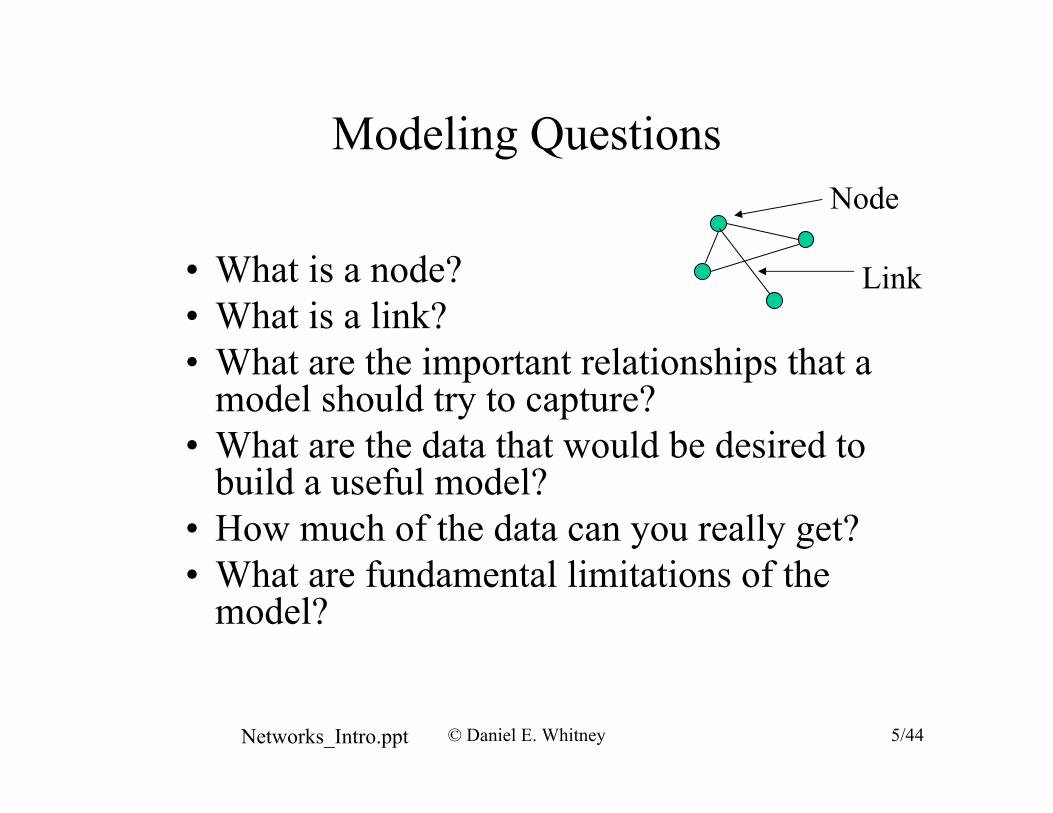
Modeling Questions Node
• What is a node? Link • What is a link? • What are the important relationships that a
model should try to capture? • What are the data that would be desired to
build a useful model? • How much of the data can you really get? • What are fundamental limitations of the
model?
Networks_Intro.ppt © Daniel E. Whitney 5/44
Some Theoretical or Canonical Graph Types
• Planar • Random • Grid structured • Trees • Hub and spokes • “Scale free” • Possessing Hamilton or Euler circuit
– Hamilton: touching every node once – Euler: touching every arc once
Networks_Intro.ppt © Daniel E. Whitney 6/44

Example Graphs (Systems)
• Road map • Electric circuit or pipe system • Structure of bridge or building, with load paths• Organizational chart or social network • Markov chain • Control circuit feedback loop • Phone system • Chemical reaction • Sequential event plan
Networks_Intro.ppt © Daniel E. Whitney 7/44

More Example Analyzable Graphs
• Manufacturing process • Assembly sequence • Schedule • Family tree • Ecological food chain • Taxonomy of living things, rocks, and other
natural hierarchies • Naval battle, military campaign
Networks_Intro.ppt © Daniel E. Whitney 8/44

Planar Graph ExampleV = number of nodes E = number of edges f = number of facets f E ≤ 3V − 6 ∴ f = 2V − 4max
Meshness Ratio M = f / fmax
= E − V + 2 (or 1 if the "outside" facet is ignored)
0 ≤ M ≤ 1
Trails made by ants in planar sand piles have average nodal degree <k> = 2.2 and M ~ 0.1 Note: for connected planar graphs:
6V − 12< k > = ⎯ ⎯⎯→6max V →∞V < k > ⎯⎯⎯
→ 4 M + 2
2V − 2 V →∞
< k >min = ⎯ ⎯⎯→2V V →∞
“Efficiency and Robustness in Ant Networks of Galleries,” J. Buhl, J. Gautrais1, R.V. Sol´e, P. Kuntz, S. Valverde2, J.L. Deneubourg, and G. Theraulaz, Eur. Phys. J. B 42, 123–129 (2004)
Networks_Intro.ppt © Daniel E. Whitney 9/44
Metro systems: <k> = 3 - 3.5 mr = ~ 0.25
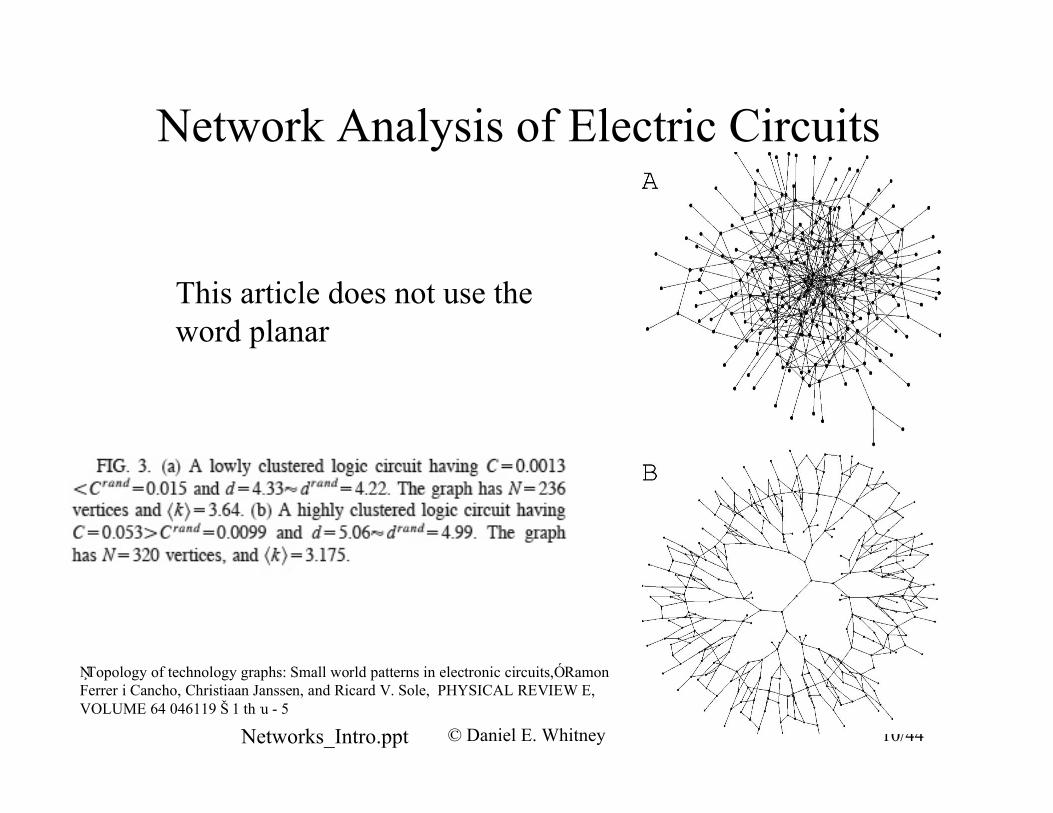
Network Analysis of Electric Circuits
This article does not use theword planar
ŅTopology of technology graphs: Small world patterns in electronic circuits,Ó Ramon Ferrer i Cancho, Christiaan Janssen, and Ricard V. Sole, PHYSICAL REVIEW E, VOLUME 64 046119 Š 1 thru - 5
Networks_Intro.ppt © Daniel E. Whitney 10/44

Network Version of London Tube Map
Circle Line
Node: terminal Or you can change trains Or the line branches
Networks_Intro.ppt © Daniel E. Whitney 11/44
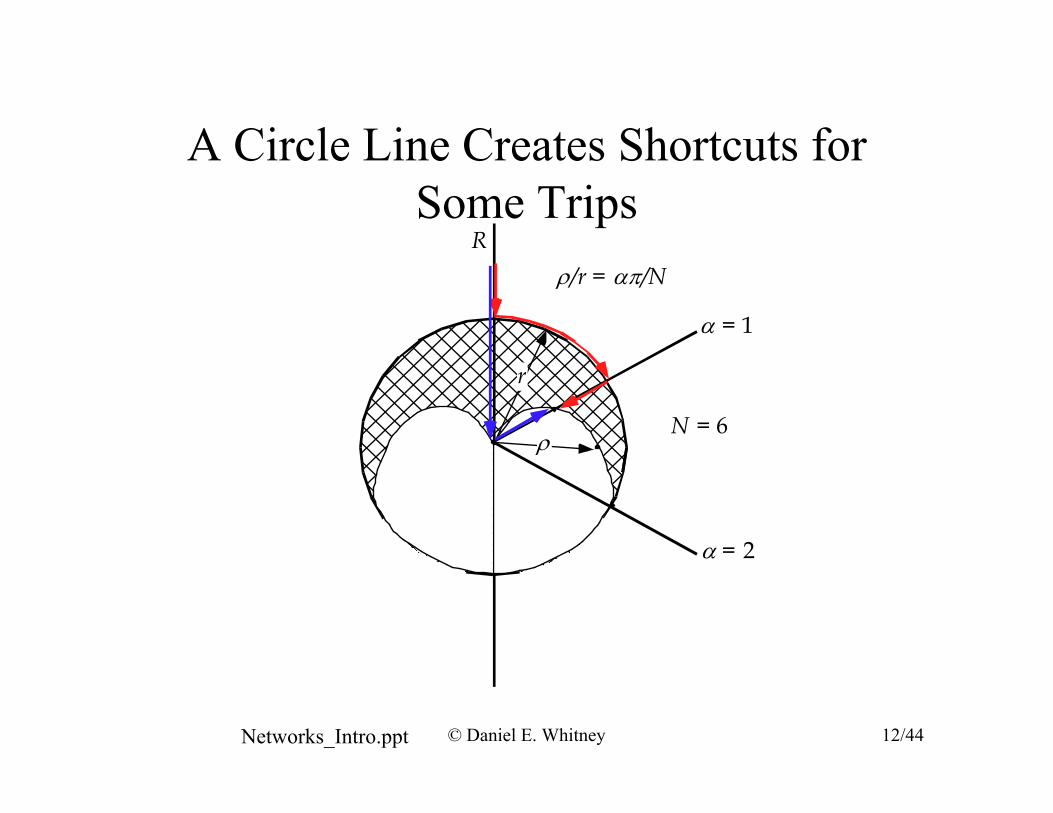
A Circle Line Creates Shortcuts for Some Trips
R
N = 6
α = 1
α = 2
ρ/r = απ/N
r
ρ
Networks_Intro.ppt © Daniel E. Whitney 12/44

Growth Model of Tokyo Area Rail System by Slime Mold
Image of slime mold growth and diagram of Tokyo area rail system removed due to copyright restrictions.
Science 22 January 2010:Vol. 327. no. 5964, pp. 439 - 442DOI: 10.1126/science.1177894
Rules for Biologically Inspired Adaptive Network DesignAtsushi Tero,1,2 Seiji Takagi,1 Tetsu Saigusa,3 Kentaro Ito,1 Dan P. Bebber,4 Mark D. Fricker,4 Kenji Yumiki,5 Ryo Kobayashi,5,6 Toshiyuki Nakagaki1,6,*
Networks_Intro.ppt © Daniel E. Whitney 13/44

Every (Network) Model Is a Choice of Level of Abstraction
• “High” abstraction – Summarize, generalize, compare – Don’t need domain knowledge
• “Low” abstraction – Valid detail – Explainable differences – Need domain knowledge
• Models and analyses at many levels are needed
Networks_Intro.ppt © Daniel E. Whitney 14/44

Graphs and Networks
• A graph is a collection of nodes connected by arcs (directed, with arrows) or edges (undirected, no arrows) generically called links
• A network is a graph
Networks_Intro.ppt © Daniel E. Whitney 15/44
Graph/Network “Rules”
• Links connect pairs of nodes • Links can be directed or undirected
– Undirected called edges in graph theory – Directed called arcs
• Nodes can have any number of impinging links in principle, although there may be various constraints that depend on the domain
• Dual graphs can be formed – Links become nodes – Nodes become links
Networks_Intro.ppt © Daniel E. Whitney 16/44
Nodes Can Be
• Places • Things • People • Jobs, tasks, process steps • Calculations or calculation steps
Networks_Intro.ppt © Daniel E. Whitney 17/44
Links Can Be
• Physical paths, mechanical joints • Abstract or real relationships
– Directed: A commands B, is the father of B, occurs before B…
– Undirected: A lives near B, is on the same side as B… • Indications of flow of material or information • Annotated to represent capacity, direction, content• Carriers of single or multiple entities like
geometric dimensions, kinds of stuff, etc
Networks_Intro.ppt © Daniel E. Whitney 18/44

Various classes of networks
an undirected network with only a single type of node and a single type of
link
a network with varying node and
link weights
a network with a number of discrete node and link types
a directed network in which each link has a direction
Missing are networks that have nodes with multiple functions and that have multiple types of links. For example, nodes that transform energy and also calculate
and that have links that pass information, control signals, energy, etc. Source: M. E. J. Newman, The Structure and Function of Complex Networks, SIAM Review, Vol. 45, No. 2, pp . 167–256, 2003Society for Industrial and Applied Mathematics
Networks_Intro.ppt © Daniel E. Whitney 19/44
Graphs Can Be Classified As…
• Metric (links have real lengths, and node locations obey the triangle inequality)
• Non-metric (the layout is purely logical) • Cyclic or non-cyclic • Planar (can be drawn so that no links cross) • Connected or unconnected
– Connected: a path exists between every pair of nodes
• Simple: no self-loops, ≤ 1 link between nodes • Able/unable to support a looped path or a path that
touches every node once only, … • These are not mutually exclusive
Networks_Intro.ppt © Daniel E. Whitney 20/44

A Classification of Network Structures
Formal Tree-Structured Unique Path to the T (No horizontal links
Strictly Ordered
Pure Layered Struct No layer-skipping
Horizontal links allow
Partially Ordered
Hierarchies Ordered Top Node
Regular General Networks
Non-Hierarchical Unordered No top node
Networks
Links, Nodes Link joins exactly 2 n
This classification is a formal tree-structured hierarchy
Simple
Networks_Intro.ppt © Daniel E. Whitney 21/44

Real and “Not Real” Networks
• Real: road network, mechanical assembly • Not real(?): coauthor or movie actor network • Real but documentable only in a statistical sense:
transmission of flu or rumors, number of friends• Real = transitive relations? A
• Much depends on the word ‘also” – A writes a paper with B and also one with C
C B – A writes a paper with B and C A– A reacts with B and also with C – A is bolted to B and also bolted to C – B sends signals to A which also sends signals to C C B – B eats A which also eats C
Networks_Intro.ppt © Daniel E. Whitney 22/44
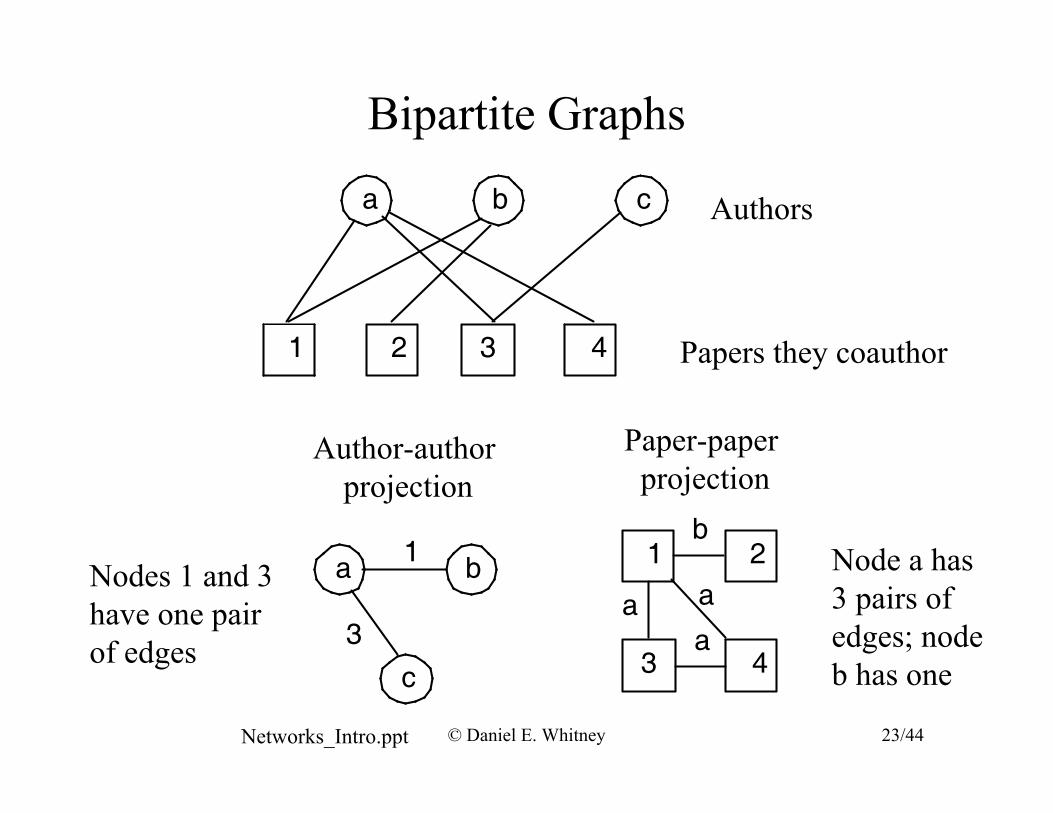
Bipartite Graphs
a b c
1 2 3 4
Authors
Papers they coauthor
Author-author Paper-paper projection projection
c
a b1
3
Node a hasNodes 1 and 3 1 2
3 4
b
a a a 3 pairs ofhave one pair
edges; nodeof edges b has one
Networks_Intro.ppt © Daniel E. Whitney 23/44

Possible Analyses
• Finding an ordering on the nodes – Schedule, seating arrangement, space allocation,
assembly sequence • Finding clusters and communities • Analyzing electric circuits and other applications of linear
algebra • Calculating mechanism properties like mobility and
constraint • Calculating control system stability • Estimating or calculating system complexity • Paths: shortest, max capacity, least cost, critical, first
passage time, etc. Second place, 3rd place, etc
Networks_Intro.ppt © Daniel E. Whitney 24/44
“Motifs” in Networks: Local Structure
Image removed due to copyright restrictions. Figure from: “Network Motifs: Simple Building Blocks of Complex Networks,” R. Milo, 1 S. Shen-Orr, S. Itzkovitz, N. Kashtan, D. Chklovskii, U. Alon, Science vol 298, 25 Oct 2002, p 864,
Networks_Intro.ppt © Daniel E. Whitney 25/44
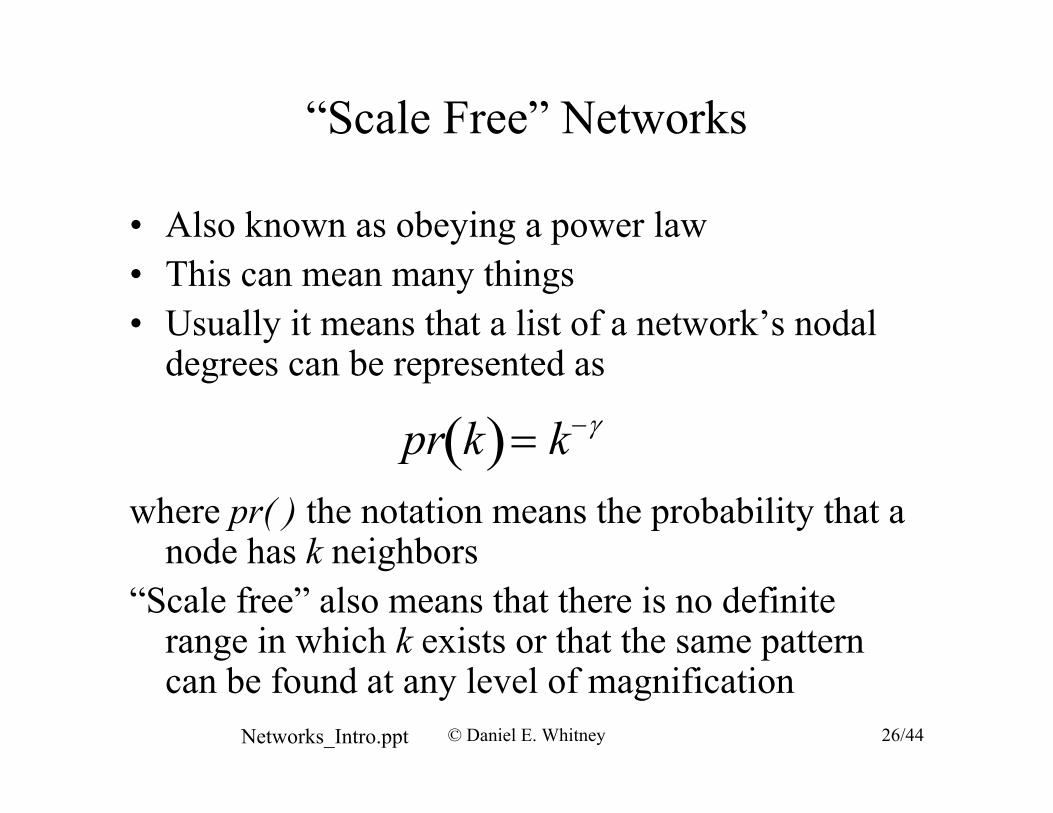
“Scale Free” Networks
• Also known as obeying a power law • This can mean many things • Usually it means that a list of a network’s nodal
degrees can be represented as
pr k( )= k−γ
where pr( ) the notation means the probability that a node has k neighbors
“Scale free” also means that there is no definite range in which k exists or that the same pattern can be found at any level of magnification
Networks_Intro.ppt © Daniel E. Whitney 26/44

Size Distribution of Earthquakes
http://enthusiasm.cozy.org/images/ The chart shows one point for each of the top five thousand earthquakes in the united states dur
Networks_Intro.ppt © Daniel E. Whitney 27/44
1.E+06
1.E+07
1.E+08
1.E+09
1.E+10
1.E+11
1.E+12
0 10 100 1000 10000
Image by MIT OpenCourseWare.

The Aura of Scale Free
• From ~1998 to 2004 (still!) there was a frenzy of publication in which one system after another was “discovered” to be scale free: “obeys a power law”
• It was claimed that these systems must have some underlying common elements or principles or have a particular hub-spokes structure and that the hubs had special roles in the systems
• The reality may be less exciting: there are many systems with high variability but they have not gotten much attention before.
• In any case, the degree sequences are scale free, not the networks themselves
• Many graphs have the same degree sequence and totally different structure
Networks_Intro.ppt © Daniel E. Whitney 28/44
More Normal Than Normal
• Normal = gaussian distribution • Usually the first assumption but not the only
one possible or even most appropriate – A narrow distribution
• “The Black Swan: The Impact of the Highly Improbable” – A wide distribution
Networks_Intro.ppt © Daniel E. Whitney 29/44
Links Between Networks and Systems
• Abstract model that captures relationships • Hierarchical descriptions • General network descriptions • Depiction of the decomposition process as a
tree • Depiction of the synthesis process as
clustering • Early thinkers: Simon, Alexander
Networks_Intro.ppt © Daniel E. Whitney 30/44
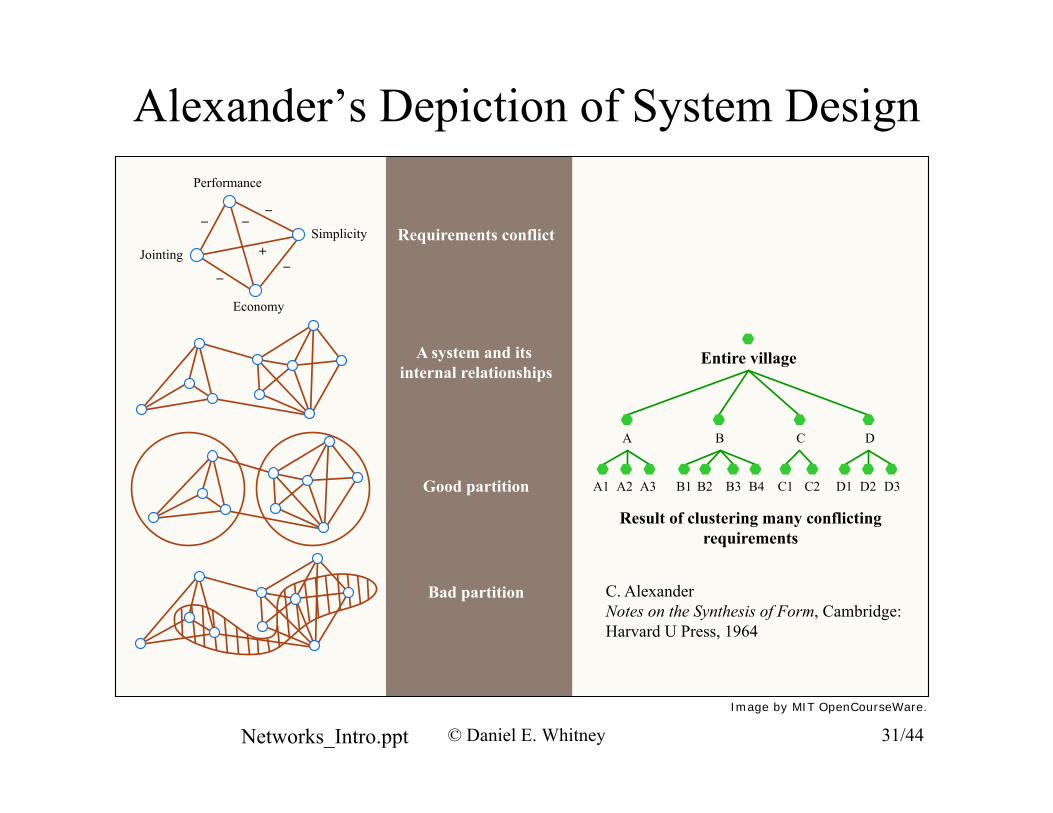
Alexander’s Depiction of System Design
Networks_Intro.ppt © Daniel E. Whitney 31/44
_ __
__
+Simplicity
A
A1 A2 A3
B
B1 B2 B3 B4
C
C1 C2
D
D1 D2 D3
Requirements conflict
A system and its internal relationships
Good partition
Result of clustering many conflictingrequirements
C. AlexanderNotes on the Synthesis of Form, Cambridge:Harvard U Press, 1964
Bad partition
Economy
Jointing
Performance
Entire village
Image by MIT OpenCourseWare.

• Simon: modularity related to evolution, survival, and complexity (1962) – Can’t survive (due to propagating failures) unless there
is some independence between modules – The modules form into (nested/closed) hierarchies– Evolution can proceed in separate activities – Also: decomposable systems are less complex
• Alexander: modularity related to efficient design procedures (1964) – Can’t make design decisions (due to interactions)
unless they are clustered meaningfully and dealt with in bulk
– Design can proceed as independent steps – The right clusters may not be the obvious visible ones
• Both: perfect clean decomposition is impossible
Simon and A
lexander
Networks_Intro.ppt © Daniel E. Whitney 32/44

Possible Data Sets
• Western Power Grid • Example at the end of Alexander Notes on
the Synthesis of Form • Most any road map • Coauthors, metabolites • Pajek web site (huge networks)
Networks_Intro.ppt © Daniel E. Whitney 33/44
Research Front Topics
• To what extent are intuitively important aspects of architecture quantifiable and measurable?
• Are there useful paradigms, patterns, principles or other lessons from natural systems that researchers on real system architectures can use - and how can they be used?
• Assuming we know what functions, performance, and ilities we want, what methods can be used to create a suitable architecture?
• Assuming we know what architecture we want, what are the most effective ways of influencing the architecture of complex, evolving engineering systems?
Networks_Intro.ppt © Daniel E. Whitney 34/44
Graphs and Matrices
• A graph can be converted to a matrix and vice versa: node-node, node-link, link-link
• A graph where a link connects only 2 nodes is equivalent to a 2 dimensional matrix
• A graph where an link connects n nodes is equivalent to an n dimensional matrix
• When form or structural patterns must be observed, matrices may be the better representation, especially if there are very many nodes and links
• MATLAB is applicable Networks_Intro.ppt © Daniel E. Whitney 35/44
Matlab Routines (Next Class)
• On Stellar there are several Matlab routines that calculate many of these simple statistics
• Of course you can write your own. • I have downloaded many Matlab graph
theory routines but many seem to have bugs or do not work the way I expect.
• Always test any routine on a simple graph first
Networks_Intro.ppt © Daniel E. Whitney 36/44

http://www.analytictech.com/ucinet/
Tutorial Book
• http://faculty.ucr.edu/~hanneman/nettext/in dex.html
• Linked to UCINET software
Networks_Intro.ppt © Daniel E. Whitney 37/44

http://www.insna.org/software/index.html http://www.insna.org/software/index.html
Resources, with search paths• Google>graph theory>
– http://people.freenet.de/Emden-Weinert/graphs.html – http://www.c3.lanl.gov/mega-math/gloss/graph/gr.html – http://www.utm.edu/departments/math/graph/ – http://mathworld.wolfram.com/topics/GraphTheory.html
• Google>social science network analysis> –– http://www.research.att.com/sw/tools/graphviz/ (found on
INSNA/soft_inf, software toolkit for drawing graphs and networks) • Google> graph theory analysis software>
– http://www-personal.umich.edu/~mejn/courses/2004/cscs535/ (Mark Newman’s course at U of M)
• http://eclectic.ss.uci.edu/~drwhite/Anthro179a/SocialDynamics02.ht ml > http://eclectic.ss.uci.edu/~drwhite/
– http://directory.google.com/Top/Science/Math/Combinatorics/Software/G raph_Drawing/
Networks_Intro.ppt © Daniel E. Whitney 38/44
More Resources• Google> graph theory analysis software>
– http://www.ece.uc.edu/~berman/gnat/ (a research group) – http://mathforum.org/library/topics/graph_theory/?keyid=1007717
1&start_at=51&num_to_see=50 (The Math Forum @ Drexel) – http://www.ai.mit.edu/~murphyk/Bayes/bayes.html (Bayesian
belief networks) – http://www.math.niu.edu/~rusin/known-math/index/05-XX.html
(combinatorics) > http://www.math.niu.edu/~rusin/knownmath/index/05CXX.html (graph theory)
– http://www.indiana.edu/%7Ecortex/connectivity_toolbox.html (matlab toolbox)
– http://www.mathworks.com/matlabcentral/fileexchange/4266- grtheory-graph-theory-toolbox (another matlab toolbox)
– http://jung.sourceforge.net (a java toolkit) – http://www-personal.umich.edu/~mejn/pubs.html (Mark
Newman’s publications)
Networks_Intro.ppt © Daniel E. Whitney 39/49

• http://nicomedia.math.upatras.gr/courses/mnets/
More
• http://powerlaws.media.mit.edu/ (MIT course with pdf readings)
(Univ of Patras course with readings)
• http://en.wikipedia.org/wiki/Small_world_phenom enon#The_scale-free_network_model
Networks_Intro.ppt © Daniel E. Whitney 40/44
Prominent Network Researchers
• Barabasi http://www.nd.edu/~alb/ • Doyle http://www.cds.caltech.edu/~doyle/
– http://www.cds.caltech.edu/~doyle/CmplxNets/ – http://hot.caltech.edu/
• Newman http://www-personal.umich.edu/~mejn/• Strogatz http://tam.cornell.edu/Strogatz.html • Watts http://www.coi.columbia.edu/faculty.html
Networks_Intro.ppt © Daniel E. Whitney 41/44
Backups
Networks_Intro.ppt © Daniel E. Whitney 42/44
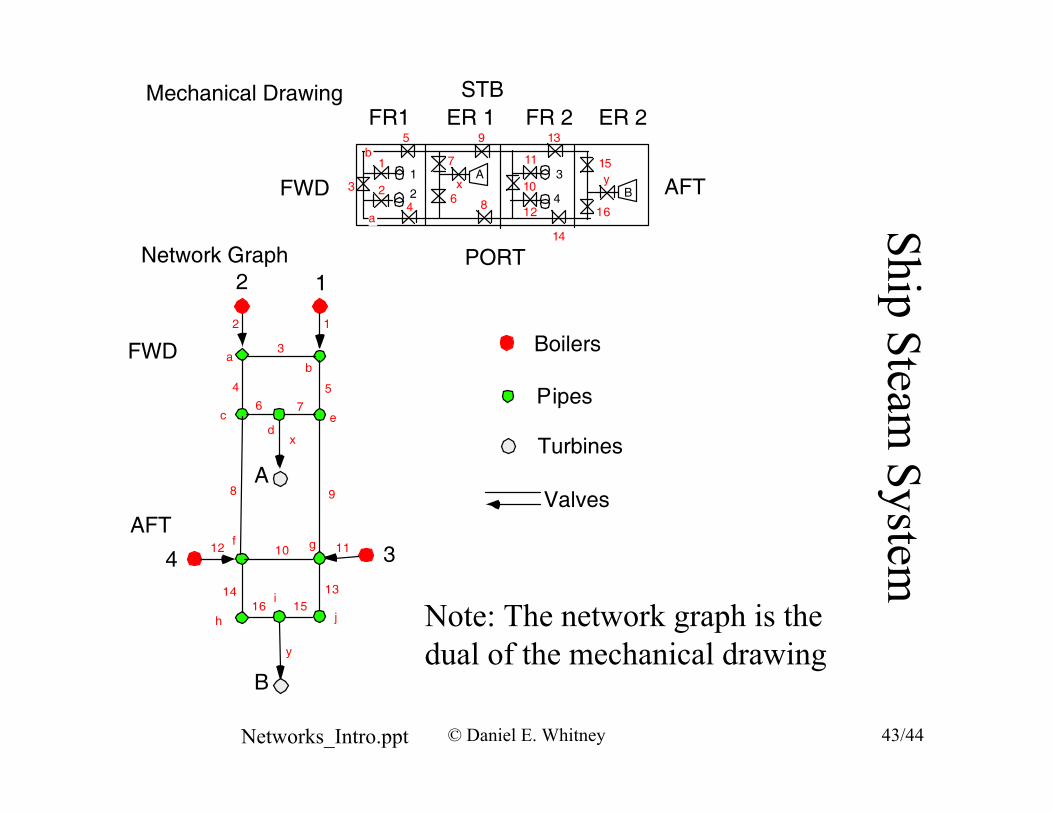
Mechanical Drawing STB FR1 ER 1 FR 2 ER 2
FWD AFT 1
23
4
5
6
7
8
9
10
11
12
13
yx
15
16
1
2
A 3
4 B
a
b
2 Network Graph
1 PORT
14
FWD Boilers
Pipes
Turbines
4
AFT 3
Valves
Note: The network graph is the dual of the mechanical drawing
12
3
4 5
6 7
x
8 9
1012 11
1314 16 15
y
A
B
a b
c d
e
f g
h
i
j
Ship Steam System
Networks_Intro.ppt © Daniel E. Whitney 43/44
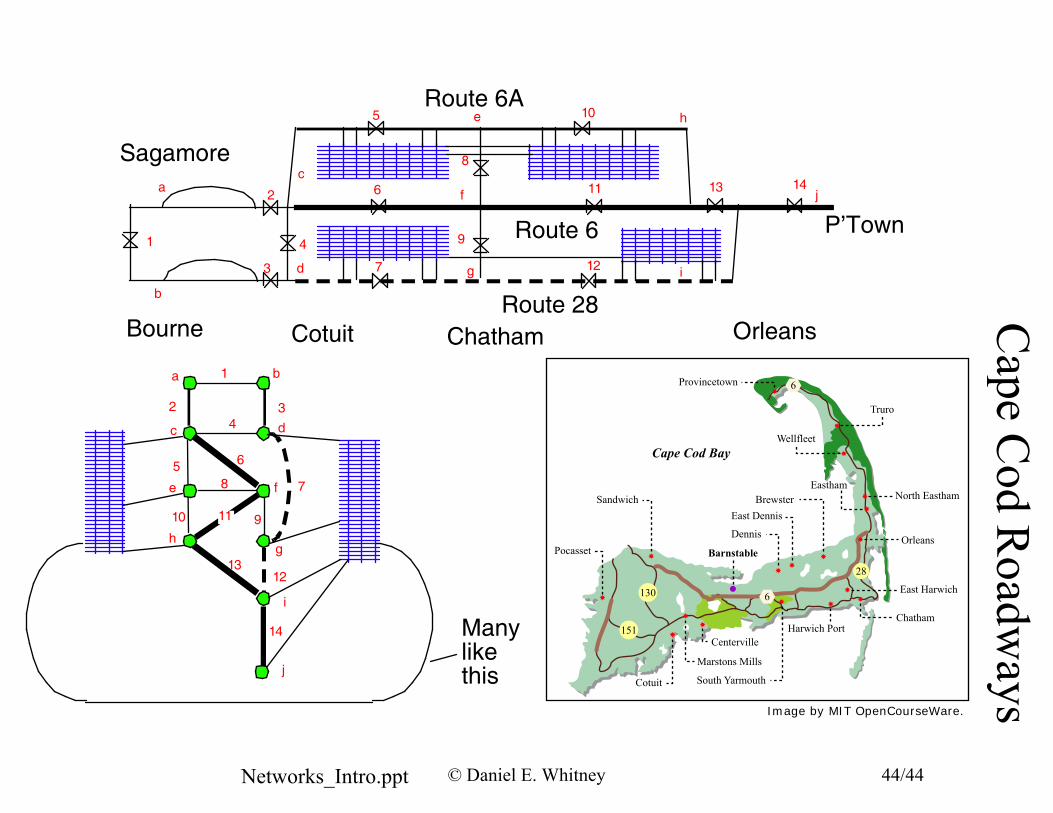
Route 6A
Route 28 Bourne OrleansCotuit Chatham
1 ba
2 34
Manylike this
Cape C
od Roadw
ays
Sagamore
P’Town
a
b
c
d
e
f
g
h
i
j
1
2
3
4
5
6
7
8
9
10
11
12
13 14
Route 6
c d
e f
h g
j
i
5 6
78
91110
12 13
14
Networks_Intro.ppt © Daniel E. Whitney 44/44
130
151
28
6
6Provincetown
Truro
Wellfleet
North EasthamEastham
Orleans
Brewster
East Harwich
ChathamHarwich Port
South Yarmouth
East Dennis
Marstons Mills
Pocasset
Sandwich
Cape Cod Bay
Cotuit
Centerville
Dennis
Barnstable
Image by MIT OpenCourseWare.

Link Between Networks and Linear Algebra
u
v
x y-c
-b
1-a 1-d
⎡u⎤ ⎡a b⎤⎡x⎤⎢ ⎥ = ⎢ ⎥⎢ ⎥⎣v⎦ ⎣c d⎦⎣y⎦
“Solve” for x and y given u and v by putting voltages on the u and v terminals and reading the voltages on the x and y terminals
Networks_Intro.ppt © Daniel E. Whitney 45/44

Diameter and Structure
• How many plane changes are needed to fly from city A to city B and how does this change as the network grows?
• In a point to point network, the number might grow linearly with the number of cities in the network, unless there is a link between most pairs (max n(n-1)/2 links needed)
• In a hub-spokes network, the number may hardly grow at all even if almost no cities are directly linked
• Of course, the distance flown and time spent flying and waiting are longer for hub-spokes
Networks_Intro.ppt © Daniel E. Whitney 46/44
Advantages of Graph Representations
• Abstraction • Sharp focus on relationships • Ability to calculate many relevant
properties of the modelled system, including many that accommodate huge graphs
Networks_Intro.ppt © Daniel E. Whitney 47/44
Disadvantages
• Multiple properties often require separate graphs
• Limited kinds of structures can be represented – Can’t handle ternary relationships
• Nodes and links are usually treated as identical – Exceptions: links with costs, bounded flow or one-way
flow, nodes classified as toll-takers, sources, sinks, and pass-throughs
• Theory does not deal with the graph as a whole the way, say, set theory does
Networks_Intro.ppt © Daniel E. Whitney 48/44

MIT OpenCourseWarehttp://ocw.mit.edu
ESD.342 Network Representations of Complex Engineering Systems Spring 2010
For information about citing these materials or our Terms of Use, visit: http://ocw.mit.edu/terms.
Related Documents