Network stability through homeostatic scaling of excitatory and inhibitory synapses following inactivity in CA3 of rat organotypic hippocampal slice cultures Lucy E. Buckby, 1 Thomas P. Jensen, 1 Paul J.E. Smith, and Ruth M. Empson * School of Biological Sciences, Royal Holloway University of London, Egham, Surrey TW20 0EX, UK Received 4 October 2005; revised 6 December 2005; accepted 11 January 2006 Available online 24 February 2006 Homeostatic plasticity is a phenomenon whereby synaptic strength is scaled in the context of the activity that the network receives. Here, we have analysed excitatory and inhibitory synapses in a model of homeostatic plasticity where rat organotypic hippocampal slice cultures were deprived of excitatory synaptic input by the NMDA and AMPA/KA glutamate receptor antagonists, AP5 and CNQX. We show that chronic excitatory synapse deprivation generates an excitable CA3 network where enhanced amplitude and frequency of spontaneous excitatory post-synaptic potentials were associated with increased glutamate receptor subunit expression and increased number and size of synapsin 1 and VGLUT1 positive puncta. Intact spontaneous inhibitory post-synaptic potentials coincided with persis- tent expression of the GABA-A receptor alpha subunit and GAD65 and an enhancement of parvalbumin-positive puncta. In this model of homeostatic plasticity, scaling up of synaptic excitation and mainte- nance of fast synaptic inhibition promote an excitable, but stable, CA3 network. D 2006 Elsevier Inc. All rights reserved. Keywords: Hippocampus; Synapsin 1; Glutamate; VGLUT1; Synapsin 1; GABA; GABA-A receptor; NR1; GluR1; Homeostatic plasticity; Homeo- static scaling; EPSP; IPSP Introduction Over the past decade, there has been a transformation in our understanding of activity-dependent synaptic plasticity especially regarding the development and refinement of synaptic connections. Throughout life, axonal arbours and synaptic connections are continuously reshaped, refined and reconfigured by activity- dependent mechanisms (Goodman and Shatz, 1993; Munno and Syed, 2003). These activity-dependent mechanisms can be cate- gorised into Hebbian plasticity including long-term potentiation and depression (LTP and LTD) and homeostatic plasticity (Turrigiano et al., 1998; Davis and Bezprozvanny, 2001; Burrone and Murthy, 2003). Hebbian and homeostatic plasticity are complementary yet contrasting. Whilst Hebbian plasticity can act to destabilise neuronal networks in either a positive or negative direction, homeostatic plasticity promotes network stabilisation by returning synaptic strength and neuronal firing to within a set range (Turrigiano, 1999; Turrigiano and Nelson, 2004; Burrone and Murthy, 2003). The concept of physiological homeostasis was originally championed by Cannon in 1932 (Cannon, 1939). However, the idea that neuronal networks could undergo the same form of adaptation was only recently suggested (Davis and Goodman, 1998; Turrigiano et al., 1998). This may be because up until recently, the idea seemed contradictory, how can homeostatic regulation of neuronal activity also permit the changes in synaptic strength required by Hebbian plasticity and learning ? Rather, the view is that instead of returning neuronal activity to a fixed level, homeostatic plasticity acts like a Fnet_ ensuring that neuronal networks do not reach the extremes of their activity. This is particularly important for highly epileptogenic structures such as the hippocampus and cortex. The classical way to model homeostatic plasticity is to subject neurones to a period of long-term inactivity or overactivity. Previous studies examining homeostatic plasticity in a variety of neuronal preparations have reported increases in neuronal excitation entirely consistent with the network acting to correct the inactivity by upregulating synaptic excitation. This has been measured as an increase in the amplitude and frequency of spontaneous miniature excitatory post-synaptic currents (mEPSCs) indicating direct changes in the properties of the synapse, increases in glutamate receptor expression (O’Brien et al., 1998; Turrigiano et al., 1998; Watt et al., 2000; Bacci et al., 2001; Burrone et al., 2002; Kilman et al., 2002; Galvan et al., 2003) and increases in synapse size, including the pre-synaptic active zone and number of vesicles (Murthy et al., 2001; De Gois et al., 2005). Although homeostatic plasticity has been examined in dispersed primary cortical and hippocampal cultures, there are fewer examples 1044-7431/$ - see front matter D 2006 Elsevier Inc. All rights reserved. doi:10.1016/j.mcn.2006.01.009 * Corresponding author. Fax: +44 1784 434326. E-mail address: [email protected] (R.M. Empson). 1 These authors contributed equally to this work. Available online on ScienceDirect (www.sciencedirect.com). www.elsevier.com/locate/ymcne Mol. Cell. Neurosci. 31 (2006) 805 – 816

Welcome message from author
This document is posted to help you gain knowledge. Please leave a comment to let me know what you think about it! Share it to your friends and learn new things together.
Transcript
www.elsevier.com/locate/ymcne
Mol. Cell. Neurosci. 31 (2006) 805 – 816
Network stability through homeostatic scaling of excitatory and
inhibitory synapses following inactivity in CA3 of rat organotypic
hippocampal slice cultures
Lucy E. Buckby,1 Thomas P. Jensen,1 Paul J.E. Smith, and Ruth M. Empson*
School of Biological Sciences, Royal Holloway University of London, Egham, Surrey TW20 0EX, UK
Received 4 October 2005; revised 6 December 2005; accepted 11 January 2006
Available online 24 February 2006
Homeostatic plasticity is a phenomenon whereby synaptic strength is
scaled in the context of the activity that the network receives. Here, we
have analysed excitatory and inhibitory synapses in a model of
homeostatic plasticity where rat organotypic hippocampal slice
cultures were deprived of excitatory synaptic input by the NMDA
and AMPA/KA glutamate receptor antagonists, AP5 and CNQX. We
show that chronic excitatory synapse deprivation generates an
excitable CA3 network where enhanced amplitude and frequency of
spontaneous excitatory post-synaptic potentials were associated with
increased glutamate receptor subunit expression and increased
number and size of synapsin 1 and VGLUT1 positive puncta. Intact
spontaneous inhibitory post-synaptic potentials coincided with persis-
tent expression of the GABA-A receptor alpha subunit and GAD65
and an enhancement of parvalbumin-positive puncta. In this model of
homeostatic plasticity, scaling up of synaptic excitation and mainte-
nance of fast synaptic inhibition promote an excitable, but stable, CA3
network.
D 2006 Elsevier Inc. All rights reserved.
Keywords: Hippocampus; Synapsin 1; Glutamate; VGLUT1; Synapsin 1;
GABA; GABA-A receptor; NR1; GluR1; Homeostatic plasticity; Homeo-
static scaling; EPSP; IPSP
Introduction
Over the past decade, there has been a transformation in our
understanding of activity-dependent synaptic plasticity especially
regarding the development and refinement of synaptic connections.
Throughout life, axonal arbours and synaptic connections are
continuously reshaped, refined and reconfigured by activity-
dependent mechanisms (Goodman and Shatz, 1993; Munno and
Syed, 2003). These activity-dependent mechanisms can be cate-
1044-7431/$ - see front matter D 2006 Elsevier Inc. All rights reserved.
doi:10.1016/j.mcn.2006.01.009
* Corresponding author. Fax: +44 1784 434326.
E-mail address: [email protected] (R.M. Empson).1 These authors contributed equally to this work.
Available online on ScienceDirect (www.sciencedirect.com).
gorised into Hebbian plasticity including long-term potentiation and
depression (LTP and LTD) and homeostatic plasticity (Turrigiano et
al., 1998; Davis and Bezprozvanny, 2001; Burrone and Murthy,
2003). Hebbian and homeostatic plasticity are complementary yet
contrasting.Whilst Hebbian plasticity can act to destabilise neuronal
networks in either a positive or negative direction, homeostatic
plasticity promotes network stabilisation by returning synaptic
strength and neuronal firing to within a set range (Turrigiano, 1999;
Turrigiano and Nelson, 2004; Burrone and Murthy, 2003).
The concept of physiological homeostasis was originally
championed by Cannon in 1932 (Cannon, 1939). However, the
idea that neuronal networks could undergo the same form of
adaptation was only recently suggested (Davis and Goodman,
1998; Turrigiano et al., 1998). This may be because up until
recently, the idea seemed contradictory, how can homeostatic
regulation of neuronal activity also permit the changes in synaptic
strength required by Hebbian plasticity and learning ? Rather, the
view is that instead of returning neuronal activity to a fixed level,
homeostatic plasticity acts like a Fnet_ ensuring that neuronal
networks do not reach the extremes of their activity. This is
particularly important for highly epileptogenic structures such as
the hippocampus and cortex.
The classical way to model homeostatic plasticity is to subject
neurones to a period of long-term inactivity or overactivity.
Previous studies examining homeostatic plasticity in a variety of
neuronal preparations have reported increases in neuronal excitation
entirely consistent with the network acting to correct the inactivity
by upregulating synaptic excitation. This has been measured as an
increase in the amplitude and frequency of spontaneous miniature
excitatory post-synaptic currents (mEPSCs) indicating direct
changes in the properties of the synapse, increases in glutamate
receptor expression (O’Brien et al., 1998; Turrigiano et al., 1998;
Watt et al., 2000; Bacci et al., 2001; Burrone et al., 2002; Kilman et
al., 2002; Galvan et al., 2003) and increases in synapse size,
including the pre-synaptic active zone and number of vesicles
(Murthy et al., 2001; De Gois et al., 2005).
Although homeostatic plasticity has been examined in dispersed
primary cortical and hippocampal cultures, there are fewer examples
L.E. Buckby et al. / Mol. Cell. Neurosci. 31 (2006) 805–816806
where the consequences of changes in synaptic excitation within
intact neuronal networks have been studied (Aptowicz et al., 2004;
Galvan et al., 2003; Royer and Pare, 2003). There are fewer studies
where the impact of changes in synaptic inhibition has been
examined. Intuitively, homeostatic plasticity in a neuronal network
deprived of excitatory synapse input should down-scale synaptic
inhibition, as it can be argued that it is not required. This is the case
in dispersed neocortical cultures where homeostatic plasticity
reduces the frequency of miniature inhibitory post-synaptic currents
(mIPSCs) (Kilman et al., 2002); however, this could have grave
consequences to additionally destabilise the network in the presence
of enhanced excitation.
In the present study, we therefore chose to examine the
phenomenon of homeostatic plasticity using organotypic hippo-
campal slice cultures where both synaptic excitation and inhibition
exist together to balance the output properties of the hippocampus
(Stoppini et al., 1991). To do this, we subjected developing
hippocampal slice cultures to a period of synapse inactivity by the
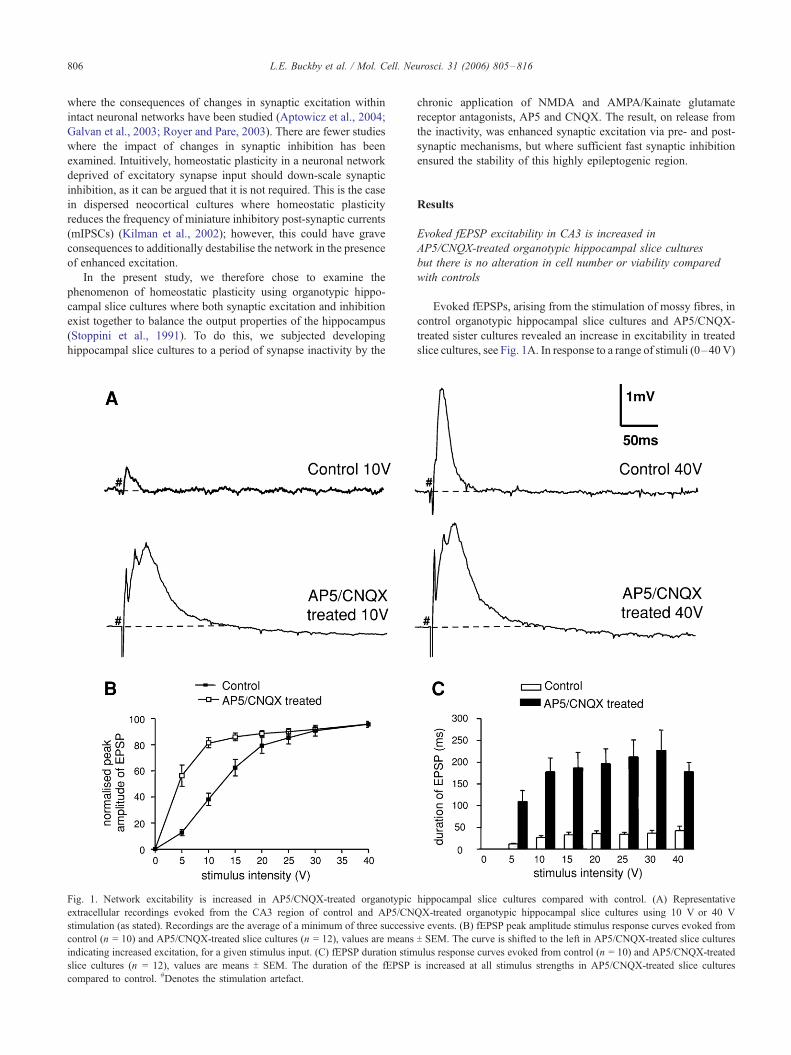
Fig. 1. Network excitability is increased in AP5/CNQX-treated organotypic
extracellular recordings evoked from the CA3 region of control and AP5/CN
stimulation (as stated). Recordings are the average of a minimum of three successi
control (n = 10) and AP5/CNQX-treated slice cultures (n = 12), values are means
indicating increased excitation, for a given stimulus input. (C) fEPSP duration stim
slice cultures (n = 12), values are means T SEM. The duration of the fEPSP
compared to control. #Denotes the stimulation artefact.
chronic application of NMDA and AMPA/Kainate glutamate
receptor antagonists, AP5 and CNQX. The result, on release from
the inactivity, was enhanced synaptic excitation via pre- and post-
synaptic mechanisms, but where sufficient fast synaptic inhibition
ensured the stability of this highly epileptogenic region.
Results
Evoked fEPSP excitability in CA3 is increased in
AP5/CNQX-treated organotypic hippocampal slice cultures
but there is no alteration in cell number or viability compared
with controls
Evoked fEPSPs, arising from the stimulation of mossy fibres, in
control organotypic hippocampal slice cultures and AP5/CNQX-
treated sister cultures revealed an increase in excitability in treated
slice cultures, see Fig. 1A. In response to a range of stimuli (0–40V)
hippocampal slice cultures compared with control. (A) Representative
QX-treated organotypic hippocampal slice cultures using 10 V or 40 V
ve events. (B) fEPSP peak amplitude stimulus response curves evoked from
T SEM. The curve is shifted to the left in AP5/CNQX-treated slice cultures
ulus response curves evoked from control (n = 10) and AP5/CNQX-treated
is increased at all stimulus strengths in AP5/CNQX-treated slice cultures
L.E. Buckby et al. / Mol. Cell. Neurosci. 31 (2006) 805–816 807
applied in CA3c/d, stimulus–response curves for fEPSP peak
amplitudes (Fig. 1B) and duration (Fig. 1C) from AP5/CNQX-
treated organotypic hippocampal slice cultures were shifted to the
left of those from control slice cultures, indicating an increase in the
excitability of the CA3 network, although as seen in Fig. 1B, a
graded response could still be observed from the more excitable,
treated slice cultures. The fEPSP peak amplitude stimulus–response
curve of AP5/CNQX-treated slice cultures (Fig. 1B) had a steeper
gradient between 0 and 10 V, 8.2 mV/V compared to 3.8 mV/V for
control slice cultures; a higher normalised fEPSP peak amplitude at
10 V, 81.5 T 3.9% of maximum (n = 14) compared to 38.1 T 4.8% for
control slice cultures (P < 0.001, t test, n = 10, Fig. 1B) and a lower
50% stimulation value (the stimulus strength required to evoke the
half-maximal fEPSP peak amplitude) 5.3 V, a third of the
stimulation required in control slice cultures, 15 V. The mean
duration of the evoked fEPSPs in AP5/CNQX-treated slice cultures
was also increased at all stimulus strengths (P < 0.001, t test, n =
10). As seen in Figs. 1A and C, the duration of fEPSPs evoked in
AP5/CNQX-treated slice cultures was increased compared with
control responses, from 27 T 4 ms and 42 T 10 ms (n = 10), at 10 V
and 40 V, respectively, in control slice cultures, to 178 T 31 ms and
178 T 21 ms (n = 14), respectively, in AP5/CNQX-treated slice
cultures. We also examined the fEPSPs in control slice cultures for
their mossy fibre component using the metabotropic glutamate
receptor type II agonist DCGIV (5 AM). Application of DCGIV
reduced the peak amplitude of evoked fEPSPs by 66.9 T 4.1% (P <
0.0001, n = 16, t test), indicating that the evoked CA3 fEPSPs were
approximately 65% mossy fibre-derived.
Despite the clear increase in the amplitude and duration of the
evoked fEPSP responses in the AP5/CNQX-treated slice cultures,
we never observed any spontaneous epileptiform activity. All
indications from these electrophysiology experiments indicated
that despite chronic incubation with glutamate receptor antago-
nists, the responses from the AP5/CNQX-treated slice cultures
were excitable but stable. Further parallel experiments showed
that there was no significant loss or gain of neurones or glia, or
any changes in slice culture thickness in the AP5/CNQX-treated
slice cultures compared with control. Estimations of the area of
living (calcein-stained) regions in both CA3 and CA1 revealed
no significant differences between control and AP5/CNQX-
treated slice cultures at 2, 4 and 6 DIV (P = 0.23, ANOVA, n = 4
slice cultures for each time point and condition), consistent with
no detectable changes in slice culture thickness (P = 0.1, ANOVA,
n = 3 slice cultures for each time point and condition). Neither
was there any change in the intensity or area of dead (propidium
iodide-stained) neurones at all ages (P = 0.99, P = 0.85,
respectively, ANOVA, n = 4 slice cultures for each time point
and condition) in slice cultures from AP5/CNQX-treated and
control conditions, nor in the expression of the glial cell marker
protein GFAP within the CA3 cell layer of control and AP5/
CNQX-treated slice cultures (P = 0.37, t test, n = 13). All these
results confirmed that the observed network excitability in the
AP5/CNQX-treated slice cultures was unlikely to be a result of
the loss or gain of neurones or glial cells. We also tested the
reversibility of the alterations in excitability within our chronic
AP5 and CNQX model. If we treated slice cultures for only 1–2
days with AP5 and CNQX (instead of 7 days), we observed a
similar and also reversible enhancement to the excitability, as
described above. In contrast, after 7 days treatment with AP5 and
CNQX, the alterations to the excitability were not easily
reversed.
The amplitude and frequency of spontaneous EPSPs were
increased in CA3 pyramidal neurones from AP5/CNQX-treated
organotypic hippocampal slice cultures compared with controls
Whole cell recordings of spontaneous excitatory post-synaptic
potentials (spEPSPs) from pyramidal cells held at hyperpolarised
levels (Fig. 2A, to similar levels across control and AP5/CNQX-
treated cells) revealed a large increase in the amplitude and
frequency of the spEPSPs from AP5/CNQX-treated cells (n = 7)
compared with control (n = 9), across all spEPSPs within the
recorded population, as shown in Fig. 2B (P < 0.0001, ANOVA,
n = 16). We also detected an alteration in the mean frequency of
spEPSPs, as shown in Fig. 2C, where mean values changed from
3.2 T 1.0 spEPSP per second in cells from control slice cultures to
11.8 T 1.9 spEPSPs per second in cells from AP5/CNQX-treated
slice cultures (P < 0.001, t test, n = 16). None of the cells from
either the control slice cultures or the AP5/CNQX-treated slice
cultures demonstrated epileptiform behaviour in the form of
spontaneous bursts of action potentials or synchronous and
spontaneous depolarising shifts, even when depolarised. However,
we did observe a slightly depolarised average resting membrane
potential in the cells from the AP5/CNQX-treated slice cultures.
The mean resting potential in cells from control slice cultures was
�66 T 1 mV compared with�62 T 1 mV in cells from AP5/CNQX-
treated slice cultures (P < 0.05, t test, n = 16). Added to this, the
cells from the AP5/CNQX-treated slice cultures also demonstrated
a slightly enhanced input resistance; mean values were 305 T 24
MV in control cells compared with 368 T 19 MV in cells from AP5/
CNQX-treated slice cultures (P < 0.05, t test, n = 16).
Our electrophysiological recordings revealed excitable but
stable cells and slice cultures following chronic AP5/CNQX
treatment. In order to further explain our results thus far, we
conducted parallel Western blotting experiments to identify any
changes in the expression of excitatory synaptic proteins at both
the pre- and post-synaptic level.
Enhanced expression of the excitatory post-synaptic receptors
GluR1 and NR1 in AP5/CNQX-treated organotypic hippocampal
slice cultures compared with controls in the absence of any change
in expression of post-synaptic protein markers PSD95 and SAP102
As shown in Fig. 3A, we identified an approximately 50%
increase in the expression of the AMPA and NMDA receptor
subunits GluR1 and NR1 in the AP5/CNQX-treated slice cultures.
Mean NR1 expression increased to 136.4 T 13.1% of the control
value (P < 0.05, t test, n = 3) and mean GluR1 expression increased
to 140 T 14.4% of the control value (P < 0.05, t test, n = 3).
Western blot analysis of the post-synaptic proteins SAP102 and
PSD95, however, showed no alteration in their expression in slice
cultures from control or AP5/CNQX-treated slice cultures, as
shown in Fig. 3B. Mean values of PSD95 and SAP102 expression
from control and AP5/CNQX-treated slice cultures remained
similar at 95 T 12% and 94 T 11% of control values, respectively
(P = 0.47, t test, n = 8 and P = 0.57, t test, n = 4, respectively).
Excitatory synapse pre-synaptic marker protein expression was
also enhanced in AP5/CNQX-treated organotypic hippocampal
slice cultures compared with controls
Homeostatic scaling of synaptic strength in a variety of
models involves pre- and/or post-synaptic changes at excitatory
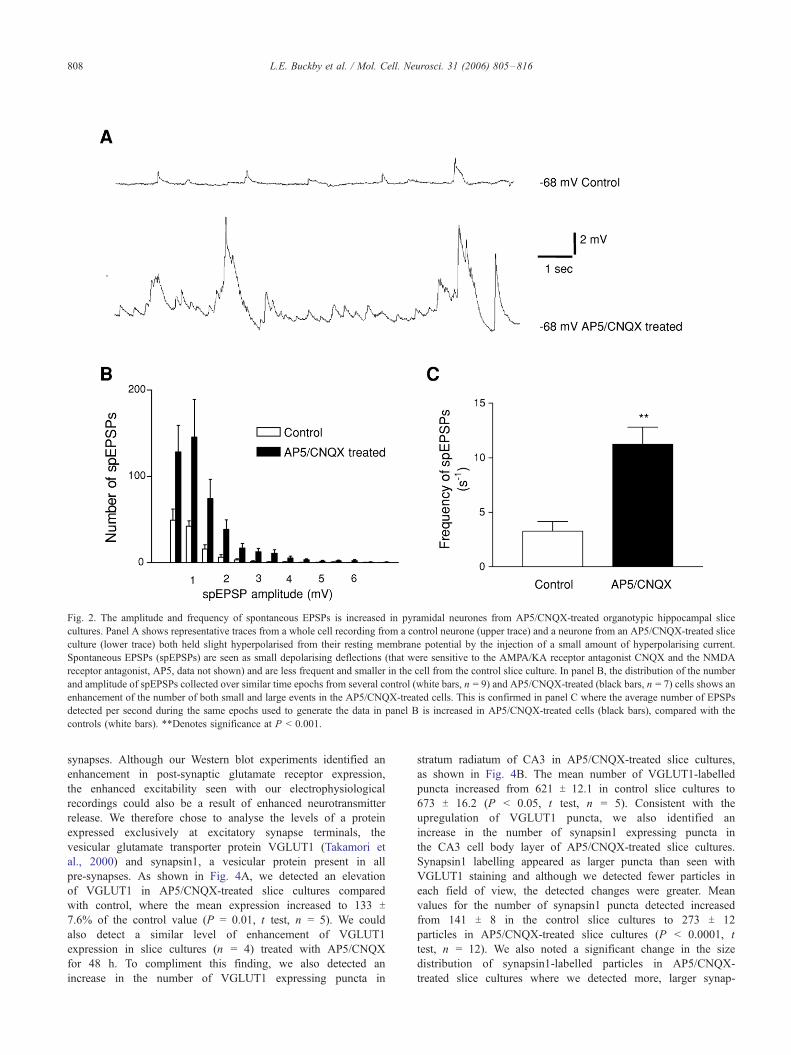
Fig. 2. The amplitude and frequency of spontaneous EPSPs is increased in pyramidal neurones from AP5/CNQX-treated organotypic hippocampal slice
cultures. Panel A shows representative traces from a whole cell recording from a control neurone (upper trace) and a neurone from an AP5/CNQX-treated slice
culture (lower trace) both held slight hyperpolarised from their resting membrane potential by the injection of a small amount of hyperpolarising current.
Spontaneous EPSPs (spEPSPs) are seen as small depolarising deflections (that were sensitive to the AMPA/KA receptor antagonist CNQX and the NMDA
receptor antagonist, AP5, data not shown) and are less frequent and smaller in the cell from the control slice culture. In panel B, the distribution of the number
and amplitude of spEPSPs collected over similar time epochs from several control (white bars, n = 9) and AP5/CNQX-treated (black bars, n = 7) cells shows an
enhancement of the number of both small and large events in the AP5/CNQX-treated cells. This is confirmed in panel C where the average number of EPSPs
detected per second during the same epochs used to generate the data in panel B is increased in AP5/CNQX-treated cells (black bars), compared with the
controls (white bars). **Denotes significance at P < 0.001.
L.E. Buckby et al. / Mol. Cell. Neurosci. 31 (2006) 805–816808
synapses. Although our Western blot experiments identified an
enhancement in post-synaptic glutamate receptor expression,
the enhanced excitability seen with our electrophysiological
recordings could also be a result of enhanced neurotransmitter
release. We therefore chose to analyse the levels of a protein
expressed exclusively at excitatory synapse terminals, the
vesicular glutamate transporter protein VGLUT1 (Takamori et
al., 2000) and synapsin1, a vesicular protein present in all
pre-synapses. As shown in Fig. 4A, we detected an elevation
of VGLUT1 in AP5/CNQX-treated slice cultures compared
with control, where the mean expression increased to 133 T7.6% of the control value (P = 0.01, t test, n = 5). We could
also detect a similar level of enhancement of VGLUT1
expression in slice cultures (n = 4) treated with AP5/CNQX
for 48 h. To compliment this finding, we also detected an
increase in the number of VGLUT1 expressing puncta in
stratum radiatum of CA3 in AP5/CNQX-treated slice cultures,
as shown in Fig. 4B. The mean number of VGLUT1-labelled
puncta increased from 621 T 12.1 in control slice cultures to
673 T 16.2 (P < 0.05, t test, n = 5). Consistent with the
upregulation of VGLUT1 puncta, we also identified an
increase in the number of synapsin1 expressing puncta in
the CA3 cell body layer of AP5/CNQX-treated slice cultures.
Synapsin1 labelling appeared as larger puncta than seen with
VGLUT1 staining and although we detected fewer particles in
each field of view, the detected changes were greater. Mean
values for the number of synapsin1 puncta detected increased
from 141 T 8 in the control slice cultures to 273 T 12
particles in AP5/CNQX-treated slice cultures (P < 0.0001, t
test, n = 12). We also noted a significant change in the size
distribution of synapsin1-labelled particles in AP5/CNQX-
treated slice cultures where we detected more, larger synap-
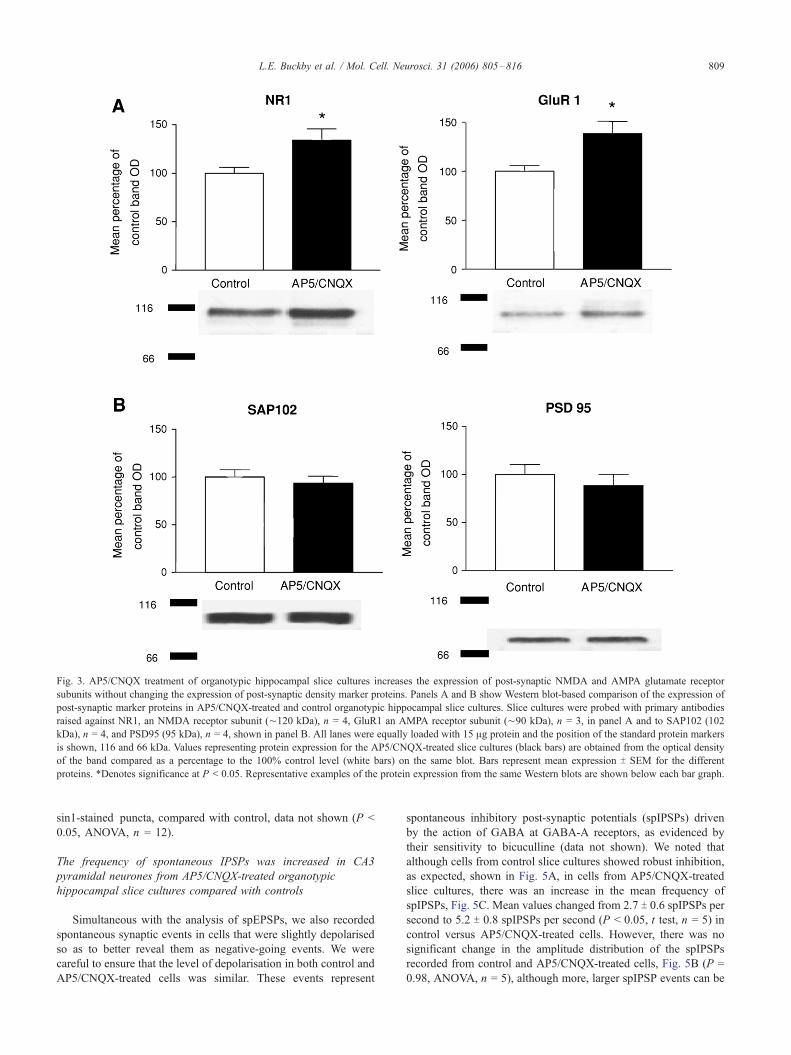
Fig. 3. AP5/CNQX treatment of organotypic hippocampal slice cultures increases the expression of post-synaptic NMDA and AMPA glutamate receptor
subunits without changing the expression of post-synaptic density marker proteins. Panels A and B show Western blot-based comparison of the expression of
post-synaptic marker proteins in AP5/CNQX-treated and control organotypic hippocampal slice cultures. Slice cultures were probed with primary antibodies
raised against NR1, an NMDA receptor subunit (¨120 kDa), n = 4, GluR1 an AMPA receptor subunit (¨90 kDa), n = 3, in panel A and to SAP102 (102
kDa), n = 4, and PSD95 (95 kDa), n = 4, shown in panel B. All lanes were equally loaded with 15 Ag protein and the position of the standard protein markers
is shown, 116 and 66 kDa. Values representing protein expression for the AP5/CNQX-treated slice cultures (black bars) are obtained from the optical density
of the band compared as a percentage to the 100% control level (white bars) on the same blot. Bars represent mean expression T SEM for the different
proteins. *Denotes significance at P < 0.05. Representative examples of the protein expression from the same Western blots are shown below each bar graph.
L.E. Buckby et al. / Mol. Cell. Neurosci. 31 (2006) 805–816 809
sin1-stained puncta, compared with control, data not shown (P <
0.05, ANOVA, n = 12).
The frequency of spontaneous IPSPs was increased in CA3
pyramidal neurones from AP5/CNQX-treated organotypic
hippocampal slice cultures compared with controls
Simultaneous with the analysis of spEPSPs, we also recorded
spontaneous synaptic events in cells that were slightly depolarised
so as to better reveal them as negative-going events. We were
careful to ensure that the level of depolarisation in both control and
AP5/CNQX-treated cells was similar. These events represent
spontaneous inhibitory post-synaptic potentials (spIPSPs) driven
by the action of GABA at GABA-A receptors, as evidenced by
their sensitivity to bicuculline (data not shown). We noted that
although cells from control slice cultures showed robust inhibition,
as expected, shown in Fig. 5A, in cells from AP5/CNQX-treated
slice cultures, there was an increase in the mean frequency of
spIPSPs, Fig. 5C. Mean values changed from 2.7 T 0.6 spIPSPs persecond to 5.2 T 0.8 spIPSPs per second (P < 0.05, t test, n = 5) in
control versus AP5/CNQX-treated cells. However, there was no
significant change in the amplitude distribution of the spIPSPs
recorded from control and AP5/CNQX-treated cells, Fig. 5B (P =
0.98, ANOVA, n = 5), although more, larger spIPSP events can be
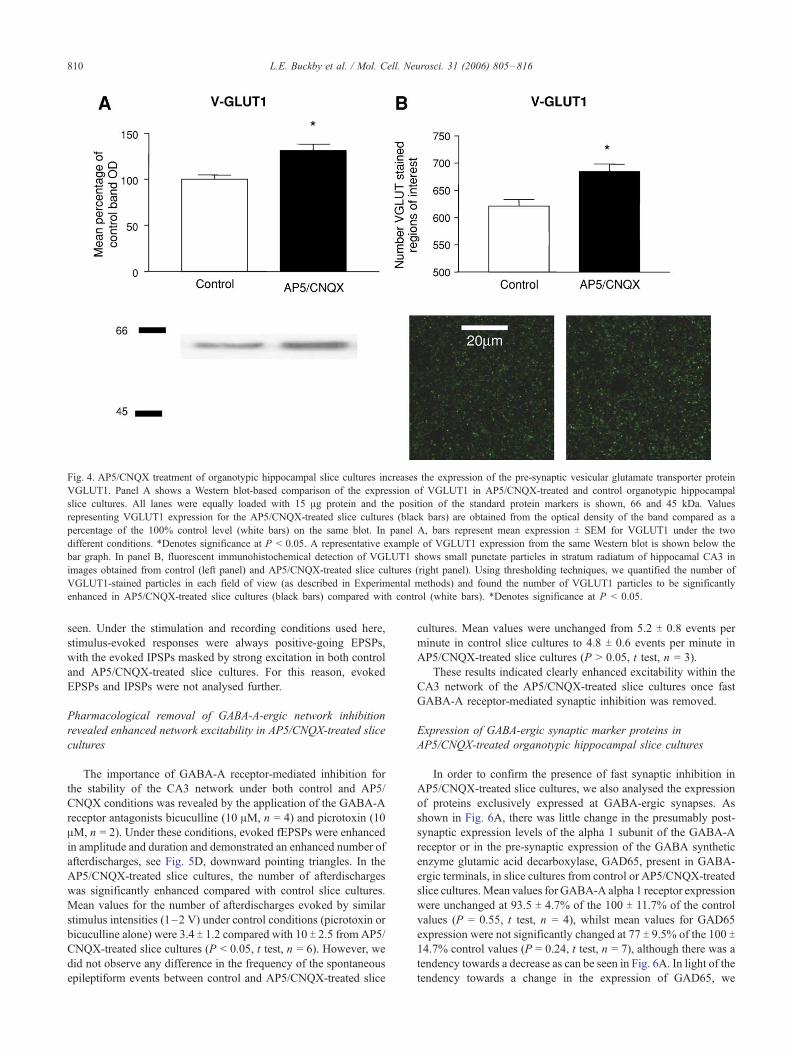
Fig. 4. AP5/CNQX treatment of organotypic hippocampal slice cultures increases the expression of the pre-synaptic vesicular glutamate transporter protein
VGLUT1. Panel A shows a Western blot-based comparison of the expression of VGLUT1 in AP5/CNQX-treated and control organotypic hippocampal
slice cultures. All lanes were equally loaded with 15 Ag protein and the position of the standard protein markers is shown, 66 and 45 kDa. Values
representing VGLUT1 expression for the AP5/CNQX-treated slice cultures (black bars) are obtained from the optical density of the band compared as a
percentage of the 100% control level (white bars) on the same blot. In panel A, bars represent mean expression T SEM for VGLUT1 under the two
different conditions. *Denotes significance at P < 0.05. A representative example of VGLUT1 expression from the same Western blot is shown below the
bar graph. In panel B, fluorescent immunohistochemical detection of VGLUT1 shows small punctate particles in stratum radiatum of hippocamal CA3 in
images obtained from control (left panel) and AP5/CNQX-treated slice cultures (right panel). Using thresholding techniques, we quantified the number of
VGLUT1-stained particles in each field of view (as described in Experimental methods) and found the number of VGLUT1 particles to be significantly
enhanced in AP5/CNQX-treated slice cultures (black bars) compared with control (white bars). *Denotes significance at P < 0.05.
L.E. Buckby et al. / Mol. Cell. Neurosci. 31 (2006) 805–816810
seen. Under the stimulation and recording conditions used here,
stimulus-evoked responses were always positive-going EPSPs,
with the evoked IPSPs masked by strong excitation in both control
and AP5/CNQX-treated slice cultures. For this reason, evoked
EPSPs and IPSPs were not analysed further.
Pharmacological removal of GABA-A-ergic network inhibition
revealed enhanced network excitability in AP5/CNQX-treated slice
cultures
The importance of GABA-A receptor-mediated inhibition for
the stability of the CA3 network under both control and AP5/
CNQX conditions was revealed by the application of the GABA-A
receptor antagonists bicuculline (10 AM, n = 4) and picrotoxin (10
AM, n = 2). Under these conditions, evoked fEPSPs were enhanced
in amplitude and duration and demonstrated an enhanced number of
afterdischarges, see Fig. 5D, downward pointing triangles. In the
AP5/CNQX-treated slice cultures, the number of afterdischarges
was significantly enhanced compared with control slice cultures.
Mean values for the number of afterdischarges evoked by similar
stimulus intensities (1–2 V) under control conditions (picrotoxin or
bicuculline alone) were 3.4 T 1.2 compared with 10 T 2.5 from AP5/
CNQX-treated slice cultures (P < 0.05, t test, n = 6). However, we
did not observe any difference in the frequency of the spontaneous
epileptiform events between control and AP5/CNQX-treated slice
cultures. Mean values were unchanged from 5.2 T 0.8 events per
minute in control slice cultures to 4.8 T 0.6 events per minute in
AP5/CNQX-treated slice cultures (P > 0.05, t test, n = 3).
These results indicated clearly enhanced excitability within the
CA3 network of the AP5/CNQX-treated slice cultures once fast
GABA-A receptor-mediated synaptic inhibition was removed.
Expression of GABA-ergic synaptic marker proteins in
AP5/CNQX-treated organotypic hippocampal slice cultures
In order to confirm the presence of fast synaptic inhibition in
AP5/CNQX-treated slice cultures, we also analysed the expression
of proteins exclusively expressed at GABA-ergic synapses. As
shown in Fig. 6A, there was little change in the presumably post-
synaptic expression levels of the alpha 1 subunit of the GABA-A
receptor or in the pre-synaptic expression of the GABA synthetic
enzyme glutamic acid decarboxylase, GAD65, present in GABA-
ergic terminals, in slice cultures from control or AP5/CNQX-treated
slice cultures. Mean values for GABA-A alpha 1 receptor expression
were unchanged at 93.5 T 4.7% of the 100 T 11.7% of the control
values (P = 0.55, t test, n = 4), whilst mean values for GAD65
expression were not significantly changed at 77 T 9.5% of the 100 T14.7% control values (P = 0.24, t test, n = 7), although there was a
tendency towards a decrease as can be seen in Fig. 6A. In light of the
tendency towards a change in the expression of GAD65, we
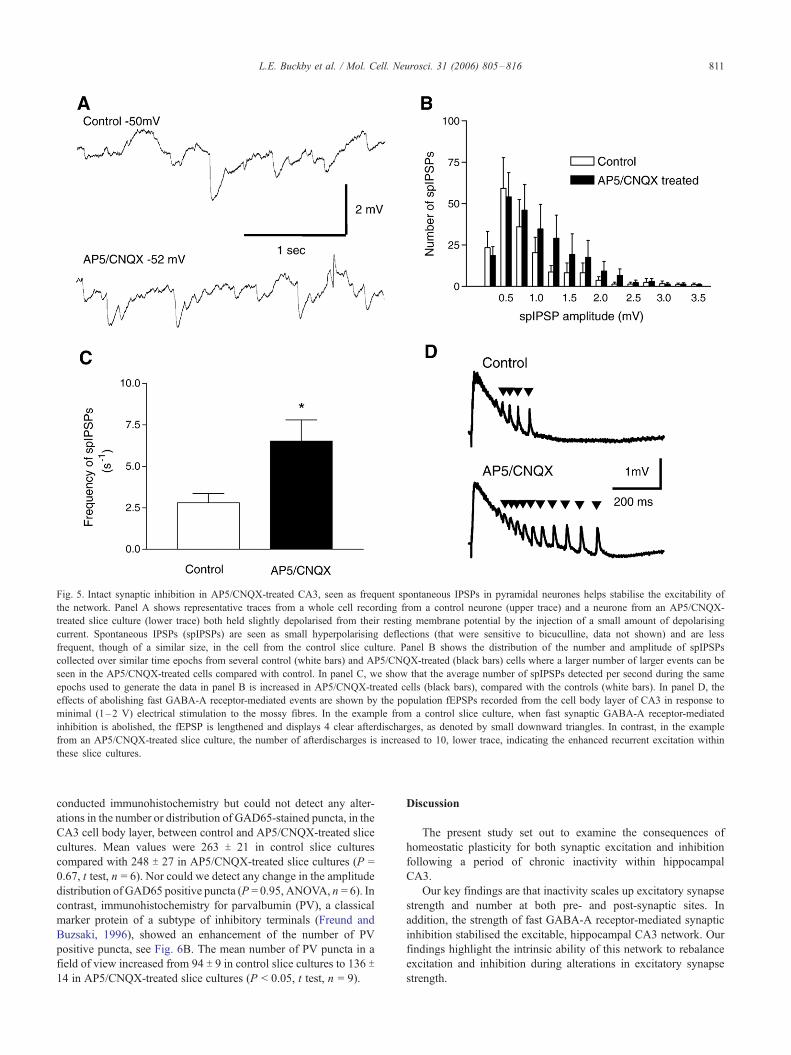
Fig. 5. Intact synaptic inhibition in AP5/CNQX-treated CA3, seen as frequent spontaneous IPSPs in pyramidal neurones helps stabilise the excitability of
the network. Panel A shows representative traces from a whole cell recording from a control neurone (upper trace) and a neurone from an AP5/CNQX-
treated slice culture (lower trace) both held slightly depolarised from their resting membrane potential by the injection of a small amount of depolarising
current. Spontaneous IPSPs (spIPSPs) are seen as small hyperpolarising deflections (that were sensitive to bicuculline, data not shown) and are less
frequent, though of a similar size, in the cell from the control slice culture. Panel B shows the distribution of the number and amplitude of spIPSPs
collected over similar time epochs from several control (white bars) and AP5/CNQX-treated (black bars) cells where a larger number of larger events can be
seen in the AP5/CNQX-treated cells compared with control. In panel C, we show that the average number of spIPSPs detected per second during the same
epochs used to generate the data in panel B is increased in AP5/CNQX-treated cells (black bars), compared with the controls (white bars). In panel D, the
effects of abolishing fast GABA-A receptor-mediated events are shown by the population fEPSPs recorded from the cell body layer of CA3 in response to
minimal (1–2 V) electrical stimulation to the mossy fibres. In the example from a control slice culture, when fast synaptic GABA-A receptor-mediated
inhibition is abolished, the fEPSP is lengthened and displays 4 clear afterdischarges, as denoted by small downward triangles. In contrast, in the example
from an AP5/CNQX-treated slice culture, the number of afterdischarges is increased to 10, lower trace, indicating the enhanced recurrent excitation within
these slice cultures.
L.E. Buckby et al. / Mol. Cell. Neurosci. 31 (2006) 805–816 811
conducted immunohistochemistry but could not detect any alter-
ations in the number or distribution of GAD65-stained puncta, in the
CA3 cell body layer, between control and AP5/CNQX-treated slice
cultures. Mean values were 263 T 21 in control slice cultures
compared with 248 T 27 in AP5/CNQX-treated slice cultures (P =
0.67, t test, n = 6). Nor could we detect any change in the amplitude
distribution of GAD65 positive puncta (P = 0.95, ANOVA, n = 6). In
contrast, immunohistochemistry for parvalbumin (PV), a classical
marker protein of a subtype of inhibitory terminals (Freund and
Buzsaki, 1996), showed an enhancement of the number of PV
positive puncta, see Fig. 6B. The mean number of PV puncta in a
field of view increased from 94 T 9 in control slice cultures to 136 T14 in AP5/CNQX-treated slice cultures (P < 0.05, t test, n = 9).
Discussion
The present study set out to examine the consequences of
homeostatic plasticity for both synaptic excitation and inhibition
following a period of chronic inactivity within hippocampal
CA3.
Our key findings are that inactivity scales up excitatory synapse
strength and number at both pre- and post-synaptic sites. In
addition, the strength of fast GABA-A receptor-mediated synaptic
inhibition stabilised the excitable, hippocampal CA3 network. Our
findings highlight the intrinsic ability of this network to rebalance
excitation and inhibition during alterations in excitatory synapse
strength.
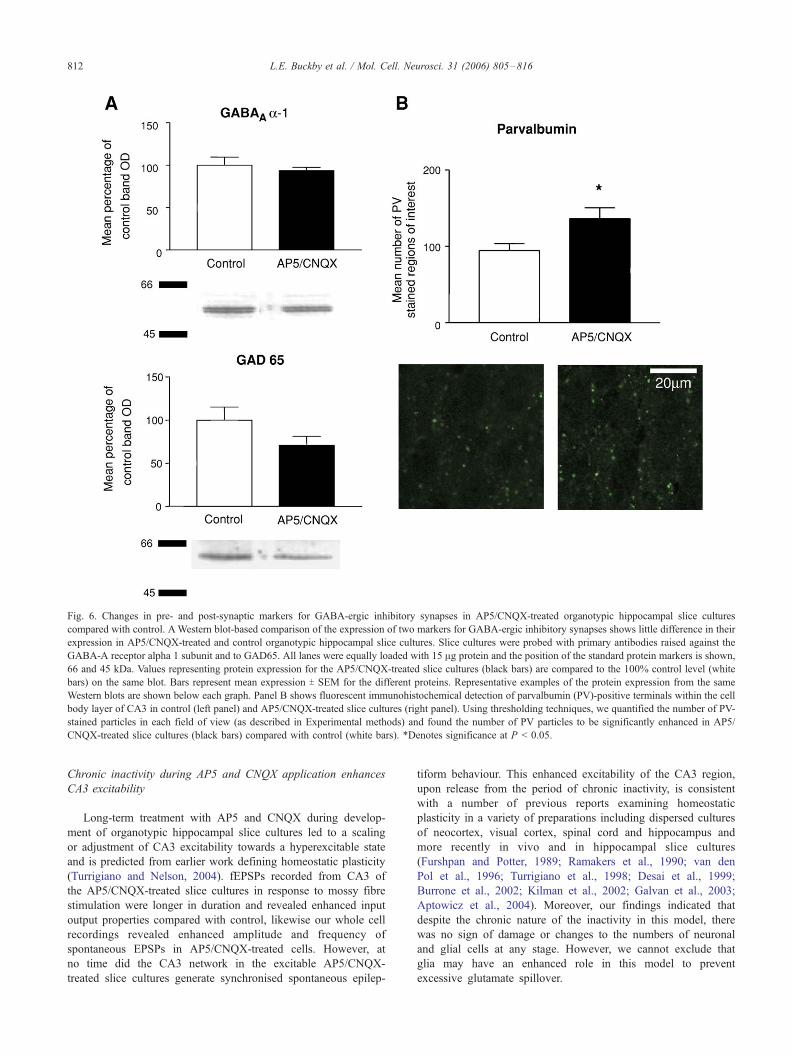
Fig. 6. Changes in pre- and post-synaptic markers for GABA-ergic inhibitory synapses in AP5/CNQX-treated organotypic hippocampal slice cultures
compared with control. AWestern blot-based comparison of the expression of two markers for GABA-ergic inhibitory synapses shows little difference in their
expression in AP5/CNQX-treated and control organotypic hippocampal slice cultures. Slice cultures were probed with primary antibodies raised against the
GABA-A receptor alpha 1 subunit and to GAD65. All lanes were equally loaded with 15 Ag protein and the position of the standard protein markers is shown,
66 and 45 kDa. Values representing protein expression for the AP5/CNQX-treated slice cultures (black bars) are compared to the 100% control level (white
bars) on the same blot. Bars represent mean expression T SEM for the different proteins. Representative examples of the protein expression from the same
Western blots are shown below each graph. Panel B shows fluorescent immunohistochemical detection of parvalbumin (PV)-positive terminals within the cell
body layer of CA3 in control (left panel) and AP5/CNQX-treated slice cultures (right panel). Using thresholding techniques, we quantified the number of PV-
stained particles in each field of view (as described in Experimental methods) and found the number of PV particles to be significantly enhanced in AP5/
CNQX-treated slice cultures (black bars) compared with control (white bars). *Denotes significance at P < 0.05.
L.E. Buckby et al. / Mol. Cell. Neurosci. 31 (2006) 805–816812
Chronic inactivity during AP5 and CNQX application enhances
CA3 excitability
Long-term treatment with AP5 and CNQX during develop-
ment of organotypic hippocampal slice cultures led to a scaling
or adjustment of CA3 excitability towards a hyperexcitable state
and is predicted from earlier work defining homeostatic plasticity
(Turrigiano and Nelson, 2004). fEPSPs recorded from CA3 of
the AP5/CNQX-treated slice cultures in response to mossy fibre
stimulation were longer in duration and revealed enhanced input
output properties compared with control, likewise our whole cell
recordings revealed enhanced amplitude and frequency of
spontaneous EPSPs in AP5/CNQX-treated cells. However, at
no time did the CA3 network in the excitable AP5/CNQX-
treated slice cultures generate synchronised spontaneous epilep-
tiform behaviour. This enhanced excitability of the CA3 region,
upon release from the period of chronic inactivity, is consistent
with a number of previous reports examining homeostatic
plasticity in a variety of preparations including dispersed cultures
of neocortex, visual cortex, spinal cord and hippocampus and
more recently in vivo and in hippocampal slice cultures
(Furshpan and Potter, 1989; Ramakers et al., 1990; van den
Pol et al., 1996; Turrigiano et al., 1998; Desai et al., 1999;
Burrone et al., 2002; Kilman et al., 2002; Galvan et al., 2003;
Aptowicz et al., 2004). Moreover, our findings indicated that
despite the chronic nature of the inactivity in this model, there
was no sign of damage or changes to the numbers of neuronal
and glial cells at any stage. However, we cannot exclude that
glia may have an enhanced role in this model to prevent
excessive glutamate spillover.
L.E. Buckby et al. / Mol. Cell. Neurosci. 31 (2006) 805–816 813
Increased expression of excitatory pre- and post-synaptic proteins
underlies the enhanced excitability in CA3
Consistent with our electrophysiological recordings, we
detected enhancements specifically to excitatory synaptic trans-
mission at both post-synaptic and pre-synaptic sites within the
AP5/CNQX-treated slice cultures.
Firstly, as also shown by others (Watt et al., 2000; Galvan et al.,
2003), we observed an increased expression of GluR1 and NR1
receptor subunits in the AP5/CNQX-treated slice cultures. This
suggests that homeostatic plasticity requires stable parallel
increases in both GluR1 and NR1 expression at the post-synaptic
site and is consistent with the results shown by others (O’Brien et
al., 1998; Watt et al., 2000; Galvan et al., 2003), bar one (Rao and
Craig, 1997). More recently, enhanced expressions of Ca2+
permeable GluR1 homomers (Thiagarajan et al., 2005), and GluR2
subunits (Wierenga et al., 2005), as well as NR1, and also
selectively the NR2B subunit (Galvan et al., 2003; Slutsky et al.,
2004) have been suggested as candidates to drive homeostatic
plasticity. Despite the upregulation of glutamate receptor expres-
sion in this model, we did not detect any changes in the expression
of two post-synaptic density (PSD) proteins, PSD95 and SAP102,
in the AP5/CNQX-treated slice cultures (Okabe et al., 1999; Qin et
al., 2001). This may suggest that the PSD remains the same size
during synapse scaling but contains a higher density of glutamate
receptors. Alternatively, our results do not exclude the possibility
of insertion of new extrasynaptic glutamate receptors (Kullmann
and Asztely, 1998).
Secondly, we detected an increase in the expression of two pre-
synaptic marker proteins. Synapsin1 expressing puncta were
increased both in number and size in AP5/CNQX-treated slice
cultures and this result points to an increased number of vesicles
and a larger readily releasable pool (Murthy et al., 2001;
Thiagarajan et al., 2005) as well as the appearance of new release
sites containing any transmitter, whether excitatory or inhibitory.
Consistent with our findings in the hippocampus, earlier work also
detected increased synaptophysin expression and distribution in
hippocampal neurones both in vivo (Galvan et al., 2003) and in
dispersed hippocampal cultures (Murthy et al., 2001) whereas in
the neocortex synapsin1 staining is unchanged (Turrigiano et al.,
1998; Kilman et al., 2002). We therefore chose to refine our
approach by analysing the expression and distribution of
VGLUT1, one of a family of glutamate transporter proteins
expressed exclusively on glutamate-containing vesicles within
excitatory synaptic terminals (Takamori et al., 2000). Here, in
AP5/CNQX-treated slice cultures, VGLUT1 levels were enhanced
compared with control, a finding also confirmed by a significant
increase in the number of VGLUT1-stained particles specifically in
stratum radiatum of CA3 where VGLUT1 dominates (Wojcik et
al., 2004). Recently, overexpression of VGLUT1 has revealed an
enhanced amplitude of hippocampal mEPSCs with good evidence
for enhanced glutamate release per vesicle (Wilson et al., 2005). In
light of our findings here in hippocampal CA3, the increased
VGLUT1 expression and distribution are consistent with our
observed increased amplitude and number of spEPSPs and mossy
fibre-stimulated excitability. VGLUT1 expression has also recently
been shown to change in line with bidirectional scaling of
excitatory synapses in both hippocampus and neocortex (Wilson
et al., 2005; De Gois et al., 2005) suggesting it has a pivotal role
for adapting synapse strength at the pre-synapse. Interestingly in
this model, the elevation in VGLUT1 expression (approximately
30% increase) was far less than the increase in synapsin 1
expression (approximately doubled). It is possible that since
synapsin 1 can be detected at all pre-synapses, whereas VGLUT1
detects only a subset of excitatory pre-synapses, other subsets of
excitatory pre-synapses are also enhanced.
Fast GABA-A receptor-mediated synaptic inhibition persists in the
presence of enhanced excitability and stabilises the CA3 network
Given our accumulated evidence for significantly enhanced
excitatory drive in the AP5/CNQX-treated slice cultures, we were
surprised that the highly interconnected CA3 hippocampal region
did not express synchronised epileptiform activity. In light of the
importance of the balance between excitation and inhibition for the
prevention of epileptogenesis in CA3 (Miles and Wong, 1987), we
looked more closely at fast GABA-A receptor-mediated synaptic
inhibition in AP5/CNQX-treated slice cultures. Intuitively, in a
neuronal network deprived of excitatory synaptic connectivity, a
decrease in synaptic inhibition would be predicted, since synaptic
inhibition is less likely to be required.
However, in this model of homeostatic plasticity in the
hippocampus, we observed more frequent spontaneous IPSPs in
AP5/CNQX-treated cells, with also a greater incidence of larger
events, supporting the idea that fast synaptic inhibition was
certainly intact. To help confirm this, we determined the expression
and distribution of three markers of inhibitory synapses within this
model. The presumed post-synaptic expression of the GABA-A
receptor alpha 1 subunit and the pre-synaptic expression of the
GABA synthetic enzyme GAD65, present in interneurone termi-
nals, were both unchanged in our model. However, we did detect
an increase in the number of parvalbumin-stained presumed pre-
synaptic inhibitory interneurone terminals, suggesting an enhanced
number of pre-synaptic GABA-ergic release sites, at least of this
type of inhibitory interneurone. Currently, we cannot exclude the
contribution from other types of inhibitory interneurone and their
potential for diversity under activity-deprived conditions. Never-
theless, all the changes we detected are consistent with the
observed enhanced frequency of spIPSPs in the absence of any
changes in their amplitude. Also consistent with enhanced spIPSPs
would be an enhanced excitation of inhibitory interneurones,
although we have no direct evidence for this, bar the enhanced
number of pre-synaptic excitatory terminals. In terms of the CA3
network, the synaptic GABA-A receptor-mediated inhibition was
clearly important since when we removed it the full force of the
enhanced excitatory synaptic strength and recurrent excitation
within CA3 led to enhanced epileptogenesis in AP5/CNQX-treated
slice cultures.
Our combined evidence shows an increased number of GABA
release sites, an enhanced frequency of spIPSPs and likely an
enhanced excitation of inhibition, in this model of homeostatic
plasticity, all of which will strengthen recurrent and feed forward
synaptic inhibition. Previous findings in other models, where
synaptic inhibition has been analysed following synapse inactivity,
have often produced conflicting and mixed results. In the
neocortex, clear reductions in GABA-A receptor (but not
GAD65) (Kilman et al., 2002) and vesicular GABA transporter
VIATT expression (De Gois et al., 2005) occur during homeostatic
plasticity, consistent with the reduced mIPSC frequency (Kilman et
al., 2002), although in the latter study, the mean GABA-A receptor
single channel conductance was unchanged. Similarly, GAD65
levels are unchanged in deprived ocular dominance columns in
L.E. Buckby et al. / Mol. Cell. Neurosci. 31 (2006) 805–816814
visual cortex (Silver and Stryker, 2000). More recently, in two
further studies in the hippocampus, estimates of synaptic inhibition
reveal little change. In one study where dispersed cultures were
chronically treated with the ionotropic glutamate receptor antag-
onist kynurenate (Ivanova et al., 2003), evoked IPSCs and IPSC
reversal potentials were unchanged, although activity-dependent
depression of inhibition was enhanced. Likewise, in dispersed
cultured hippocampal neurones following tetanus toxin activity
blockade, GAD65 and GABA-A alpha 2 receptor expression was
unchanged (Harms and Craig, 2005). Some of the diversity in the
literature may arise from the direct and potentially confounding
action of CNQX to enhance synaptic inhibition (Brickley et al.,
2001), although more recent findings using TTX to block synaptic
transmission for only 48 h, show, as we show here, that synaptic
inhibition is also upregulated (Echegoyen et al., 2005).
Homeostatic plasticity uses a variety of mechanisms, both
synaptic and intrinsic (Turrigiano and Nelson, 2000), to keep the
safety net intact for neuronal networks, especially under patholog-
ical conditions. In this study, we have highlighted the importance
of robust synaptic inhibition during homeostatic plasticity. Al-
though chronic inactivity clearly scaled up the excitatory synapses
in CA3, it did not scale down the inhibitory synapses; instead, the
strength of the synaptic inhibition remained and effectively
stabilised the network to prevent epileptogenesis.
Experimental methods
Organotypic slice culture preparation
Organotypic hippocampal slice cultures were prepared and grown with
a slight modification to the interface culture method (Stoppini et al., 1991;
Buckby et al., 2004). All experiments were carried out in accordance with
the UK (Scientific Procedures) Act 1986. Horizontal, 250 Am thick,
limbic brain slices were taken from P6-8 Wistar rats and sectioned in
preparation media (composition; 20 AM HEPES buffer in Minimal
Essential Media at 4–10-C) using a Vibroslice (Campden Instruments,
Loughborough, UK). Slices were transferred to membrane inserts
(Millicell-CM, Millipore), kept at 36-C in 5% CO2 and medium
exchanged daily with either control media or media containing 100 AMAP5 and 20 AM CNQX for a period of 7 days in vitro (DIV). At this
point, slice cultures were either snap frozen for SDS-PAGE and Western
blotting, fixed in 4% formaldehyde for immunohistochemistry or used for
electrophysiological recordings.
SDS-PAGE and Western blotting
Samples were prepared for SDS PAGE and Western blotting as
previously described (Buckby et al., 2004). Proteins were probed with
primary antibodies raised against VGLUT1 (1:500 Synaptic Systems),
PSD95 (1:1000 Cambridge Bioscience), SAP102 (1:500 Abcam), GAD,
glutamic acid decarboxylase, isoform 65 (GAD; 1:500 Chemicon), alpha 1
subunit of GABA-A receptor (1:2000) GluR1 (1:1000 Santa Cruz) and
NR1 (1:2000, Pharmingen). Secondary antibodies were conjugated to
horseradish peroxidase (Dako Ltd.) and visualised by the enhanced
chemiluminesence (ECL) method (Pierce). The film was scanned and the
grey levels of the different bands of interest were measured at
approximately 50% exposure using an image analysis program, Simple
PCI (Compix Inc., USA). In order to quantify and compare the density of
different bands, the grey levels were background subtracted and normalised
as a percentage of the control band grey level for each lane on the Western
blot. Blot grey levels were analysed blind as we routinely randomise the
order of gel loading. Whilst protein levels were always controlled prior to
loading, at 15 Ag per lane, additional post hoc analysis of Ponceau stains of
transfers and Coomassie-stained loading gels revealed little changes in
protein loading between lanes. Mean values T standard error of the mean
are stated for n samples, P values are quoted for Student’s t test and
ANOVA comparisons using Prism (Graphpad 3.03, USA).
Electrophysiology
Organotypic hippocampal slice cultures were transferred to a recording
chamber, where they were superfused at a rate of 2 ml/min with artificial
cerebrospinal fluid (aCSF), of composition (mM) NaCl 126, KCl 2.5,
NaH2PO4 1.2, MgCl2 1.3, CaCl2 2.4, NaHCO3 26, Glucose 10, saturated
with 95% 02/5% CO2 at 29–31-C. Extracellular DC field recordings were
made from the CA3 region of the hippocampus using 2–5 MV glass
pipettes filled with aCSF. The signal was amplified and filtered using a
Neurolog amplifier (Digitimer Systems, Herts UK) then filtered further
using a Humbug (Digitimer Systems, Herts, UK). For stimulation, a
monopolar stimulating electrode made from AgCl wire (outside diameter
0.125 mm; Goodfellow, UK) was placed beneath the granular cell layer of
the dentate gyrus and the axons of the granule cells and the mossy fibres
stimulated half-maximally using a constant voltage-isolated stimulator
(model DS2A-mkII, Digitimer Ltd., UK). The stimulating and recording
electrodes were positioned in the organotypic slice cultures under visual
control using the 10� objective of an upright light microscope (Eclipse
model E600FN, Nikon, Japan).
Whole cell recordings from CA3 pyramidal cells used patch electrodes
of resistance 6–10 MV filled with an internal solution of the following
composition in mM (NaCl, 5, KCl 10, K-gluconate 125, Mg-ATP 4, Na-
GTP 0.3, HEPES, 10, pH adjusted to 7.2 with KOH). Bridge mode
recordings obtained with an Axoclamp 2A were amplified (�20) and
filtered (dc/5k) using a Neurolog amplifier (Digitimer Systems, Herts UK)
then filtered further using a Humbug (Digitimer Systems, Herts, UK). Cells
with resting membrane potentials more negative than �55 mV and
exhibiting overshooting action potentials were accepted for recording.
Average resting membrane potential (junction potential corrected) and input
resistance (measured during short 30 ms duration 0.05 nA square pulses)
were recorded following a stabilisation period of at least 10 min following
seal breakthrough. Spontaneous synaptic events were then collected over a
period of 3–10 min. In order to record spontaneous EPSPs, the cell
membrane was held 5–8 mV negative to the resting membrane potential by
the injection of constant negative current whilst during the recording of
spontaneous IPSPs, the cell membrane was held between �52 and �55 mV
by injection of constant positive current.
Data acquisition, analysis and stimulus triggering were accomplished
using Signal software (Cambridge Electronic Design Ltd., Cambridge, UK)
on a PC connected to a 1401 plus (Cambridge Electronic Design Ltd.,
Cambridge, UK). The peak amplitude and duration of the field excitatory
post-synaptic potential (fEPSP) component of the waveform were measured
from the average of three successive events for input/output analysis and
from an average of 10 successive events after a 5 min drug wash-on period
for drug application. Spontaneous EPSPs and IPSPs recorded from
randomly selected 90–150 s of data during a recording period of 3–10
min were analysed off line using Mini Analysis software (Synaptosoft,
Decatur, USA). Data were expressed as mean T standard error of mean for n
samples and P values quoted for Student’s t test and ANOVA comparisons
using Prism.
All electrophysiological experiments occurred in aCSF (unless stated)
thereby relieving AP5/CNQX-treated organotypic hippocampal slice
cultures of their NMDA and AMPA receptor blockade. When used, drugs
were applied in known concentrations into the superfusate and were 6-
cyano-7-nitroquinoxaline-2,3-dione (CNQX), d,l-2-amino-5-phosphono-
pentanoic acid (AP5) and (2S,2VR,3VR)-2-(2V,3V-Dicarboxycyclopropyl)glycine (DCGIV; all Tocris, UK).
Immunohistochemistry
Control organotypic hippocampal slice cultures and AP5/CNQX-treated
sister cultures were fixed in 4% formaldehyde in phosphate-buffered saline
L.E. Buckby et al. / Mol. Cell. Neurosci. 31 (2006) 805–816 815
(PBS) pH 7.4 for a minimum of 12 h and then rehydrated by washing in
PBS pH 7.4 of composition (mM) NaCl 137, KCl 2.7, KH2PO4 1.5,
Na2HPO4 8.1. For VGLUT1, GAD65, GABA-A receptor alpha 1 subunit
and glial fibrillary acidic protein (GFAP) staining, slice cultures were
incubated with 1% goat serum, 0.5% BSA (Sigma, UK) and 0.5% Triton-X
(Sigma) in PBS pH 7.4 for 4 h at 37-C to permeabilise slice cultures and
block non-specific binding. Following this, slice cultures were incubated
overnight at room temperature with the VGLUT1 (1:500), Parvalbumin
(1:250, Chemicon), Synapsin 1 (1:200), GAD65 (1:100), GABA-A
receptor alpha 1 subunit (1:100) and GFAP (1:100) antibodies diluted in
1% goat serum, 0.5% BSA in PBS pH 7.4. After this, slice cultures were
washed in PBS pH 7.4 and then incubated for 4 h in the dark with 1% goat
serum, 0.5% BSA in PBS pH 7.4 containing an Alexa-488 conjugate
(1:500; Molecular Probes). All slice cultures were then washed in PBS pH
7.4 and mounted using a 50% glycerol (Sigma) solution in PBS pH 7.4.
Confocal fluorescence microscopy and quantification
A laser scanning confocal microscope (Bio-rad Radiance 2100, Zeiss,
UK) attached to an upright light microscope (Eclipse model E600FN,
Nikon, Japan) fitted with a 60� oil immersion objective (Nikon, Japan) was
used to image VGLUT1, Parvalbumin, Synapsin 1, GAD65 and GFAP
distribution in control and AP5/CNQX-treated organotypic hippocampal
slice cultures. A thin section was obtained by using an optimised confocal
aperture with minimal laser power and gain from the cell body layer of the
CA3b/c region. Once these two parameters were optimised for a given
fluorophore, they remained the same across all analysed samples, and all
samples from different slice cultures within the data set were collected on
the same day. We used a 488-nm excitation line of an Argon laser to excite
the Alexa 488 fluorophore and fluorescence emission was collected at 515 T
30 nm by filtering with an HQ515/30 emission filter. The confocal
microscope was controlled by Lasersharp software (Zeiss, UK) and images
collected from 3 fields of view within each slice culture. These were then
analysed offline using Simple PCI where identical threshold values were
applied across a data set. For a given data set, identical threshold settings
were used although these varied across the different antibody and
fluorophore combinations used. Immunocytochemistry particulate analysis
was performed blind as we routinely randomise our slides. Values were
analysed using Prism to generate mean values T standard error of the mean
for n samples and P values quoted for Student’s t test and ANOVA
comparisons with Prism.
Semi-quantitative assay for neuronal viability and slice culture thickness
using confocal microscopy
Using a slight modification to the method of Monette et al., 1998), we
used propidium iodide (PI; Sigma) and calcein-AM (Molecular Probes) to
stain for neuronal damage (where PI stains the nucleic acid of neurones
with damaged membranes) and survival (where calcein-AM stains neurones
with intact membranes). Living organotypic slice cultures maintained on
the microscope stage at room temperature in a HEPES-buffered saline were
imaged following dye uptake using a 60� water immersion objective
(Nikon, Japan) on the confocal microscope as described above. By imaging
the stained slice cultures (with constant confocal settings between all slice
cultures), we collected 4 areas of interest in CA3 for each slice culture
under each condition. Images of PI and calcein-AM staining within the
hippocampal CA3 region were then analysed using a constant maximum
threshold of 10% within Simple PCI to generate an area of fluorescence in
Am2 for each dye under the different conditions. Slice cultures from control
and AP5/CNQX-treated slice cultures were examined at 2, 4 and 6 DIV
using PI and calcein-AM. The values for the area of fluorescence (Am2)
were then compared using Excel and Prism as mean values T standard error
of mean for n samples and P values quoted for ANOVA comparisons. To
gain an estimate of the thickness of each slice culture, we used the
transmitted light detector on the confocal with control of the z-axis in order
to measure each slice culture from top to bottom where the Millipore
membrane became visible.
Acknowledgments
This work was funded by the BBSRC grant number 111/
NEU15396, the Epilepsy Research Foundation, UK (to TPJ) and
Action Medical Research.
References
Aptowicz, C.O., Kunkler, P.E., Kraig, R.P., 2004. Homeostatic plasticity in
hippocampal slice cultures involves changes in voltage-gated Na+
channel expression. Brain Res. 998, 155–163.
Bacci, A., Coco, S., Pravettoni, E., Schenk, U., Armano, S., Frassoni, C.,
Verderio, C., De Camilli, P., Matteoli, M., 2001. Chronic blockade of
glutamate receptors enhances presynaptic release and downregulates the
interaction between synaptophysin–synaptobrevin–vesicle-associated
membrane protein 2. J. Neurosci. 21, 6588–6596.
Brickley, S.G., Farrant, M., Swanson, G.T., Cull-Candy, S.G., 2001.
CNQX increases GABA-mediated synaptic transmission in the
cerebellum by an AMPA/kainite receptor-independent mechanism.
Neuropharmacology 41, 730–736.
Buckby, L.E., Mummery, R., Crompton, M.R., Beesley, P.W., Empson,
R.M., 2004. Comparison of neuroplastin and synaptic marker protein
expression in acute and cultured organotypic hippocampal slices from
rat. Brain Res. Dev. Brain Res. 150, 1–7.
Burrone, J., Murthy, V.N., 2003. Synaptic gain control and homeostasis.
Curr. Opin. Neurobiol. 13, 560–567.
Burrone, J., O’Byrne, M., Murthy, V.N., 2002. Multiple forms of synaptic
plasticity triggered by selective suppression of activity in individual
neurons. Nature 420, 414–418.
Cannon, W., 1939. The Wisdom of the Body, 2nd ed. Norton Pubs, New
York.
Davis, G.W., Bezprozvanny, I., 2001. Maintaining the stability of neural
function: a homeostatic hypothesis. Annu. Rev. Physiol. 63, 847–869.
Davis, G.W., Goodman, C.S., 1998. Synapse-specific control of synaptic
efficacy at the terminals of a single neuron. Nature 392, 82–86.
De Gois, S., Schafer, M.K., Defamie, N., Chen, C., Ricci, A., Weihe, E.,
Varoqui, H., Erickson, J.D., 2005. Homeostatic scaling of vesicular
glutamate and GABA transporter expression in rat neocortical circuits.
J. Neurosci. 25, 7121–7133.
Desai, N.S., Nelson, S.B., Turrigiano, G.G., 1999. Activity-dependent
regulation of excitability in rat visual cortical neurons. Neurocomputing
26–27, 101–106.
Echegoyen, J.C., Graber, K.D., Soltesz, I., 2005. Homeostatic Plasticity in
the Adult Hippocampus in vivo. Abstract number 499.8. Society for
Neuroscience Abstract viewer, Washington, DC.
Freund, T.F., Buzsaki, G., 1996. Interneurons of the hippocampus.
Hippocampus 6, 347–470.
Furshpan, E.J., Potter, D.D., 1989. Seizure-like activity and cellular damage
in rat hippocampal neurons in cell culture. Neuron 3, 199–207.
Galvan, C.D., Wenzel, J.H., Dineley, K.T., Lam, T.T., Schwartzkroin, P.A.,
Sweatt, J.D., Swann, J.W., 2003. Postsynaptic contributions to
hippocampal network hyperexcitability induced by chronic activity
blockade in vivo. Eur. J. Neurosci. 18, 1861–1872.
Goodman, C.S., Shatz, C.J., 1993. Developmental mechanisms that
generate precise patterns of neuronal connectivity. Cell 72, 77–98.
Harms, K.J., Craig, A.M., 2005. Synapse composition and organization
following chronic activity blockade in cultured hippocampal neurons.
J. Comp. Neurol. 490, 72–84.
Ivanova, S.Y., Storozhuk, M.V., Melnick, I.V., Kostyuk, P.G., 2003.
Chronic treatment with ionotropic glutamate receptor antagonist
kynurenate affects GABAergic synaptic transmission in rat hippo-
campal cell cultures. Neurosci. Lett. 341, 61–64.
Kilman, V., van Rossum, M.C., Turrigiano, G.G., 2002. Activity depriva-
tion reduces miniature IPSC amplitude by decreasing the number of
postsynaptic GABA(A) receptors clustered at neocortical synapses.
J. Neurosci. 22, 1328–1337.
L.E. Buckby et al. / Mol. Cell. Neurosci. 31 (2006) 805–816816
Kullmann, D.M., Asztely, F., 1998. Extrasynaptic glutamate spillover in the
hippocampus: evidence and implications. Trends Neurosci. 21, 8–14.
Miles, R., Wong, R.K., 1987. Inhibitory control of local excitatory circuits
in the guinea-pig hippocampus. J. Physiol. 388, 611–629.
Monette, R., Small, D.L., Mealing, G., Morley, P., 1998. A fluorescence
confocal assay to assess neuronal viability in brain slices. Brain Res.
Brain Res. Protoc. 2, 99–108.
Munno, D.W., Syed, N.I., 2003. Synaptogenesis in the CNS: an odyssey
from wiring together to firing together. J. Physiol. 552, 1–11.
Murthy, V.N., Schikorski, T., Stevens, C.F., Zhu, Y., 2001. Inactivity
produces increases in neurotransmitter release and synapse size. Neuron
32, 673–682.
O’Brien, R.J., Kamboj, S., Ehlers, M.D., Rosen, K.R., Fischbach, G.D.,
Huganir, R.L., 1998. Activity-dependent modulation of synaptic AMPA
receptor accumulation. Neuron 21, 1067–1078.
Okabe, S., Kim, H.D., Miwa, A., Kuriu, T., Okado, H., 1999. Continual
remodeling of postsynaptic density and its regulation by synaptic
activity. Nat. Neurosci. 2, 804–811.
Qin, L., Marrs, G.S., McKim, R., Dailey, M.E., 2001. Hippocampal mossy
fibers induce assembly and clustering of PSD95-containing postsynap-
tic densities independent of glutamate receptor activation. J. Comp.
Neurol. 440, 284–298.
Ramakers, G.J., Corner, M.A., Habets, A.M., 1990. Development in the
absence of spontaneous bioelectric activity results in increased
stereotyped burst firing in cultures of dissociated cerebral cortex. Exp.
Brain Res. 79, 157–166.
Rao, A., Craig, A.M., 1997. Activity regulates the synaptic localization of
the NMDA receptor in hippocampal neurons. Neuron 19, 801–812.
Royer, S., Pare, D., 2003. Conservation of total synaptic weight through
balanced synaptic depression and potentiation. Nature 422, 518–522.
Silver, M.A., Stryker, M.P., 2000. Distributions of synaptic vesicle proteins
and GAD65 in deprived and nondeprived ocular dominance columns in
layer IV of kitten primary visual cortex are unaffected by monocular
deprivation. J. Comp. Neurol. 422, 652–664.
Slutsky, I., Sadeghpour, S., Li, B., Liu, G., 2004. Enhancement of synaptic
plasticity through chronically reduced Ca2+ flux during uncorrelated
activity. Neuron 44, 835–849.
Stoppini, L., Buchs, P.A., Muller, D., 1991. A simple method for
organotypic cultures of nervous tissue. J. Neurosci. Methods 37,
173–182.
Takamori, S., Rhee, J.S., Rosenmund, C., Jahn, R., 2000. Identification of a
vesicular glutamate transporter that defines a glutamatergic phenotype
in neurons. Nature 407, 189–194.
Thiagarajan, T.C., Lindskog, M., Tsien, R.W., 2005. Adaptation to synaptic
inactivity in hippocampal neurons. Neuron 47, 725–737.
Turrigiano, G.G., 1999. Homeostatic plasticity in neuronal networks: the
more things change, the more they stay the same. Trends Neurosci. 22,
221–227.
Turrigiano, G.G., Nelson, S.B., 2000. Hebb and homeostasis in neuronal
plasticity. Curr. Opin. Neurobiol. 10, 358–364.
Turrigiano, G.G., Nelson, S.B., 2004. Homeostatic plasticity in the
developing nervous system. Nat. Rev., Neurosci. 5, 97–107.
Turrigiano, G.G., Leslie, K.R., Desai, N.S., Rutherford, L.C., Nelson, S.B.,
1998. Activity-dependent scaling of quantal amplitude in neocortical
neurons. Nature 391, 892–896.
van den Pol, A.N., Obrietan, K., Belousov, A., 1996. Glutamate
hyperexcitability and seizure-like activity throughout the brain and
spinal cord upon relief from chronic glutamate receptor blockade in
culture. Neuroscience 74, 653–674.
Watt, A.J., van Rossum, M.C., MacLeod, K.M., Nelson, S.B., Turrigiano,
G.G., 2000. Activity coregulates quantal AMPA and NMDA currents at
neocortical synapses. Neuron 26, 659–670.
Wierenga, C.J., Ibata, K., Turrigiano, G.G., 2005. Postsynaptic expression
of homeostatic plasticity at neocortical synapses. J. Neurosci. 25,
2895–2905.
Wilson, N.R., Kang, J., Hueske, E.V., Leung, T., Varoqui, H., Murnick,
J.G., Erickson, J.D., Liu, G., 2005. Presynaptic regulation of quantal
size by the vesicular glutamate transporter VGLUT1. J. Neurosci. 25,
6221–6234.
Wojcik, S.M., Rhee, J.S., Herzog, E., Sigler, A., Jahn, R., Takamori,
S., Brose, N., Rosenmund, C., 2004. An essential role for vesicular
glutamate transporter 1 (VGLUT1) in postnatal development and
control of quantal size. Proc. Natl. Acad. Sci. U. S. A. 101,
7158–7163.
Related Documents