Network Safety Assessment December 2015 Network Safety Assessment Brief description of document content

Welcome message from author
This document is posted to help you gain knowledge. Please leave a comment to let me know what you think about it! Share it to your friends and learn new things together.
Transcript

Network Safety Assessment
December 2015
Network Safety Assessment Brief description of document content
Network Safety Assessment
RRP 5-5 - Network Safety Assessment.docx Page 2 of 55
This page intentionally blank
Network Safety Assessment
RRP 5-5 - Network Safety Assessment.docx Page 3 of 55
Table of Contents
1. Executive Summary ................................................................................................................................. 6
2. Business Obligations for Safety ............................................................................................................. 11
3. Network Safety Metrics, Performance and Targets ............................................................................... 13
3.1 Network Safety Metrics ............................................................................................................. 13
3.2 Historical Network Safety Performance .................................................................................... 14
3.2.1. Asset Failure – No Fire ................................................................................................ 14
3.2.2. Asset Failure – Fire on or in Asset ............................................................................... 16
3.2.3. Asset Failure – Vegetation Fire .................................................................................... 16
3.2.4. Vegetation Fire from Contact ....................................................................................... 17
3.2.5. Asset failure – major substation event ......................................................................... 19
3.2.6. Incidents Involving the Public ....................................................................................... 20
3.3 Network Safety Targets ............................................................................................................ 21
4. Approach to Managing Network Safety ................................................................................................. 24
5. Impact of Investment to Achieve Safety Obligations ............................................................................. 25
5.1 Summary .................................................................................................................................. 25
5.2 Asset Replacement Capex and Opex ...................................................................................... 27
5.3 Unmodelled Repex – Non-VRBC, OT Safety and Reliability Projects ..................................... 28
5.4 VBRC Safety Projects .............................................................................................................. 29
5.5 Summary .................................................................................................................................. 30
6. Impact of Asset Replacement by Asset Class ....................................................................................... 31
6.1 Pole Top Structures .................................................................................................................. 31
6.1.1. Background .................................................................................................................. 31
6.1.2. Effect of Various Programs .......................................................................................... 33
6.2 Poles ......................................................................................................................................... 33
6.2.1. Background .................................................................................................................. 33
6.2.2. Effect of Various Programs .......................................................................................... 36
6.3 Overhead Conductors and Connectors .................................................................................... 36
6.3.1. Background .................................................................................................................. 36
6.3.2. Effect of Various Programs .......................................................................................... 38
6.4 Underground Cable .................................................................................................................. 38
6.5 Distribution Switchgear ............................................................................................................. 39
6.5.1. Background .................................................................................................................. 39
6.5.2. Effect of Various Programs .......................................................................................... 40
6.6 Distribution Transformers ......................................................................................................... 41
6.6.1. Background .................................................................................................................. 41
6.6.2. Effect of Various Program ............................................................................................ 42
6.7 Zone Substation Equipment ..................................................................................................... 42
6.7.1. Background: ................................................................................................................. 43
6.7.2. Effect of Various Program ............................................................................................ 44
6.8 Services .................................................................................................................................... 44
6.8.1. Background .................................................................................................................. 45
6.8.2. Effect of Various Programs .......................................................................................... 46

Network Safety Assessment
RRP 5-5 - Network Safety Assessment.docx Page 4 of 55
6.9 Protection and Control .............................................................................................................. 46
7. “Other Repex” Projects .......................................................................................................................... 47
7.1 Non VBRC Safety Projects ....................................................................................................... 47
7.1.1. Intelligent Secure Substation Asset Management - CCTV .......................................... 47
7.2 Operational Technology Safety Projects .................................................................................. 48
7.2.1. Service Mains Deterioration Field Works ..................................................................... 48
7.2.2. In Meter Capabilities .................................................................................................... 48
7.2.3. LiDAR ........................................................................................................................... 49
7.2.4. OT Security .................................................................................................................. 50
7.2.5. DNSP Intelligent Network Devices. .............................................................................. 50
7.3 Reliability Performance Projects ............................................................................................... 51
7.3.1. Bird and Animal Proofing ............................................................................................. 51
7.3.2. Clashing ....................................................................................................................... 51
8. VBRC Safety Projects............................................................................................................................ 52
8.1 Summary .................................................................................................................................. 52
8.2 Conductors ............................................................................................................................... 52
8.3 LV ABC ..................................................................................................................................... 53
8.4 HV ABC .................................................................................................................................... 53
8.5 Connectors (Ampact) ................................................................................................................ 54
8.6 Armour Rods, Dampers and Spacers....................................................................................... 54
8.7 REFCL’s ................................................................................................................................... 55
8.8 SWER ....................................................................................................................................... 55

Network Safety Assessment
RRP 5-5 - Network Safety Assessment.docx Page 5 of 55
List of Tables
Table 1: Safety Metrics, Performance and Targets .............................................................................................. 7
Table 2: Zone Substation Major Equipment Failures ......................................................................................... 19
Table 3: Zone Substation. Equipment Leading Indices ...................................................................................... 19
Table 4: Safety Metrics, Performance and Targets ............................................................................................ 21
Table 5: Repex and Opex to Manage Network Safety ....................................................................................... 26
Table 6: Safety Metrics Pole Top Structures ...................................................................................................... 32
Table 7: Safety Metrics Pole Replacement & Staking ........................................................................................ 35
Table 8: Safety Metrics Conductors ................................................................................................................... 37
Table 9: Safety Metrics Distribution Switchgear ................................................................................................. 40
Table 10: Safety Metrics: Distribution Transformers .......................................................................................... 42
Table 11: Safety Metric Zone Substation Transformers and Switchgear. .......................................................... 43
Table 12: Safety Metrics Services ...................................................................................................................... 45
Table of Figures
Figure 1: Asset Failures, Targets and Forecast ................................................................................................... 8
Figure 2: Fire Starts, Targets and Forecast .......................................................................................................... 8
Figure 3: Incidents Involving the Public, Target and Forecast ............................................................................. 9
Figure 4: Asset Failures without Fires ................................................................................................................ 15
Figure 5: Asset Failure with Fire on Asset .......................................................................................................... 16
Figure 6: Asset Failure with Vegetation Fire....................................................................................................... 17
Figure 7: Vegetation Fires from Contact ............................................................................................................. 18
Figure 8: Incidents Involving the Public .............................................................................................................. 20
Figure 9: Asset Failures, Targets and Forecast ................................................................................................. 22
Figure 10: Fire Starts, Targets and Forecast...................................................................................................... 23
Figure 11: Incidents Involving the Public, Target and Forecast ......................................................................... 23
Network Safety Assessment
RRP 5-5 - Network Safety Assessment.docx Page 6 of 55
Liability Disclaimer
Some of the information and statements contained in this Network Safety Assessment are comprised of, or are based on, assumptions, estimates, forecasts, predictions and projections made by United Energy (UE). In addition, some of the information and statements are based on actions that UE currently intends to take in the future. Circumstances will change, assumptions and estimates may prove to be wrong, events may not occur as forecasted, predicted or projected, and UE may at a later date decide to take different actions to those it currently intends to take.
Except for any statutory liability which cannot be excluded, UE will not be liable, whether in contract, tort (including negligence), equity or otherwise, to compensate or indemnify any person for any loss, injury or damage arising directly or indirectly from any person using, or relying on any content of, this strategy.
When considering the content of this strategy, persons should take appropriate expert advice in relation to their own circumstances and must rely solely on their own judgement and expert advice obtained.

Network Safety Assessment
RRP 5-5 - Network Safety Assessment.docx Page 7 of 55
1. Executive Summary
United Energy has specific requirements to maintain the safety of Victoria’s electricity networks in accordance with the National Electricity Rules and must also meet the requirements of the Electricity Safety Act 1998 (the Act).
The Act imposes an obligation to not only maintain present levels of safety but to reduce it “as far as practicable”. This principal is applied by United Energy in the management of its bushfire risk and the risk of serious injury or death to its personnel and the general public.
Under the Act, Energy Safe Victoria (ESV), in its role as the safety regulator responsible for electricity safety in Victoria, requires all Victorian Distribution Network Service Providers (DNSPs) to report on their safety performance. In consultation with the DNSPs, ESV developed in 2010 a set of metrics to monitor network safety performance, defining the metrics for specific incidents considered as posing a significant hazard or risk. United Energy uses these same metrics to manage network safety.
Table 1 presents the safety metrics relevant for network assets that United Energy uses to manage network safety.
For a critical sub-category of asset failures defined as Major Substation Events, which can result in major explosions and equipment fires and pose a very significant risk to our workforce and sometimes the public, United Energy has a target of zero failures. In order to effectively manage to this outcome, we have developed a leading indicator representative of the risk of such an event occurring.
Table 1: Safety Metrics, Performance and Targets
Safety Metrics Average
2011 – 2014 Performance
2014 Performance
Targets 2011-2015
Target 2016-2020
Asset failure no fire 231 232 210 210
Asset failure - fire on asset
95 201 88 93
Asset failure – vegetation fire
20 33 21 27
Vegetation fire from contact with asset
15 18 15 15
Leading Indicator substation major event
N/A 642 710 710
HV Injections 48 44 45 45
Electrical Shocks 82 61 80 35
Access Breach 7 8 8 8
The safety metrics can be broadly grouped into three categories, namely asset failures, fire starts and incidents involving the public. Figure 1, Figure 2 and Figure 3 present the historical performance, targets and forecast performance for these three categories. The targets and forecast performance for the next regulatory period are based on the repex proposed in United Energy’s Revised Regulatory Proposal submitted to the AER 6 January 2016.

Network Safety Assessment
RRP 5-5 - Network Safety Assessment.docx Page 8 of 55
Figure 1: Asset Failures, Targets and Forecast
Figure 2: Fire Starts, Targets and Forecast
0
50
100
150
200
250
300
350
400
450
500
2011 2012 2013 2014 Forecast16 - 20
Asset Failures, Target and Forecast
Asset Failures - VegetationFire
Asset Failure - Fires on or inAssets
Asset Failure - No Fire
Target 11 - 15
Target 16 - 20
Network Safety Assessment
RRP 5-5 - Network Safety Assessment.docx Page 9 of 55
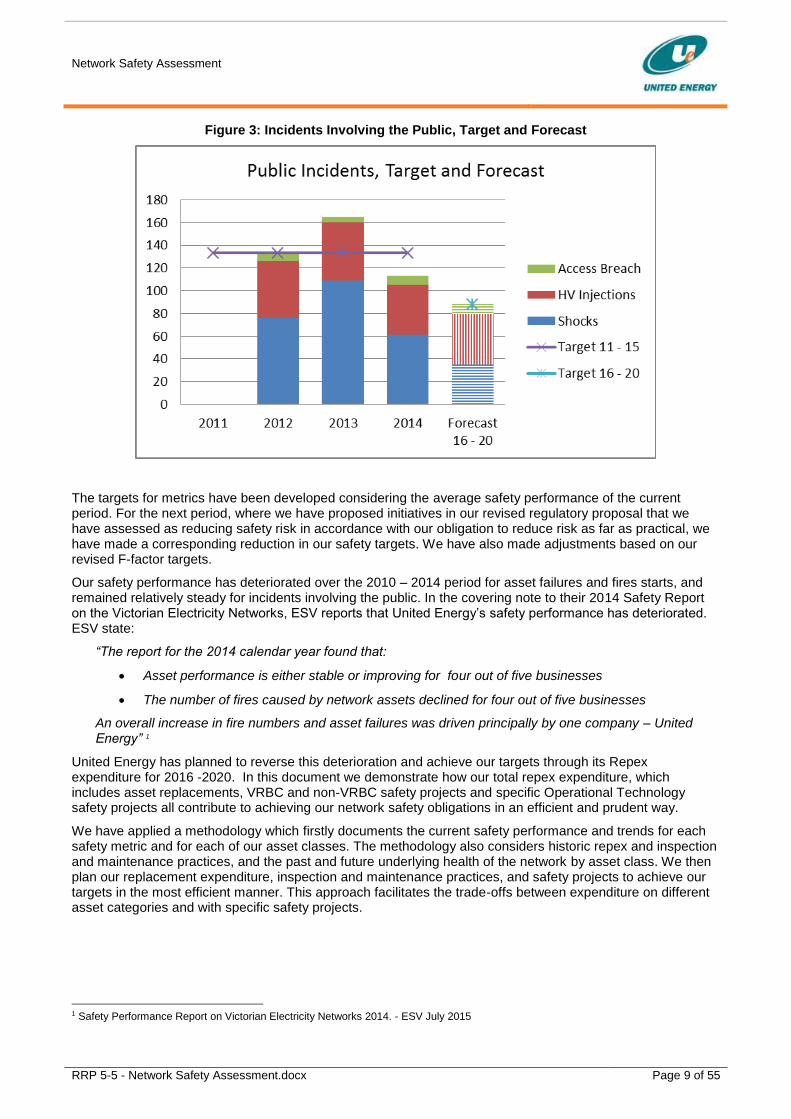
Figure 3: Incidents Involving the Public, Target and Forecast
The targets for metrics have been developed considering the average safety performance of the current period. For the next period, where we have proposed initiatives in our revised regulatory proposal that we have assessed as reducing safety risk in accordance with our obligation to reduce risk as far as practical, we have made a corresponding reduction in our safety targets. We have also made adjustments based on our revised F-factor targets.
Our safety performance has deteriorated over the 2010 – 2014 period for asset failures and fires starts, and remained relatively steady for incidents involving the public. In the covering note to their 2014 Safety Report on the Victorian Electricity Networks, ESV reports that United Energy’s safety performance has deteriorated. ESV state:
“The report for the 2014 calendar year found that:
Asset performance is either stable or improving for four out of five businesses
The number of fires caused by network assets declined for four out of five businesses
An overall increase in fire numbers and asset failures was driven principally by one company – United Energy” 1
United Energy has planned to reverse this deterioration and achieve our targets through its Repex expenditure for 2016 -2020. In this document we demonstrate how our total repex expenditure, which includes asset replacements, VRBC and non-VRBC safety projects and specific Operational Technology safety projects all contribute to achieving our network safety obligations in an efficient and prudent way.
We have applied a methodology which firstly documents the current safety performance and trends for each safety metric and for each of our asset classes. The methodology also considers historic repex and inspection and maintenance practices, and the past and future underlying health of the network by asset class. We then plan our replacement expenditure, inspection and maintenance practices, and safety projects to achieve our targets in the most efficient manner. This approach facilitates the trade-offs between expenditure on different asset categories and with specific safety projects.
1 Safety Performance Report on Victorian Electricity Networks 2014. - ESV July 2015

Network Safety Assessment
RRP 5-5 - Network Safety Assessment.docx Page 10 of 55
Our methodology is iterative, as we must optimise outcomes across eight safety metrics, with most asset classes having an impact on multiple safety metrics. The methodology also considers the impact of specific safety projects and initiatives, including those assessed as reducing safety risk in line with our obligations, and incorporates specific assessments such as our Bushfire Mitigation ALARP Risk Assessment. A further complexity addressed by the methodology is that asset replacement is also a primary means for maintaining reliability, so iterations also occur between our network safety assessment and network reliability assessment.
To address our current safety performance which is above target and deteriorating, and the underlying health of the network where an increasing proportion of assets are entering the “wear out” phase, UE is proposing the following expenditure to meet our network safety obligations:
Asset replacement of expenditure of $408M (compared to current period of $375M)
Other - Unmodelled Repex safety projects of $30.9M (compared to current period < $4.4M)
VBRC safety projects totalling $53M (compared to current period of $24M)
This will achieve the following outcomes in the 2016-20 period:
Return asset failures to target levels consistent with our recent average performance.
Return fire start performance to target, by reducing fire starts caused by asset failure.
Address the increasing risk of bushfire due to premature escalating failures of HV ABC cable.
Reduce overall bushfire risk by 35% through the installation of two REFCL’s.
Address our increasing security and access breach risk to maintain current safety levels.
Reduce electric shocks experienced by the public by 50% using a cost effective method assessed as ALARP.
These benefits can be equated to an increase in Repex compared to the 2011-15 period, as follows:
$33.0M to maintain network safety by addressing deteriorating performance and returning performance to target, and addressing deteriorating network health
o $33.0M in asset replacement (noting replacement must also assist to maintain reliability)
$ 54.4M to reduce safety risk as per VBRC and ALARP obligations, and address externalities
o $28.9M additional for VBRC programs
o $11.1M to address increasing security and access breach risk
o $8.0M to reduce electric shocks to the public by 50%, with initiatives assessed as ALARP
o $6.4M for LiDAR to reduce bushfire and other safety risks
This assessment is consistent with our top down assessment, concluding that a significant increase in expenditure will be required both to return network safety to target levels, and to address the ongoing increasing proportion of assets at high risk of failure.
A significant portion of the increase in expenditure is attributable to other factors, namely meeting our VBRC and ALARP obligations, and addressing externalities.

Network Safety Assessment
RRP 5-5 - Network Safety Assessment.docx Page 11 of 55
2. Business Obligations for Safety
This document presents the network safety assessment for UE for the 2016-2020 regulatory period. It is complementary to the Network Asset Safety Strategy, which focuses on strategy rather than presenting the assessment details.
UE approach to maintaining network safety has its origins in rules and regulations relevant to our business. Under the NER rules UE is required to maintain both the safety and reliability of the Network. The Electricity Distribution Code directs compliance with the Electricity Safety Act and its associated Safety Regulations.
The Electricity Safety Act 1998 (the Act) makes provisions relating to:
the safety of electricity supply and use;
the reliability and security of electricity supply; and
the efficiency of electrical equipment.
Under section 98 of the Act, United Energy (as a major electricity company) must design, construct, operate, maintain and decommission its supply network to minimise as far as practicable:
the hazards and risks to the safety of any person arising from the supply network; and
the hazards and risks of damage to the property of any person arising from the supply network; and
the bushfire danger arising from the supply network.
Under the Electricity Safety (Management) Regulations 2009, it is mandatory for network operators to implement an Electricity Safety Management Scheme (ESMS). The ESMS represents shift away from prescribed regulations to a system that is underpinned by identification and management of safety risks associated with the assets to a level that is “As Low As Reasonably Practicable” (ALARP).
The requirements of the Safety Act are therefore more onerous than those of the NER as they require us to improve safety where it is reasonably practical to do so.
ALARP
The safety objective of the asset management system is to ensure the electricity network risks associated with asset management activities which have the potential to cause harm to people or property can be demonstrated to be as low as reasonably practicable. (ALARP)
UE stated aims for addressing Safety Risk as documented in the Corporate Risk Appetite Statement are: -
We manage the risk of death or serious injury (relating to our network or activities) to a member of the public or an employee/contractor to as low as reasonably practical
We manage the risk of bushfire or explosions being caused by failure of our network to be as low as reasonably practical.
The following definitions apply:
ALARP – means the cost of further risk reduction measures is grossly disproportionate to the benefit gained from the reduced risk that would result.
Reasonable practicability – Determining whether risks have been reduced as low as is reasonably practicable involves an assessment of the risk, and an assessment of the sacrifice (in money, time and effort) involved in taking measures to further reduce that risk, and a comparison of the two. A risk may sit on a spectrum from very low (where it is very unlikely that it would be possible to reduce the risk further) through to levels of risk that are very high. The greater the initial level of risk under consideration, the greater the effort likely to be required to demonstrate that risks have been reduced to a level that is as low as reasonably practicable, however, just because the initial level of risk may be low doesn’t mean it may not be reasonably practicable to reduce it further. The basis on which the comparison is made involves the test of ‘gross disproportion’.
Gross disproportion – if a measure is practicable and it cannot be shown that the cost of the measure is grossly disproportionate to the benefit gained; then the measure is considered reasonably practicable and should be implemented. The criterion is reasonably practicable not reasonably affordable: justifiable cost and effort is not determined by the budget constraints/viability of a project.
Network Safety Assessment
RRP 5-5 - Network Safety Assessment.docx Page 12 of 55
Determining if the risk from a specific threat has been reduced to ALARP involves an assessment of the risk to be avoided, the cost (in money, time and trouble) involved in avoiding the risk and a comparison of the two. Determining ALARP is in effect a cost benefit analysis. The measure of whether ALARP has been achieved is if the cost of reducing the risk is grossly disproportionate to the benefit gained.
Electricity Safety Regulations
The Electricity Safety Act is underpinned by subordinate regulations:-
Electricity Safety (Management) Regulations that require each major electricity company to submit an Electricity Safety Management Scheme (ESMS) to Energy Safe Victoria (ESV) every five years.
Electricity Safety (Bushfire Mitigation) Regulations that require each major electricity company to submit a Bushfire Mitigation Plan (BMP) every five years.
Electricity Safety (Electrical Line Clearance) Regulations that require each major electricity company to submit an Electrical Line Clearance Plan (ELCMP) every year.
United Energy produces these plans and submits them to ESV who provides regular audits on their implementation.
United Energy is also required to provide data on its safety performance to the ESV. It uses the safety metrics produced by this data to measure its network safety performance. United Energy uses the same information to manage the safety performance of the network and to set safety performance targets. How we do this will be explained in the body of this report.
The purpose of this Assessment is to demonstrate how United Energy intends to meet its obligations to maintain safety and to reduce the risk of serious harm or death and the risk of starting a bushfire to ALARP using replacement expenditure plus programs that specifically target network safety.
Network Safety Assessment
RRP 5-5 - Network Safety Assessment.docx Page 13 of 55
3. Network Safety Metrics, Performance and Targets
3.1 Network Safety Metrics
Part of ESV’s function under the Electricity Safety Act 1998 is to “investigate events or incidents which have implications for electrical safety” and “advise the electricity industry and the community in relation to electricity safety”.
In undertaking this function ESV have devised a series of safety indicators on which all Victorian major electricity companies, including United Energy must report. The metrics were developed in consultation with industry in 2010 and United Energy is required to provide information so that ESV can keep records of all electrical incidents and events. The criteria for selecting the metrics was the degree of hazard to the public and employees of the distribution businesses associated with particular electrical incidents and events. The metrics are defined in the “Distribution Businesses Electrical Safety Performance Reporting Guidelines”2.
United Energy uses the same safety metrics to manage the safety performance of its network as used by Energy Safe Victoria (ESV) in monitoring the safety of the Victorian Electricity Industry.
The Key Safety Metrics related to network assets (and not specifically work practices) are:
1. Asset failures without fire
2. Asset failure with fires on or in assets
3. Vegetation fires due to asset failure
4. Vegetation fires due to contact by vegetation, third party or animals
5. HV injections
6. Electric Shocks
7. Access breaches.
These seven key safety metrics can be divided into three groups, noting that key metrics 2 and 3 are included in two groups: -
1. Safety incidents that relate to asset failure.
a. Asset failures without fire
b. Asset failure with fires on or in assets
c. Vegetation fires due to asset failure
2. Safety incidents that cause a fire start
a. Asset failure with fires on or in assets
b. Vegetation fires due to asset failure
c. Vegetation fires due to contact by vegetation, third party or animals
3. Safety incidents involving the public
a. HV injections
b. Electric Shocks
c. Access breaches.
Note that the asset failure metric does not include all asset failures, only those considered to pose a significant network safety risk.
2 Available from http://www.esv.vic.gov.au/ESV-Search-Results/search/Distribution+Business+Electrical+Safety+Performance+

Network Safety Assessment
RRP 5-5 - Network Safety Assessment.docx Page 14 of 55
In addition to the monitoring of safety metrics, major substation events are a major focus for ESV as they can result in major fires and explosions which pose a significant risk to the safety of workers and sometimes the public. ESV requires immediate notification of these major substation events and usually undertake a dedicated detailed investigation of each the event. The target safety metric for major substation events is therefore zero.
Because major substation events are infrequent with a target of zero, the number of failures and failure trends are not useful metrics for managing this safety risk. As such, United Energy has developed a leading indicator for the risk of catastrophic substation transformer and switchgear failure based on the number of assets nearing the end of life and the effectiveness of asset management regimes.
The remainder of this section outlines for each safety metric used by United Energy, the historical performance, the asset classes that relate to the indicator, and targets both for the current and next regulatory period.
3.2 Historical Network Safety Performance
The United Energy network safety performance, as measured by asset failures, fires and incidents involving the public, has shown a deterioration since it began to report these metrics to ESV in 2011.
In their 2014 Safety Report on the Victorian Electricity Networks, ESV reports that United Energy’s safety performance has deteriorated for both asset failures and fire starts. In their covering note for the report, ESC state:
“The report for the 2014 calendar year found that:
Asset performance is either stable or improving for four out of five businesses
The number of fires cause by network assets declined for four out of five businesses
An overall increase in fire numbers and asset failures was driven principally by one company – United Energy” 3
In this section we discuss the safety metrics and their trends.
3.2.1. Asset Failure – No Fire
This safety indicator occurs when a distribution asset fails, without causing a fire. This metric is reported on a monthly basis to ESV for five types of asset failures - conductor plus HV tie failure, pole failure, HV fuse failure, cross arm failure and LV asset failure. Not all asset failures are reported.
3 Safety Performance Report on Victorian Electricity Networks 2014. - ESV July 2015

Network Safety Assessment
RRP 5-5 - Network Safety Assessment.docx Page 15 of 55
Figure 4: Asset Failures without Fires
The 2014 ESV report states ‘In 2014, United Energy reported a 23 per cent overall performance improvement in asset failures from 2013. This is the first reduction in overall failure numbers since 2010, while this reduction is welcome, the evidence of the upward trend reversing will be if numbers reduce in future years.’
As can be seen above the trend for the total of the asset failure – no fire is increasing in general despite the 2014 decrease in incidents.
Notably, the number of reported cross arm failures is a significant contributor to the of the overall asset failures causing potential safety incidents. While the number for 2014 is less than 2013, the trend is upward over the past five years.
The 2014 ESV report suggests:
‘The original AER-approved program called for replacement of cross arms based on age and condition; however, United Energy replaces cross arms based only on their condition.
If condition assessment was effective by itself, United Energy would be reversing the trend of cross arm failures and fires. The evidence is that United Energy’s cross arm replacement program is not keeping pace with the rate of incidents, and this is likely to seriously impact safety. Replacement rates need to be increased to reverse the upward trend as failure to do so will increase the safety risk; both age and condition should be used as criteria for replacement.’
United Energy will continue its practice of replacement on condition but has begun to use cameras for pole top inspection and expects that it will better target the cross arms that need replacement and reduce failure rates.
Likewise, another significant contributor to this indicator is LV asset failures. LV asset failures include conductors, switchgear, services and terminations, among others. Across electricity distributors in Victoria there has been a steady increase in the LV asset failures safety indicators, with more fire starts and an increased concern for public safety. United Energy’s asset management policy on most LV assets is to replace on failure, so it is no surprise that the number of failures is increasing given the increased proportion of assets nearing the end of their lives.
Network Safety Assessment
RRP 5-5 - Network Safety Assessment.docx Page 16 of 55
Failure of LV services and terminations can result in the potential for electric shocks to people who are or come in contact with the damaged asset and for fires particularly in high risk bushfire areas. The five year trend of the LV asset failure safety indicator seems to be steady albeit with a spike in 2013. This spike can be directly related to the spike in cross arm failures which contributed to the LV asset failures.
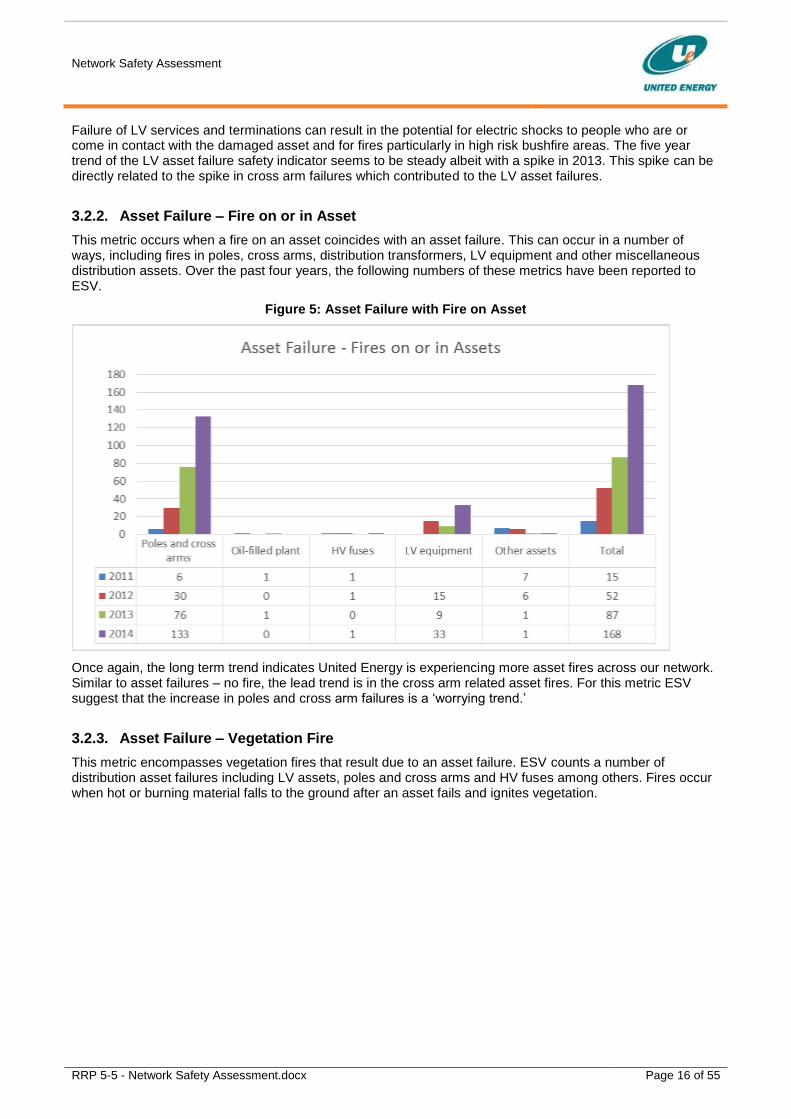
3.2.2. Asset Failure – Fire on or in Asset
This metric occurs when a fire on an asset coincides with an asset failure. This can occur in a number of ways, including fires in poles, cross arms, distribution transformers, LV equipment and other miscellaneous distribution assets. Over the past four years, the following numbers of these metrics have been reported to ESV.
Figure 5: Asset Failure with Fire on Asset
Once again, the long term trend indicates United Energy is experiencing more asset fires across our network. Similar to asset failures – no fire, the lead trend is in the cross arm related asset fires. For this metric ESV suggest that the increase in poles and cross arm failures is a ‘worrying trend.’
3.2.3. Asset Failure – Vegetation Fire
This metric encompasses vegetation fires that result due to an asset failure. ESV counts a number of distribution asset failures including LV assets, poles and cross arms and HV fuses among others. Fires occur when hot or burning material falls to the ground after an asset fails and ignites vegetation.
Network Safety Assessment
RRP 5-5 - Network Safety Assessment.docx Page 17 of 55
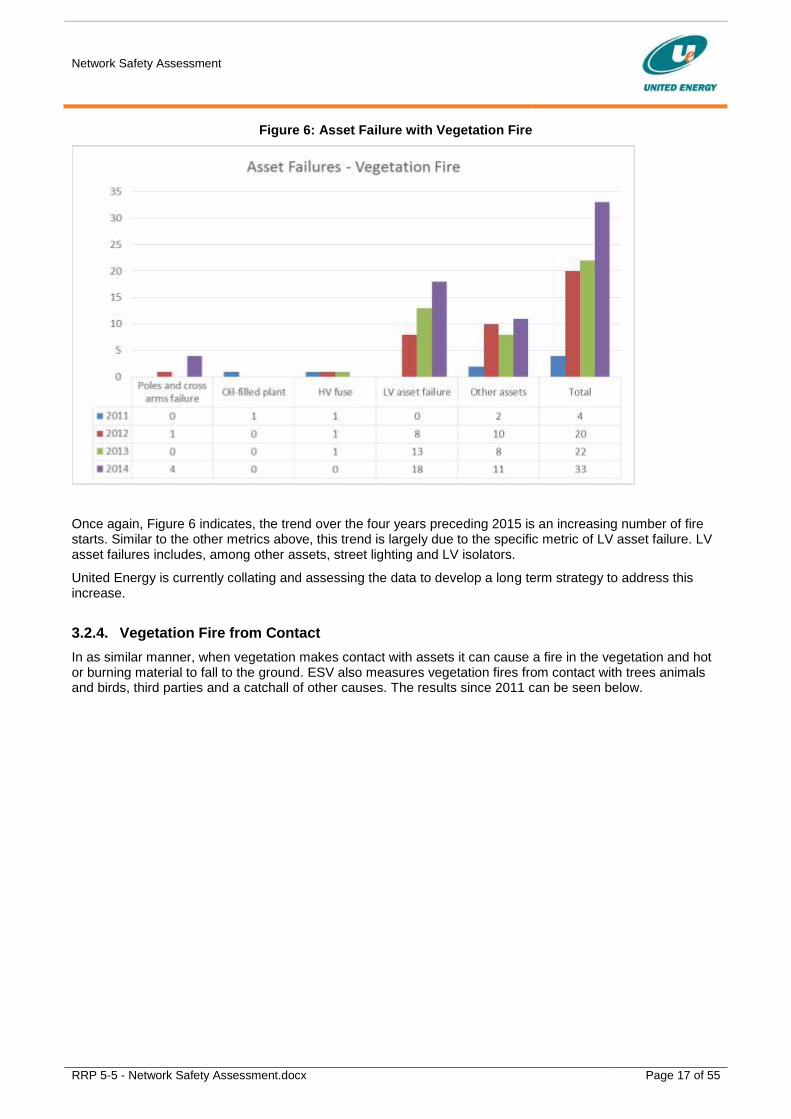
Figure 6: Asset Failure with Vegetation Fire
Once again, Figure 6 indicates, the trend over the four years preceding 2015 is an increasing number of fire starts. Similar to the other metrics above, this trend is largely due to the specific metric of LV asset failure. LV asset failures includes, among other assets, street lighting and LV isolators.
United Energy is currently collating and assessing the data to develop a long term strategy to address this increase.
3.2.4. Vegetation Fire from Contact
In as similar manner, when vegetation makes contact with assets it can cause a fire in the vegetation and hot or burning material to fall to the ground. ESV also measures vegetation fires from contact with trees animals and birds, third parties and a catchall of other causes. The results since 2011 can be seen below.

Network Safety Assessment
RRP 5-5 - Network Safety Assessment.docx Page 18 of 55
Figure 7: Vegetation Fires from Contact
In 2014 Energy Safe Victoria reported the number of vegetation fires due to contact across Victoria has increased from 2013. Similar to other metrics, the trend shows an increasing number of fires.
In 2011 vegetation fire starts were recorded as a single metric – “other causes”. It is likely a split between ‘trees’ and ‘third party’ metrics. This data was later recorded as two individual totals for 2012 onwards, as seen above.
Animals, commonly birds and possums, are at risk of electrocution as a result of accidentally contacting or damaging electricity network assets that are subject to live high voltage. When a bird or animal causes a flashover, burning matter can to fall from the asset to the ground igniting vegetation.
Accidental contact with the electricity distribution network by vehicles or deliberate contact by vandals can also cause sparking and lead to a vegetation fire. United Energy is monitoring this metric and it has been recorded at 4 for the last two years. It is not anticipated that this figure will increase into the years ahead.
Vegetation fires from tree contact are the highest concern for Energy Safe Victoria and United Energy, particularly in High Bushfire Risk Areas. Line clearance from vegetation requires good vegetation management and frequent maintenance along the electricity network.
Line clearance is a responsibility shared with the municipal councils as councils are responsible for managing their trees. Failing to adequately maintain the lines and vegetation inevitably causes contact and results in a fire with the consequence of:
loss of vegetation and bushland including animal habitats,
damage to assets and destruction of homes and businesses; and
Injury to humans and animals, in severe cases even loss of life.
The number of vegetation fires started from contact with United Energy’s assets by trees has been constant and has increased from 2013 to 2014 by 1. With the continuance of the vegetation management program it is anticipated that this figure will remain constant.

Network Safety Assessment
RRP 5-5 - Network Safety Assessment.docx Page 19 of 55
3.2.5. Asset failure – major substation event
United Energy’s seeks to manage their substation assets to avoid major substation events because of their significant potential to cause harm or death to its personnel or the public. These events can result in large explosions and fires that pose a significant safety risk, and can also result in widespread power blackouts.
Whilst these event are categorised as an asset failure (and whether a fire resulted), ESV also monitors major zone substation events and undertakes a dedicated and detailed investigation where it considers that there has been a significant safety risk for public or workforce. A recent example is the Morwell incident that occurred on the morning of the 4th of April 2014 which resulted in explosions, widespread community concern and the loss of supply to over 100,000 customers.
A major substation event is defined as a catastrophic circuit breaker or transformer failure or primary asset failure. The frequency of these events in presented in the table below.
Table 2: Zone Substation Major Equipment Failures
Asset Failure - Major Substation Event
2007 2008 2009 2010 2011 2012 2013 2014 2015
Switchgear Failure 0 0 0 0 0 0 4 0 1
Transformer Failure 0 0 0 0 0 0 0 0 1
Because major zone substation failures are so infrequent, the numbers of failures or failure trends are not useful metrics for analysing the safety risk for these asset classes. To overcome this problem, ‘leading’ indicators have been developed to assess the risks.
There are two principle leading indicators that can be used:
The number of assets in the ‘end-of-life’ risk window
The effectiveness of the implemented maintenance and replacement regime
The assets at the ‘end of life’ period can be assessed using a health index or reliability tool, such as CBRM or Weibull analysis. For further details, refer to UE report on ‘Assets High Risk of Failure Assessment4´.
The effectiveness of a maintenance and replacement regime can be difficult to measure, as such a measurement is more suited to detailed analysis such as FMEA and RCM, but an assessment of the technologies used, the frequency of maintenance and inspection activities and condition assessments can be combined to provide a leading indicator.
An increase in an indicator indicates an increase in the safety risk due to an increased likelihood of a catastrophic failure of major substation plant. To manage the risk, maintenance program are constantly reviewed, new cost-effective technologies are implemented, and replacement activities take place.
Table 3: Zone Substation. Equipment Leading Indices
Asset Failure - Major Substation Event Indices
2014 2020 (without
Repex) 2020 (with Repex)
Circuit Breakers 136 239 125
Isolators and Earth Switches 5 206 286 271
Transformers 300 381 309
Total Substation 642 805 705
In the table above, the higher the indicator, the more assets are at higher risk of failure. Table 3 demonstrates some increase in the risk of failure for switchgear assets - for isolators and earth switches rather than for circuit breakers – with the proposed Repex program. The table also indicates that the risk of failure of a transformer or associated assets is approximately constant.
4 Document No UE PL 2044 Asset High Risk of Failure Assessment 5 Safety Index for switchgear includes isolators as their failure poses a risk to operators.
Network Safety Assessment
RRP 5-5 - Network Safety Assessment.docx Page 20 of 55
3.2.6. Incidents Involving the Public
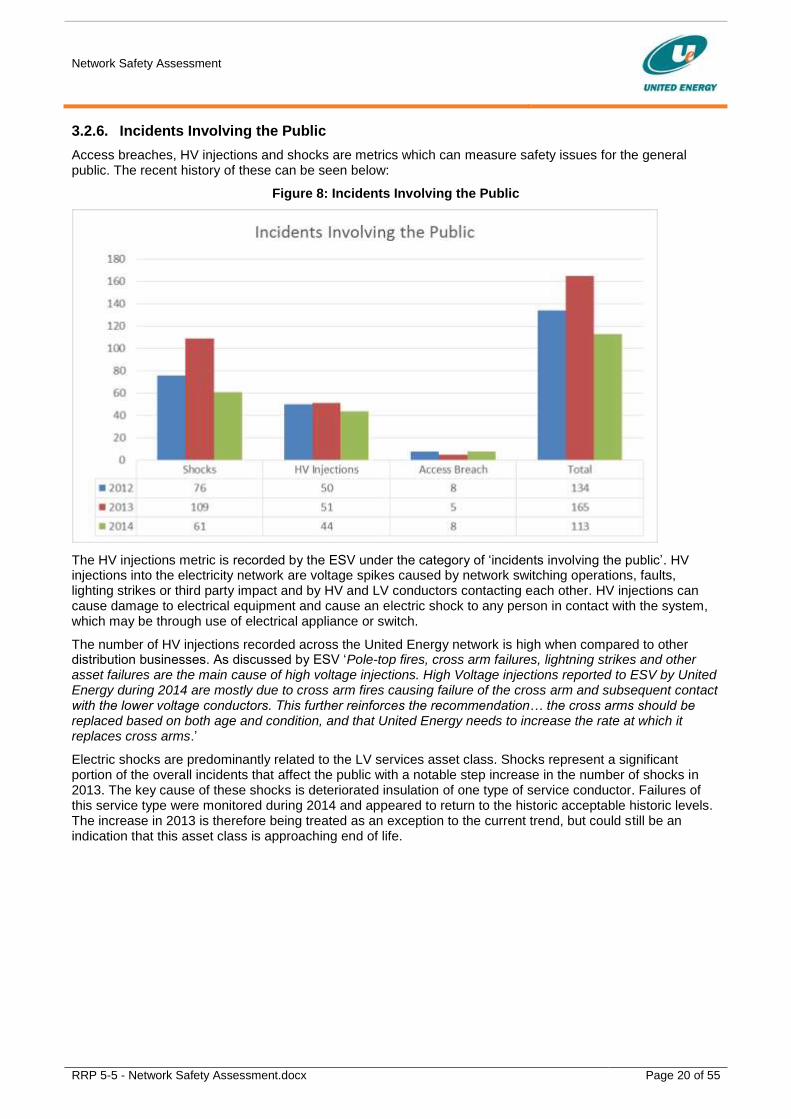
Access breaches, HV injections and shocks are metrics which can measure safety issues for the general public. The recent history of these can be seen below:
Figure 8: Incidents Involving the Public
The HV injections metric is recorded by the ESV under the category of ‘incidents involving the public’. HV injections into the electricity network are voltage spikes caused by network switching operations, faults, lighting strikes or third party impact and by HV and LV conductors contacting each other. HV injections can cause damage to electrical equipment and cause an electric shock to any person in contact with the system, which may be through use of electrical appliance or switch.
The number of HV injections recorded across the United Energy network is high when compared to other distribution businesses. As discussed by ESV ‘Pole-top fires, cross arm failures, lightning strikes and other asset failures are the main cause of high voltage injections. High Voltage injections reported to ESV by United Energy during 2014 are mostly due to cross arm fires causing failure of the cross arm and subsequent contact with the lower voltage conductors. This further reinforces the recommendation… the cross arms should be replaced based on both age and condition, and that United Energy needs to increase the rate at which it replaces cross arms.’
Electric shocks are predominantly related to the LV services asset class. Shocks represent a significant portion of the overall incidents that affect the public with a notable step increase in the number of shocks in 2013. The key cause of these shocks is deteriorated insulation of one type of service conductor. Failures of this service type were monitored during 2014 and appeared to return to the historic acceptable historic levels. The increase in 2013 is therefore being treated as an exception to the current trend, but could still be an indication that this asset class is approaching end of life.

Network Safety Assessment
RRP 5-5 - Network Safety Assessment.docx Page 21 of 55
3.3 Network Safety Targets
For the most part our targets for network safety have been set firstly by considering the average performance of the 2011 -2014 period. For some of the metrics, reliable data is not available for 2011 and in this case an average of the available data was used. The targets were modified using engineering judgement considering the proposed repex for the forecast period and the affect that this would have on the asset age profile. Our targets are as follows:
Table 4: Safety Metrics, Performance and Targets
Safety Metrics Average 2011 -
2014 2014
Performance Targets 2011-
2015 Target 2016-
2020
Asset failure no fire 231 232 210 210
Asset failure - fire on asset
95 201 88 93
Asset failure – vegetation fire
20 33 21 27
Vegetation fire from contact with asset
15 18 15 15
Leading Indicator substation major event
N/A 642 710 710
HV Injections 48 44 45 45
Electrical Shocks 82 61 80 35
Access Breach 7 8 8 8
The target for 2016-2020 for the number of asset failures that are reportable to ESV have been set considering the performance in the current period. Although, with the proposed level of repex, the proportion of asset at high risk of failure will increase, by better targeting our replacements through improved inspection and conditions monitoring, and focusing on those asset classes which most affect network safety, the targets for the next period are at similar levels to the current period.
Our targets for incidents involving fire for 2016-2020 have increased slightly to coincide with the F-Factor targets set by AER. The current target of 124.2 and was not achieved in 2014. This has been increased to 134.9 in the next period, recognising the deteriorating performance in our current period.
Our target for HV injections is similar to current period performance. HV injections are cause predominantly by cross arm and conductor failure. The replacement expenditure levels for cross arms is expected to provide an improvement in performance but it will be largely offset by a deteriorating performance in conductors. United Energy believe this trade off will provide value to our customers as the cost of replacing conductor is significantly more than that of replacing cross arms.
Our performance with electric shocks showed an improvement in 2014 over previous years which reflects the business’s investments in the program to replace Neutral Screened Conductor, a type of service cable. A further step improvement is expected with the implementation of new technology proposed for 2016-2020 through our OT projects that will monitor and identify faulty service cables before customers experience a shock. This is a cost effective way to improve public safety and has been assessed as ALARP.
The inherent risk of access breaches in our zone substations is increasing for several reasons outlined elsewhere in our RRP. Two programs have been proposed to address this increase. As a result, the target for the next period has been maintained at the level achieved in the current period.
Network Safety Assessment
RRP 5-5 - Network Safety Assessment.docx Page 22 of 55
Overall, our performance targets for the next period are consistent with targets for the current period. The notable exceptions are electric shocks and asset failures that cause vegetation fires. For electric shocks, a step improvement in safety can be achieved at modest cost through the application of new technology. On the other hand, targets for asset failures that cause fires have been set higher in accordance with the revised F-factor targets and consistent with a higher proportion of asset in the “at risk” phase of their life cycle due to their age. The aging trend will continue in the next period and higher F factor targets reflect this.
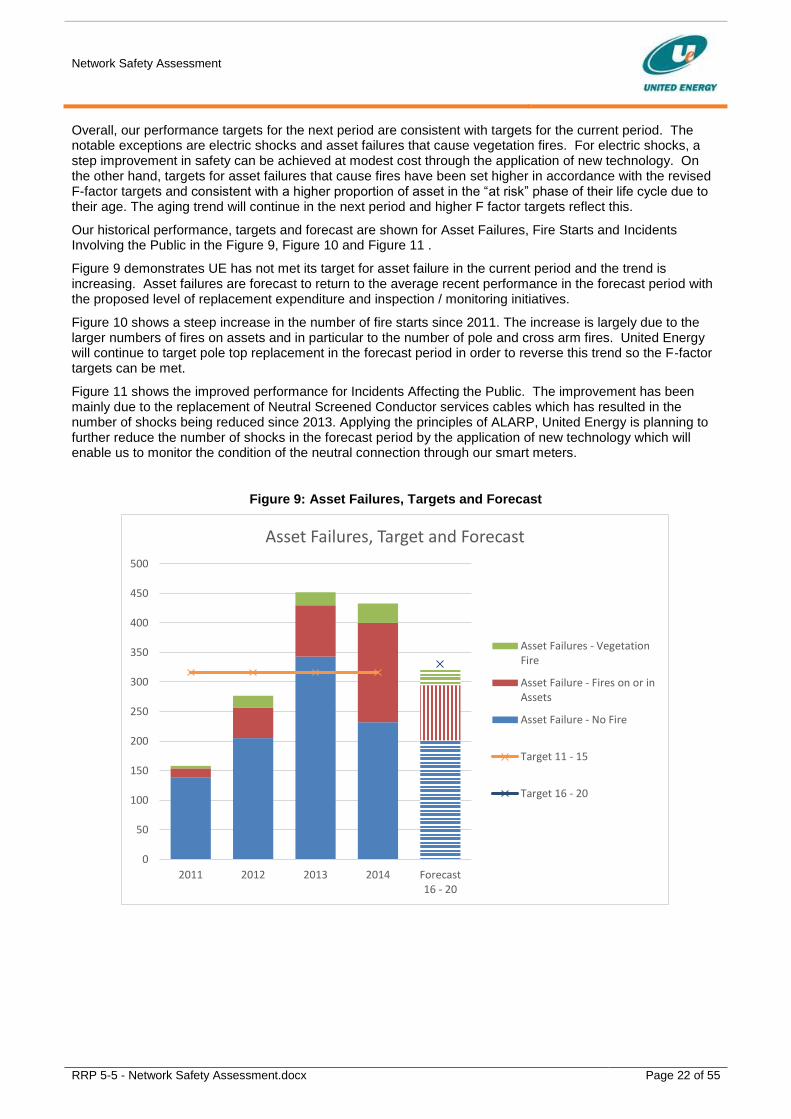
Our historical performance, targets and forecast are shown for Asset Failures, Fire Starts and Incidents Involving the Public in the Figure 9, Figure 10 and Figure 11 .
Figure 9 demonstrates UE has not met its target for asset failure in the current period and the trend is increasing. Asset failures are forecast to return to the average recent performance in the forecast period with the proposed level of replacement expenditure and inspection / monitoring initiatives.
Figure 10 shows a steep increase in the number of fire starts since 2011. The increase is largely due to the larger numbers of fires on assets and in particular to the number of pole and cross arm fires. United Energy will continue to target pole top replacement in the forecast period in order to reverse this trend so the F-factor targets can be met.
Figure 11 shows the improved performance for Incidents Affecting the Public. The improvement has been mainly due to the replacement of Neutral Screened Conductor services cables which has resulted in the number of shocks being reduced since 2013. Applying the principles of ALARP, United Energy is planning to further reduce the number of shocks in the forecast period by the application of new technology which will enable us to monitor the condition of the neutral connection through our smart meters.
Figure 9: Asset Failures, Targets and Forecast
0
50
100
150
200
250
300
350
400
450
500
2011 2012 2013 2014 Forecast16 - 20
Asset Failures, Target and Forecast
Asset Failures - VegetationFire
Asset Failure - Fires on or inAssets
Asset Failure - No Fire
Target 11 - 15
Target 16 - 20

Network Safety Assessment
RRP 5-5 - Network Safety Assessment.docx Page 23 of 55
Figure 10: Fire Starts, Targets and Forecast
Figure 11: Incidents Involving the Public, Target and Forecast
Care is needed in the level of aggregation of safety metrics and associated targets, and the degree of trade-offs between different categories of safety risks. This is because the level of hazard or risk is not the same for all safety metrics, some being more onerous than others. In particular, fire starts in high bushfire risk areas and particularly at times of high fire risk (total fire ban days), pose a higher level of risk than many other risks, and should not be traded off against say electric shocks.
Network Safety Assessment
RRP 5-5 - Network Safety Assessment.docx Page 24 of 55
4. Approach to Managing Network Safety
As discussed in section 3, United Energy measures and manages its network safety performance using the same metrics as used by Energy Safe Victoria to regulate the safety of the Victorian electricity networks. These metrics can be grouped into three areas, namely asset failures, fire starts and incidents involving the public.
Section 3 describes our safety metrics, why we selected them, and how we set targets for each metric. In Table 4 we summarise the current network safety performance and target performance for the 2016-2020 regulatory period.
Our asset replacement program is based on Asset Life Cycle Strategies (LCS) prepared for each asset class, which select a strategy for managing the assets to achieve desired outcomes (primarily reliability and network safety) at least life cycle cost. In analysing the asset class safety for the forthcoming regulatory period, a full safety risk assessment is carried out for each asset class and is included in the LCS. The following factors to inform us on the “current state” of each asset:
Recent safety performance and trends against the relevant safety metrics for the asset class, including the relative impact of each asset class on specific safety metrics.
Historic replacement capex.
Historic Opex.
Historic inspection and maintenance practices.
The proportion of assets in the last 15% of their lives (where failure rate increases)
Other detailed information on asset condition etc.
The following factors are then set based on what may be reasonably achieved for reasonable cost considering the specific circumstance for the asset class and its impact on specific safety metrics.
Forecast replacement capex in the forthcoming regulatory period.
Forecast Opex in the forthcoming regulatory period.
Proposed changes to inspection and maintenance practices.
Whether specific programs are required to address particular safety issues.
With the level of asset replacement capex proposed for the next regulatory period, the proportion of network asset reaching the last 15% of life will increase for the overall network, thus increasing the level of asset risk that must be managed to achieve network safety outcomes.
UE manages this increasing risk by targeting the replacement of assets with the biggest impact on network safety metrics and where replacement unit costs are lower. For example, cross-arms are the primary cause of UE exceeding its asset failure and fire start safety metrics in 2014. In comparison to other asset classes, the unit cost of replacement is low, making cross arm replacement an efficient way to address these network safety issues.
UE also uses specific safety projects often using new technology to:
Address risks that are increasing due to externalities. A key example is the use of a CCTV and an OT Security program to address the increasing security risk to our network.
Reduce network safety risk to ALARP. Key examples here are the OT projects to halve the number of electric shocks to the public in a cost effective manner, and REFCL’s, which will reduce UE’s bushfire risk by 35% at a cost commensurate with the level or risk reduction.
In summary, we have not sought to address the deterioration in safety performance through replacement initiatives alone. Instead, we have assessed and proposed a range of capex and opex initiatives to meet our network safety objectives at minimum cost.

Network Safety Assessment
RRP 5-5 - Network Safety Assessment.docx Page 25 of 55
5. Impact of Investment to Achieve Safety Obligations
5.1 Summary
UE has developed and implemented a prudent holistic approach to maintaining safety at minimum cost, as outlined in Section 4. In summary
UE has performed a detailed assessment of the performance and condition of each asset category and this is set out in individual Life Cycle Strategies and Expenditure Explanatory Statements.
The assessments include consideration of the proportion of assets at high risk of failure, its recent network safety performance, the condition of the overall asset category and whether there are any safety issues associated with the asset. Replacement capex forecasts have been established for each category, considering a range of factors including the specific circumstances for each asset class, what can be achieved at reasonable cost and the impact of the category on various network safety metrics.
Replacement capex and specific Opex initiatives have been planned to address the range of objectives at lowest life cycle cost. Where safety performance will not be most cost effectively met by replacements alone, other programs have been identified to close the gap between required and forecast performance. (eg. Security / access risk).
UE have used the ALARP principal in identifying additional projects in accordance with our obligations that will provide an improved safety performance and at the same time provide value to our customers.
United Energy’s holistic assessment of its capital and operational expenditure program to maintain safety is set out in Table 5 on the next page. In the table we present the information to support our holistic approach.
The rows presented in Table 5 can be grouped into two blocks:-
The first block of information is in the rows in the top half of the table and provides information by assets class. It provides information on the replacement expenditure in the current and forecast periods, the current safety performance trends and effect of repex on forecast performance in terms of fire starts, asset failures and incidents involving the public.
The block of information presented in the rows of the bottom half of the table list our projects classified as “Other – Unmodelled Repex”, which includes non VBRC safety projects and Operational Technology safety projects, and VBRC Safety Projects. Data is presented for the current period, and for the next regulatory period forming part of our forecast of safety performance.
The information presented in the columns is divided into the periods 2011 - 2015 and 2016 – 2020, providing both historical data provided to ESV for the current EDPR period and forecasts for the next.
In the current period the table presents the following historic considerations and present status for each asset class:
Replacement capex 2011-2015 (in $2015)
Estimated percentage of the asset class in the last 15% of its life (eg the wear out phase).
Asset failures (2014)
Fire starts (2014)
Incidents involving the public (2014)
Trends in asset failure, fire starts, and incidents involving the public(2011-2014)

Network Safety Assessment
RRP 5-5 - Network Safety Assessment.docx Page 26 of 55
Table 5: Repex and Opex to Manage Network Safety
Version 6.3
Asset Class Description
Repex Categories
Asset Code Replacement
Capex
Actual
$'M Real 15
11-15
Assets at High
Risk of Failure
in 2015
no fire fire on asset vege fire from
asset failure
vege fire from
contact: vege,
animal, 3rd
party
major ZSS
event indices
HV injection Electric
shocks
Access breach no fire fire on asset vege fire
from asset
failure
vege fire
from contact:
vege, animal,
3rd party
lead indicator
substation
major fire or
explosion
HV injection Electric
shocks
Access breach Assets at High
Risk of Failure
in 2020
without rep.
capex
Replacement
Capex
Forecast
$'M Real 15
16-20
Assets at High
Risk of Failure
in
2020 with
replacement
capex
no fire fire on asset vege fire
from asset
failure
vege fire
from contact:
vege, animal,
3rd party
major ZSS
event indices
HV injection Electric
shocks
Access breach Comments
RO
Bare conductor 0 32% 34 9 ↑ ↑ 51 9
PD
HV tie failure9 ↑ 12
underground cable RU, RX, RS 38 15% 20% 43 19%A failure rate increase is forecast due to more cable near end of life but
with little or no safety consequence.
distr (RH) 11 6% 0 0 → → 15% 14 8% 1 0
ZSS
(RS & PZ)21 34% 300 → 52% 55 37% 309
distr (RH, RX). RS 35 16% 11 33 18 ↑ ↑ ↑ 28% 48 23% 16 38 26
HV fuse failure 15 1 0 ↑ ↑ → 22 2 1
ZSS (RS) 24 51% 342 ↑ 64% 32 47% 396
services RM 69 5% 57incl
above61 ↑ ↑ ↑ 8% 34 0% 50
incl
above70
The completing of Neutral Screened Conductors replacement program
should significantly improve shocks. Whilst few aged assets, we have a
specific type that are still at a risk to failure.
protection and control PQ, PR, PZ, RC 31 21% 38% 34 22%
other 1 11 0 ↓ ↑ → 1 11 0
Subtotal Asset Replacement
(excl.ZSS Primary)367 398
ZSS primary assets RC, RS 8 18% 8 ↑ 24% 10 18% 16 Increased rsik of safety breach
Subtotal Asset Replacement
(incl. ZSS Primary)19% 232 168 33 18 642 44 61 8 0% 0% 0% 0% 0% 0% 0% 0% 28% 23% 207 95 39 18 705 45 70 16
Non VBRC Safety Projects CCTV 1 6 -4 CCTV is used to address increased safety risk
Subtotal Non VBRC Safety 1 6 0 0 0 0 0 0 0 -4
Service Mains
Deterioation1 4 -35
Identifying unsafe situations before shocks occur via new technology.
Assessed as ALARP
In Meter Capabilities 0 2incl
above
Identifying unsafe situations before shocks occur via new technology.
Assessed as ALARP
LiDAR 1 7 -3 -1Should lead to detection of trees not to code and some asset failures -
Council still to action with UE supplied data
OT Security 0 6 -4 Program to address increased security risk
Intelligent Nerwork
Device0 5
incl
above
Identifying unsafe situations before shocks occur via new technology.
Assessed as ALARP
2 projects 0 7
ZSS transf monitoring 0 2
Various 2 8
Subtotal Operational Technology 4 41 0 0 -3 -1 0 0 -35 -4
Clashing 1 4 -2 Reduce potential fire starts
Animal
proofing7 10 -2 Animal proofing only, will not affect third party, vege etc.
Other 17 21
Subtotal Reliability Performance 24 36 0 0 -2 -2 0 0 0 0
Environmental PE 2 5
Power Quality PQ 5 8
TS Rebuild replacement 5
Subtotal "Other Repex" 45 112 0 0 -5 -3 0 0 -35 -4
Conductors 4 4 Impact included above under overhead conductor
HV ABC 1 30 -4 -2 -2 Targetted replace should reduce failures
LV ABC 4 1 -1 0 0 Minimal impact
Ampact (unmodelled) 5 5 -1 -1 Reduced conductor/connector failure
Clashing / spreaders 2 0 0 0 0 Reduced repeat clashing, immaterial expenditure under VRBC
Dampers 3 5 0 VRBC Obligation - minimal Impact for remainder of program
REFCL's 3 7 -5 Reduced fire starts in United Energy's highest risk areas
SWER 2 0
Subtotal VBRC Safety Projects 24 53 -6 -2 -8 0 0 0 0 0
TOTALS PER INDICATOR 437Actual
2014 232 168 33 18 642 44 61 8 564 Forecast 201 93 26 15 705 45 35 8
TARGETS Target 210 88 21 15 710 45 80 8 Target 210 93 27 15 710 45 35 8
above above above above below below below on target below on target below on target below on target on target on target
TOTALS PER INDICATOR GROUP 433 219 113 320 134 88
TARGETS PER INDICATOR GROUP 319 124 133 330 135 88
18%
7%
CY11 - 15
Asset failure 2014
Fire starts 2014
ZSS
failure
2014
Asset failure trend ZSS
failure
trendFire starts trend
Asset failure per annum
Fire starts per annum
incl
above
↑
54
3incl
above
53
incl
above
incl
above
4incl
above
incl
above148% 46%
The replacement of HV ABC will result in fewer fire starts from conductor
faiulres. The program to replace connectors will also address HV injection
from conductor failure.
The combined spend in pole fire mitigation and cross arm replacement
will be maintained to address deteriorating safety/fire starts. Inspection
methodology and inspection volumes have been improved / increased.
5
incl
above
incl
below
No Increase in pole failures has been forecast current codition
assessment techniques are proving to be highly effective
incl
above4
1
pole replacement & staking
ZSS
failure
per
annum
pole top structures PF & RX 102 103
CY16 - 20
Incident involving public 2014 Incident involving public trendIncident involving public per
annum
10%133 4 5 44 45↑ ↑ ↑
Opex Changes between Current v Next Reg Period
↑
ZSS transformer replacement occurs before catestrophic failure avoiding
safety risk to personnel and public. Distribution transformer failure does
not present a significant safety risk
switchgear
Zone substation switchgear is targeted for replacement before
catestrophic failure occurs, thereby avoiding safety risk to personnel and
public. HV air-break switchgear replacement is partly to addess safety
risks that occur during maintenance. Safety risks to public from HV
swithcgear failures are not significant.
Maintain current general practice of cyclic inspection, repair on failure,
replace on condition (noting current practice does vary across the
asset class).
Maintain current general practice of run to failure, then repair or
replace. Some increase in conditions monitoring for some asset
classes, particularly HV cable testing.
For distribution transformers, maintain mandatory inspection and
reactive maintenance and replacement.
36
overhead conductorincl
above
incl
above
VBRC Safety Projects
Operational Technology
Safety
incl
below3
incl
above
incl
aboveRP & RR
Operational Technology
Reliability
Operation Technology
Other
Reliability Performance
transformers
Pole top camera inspections will improve condition assessment and
should result in fewer equipment failures. Higher inspection volumes
(mid-cycle Aerial) will improve coverage across the asset base to
better target replacement.
Maintain current pole management practice of staking poles once
limited life status is reached.
↑ 27% 98
11%14% 39↑
Total Incident involving public
Forecast 16 - 20
Total Incident involving public
Target 16 - 20
Additional condition monitoring is proposed as more equipment enters
the last 15% of life, to guide optimum timing to replace.
For distribution switchgear, maintain "run to failure" with targeted
replacement program.
Additional condition monitoring is proposed as more equipment enters
the last 15% of life, to guide optimum timing to replace.
No change
No change
No change
Total Fire Starts
Actual 2014
Total Fire Starts
Target 11 - 15
Total Incident involving public
Actual 2014
Total Incident involving public
Target 11 - 15
Total Fire Starts
Forecast 16 - 20
Total asset failure Target
11 - 15
Total asset failure
Actual 2014
No change
Total asset failure
Forecast 16-20
Total asset failure
Target 16 -20
Total Fire Starts
Target 16 - 20

Network Safety Assessment
RRP 5-5 - Network Safety Assessment.docx Page 27 of 55
For 2014, targets were exceeded by a significant margin for asset failures (actual 433 versus target 319) and fire starts (actual 219 versus target 124). Incidents involving the public met our targets.
Safety trends for the 2011-14 period show a clear deterioration in almost all our safety metrics.
This safety deteriorating network safety performance is also presented in ESV’s report “Safety Performance Report on Victoria’s Electricity Networks 2014”.
Table 5 also presents similar information for the period 2016 -2020.
Estimated percentage of asset class in the last 15% of its life (in 2020) without the effect of replacement capex for 2016 -2020.
Replacement capex for 2016 -2020. ( in $2015)
Estimated percentage of the asset class in the last 15% of its life (in 2020) with the effect of replacement capex in 2016-2020.
Comments on opex changes between the current and next regulatory period.
Forecast asset failures (2016-2020)
Forecast fire starts (2016-2020)
Forecast incidents involving the public (2016 -2020)
With the level of expenditure proposed, the number of assets in the last 15% of their life and at high risk of failure will increase for all asset types except poles tops, services and zone substation transformers. More asset failures are therefore forecast for a number of asset classes. The effect of our network safety programs has been forecast and is presented in the table to demonstrate that with our overall Repex spend, including asset replacement and proposed safety projects, we will meet our obligations under the Rules to maintain network safety and under legislation to achieve ALARP.
The forecast safety performance for the 2016 to 2020 period is presented in the bottom two lines in Table 5. The setting of targets is discussed in section 0
5.2 Asset Replacement Capex and Opex
A summary of the effect of our asset replacement capex and opex programs on the safety performance of each asset class is provided below. More detail is provided in section 6.
Pole Top Structures: Although the safety performance of pole top structures deteriorated between 2011 - 2014 an increase in expenditure on pole fire mitigation and cross arm replacement programs in 2014 and 2015 is expected to have reversed this trend. Expenditure will be maintained at similar levels in the forecast period and result in a reduction in the number of “aged” assets by 2020. A change to camera inspection of pole tops will improve condition assessment and is expected to improve the effectiveness of replacement Capex. The improved inspection techniques and the level of expenditure is forecast to ultimately result in an improvement in the performance of this asset class for the next period. This will have a significant impact in addressing the deterioration in asset failures and fire starts, and is forecast to assist in returning performance to target.
Pole Replacement and Staking: In period 2016 - 2020, the total number of poles that will be replaced or staked will increase but UE is proposing to increase the proportion of poles that are staked over those replaced. As a result expenditure on pole replacements will be maintained but there will be an increase expenditure on pole staking. The proportion of aged assets is forecast to increase from 7% to 11% of assets. The largest safety risk for a pole is if the pole breaks or falls over. We believe that with our current asset management practices, this risk can be managed so that pole failures will not increase.
Overhead Conductors: There will be no change in the current conductor management practice in the forecast period and conductors are usually run to failure. The exception is the replacement of the HV ABC which is failing prematurely and its replacement should reverse the deteriorating trends in recent years for that asset type.

Network Safety Assessment
RRP 5-5 - Network Safety Assessment.docx Page 28 of 55
Without the proposed replacement expenditure, the proportion of the overall asset class with less than 15% remaining life will increase from 26% in 2015 to 36% by 2020. With the forecast expenditure, the percentage of assets will be at 35%. Although some deterioration in the performance of this asset class is expected over the period to 2020 due the larger number of “aged” assets, this will be more than offset by the improvement in safety provided by expenditure under the VBRC safety programs, most of which is targeted at improving the safety performance of this asset class. (see below.)
Underground Cables: In the period 2016 – 2020, there is no change proposed to the current general practice of run to failure and then repair or replace. There is also no significant change in replacement or opex expenditure on cables aimed at safety. The number of aged assets will increase and more failures are forecast. As this asset class does not contribute to our safety metrics, the forecast larger number of failures is not expected to affect safety outcomes.
Zone Substation Assets – Transformers, Switchgear and Primary Plant:
Zone substation failures, although infrequent, have a large impact on safety for two reasons:
They restrict the ability of the network to supply power to large areas, potentially for long periods of time, impacting public health because health services that rely on power cannot be provided.
There is a risk of major fire or explosion which could potentially injure or kill members of the public or UE employees.
Typically because of the enormous consequences of a zone substation failure and the relatively few numbers of these assets, their condition is individually assessed and assets are ideally replaced just before they fail. For zone substation assets, United Energy is using leading indicators based on the age and condition of the plant to assess their safety risk. Expenditure levels in 2016 - 2020 are set to maintain the number of “aged” assets at current levels and maintain a similar safety risk.
Distribution Transformers and Switchgear: There are no plans to change the current asset management practice for distribution switchgear and transformers. Unless problems are identified with particular types of equipment, the practice is to run to failure. If there are problems, particularly if the equipment poses a safety risk, it may be programed for replacement before it fails. With the levels of expenditure proposed the proportion of “aged” assets will increase by 2020 which is forecast to result in a small decrease in safety of these assets and an increase in the number of fire starts as result of asset failure.
Protection and Control: Protection and control systems are critical for the safe operation of the network and to prevent undue equipment damage when faults occur. With the levels of expenditure proposed, a larger proportion of this asset class will be approaching the end of life at the end of the period than at the start, increasing from 22% to 25%. The management of this asset class is complex as older electromechanical relays are replaced by ones with microprocessor technology. The electromechanical relays are high maintenance and, if maintained, can have a relatively long life. The microprocessor relays have a shorter life but have many other advantages such as zero maintenance and self-monitoring. Overall performance is expected to improve by 2020.
5.3 Unmodelled Repex – Non-VRBC, OT Safety and Reliability Projects
In addition to our replacement expenditure United Energy is proposing a number of projects to either address an increasing safety risk or to reduce safety risk to ALARP in accordance with our obligations.
Closed Circuit TV (CCTV) monitoring is proposed in high risk security breach areas including zone substation and non-pole substation buildings and grounds. The cameras will address the increasing risk by reducing the number of security breaches by acting as a deterrent and by allowing prompt response when breaches occur. They will therefore reduce the risk of non-utility personnel contacting plant and dangerous voltages, and other safety risk associated with access breaches.
OT security project will harden our zone substation operational systems and advanced metering network against cyber-attack. This will allow our network to be operated safely and securely and address this increasing risk.

Network Safety Assessment
RRP 5-5 - Network Safety Assessment.docx Page 29 of 55
Service Mains Deterioration, In-Meter Capability and Intelligent Network Device are three projects that in combination will allow the integrity of cables (including service and neutral conductors) to be monitored. An alarm will be raised for a fault which will allow a response before customers are exposed to the hazardous situation. This is the application of new technology which is more cost effective than replacing services than bulk replacement of service cable types more prone to failure. This technology is expected to cause a step decrease in the number of electric shocks experience by the public, consistent with results achieved by other utilities.
LiDAR is the application of laser technology to allow 3D mapping of electricity distribution assets. Its main benefits are in measuring clearance between assets, between assets and ground and between assets and trees. By identifying clearance problems it will allow them to be rectified and thus prevent contact which can lead to fire starts.
Two of our projects whose principal purpose is to maintain reliability also provide a safety benefit. We have assessed this benefit in our safety analysis. These are:-
Our bird and animal proofing project will prevent birds and animals from contacting our HV network thereby improving its reliability. A certain percentage of the birds and animals that contact the network will catch fire as a result of this contact and, on falling to the ground will cause a vegetation fire. By preventing birds and animal faults, this project will also reduce our fire starts, a safety metric.
Our clashing prevention program will prevent clashing of conductors during a fault. Under the right conditions, clashing will cause sparking which can start vegetation fires. Thus this project will also reduce our fire starts and improve our fire start performance.
Our Other - Unmodelled Repex projects are discussed in greater details in section 7.
5.4 VBRC Safety Projects
In areas at high risk of bushfires, UE has proposed a number of programs under its VBRC safety program. These programs include the following:
Replacement of HV ABC conductor which has been failing prematurely and the mode of failure has been causing fire starts.
Installation of LV ABC conductor particularly in heavily treed areas to prevent faults and fire starts
Installation of dampers and vibration rods to prevent conductor failure. These are obligations in the Fire Prevention Plan.
Installation of rapid earth fault current limiting technology at two zone substations within the High Bushfire Risk Area. This will prevent fires that occur due to earth faults. The project has been submitted as part of UE’s Fire Prevention Plan.
Replacement of connectors (Ampact) to prevent failures caused by their failure.
Our VBRC projects are discussed in greater details in section 8.

Network Safety Assessment
RRP 5-5 - Network Safety Assessment.docx Page 30 of 55
5.5 Summary
UE has undertaken an assessment to forecast the Repex it needs to maintain network safety and meet its ALARP safety risk mitigation obligations efficiently.
The assessment considers current safety performance which is above target and deteriorating, and the underlying health of the network where an increasing proportion of assets are entering the “wear out” phase. Thus, our top down assessment is that a significant increase in expenditure will required both to return network safety to target levels, and to address the ongoing increasing proportion of assets at high risk of failure.
UE is proposing
Asset replacement of expenditure of $408M (compared to current period of $375M)
Other - Unmodelled Repex safety projects of $30.9M (compared to current period < $4.4M)
VBRC safety projects totalling $53M (compared to current period of $24M)
This will achieve the following outcomes in the 2016-20 period:
Return asset failures to target levels consistent with our recent average performance.
Return fire start performance to target, by reducing fire starts caused by asset failure.
Address the increasing risk of bushfire due to premature escalating failures of HV ABC cable.
Reduce UE’s overall bushfire risk by 35% through the installation of two REFCL’s.
Address our increasing security and access breach risk to maintain current safety levels.
Reduce electric shocks experienced by the public by 50% using a cost effective method assessed as ALARP.
These benefits can be equated to an increase in Repex compared to the 2011-15 period, as follows:
$33.0M to maintain network safety by addressing deteriorating performance and thus returning performance to target, and addressing deteriorating network health
o $33.0M in asset replacement (noting replacement must also assist to maintain reliability)
$ 54.4M to reduce safety risk as per VBRC and ALARP obligations, and address externalities
o $28.9M for VBRC program
o $11.1M to address increasing security and access breach risk
o $8.0M to reduce electric shocks to the public by 50%, with initiatives assessed as ALARP
o $6.4M for LiDAR to reduce bushfire and other safety risks

Network Safety Assessment
RRP 5-5 - Network Safety Assessment.docx Page 31 of 55
6. Impact of Asset Replacement by Asset Class
This section provides detail for each asset replacement and opex program and the impact each will have on the network safety metrics relevant for that asset class.
We provide further comment on each asset class, its current performance and how the asset class is affected by the various programs. These comments should be read in conjunction with the appropriate asset Life Cycle Strategies (LCS) and Category Expenditure Explanatory Statements (CEES).
6.1 Pole Top Structures
Please refer to the following documents for more information on this asset class.
References:
Pole Top Structures Life Cycle Strategy: UE PL 2006
Category Expenditure Explanatory Statement Pole Top Structures: NET 448
Pole top structures interfaces include:
Cross arm mounted assets include:
o Overhead line switchgear;
o HV surge arrestors and
o HV & LV Outdoor fuses.
Associated pole mounted equipment includes:
o Overhead line capacitors;
o Pole type transformers;
o Automatic circuit reclosers; and
o HV surge arrestors.
6.1.1. Background
Pole Top Structures consist of HV and LV cross arms and cross arm hardware. They have contributed significantly to deteriorating network safety.
Failure modes can be divided into mechanical failure and electrical failure. In mechanical failure, when the cross arms deteriorate, the cross arms break or the pole top hardware, such as insulators, become loose or even fall off the pole.
Electrical failure is failure of the insulation which may cause a flashover or leakage currents. Leakage currents, in turn, can cause pole fires. Electrical failure may be caused by a cracked insulator or by dust and pollution building up on the insulator. Alternately, animals and birds could bridge an insulator causing a flashover.
Failures are classified broadly into two groups:-
those that are caused by a cross arm fire and are somewhat weather dependant and
those that are due to all other causes and are usually associated with equipment failure.
The following safety metrics are relevant for pole top structures:
1. Asset failure - no fire
2. Asset failure - fire on asset
3. Asset failure – vegetation fire
4. Vegetation fire from contact

Network Safety Assessment
RRP 5-5 - Network Safety Assessment.docx Page 32 of 55
5. HV injection
The table below outlines the safety incidents for 2014 and those predicted for the 2016 – 2020 EDPR period as well as the assets at high risk of failure and capital expenditure in the category.
Table 6: Safety Metrics Pole Top Structures
Safety Metrics Per Annum
Replacement Capex Actual CY2011-15 $'M
no
fir
e
fire
on
Asset
veg
e f
ire f
rom
asset
fail
ure
veg
e f
ire f
rom
co
nta
ct
HV
in
jecti
on
Ele
ctr
ic s
ho
cks Assets at High
Risk of Failure in 2015
CY 14 102 103 133 4 5 44 0 18%
Replacement Capex Forecast CY2016-20 $'M
Assets at High Risk of Failure in 2020 without repex
Assets at High Risk of Failure in 2020 with repex
CY 16-20 98 54 53 1 5 45 0 27% 10%
This table shows the following key points:
Repex for the pole top asset class is the largest portion of expenditure on any single asset class in both the 2011 - 2015 and 2016 - 2020 EDPR periods. This can be attributed to the vast number of pole top assets and their condition.
The numbers of 2014 incidents of asset failure – no fire and asset failure and fire on assets - were high compared to historic values. This has been admonished by the ESV who have written ‘United Energy’s cross arm failures also represent 32 per cent of all the cross arm failures reported across all distribution businesses in 2014. This is not proportional to the assets owned by United Energy. It therefore is an area that needs to be redressed.’ Although these numbers were a reduction on 2013 levels, these were still too high for ESV and United Energy alike. As such, United Energy have spent significant repex dollars on replacing and repairing the cross arms across the network. While some of the effects of the program were evident in 2014, it is predicted that with this aggressive replacement program, the numbers of incident will further reduce; this reduction is presented in the forecast metrics per annum.
The pole top asset class contributes to the largest number of f-factor events for any asset class. Expenditure in this category will lead to fewer f-factor events in the 2016 - 2020 EDPR period.
The percentage of assets at high risk of failure in 2015 will be 18% and without replacements, the expected assets at high risk of failure in 2020 will be 27%. With the forecast replacement expenditure investment, this is due to decline to 10%. This suggests that at the end of the 2016 - 2020 EDPR period United Energy will sustain a significantly reduced number of pole top associated asset failures compared to 2013 and 2014 levels. Failures will be back to historic levels, and our obligations to maintain safety will be met.
The forecast for HV injections has stayed at a similar rate to the 2014 number of incidents. This number is similar to historic levels of incidents occurring. The HV injection metric is made from a number of contributing factors, most significantly, vegetation falling on conductors and causing the HV to inject into the LV conductor as well as pole failure and cross arm failure. The metric is not reducing as while cross arm failure will reduce, the incidents caused by vegetation is predicted to increase due to council inaction on vegetation clearance and management.
The story for pole top assets is an example for the safety story across the United Energy network. The pole top assets are aging significantly and with this ageing the failures are increasing and contributing to a deterioration of our safety across the network. However, with a prudent and efficient replacement strategy the

Network Safety Assessment
RRP 5-5 - Network Safety Assessment.docx Page 33 of 55
assets at high risk of failure will be systematically replaced, the incidents reduced and performance returned to target.
6.1.2. Effect of Various Programs
United Energy has a number of projects underway or about to commence which will affect the performance of the pole top asset class including:
A new camera initiative to inspect pole tops will allow better targeted replacements and together with forecast capex expenditure will address the network safety performance issues experienced with this asset class.
The output of the LiDAR survey of the network will provide accurate details of the pole top assets and clearances. This will allow identification of those assets and cross arms whose clearances are not within standards. LiDAR information will provide a snapshot of the foliage and vegetation around the cross arm which can be used to direct councils to specific foliage removal to reduce the effect of vegetation contacting assets.
Continuation of the existing Bird and Animal Proofing program to prevent animals climbing onto poles and cross-arms and potentially causing faults and damage to the asset and/or fire start surrounding vegetation.
A number of VBRC Safety Projects including HV ABC, LV ABC, Ampact removal, Dampers and REFCL’s will all improve the number of safety incidents attributed to the asset class.
The improved inspection techniques and the level of expenditure is forecast to ultimately result in an improvement in the performance of this asset class for the next period. This will have a significant impact in addressing the deterioration in asset failures and fire starts, and is forecast to assist in returning performance to target.
6.2 Poles
Please refer to the following documents for more information on this asset class.
References:
Pole Inspection and Replacement Regime Life Cycle Strategy: UE PL 2005
Category Expenditure Explanatory Statement Poles Structures: NET 447
Poles interfaces include:
Cross arms and other pole top structures.
Associated pole mounted equipment includes:
o Overhead line capacitors;
o Pole type transformers;
o Automatic circuit reclosers; and
o HV surge arrestors.
6.2.1. Background
The Pole asset class applies to subtransmission, HV and LV poles. Poles provide safe clearance and isolation of the electric line from the ground, between phases and other adjacent structures.
Physical failure of a pole occurs when a pole has insufficient strength to support the loads applied to it. Failure occurs in wood, steel, concrete and staked wood poles across the United Energy network. Poles are affected by the local environment including flora, fauna, weather conditions and soil.
Network Safety Assessment
RRP 5-5 - Network Safety Assessment.docx Page 34 of 55
As discussed in the Poles Life Cycle Strategy (UE PL 2005), the main deterioration drivers for wooden poles are:
Timber rot generally occurring at the base of the structure due to soil moisture and acidity;
Various fungi growing on the wooden poles which break down the cell walls of wood;
Termite and other boring insect attack where the strength of the pole is degraded by hollowing;
and
Pole top fires.
Steel and steel reinforced concrete type poles deteriorate mainly due to steel corrosion.
Public lighting poles are also considered part of this asset group. These poles are generally steel and fail due to the same causes as the network steel poles - mainly corrosion.
Pole failures pose a number of safety risks including:
Bushfires, where live lines come into contact with vegetation and the ground.
HV injections, where failures can cause HV and LV conductors to come into contact.
Contact events, where pole failure can leave live wires hanging at a level where the public could
come into contact with the conductors.
Damage caused by the poles themselves as the fall, where they might potentially strike people or
public assets.
Pole fires also pose a number of safety risks including igniting vegetation fires through:
Hot embers or burning asset falling to the ground and igniting dry grass and vegetation; or
Flames at height from the burning asset contacting and igniting nearby trees and vegetation; or
Fire spreading to ground level down the pole and igniting vegetation underneath.
This discussion does not include failure due to a third party, i.e. vehicle collisions, rather focuses on failure causes that can be controlled by the asset management such as due to age and condition.
The following safety metrics are relevant for poles:
1 Asset failure – no fire
2 Asset failure – fire on asset
3 Asset failure – vegetation fire
4 Vegetation fire from contact
5 HV injection
6 Electric shock
The following table outlines the safety incidents for 2014 and those forecast for the 2016 – 2020 period. As well, the proportion of assets at high risk of failure and the capital expenditure is provided for both periods.
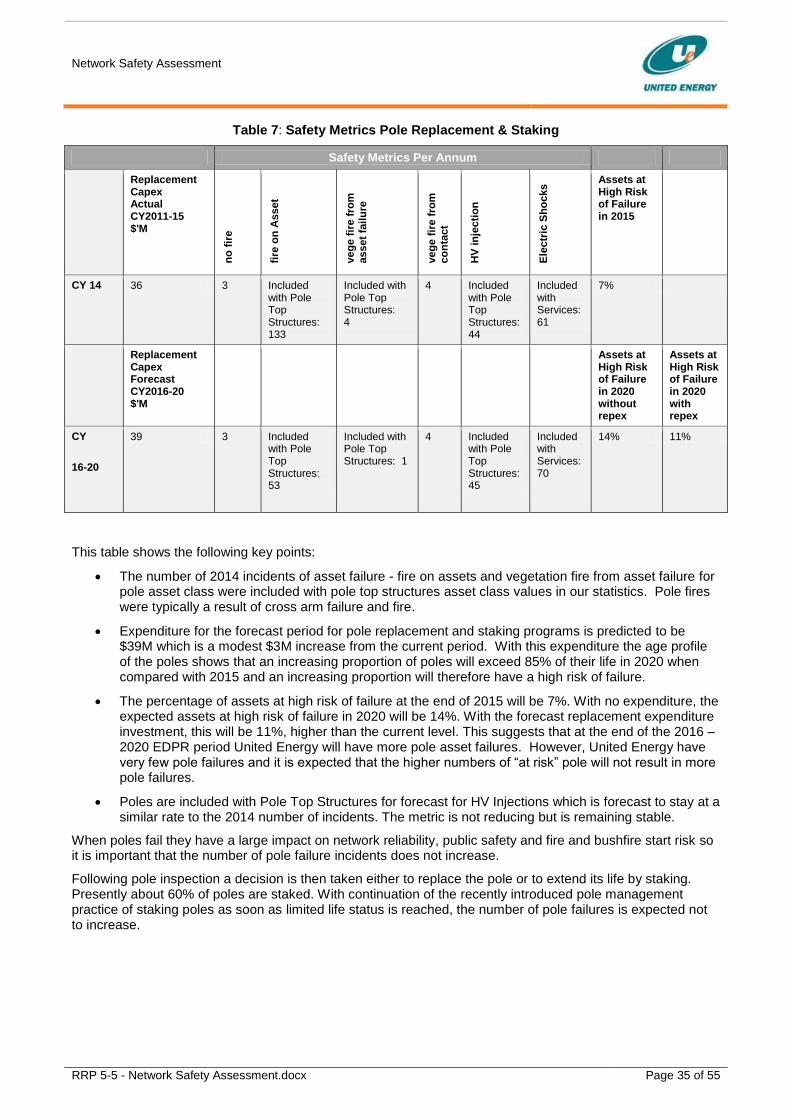
Network Safety Assessment
RRP 5-5 - Network Safety Assessment.docx Page 35 of 55
Table 7: Safety Metrics Pole Replacement & Staking
Safety Metrics Per Annum
Replacement Capex Actual CY2011-15 $'M
no
fir
e
fire
on
Asset
veg
e f
ire f
rom
asset
fail
ure
veg
e f
ire f
rom
co
nta
ct
HV
in
jecti
on
Ele
ctr
ic S
ho
cks Assets at
High Risk of Failure in 2015
CY 14 36 3 Included with Pole Top Structures: 133
Included with Pole Top Structures: 4
4 Included with Pole Top Structures: 44
Included with Services:61
7%
Replacement Capex Forecast CY2016-20 $'M
Assets at High Risk of Failure in 2020 without repex
Assets at High Risk of Failure in 2020 with repex
CY
16-20
39 3 Included with Pole Top Structures: 53
Included with Pole Top Structures: 1
4 Included with Pole Top Structures: 45
Included with Services: 70
14% 11%
This table shows the following key points:
The number of 2014 incidents of asset failure - fire on assets and vegetation fire from asset failure for pole asset class were included with pole top structures asset class values in our statistics. Pole fires were typically a result of cross arm failure and fire.
Expenditure for the forecast period for pole replacement and staking programs is predicted to be $39M which is a modest $3M increase from the current period. With this expenditure the age profile of the poles shows that an increasing proportion of poles will exceed 85% of their life in 2020 when compared with 2015 and an increasing proportion will therefore have a high risk of failure.
The percentage of assets at high risk of failure at the end of 2015 will be 7%. With no expenditure, the expected assets at high risk of failure in 2020 will be 14%. With the forecast replacement expenditure investment, this will be 11%, higher than the current level. This suggests that at the end of the 2016 – 2020 EDPR period United Energy will have more pole asset failures. However, United Energy have very few pole failures and it is expected that the higher numbers of “at risk” pole will not result in more pole failures.
Poles are included with Pole Top Structures for forecast for HV Injections which is forecast to stay at a similar rate to the 2014 number of incidents. The metric is not reducing but is remaining stable.
When poles fail they have a large impact on network reliability, public safety and fire and bushfire start risk so it is important that the number of pole failure incidents does not increase.
Following pole inspection a decision is then taken either to replace the pole or to extend its life by staking. Presently about 60% of poles are staked. With continuation of the recently introduced pole management practice of staking poles as soon as limited life status is reached, the number of pole failures is expected not to increase.

Network Safety Assessment
RRP 5-5 - Network Safety Assessment.docx Page 36 of 55
6.2.2. Effect of Various Programs
United Energy has a number of safety projects underway or forecast to commence that will assist to maintain the safety impact of this asset class as the proportion of assets at higher risk of failure increases. Those programs which will prevent pole top fires such as the new camera initiative to inspect pole tops and REFCL implementation will also prevent fires on poles. The output of the LiDAR surveys of the network will allow for detection of leaning poles and incorrectly installed stay wires. This will allow for targeted staking of poles. Overall these programs will complement UE’s current pole inspection program and assist to manage this class asset.
6.3 Overhead Conductors and Connectors
Please refer to the following documents for more information on this asset class.
References:
Connectors and Conductors Life Cycle Strategy: UE PL 2007
Category Expenditure Explanatory Statement Connectors and Conductors: NET 449
Single Wire earth Return (SWER): UE PL 2052
High Voltage Aerial Bundled Cable Replacement: UE PJ-0131-0
Conductors and connectors have interfaces to all other assets that connect to overhead lines. These include:
Pole Top Structures
Overhead Line switchgear
Pole type transformers
Pole mounted Capacitors
Overhead line fuses
Surge arresters
Cable terminations at Cable Head poles
6.3.1. Background
This asset class includes overhead conductors, including covered conductors, for low voltage, high voltage distribution and subtransmission networks as well as the connectors, spreaders and dampers for each asset.
There are several failure modes for conductors and connectors:
Conductor breakage due to work hardening embrittlement caused by wind induced vibration;
Conductor breakage due to corrosion of conductor strands with resultant reduction of physical strength;
Conductor breakage at connector or other connection points due to corrosion at the connector joint and mechanical wear by rubbing (friction);
Conductor melting and breakage due to high resistance connector joint;
Conductor annealing due to high temperatures caused by overloading.
HV ABC insulation discharge between phase conductors to earthed catenary leading to breakdown and cable and catenary breakage.
Ampact connecter failing due to incorrect installation.

Network Safety Assessment
RRP 5-5 - Network Safety Assessment.docx Page 37 of 55
The following safety metrics are relevant for overhead conductors and connectors:
1 Asset failure – no fire
2 Asset failure - fire on asset
3 Asset failure – vegetation fire
4 Vegetation fire from contact
5 HV injection
The following table outlines the safety incidents for 2014 and those forecast for the 2016 – 2020 period. As well, the proportion of assets at high risk of failure and the capital expenditure is provided for both periods.
Table 8: Safety Metrics Conductors
Safety Metrics Per Annum
Replacement Capex Actual CY2011-15 $'M
no
fir
e
fire
on
Asset
veg
e f
ire f
rom
asset
fail
ure
veg
e f
ire f
rom
co
nta
ct
HV
in
jecti
on
Ele
ctr
ic s
ho
cks Assets at High
Risk of Failure in 2015
CY 14 0.3 43 Included with Pole Top Structures:133
Included with Pole Top Structures:4
9 Included with Pole Top Structures: 44
0 32%
Replacement Capex Forecast CY2016-20 $'M
Assets at High Risk of Failure in 2020 without repex
Assets at High Risk of Failure in 2020 with repex
CY
16-20
1.3 63 Included with Pole Top Structures:53
Included with Pole Top Structures: 1
9 Included with Pole Top Structures: 45
0 48% 46%
The following key points can be extrapolated from the table above:
The number of vegetation fires from contact with conductors will be mainly affected by our vegetation clearance projects. It is not forecast to be reduced and it is not influenced by the age or condition of the assets. Rather, United Energy will continue with its current vegetation clearance regime including reporting of overhanging vegetation to the relevant local Councils.
The percentage of assets at high risk of failure in 2015 is at 32%, in 2020 without capital investment this is expected to rise to 48% and with capital expenditure to 46%. This is an estimate 14% increase in assets at a condition deemed to be near their end of life.
Forecast replacement expenditure for the 2016 – 2020 EDPR period is approximately $1.3m. As discussed in the Asset High Risk of Failure Assessment Document (UE PL 2044) ‘Despite the relatively low unit cost of the conductors, the large volume of these assets makes these a high cost item for replacement and to maintain the proportion of assets at High Risk of Failure by 2020 to the 2015 level, would cost in the order of $260m.’ The United Energy strategy, as outlined in the life cycle strategy is to inspect and maintain these assets as obligated under the HBRA and LBRA conditions, fix where required, otherwise run to failure. As such, with the age of these assets increasing significantly the “asset failure - no fire” metric is forecast to rise on average by approximately 20 incidents per annum.

Network Safety Assessment
RRP 5-5 - Network Safety Assessment.docx Page 38 of 55
United Energy believe that the expenditure to maintain the proportion of assets at high risk of failure at 2015 levels is not prudent nor efficient, rather, United Energy have chosen to make trade-offs to maintain safety. These are:
Focus expenditure on the cross arm asset class. This large replacement capex will benefit conductors and connectors with a decrease of pole top asset failures decreasing the possibility of connector and conductor failure and reducing fires starts and HV injections.
Provide a focus on replacing connectors as their failure is more common than conductor failure
Provide dampers and armour rods in bushfire areas.
A targeted replacement of HV conductors which are failing before end of life and causing fire starts.
It is considered that this expenditure will bring more benefits to overall network safety and reliability and a trade-off that is both prudent and efficient and represents a holistic approach to asset management.
6.3.2. Effect of Various Programs
As discussed, no change in the current conductor management practice is proposed where conductors are usually run to failure. With a few exceptions, the conductor is in good condition. Failures occur in localities where damage or corrosion has occurred and a replacement of a small section of cable is carried out to make repair. Wholesale replacement is not usually warranted. An exception is HV ABC and its replacement should reverse the deteriorating trends for that asset type in the recent years, and particularly in 2015.
Expenditure on VBRC programs including HV and LV ABC, clashing / spreaders, REFCLs among others are all expected to reduce the number of conductor failures in HBRA.
The LiDAR program, as in pole top structures, is expected to provide our asset managers with a detailed view of their assets and the foliage around them. Use of this data source will allow for potential areas of failure to be addressed before failure.
6.4 Underground Cable
Please refer to the following documents for more information on this asset class.
References:
Underground Cable Systems Life Cycle Strategy: UE PL 2017
Category Expenditure Explanatory Statement Underground Cable Systems: NET 450
As the majority of this asset class is underground and a minimal risk to safety, no ESV reported safety metrics are connected to this asset class.
United Energy has a program to replace its “Doncaster Pillars”. The pillars are in public areas and are a known source of shocks and we have a program underway to replace them. The project’s implementation is monitored by ESV and it will be completed in the forecast period.
Whilst there will be a greater proportion of underground cable assets at high risk of failure, and an expected increase in the number of failures, these failures will not materially change the safety risk of the business.

Network Safety Assessment
RRP 5-5 - Network Safety Assessment.docx Page 39 of 55
6.5 Distribution Switchgear
Please refer to the following documents for more information on this asset class, including information on how safety is managed.
References:
Overhead line Switchgear Life Cycle Strategy: UE PL 2008
Non Pole Substation Life Cycle Strategy: UE PL 2015
HV Out door Fuses Life Cycle Strategy UE PL 2012
Overhead Line Capacitor Life Cycle Strategy UE PL 2009
ACR Life Cycle Strategy UE PL 2010
Category Expenditure Explanatory Statement Distribution Switchgear: NET 453
Distribution switchgear asset category includes quite a variety of equipment such as:-
HV and LV Fuses
Ring Main Units
HV and LV Air-break Switches
HV isolators
Automatic Circuit Re-Closers (ACR)
HV Gas (SF6) Insulated Switches (MGS and RCGS)
Line capacitors, controllers and vacuum switches.
6.5.1. Background
Replacement expenditure is forecast to increase for distribution switchgear in line with an increased number of assets reaching the end of their life. At the same time an increasing number of these assets will be aged in excess of 85% of their life span by 2020 even with the increased expenditure and the number of assets at risk of failure to increase from 16% to 23% from 2016 to 2020. The forecast failure numbers is also expected to continue to increase in line with the aging asset age.
Failure of these assets has caused some fire starts in the current period, but no incidents involving the public. Because of the large number of assets in this asset class and the relatively small impact they will have on safety, little change is proposed to asset management and replacement practice for switchgear.
The replacement strategies vary across these asset types. Some are being replaced because of safety issues; most are being run to failure. An exception to this is the program to replace Krone type Fuse boxes which have been identified as causes a number of fires. Please refer to the relevant life cycle management strategy for further information.
The following table outlines the safety incidents for 2014 and those forecast for the 2016 – 2020 period. As well, the proportion of assets at high risk of failure and the capital expenditure is provided for both periods.

Network Safety Assessment
RRP 5-5 - Network Safety Assessment.docx Page 40 of 55
Table 9: Safety Metrics Distribution Switchgear
Safety Metrics Per Annum
Replacement Capex Actual CY2011-15 $'M
Asset
Fa
ilu
re
(no
fir
e)
fire
on
Asset
veg
e f
ire f
rom
asset
fail
ure
veg
e f
ire f
rom
co
nta
ct
HV
in
jecti
on
E
lectr
ic s
ho
cks Assets at High
Risk of Failure in 2015
CY 14 35 11 33 18 0 0 0 16%
Replacement Capex Forecast CY2016-20 $'M
Assets at High Risk of Failure in 2020 without rep. capex
Assets at High Risk of Failure in 2020 with replacement capex
CY
16-20
48 16 38 26 0 0 0 28% 23%
The following key points can be extrapolated from the table above:
Asset failures (which do not cause a fire) of distribution switchgear as reported to ESV include for dislodged assets and HV fuse failures. The dislodged assets are all LV assets so most of the asset categories, including all HV assets are performing satisfactorily from a safety point of view. United Energy has performed a large number of LV cross arm replacements in the current regulatory period and as part of that replacement, the LV switchgear on the cross arm has been replaced. A stated aim of the HV fuse LCS is to limit the number of HV fuse failures to 6 or less per annum and this number has been exceeded in both 2013 and 2014 so this performance indicator is not being met. United Energy has implemented a program to replace its brown porcelain fuse holders which are a known a type of fuse holder with known higher risk of asset failure.
Fire starts for distribution switchgear are showing and increasing trend, due almost entirely to the failure of LV equipment and fuses. As already discussed, United Energy’s LV switchgear asset management strategy is to allow the switches to run to failure but the assets must also be managed so that they do not cause fire starts. The asset class includes fuse box replacements and there is an emerging problem with Krone fuse boxes failing and causing fire starts both in the equipment and to nearby vegetation. They are being targeted for replacement at a rate of 700 per year and the program will continue in the forecast period. However, the forecast failure number is expected to increase, but the total number of fire starts for the business will be off-set by a falling number forecast for pole top failures.
United Energy’s report to the ESV on HV injections and electric shocks which are amongst other indicators for incidents involving the public. Distribution switchgear assets have not caused any of these reportable incidents in the current period.
6.5.2. Effect of Various Programs
The new initiative to use cameras to inspect pole tops will better identify damaged or deteriorated equipment on pole top structures including switchgear and potentially identifying them before they fail and cause a safety issue.

Network Safety Assessment
RRP 5-5 - Network Safety Assessment.docx Page 41 of 55
6.6 Distribution Transformers
Please refer to the following documents for more information on this asset class.
References:
Pole Top Transformer Life Cycle Strategy: UE PL 2014
Non Pole Substation Life Cycle Strategy: UE PL 2015
Category Expenditure Explanatory Statement Distribution Pole Top Transformers
Category Expenditure Explanatory Statement Distribution Non-Pole Distribution Substations
Distribution transformers interfaces include:
Overhead conductors,
HV & LV fuses,
poles & pole top structures,
surge arrestors, and
earthing assets.
6.6.1. Background
This asset class includes pole mounted single phase and multiphase transformers, pad mounted transformers and kiosk transformers. They are installed on UE’s overhead and underground HV networks and transform the voltages from high to low voltage.
Distribution transformers are assets that are usually replaced reactively on failure. There is a modest increase in replacement expenditure forecast for this asset class in line with an increased number of assets reaching the end of their life. At the same time there will be slight increase in the number of assets which will be aged in excess of 85% of their life span by 2020 even with the increased expenditure and the number of assets at risk of failure to increase from 6% to 8% from 2016 to 2020.
Failure of these assets caused some fire starts in the current period, but no incidents involving the public. Because of the large number of assets in this asset class and the relatively small impact they will have on safety, little change is proposed to their asset management and replacement practices.
The safety metrics that are relevant for distribution transformers are:
1. Asset failure – fire on asset
2. Asset failure – vegetation fire
The following table outlines the safety incidents for 2014 and those forecast for the 2016 – 2020 period. As well, the proportion of assets at high risk of failure and the capital expenditure is provided for both periods.
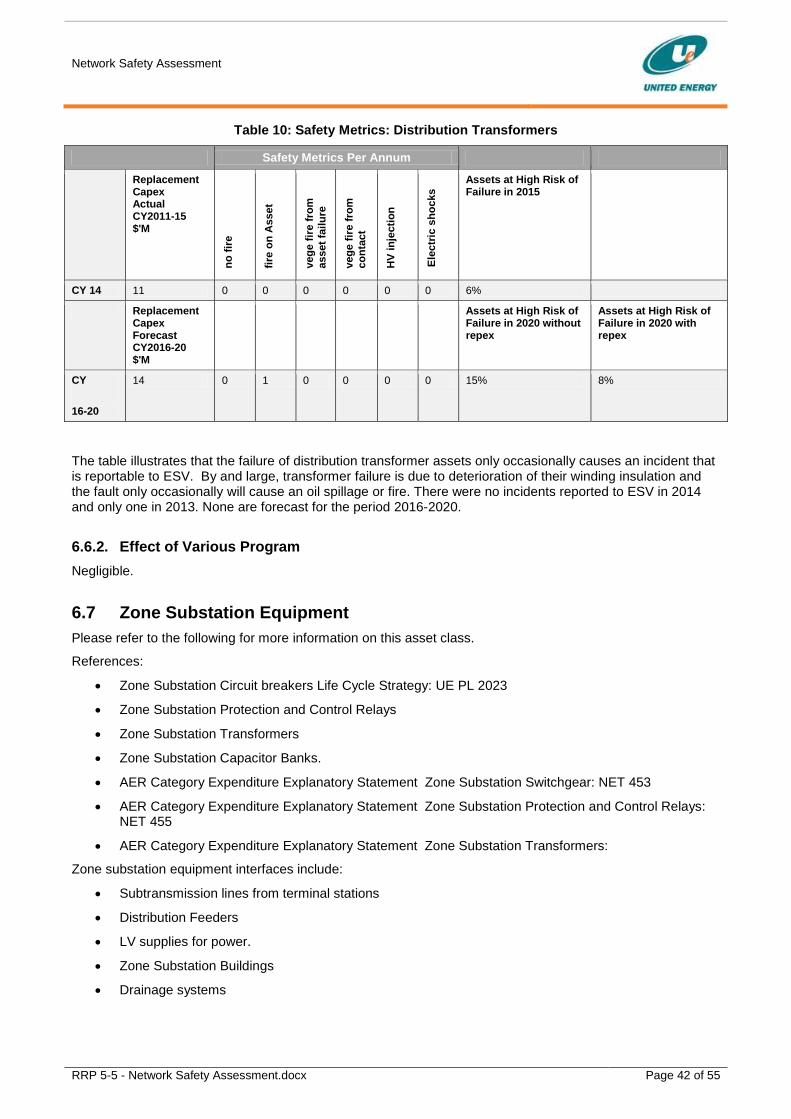
Network Safety Assessment
RRP 5-5 - Network Safety Assessment.docx Page 42 of 55
Table 10: Safety Metrics: Distribution Transformers
Safety Metrics Per Annum
Replacement Capex Actual CY2011-15 $'M
no
fir
e
fire
on
Asset
veg
e f
ire f
rom
asset
fail
ure
veg
e f
ire f
rom
co
nta
ct
HV
in
jecti
on
E
lectr
ic s
ho
cks
Assets at High Risk of Failure in 2015
CY 14 11 0 0 0 0 0 0 6%
Replacement Capex Forecast CY2016-20 $'M
Assets at High Risk of Failure in 2020 without repex
Assets at High Risk of Failure in 2020 with repex
CY
16-20
14 0 1 0 0 0 0 15% 8%
The table illustrates that the failure of distribution transformer assets only occasionally causes an incident that is reportable to ESV. By and large, transformer failure is due to deterioration of their winding insulation and the fault only occasionally will cause an oil spillage or fire. There were no incidents reported to ESV in 2014 and only one in 2013. None are forecast for the period 2016-2020.
6.6.2. Effect of Various Program
Negligible.
6.7 Zone Substation Equipment
Please refer to the following for more information on this asset class.
References:
Zone Substation Circuit breakers Life Cycle Strategy: UE PL 2023
Zone Substation Protection and Control Relays
Zone Substation Transformers
Zone Substation Capacitor Banks.
AER Category Expenditure Explanatory Statement Zone Substation Switchgear: NET 453
AER Category Expenditure Explanatory Statement Zone Substation Protection and Control Relays: NET 455
AER Category Expenditure Explanatory Statement Zone Substation Transformers:
Zone substation equipment interfaces include:
Subtransmission lines from terminal stations
Distribution Feeders
LV supplies for power.
Zone Substation Buildings
Drainage systems

Network Safety Assessment
RRP 5-5 - Network Safety Assessment.docx Page 43 of 55
6.7.1. Background:
Zone substation equipment includes power transformers, switchgear, instrument transformers, switches and protection and control equipment. Zone substations are a key element of the distribution system as they transform voltages from subtransmission (66kV) to HV (22kV, 11kV or 6.6kV). Outages in a zone substation can often affect one or more feeders and many customers. Any major failure can cause a loss of supply to a large number of customers. Failure of zone substation equipment often will be accompanied by explosion and fire and present a significant danger to any workers at the substation, and in some circumstances to the public.
Zone substation transformers are critical elements in the distribution network because of their high replacement cost, their strategic impact on customer supply and their long lead time for repair or replacement. An urban zone substation typically has 2 or 3 off 20 MVA transformers with some transfer capacity between adjacent stations. Typically a 3 transformer zone substation supplies between eight to twelve feeders and up to 30,000 residential customers.
Circuit breakers at zone substations perform a critical function across the United Energy network. Their purpose is to isolate short-circuit current flowing to network faults and to perform network switching functions. Their reliable operation is essential to protect people and plant both within the substation and in the broader distribution area.
Because the effects of failures of transformers or circuit breakers can be very severe, zone substation equipment is monitored very closely with the aim of replacing it before failure occurs. As a result, failure statistics are an inadequate to manage the safety risk. An effective leading indicator is needed that considers the condition of the equipment, and the frequency and effectiveness of the maintenance and inspection regimes. The measure developed is the number of assets moving into the “wear out” phase where the likelihood of failure rapidly increases.
Table 11 outlines the leading indicator for a major zone substation event, for both transformers and switchgear. It also includes the assets at high risk of failure, both in 2015 and in 2020.
For transformers, the number assets include the zone substation transformers, their tap changers and their bushing. The failure of any one of these items can cause a catastrophic failure with explosion and fire.
For switchgear the number of assets includes circuit breakers and isolators as a failure of an isolator may have fatal consequences to an operator.
Table 11: Safety Metric Zone Substation Transformers and Switchgear.
Assets at High Risk of Failure in 2015
2015 Substation
Major Event
Leading Indicator
Assets at High Risk of Failure in 2020 without repex
Repex Forecast ($'M Real
15) 16-20
Assets at High Risk of Failure
in 2020 with
repex
2020 Substation
Major Event
Leading Indicator
% change
Transformers 34% 300 52% 55 37% 309 3%
Switchgear 51% 342 64% 32 47% 396 16%
Network Safety Assessment
RRP 5-5 - Network Safety Assessment.docx Page 44 of 55
The following key points can be extrapolated from the table above:
Transformer assets are expected to move from 34% of assets at high risk of failure to 52% by 2020. However, with the proposed $55m of replacement expenditure only 37% will be at high risk of failure by 2020.
With the proposed level of expenditure the number of zone substation transformer assets in the wear out phase remains about constant, indicating that the risk is not increasing and that the proposed expenditure is appropriate.
With $32m of capital expenditure the proportion of switchgear assets at high risk of failure will reduce from the expected 51% in 2015 to 47% by 2020. In contrast, our leading indicator will increase from 342 assets to 396 assets over the same period. This indicates a slightly elevated risk.
Overall, the level of expenditure proposed will result in a small elevation of the risk of a catastrophic failure in 2020 when compared to 2015.
6.7.2. Effect of Various Program
United Energy has projects proposed in the OT budget that will provide better monitoring of both transformers and switchgear which will improve the risk management of the assets by providing better measurement of the condition of the plant including:-
Installation of Dynamic Monitoring and Control Communications Equipment on zone substation transformers. This project will allow us to run transformers to their limit without risking their overload and failure
Pilot on-line Dissolved Gas Analysis of Transformer Oil. Dissolved gas analysis of transformer insulation oil is a fundamental technique for determining the condition and likelihood of failure of a transformer. This program will provide immediate data on the condition of a transformer.
Pilot Partial Discharge (PD)/Corona/infrared (IR) and Ultraviolet Monitoring. Partial discharge (PD), corona, infrared (IR) and ultraviolet monitoring are all methods of detecting insulation breakdown in failure of HV insulation for switchgear. This project is to provide continuous monitoring technology which will provide trending data and allow better decisions concerning the asset management of the insulation.
The use of the OT projects will allow United Energy to manage the safety risks associated with zone substation equipment failure.
6.8 Services
Please refer to the following documents for more information on this asset class.
References:
LV Services and Terminations Life Cycle Strategy: UE PL 2018
AER Category Expenditure Explanatory Statement Services and Terminations: NET451
Low Voltage (LV) services interfaces include:
Consumer’s Point of Supply/Consumer’s Terminals and United Energy’s LV distribution network. The connection to the LV network can be via fuses or switches to the LV network, or fuses or switches directly to an individual distribution transformer (typically in rural areas).
Breakaway devices may also be used to ensure that under the application of an external force to the service (tree, vehicle) the service is severed at the end connecting to the network rather than at the customer end. This is a safety measure to ensure that any services on the ground are not active. Breakaways are only installed on new services and are not retrofitted.
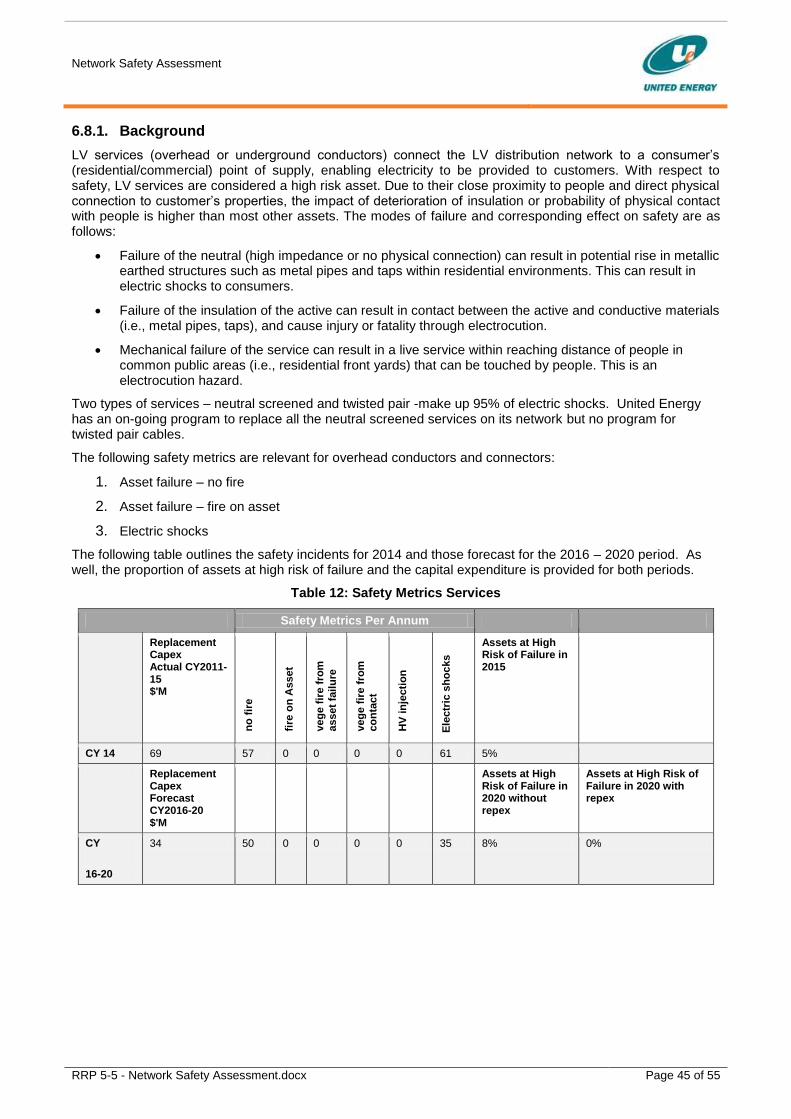
Network Safety Assessment
RRP 5-5 - Network Safety Assessment.docx Page 45 of 55
6.8.1. Background
LV services (overhead or underground conductors) connect the LV distribution network to a consumer’s (residential/commercial) point of supply, enabling electricity to be provided to customers. With respect to safety, LV services are considered a high risk asset. Due to their close proximity to people and direct physical connection to customer’s properties, the impact of deterioration of insulation or probability of physical contact with people is higher than most other assets. The modes of failure and corresponding effect on safety are as follows:
Failure of the neutral (high impedance or no physical connection) can result in potential rise in metallic earthed structures such as metal pipes and taps within residential environments. This can result in electric shocks to consumers.
Failure of the insulation of the active can result in contact between the active and conductive materials (i.e., metal pipes, taps), and cause injury or fatality through electrocution.
Mechanical failure of the service can result in a live service within reaching distance of people in common public areas (i.e., residential front yards) that can be touched by people. This is an electrocution hazard.
Two types of services – neutral screened and twisted pair -make up 95% of electric shocks. United Energy has an on-going program to replace all the neutral screened services on its network but no program for twisted pair cables.
The following safety metrics are relevant for overhead conductors and connectors:
1. Asset failure – no fire
2. Asset failure – fire on asset
3. Electric shocks
The following table outlines the safety incidents for 2014 and those forecast for the 2016 – 2020 period. As well, the proportion of assets at high risk of failure and the capital expenditure is provided for both periods.
Table 12: Safety Metrics Services
Safety Metrics Per Annum
Replacement Capex Actual CY2011-15 $'M
no
fir
e
fire
on
Asset
veg
e f
ire f
rom
asset
fail
ure
veg
e f
ire f
rom
co
nta
ct
HV
in
jecti
on
E
lectr
ic s
ho
cks
Assets at High Risk of Failure in 2015
CY 14 69 57 0 0 0 0 61 5%
Replacement Capex Forecast CY2016-20 $'M
Assets at High Risk of Failure in 2020 without repex
Assets at High Risk of Failure in 2020 with repex
CY
16-20
34 50 0 0 0 0 35 8% 0%
Network Safety Assessment
RRP 5-5 - Network Safety Assessment.docx Page 46 of 55
The following key points can be extrapolated from the table above:
United Energy’s practice has been to pro-actively replace neutral screened services because of their history of causing electric shocks and to replace other types reactively, when they fail. Service cables make up a substantial percentage of total equipment failures which is not surprising given that they are an asset often subject to being contacted from the ground and being dragged down. Services are also subject to damage by storms or contact with vehicles or trees and by bird and animal attack. United Energy is also replacing pole side terminations that will release the conductors at the pole when they are contacted, thereby failing in a safe manner.
When services fail, sparking can sometimes occur and they can cause fire starts. However the number of fire starts is not significant when compared to cross arm and switch gear failure. Nevertheless new services are designed to fail at the pole termination there-by reducing the likelihood of a fire start.
Of most concern with services is the possibility of electric shocks. This is being presently addressed by our neutral screen conductor replacement program. In the forecast period, OT projects have been proposed to continuously monitor services and alert the control room as soon as the service has failed. This is expected to halve the number of electric shocks experience by the general public in the forecast period as shown in the table.
6.8.2. Effect of Various Programs
United Energy has three OT project that will materially affect the safety performance of our services:-
Service mains deterioration
In-meter capabilities
Intelligent Network Device
Taken together these three projects will enable the monitoring of service cables, including their neutrals so that if a fault occurs it will be detected immediately. The benefit is that the fault can then be rectified promptly before it causes an incident like an electric shock. This is a great improvement on the present practice of manually testing services every 10 years, and on the bulk replacement of services by deteriorating cable type instead of just those that have failed.
6.9 Protection and Control
Please refer to the following documents for more information on this asset class.
References:
Protection Control Systems Life Cycle Strategy: UE PL 2027
Category Expenditure Explanatory Statement Protection and Control: NET 455
Protection and control assets are critical for network safety, as they detect and isolate faults that pose a hazard to the public and our workforce. Their correct and reliable operation is needed to maintain network safety.
However, as most protection and control assets are in zone substations and not in public areas there is no ESV metric related to asset failure of protection and control assets and likewise, United Energy see the failure of these assets as generally posing minimal safety risk.
Further information and expenditure justification for this asset class is included in the documents listed above.
Network Safety Assessment
RRP 5-5 - Network Safety Assessment.docx Page 47 of 55
7. “Other Repex” Projects
United Energy forecast $155M of Repex for ‘Other’ assets for the 2016 – 2020 regulatory control period. The
proposed expenditure includes:
Substation Primary Asset Replacement (capacitor banks, NER’s, earth grids, buildings)
Non VBRC safety project - CCTV
Operational Technology (OT) projects – Safety, Reliability, Other
Reliability Performance Projects
Environmental Projects
Power Quality Projects
Terminal Station Rebuild Projects
In this section, we will discuss the following three subcategories which apply to network safety performance:
Non VBRC Safety Projects
Operational Technology (OT) safety projects
Reliability Performance Projects (2 of these programs also provide safety benefits)
7.1 Non VBRC Safety Projects
There is one non-VRBC safety project proposed for the forecast period – CCTV.
7.1.1. Intelligent Secure Substation Asset Management - CCTV
Reference:
Intelligent Secure Substation Asset Management (ISSAM) – Strategic Direction Analysis Plan - UE PL 2401 (Confidential Document).
This project is to install Closed Circuit TV (CCTV) at locations with a high risk of security breach such as zone substations and non-pole substations buildings and grounds.
Together with the OT Security Project, this project maintains safety by addressing the increased security and access breach risk, by:
Deterring security and access breaches within United Energy’s network
Deterrent to prevent vandalism and theft;
Advanced warnings of suspicious activity; and
Remote monitoring of assets and potential incidents.
At a cost of $6M, the CCTV will be installed at 20 sites and is expected to achieve a reduction of 4 access breach incidents each year in the 2016 – 2020 period.
Network Safety Assessment
RRP 5-5 - Network Safety Assessment.docx Page 48 of 55
7.2 Operational Technology Safety Projects
Each of the United Energy Operational Technology projects which contribute towards managing network safety is described in this section of the document.
The projects are:
Service Mains Deterioration
In Meter Capabilities
LiDAR
OT Security
Intelligent Network Device
7.2.1. Service Mains Deterioration Field Works
Reference:
Service Mains Deterioration Field Works – Project Justification – PJ1385
The Service Mains Deterioration Field Works Project (Project No. PJ1385) performs the field works component for automated Neutral Integrity Testing. It delivers benefits in conjunction with the In Meter Capability Project (described below) and the Network Analytics (IT) Project.
The purpose of these projects is to reduce the risk to the public receiving an electric shock, by monitoring the integrity of the service mains neutral circuit. If the service mains neutral deteriorate or is inadvertently disconnected, the electricity system will not be properly earthed and public and employees will be at risk of shocks. The technology will allow for automated detection and notification when there are faults on neutral circuit and a hazard is initiated, allowing for timely isolation and rectification before an electric shock occurs.
Without implementation of the project United Energy will react, as they do now, to fix problems after they occur. Manual neutral integrity testing would be required for UE’s 650,000 service connections on a ten year cycle, leaving customers premises in potentially dangerous states for extended periods until a shock is experienced and reported, or until a hazardous situation is detected during manual testing.
Automated neutral integrity testing will deliver a 50% reduction in the number of electric shock incidents each year (35 shocks per annum), consistent with benefit delivered by another Victorian DNSP. Noting the current and next period repex for services replacement of $69M and $34M respectively, the initiative has been assessed as ALARP, since it delivers a 50% reduction in the primary safety metric for this asset class at a fraction of the cost of service replacement ($4.2M capex). The initiative allows defective services to be identified and replaced, thus providing better targeting of services replacement to achieve a halving of safety metrics for the same replacement capex.
7.2.2. In Meter Capabilities
Reference:
In Meter Capabilities– Project Justification – PJ1386
The implementation of “In Meter Capabilities (IMC)” is the process of upgrading the software in our smart (AMI) meters to make full use of their capability to monitor and control the network. The meters will then detect abnormal system condition and the resulting events, alarms and control actions will be stored locally and reported to the master IT Analytics Intelligent Hub (ITAIH) platform. The information will help shape improvements in network and public safety, supply resilience and compliance, and enable customers to better manage their energy consumption.
The IMC applications provide a number of benefits for safety, power quality and customer service.
The core justification of the project is its role in Automated Neutral Integrity testing, as noted above in the Service Mains Deterioration Field Works project. As for that project, the In Meter Capabilities project is also assessed as ALARP, since for a capital cost of $2.4M, it assists to deliver a 50% risk reduction in electric shocks at a fraction of the costs of the service replacements.
Network Safety Assessment
RRP 5-5 - Network Safety Assessment.docx Page 49 of 55
7.2.3. LiDAR
Reference:
Light Detection and Ranging – Project Justification – PJ1400
LiDAR is a technology, which consists of asset inspection mapping system incorporating 3D panoramic imagery and light detection and ranging (LiDAR) sensors. Sensors are mounted on vehicles and perform detailed surveys of the electricity network. It will detect:-
Conductor phase clearances;
Leaning poles;
Vegetation encroachment to poles and wires including that from council lands; and
Conductor and air temperature.
LiDAR mapping of the distribution network has the potential to identify conductor spacing and vegetation clearance anomalies. The survey can focus on clearances between:
Conductor-to-conductor;
Conductor-to-ground;
Conductor-to-structure; and
Conductor-to-vegetation.
The survey will also identify issues with the network including slack spans and loosened hardware.
United Energy currently does not have an accurate survey of its entire HV network and the benefits of this program (Project No. PJ1400) are that faster and more accurate identification of conductor clearance issues allows for faster response to address problem locations. In particular, LiDAR will detect clearance issues that, if not addressed, could result in fire starts.
The survey will focus on high fire risk and high voltage lines as first priority. This will allow United Energy to quickly identify power line clearance concerns which pose a bushfire start risk. The LiDAR program supports the Electric Line Clearance Lifecycle Strategy UE PL 2002. It aligns with the recommendations of the Victorian Bushfire Royal Commission and will mitigate risk associated with safety and bushfires.
One benefit of the program is to improve network safety by augmenting the current processes relating to audits of the physical assets. Another is to mitigate bushfire risk by enabling the identification and early rectification if potential asset failures (e.g. clashing conductors) and vegetation encroachment – both of which have the potential to cause a fire start.
Based on the last few years of available data, we forecast a reduction of 3 asset failures resulting in fire on asset and 1vegetation fire from contact with assets in the 2016 – 2020 period. The project is consistent with United Energy’s application of the ALARP process in bushfire areas and is forecast to cost $6.8M.
Network Safety Assessment
RRP 5-5 - Network Safety Assessment.docx Page 50 of 55
7.2.4. OT Security
Reference:
OT Security – Project Justification PJ1500 (Confidential Document).
The Operational Technology (OT) Security Project (Project No. PJ1500) will address cyber security threats arising from an increase in criminal and terrorist activity towards IT systems and in particular for our operational systems that control our network and Advanced Metering Infrastructure (AMI) network.
Security systems and processes will be developed to ensure operational systems are protected in the event of a cyber-attack. Together with the CCTV project presented in section 7.1.1, this project maintains safety by addressing the increased security and access breach risk by:
Reducing the network and system vulnerability to physical and cyber-attacks;
Implementing secure access and data privacy; and
Implementing threat detection, logging and alerting for both physical and cyber threats.
The project initiatives include a range of physical and cyber security enhancements.
The need to maintain security and counteract the increase in cyber and physical threats on the network and systems gives reason for the requirement to upgrade the existing operational technology security infrastructure.
Based on our understanding of our assets, the last few years of available data, and the increased threat level, we forecast a reduction of 4 access breach incidents each year in the 2016 – 2020 period through capital expenditure of $6.1M for the OT Security project.
7.2.5. DNSP Intelligent Network Devices.
Reference:
DNSP Intelligent Network Device – Project Justification PJ5002
From December 2017 customers will be able to obtain an AMI meter from an alternate meter provider. As discussed in sections 7.2.1 and 7.2.2, UE will be establishing an automated neutral integrity testing system to monitor service cables and reduce the risk of electric shock. This project is to install mini network devices at customer premises where UE’s smart meter is removed following the introduction of metering competition. These devices will provide the same safety features that are provided by the UE meters and thus will maintain safety at the reduced levels delivered by the automated neutral integrity initiative.
The Intelligent Network Device has been assessed as the least cost option ($5.1M) to provide this service and thus maintain safety.

Network Safety Assessment
RRP 5-5 - Network Safety Assessment.docx Page 51 of 55
7.3 Reliability Performance Projects
The two reliability performance projects also provide network safety benefits through reducing fire starts. These are:
Bird and Animal Proofing; and
Clashing.
7.3.1. Bird and Animal Proofing
The Bird and Animal Proofing program prevents birds and animals from contacting high voltage assets on pole top structures. The primary purpose of the program is to maintain reliability.
The program involves implementing one or a number of solutions including;
Fitting devices to prevent birds and animals bridging out insulators;
Redesigning pole tops so all live hardware is covered; and
Installing devices to stop animals climbing onto poles and cross-arms and potentially causing damage to the asset.
Every flashover that occurs as a result of a bird or animal contacting our HV assets has the potential to produce sparking which may cause vegetation fires. By reducing the number of bird and animal faults, the number of fire starts will be reduced.
In addition to the reliability benefits of the program, we have forecast a reduction of 2 vegetation fire starts caused by bird or animal contact each year in the 2016 – 2020 period through implementation of this project.
7.3.2. Clashing
Clashing of electrical lines can also cause fire starts. Conductors can clash for a number of reasons such as slack spans, inadequate clearance, extreme winds, or the displacement of poles and cross-arms. When clashing occurs sparking may occur and hot material may fall to the ground, starting a fire beneath the conductors.
The clashing program funds the most appropriate solution to prevent re-occurrence of a clashing incident. This may be redesign of the circuit or the installation of spacers.
In addition to the reliability benefits of the program, we have forecast a reduction of 2 vegetation fire starts each year in the 2016 – 2020 period through implementation of the clashing project.

Network Safety Assessment
RRP 5-5 - Network Safety Assessment.docx Page 52 of 55
8. VBRC Safety Projects
8.1 Summary
United Energy propose $53.3M of bushfire mitigation capex expenditure in 2016-2020 to carry out the following Victorian Bushfire Royal Commission (VBRC) Safety Projects:
install or replace conductors;
install or replace Low Voltage Aerial Bundled Cabling (ABC);
install or replace High Voltage ABC;
replace connectors (Ampact);
install vibration dampers, armour rods and spacers; and
install REFCL (Rapid Earth Fault Current Limiting) technology devices;
8.2 Conductors
Conductors are a generic term that describes the wires and cables that carry electricity through a distribution network. The network is made up of 10,083 km of overhead conductor and is comprised of six main materials and construction types. These are aluminium or aluminium alloy stranded conductors, copper, steel reinforced aluminium (ACSR), steel, and HV and LV aerial bundled cable (ABC).
Expenditure forecasts for conductors is for those projects not included under LV or HV ABC projects, connector replacements or vibration dampers, armour rods and spacer projects. Hence the expenditure will be mostly on replacement of bare wire LV, HV and subtransmission conductors.
As discussed in the Connectors and Conductors Lifecycle Strategy UE PL 2007 the condition of bare wire conductors is:
LV conductors - currently there are no performance issues identified for this asset class and no major issues that need to be addressed.
HV conductors - Bare wire - performance of the bare HV conductors have been deteriorating during the past 10 years as conductors are only replaced at failure and there has been a limited programme to proactively replace sections identified to be at end of life.
Sub Transmission - conductors are performing well and there have been no systemic problems, clusters of failures or safety problems associated with the asset type. The age of the asset does not warrant any proactive replacement strategy.
Notwithstanding the generally good condition of conductors, repex for the 2011-2015 has been $4M and same expenditure is forecast for 2016-2020. United Energy has obligations under its ESMS program for steel conductor replacement and switch wire removal and these programs are also funded from this budget.
As the forecast level of expenditure is similar to the current period, it is not expected to change the safety performance of the asset.
Network Safety Assessment
RRP 5-5 - Network Safety Assessment.docx Page 53 of 55
8.3 LV ABC
Under United Energy's Electrical Safety Management Scheme (ESMS) the replacement of deteriorating LV ABC is being carried out to reduce the bushfire start risk associated with the deteriorating asset. The program replaced 15,381 m of cable in the current period and the forecast in the next period is a 14 per cent reduction in the volume to be treated to 13,191 m.6
AER confirmed acceptance in AER - Preliminary decision United Energy distribution determination - Attachment 6 - Capital expenditure - October 2015 report, of the forecasting methodology and the cost estimate of $1.2 million ($2015, including overheads & escalation) to continue this program reasonably reflects the capex criteria.
Based on our understanding of our assets and the last few years of available data, we forecast a reduction of 1 LV ABC asset failure without fire each year in the 2016 – 2020 period through implementation of the LV ABC replacement program.
8.4 HV ABC
Reference:
HV ABC – Strategic Direction Analysis Plan – UE PL 2053
UE has experienced an increase in HV Aerial Bundled Cable (HV ABC) faults over the past three years affecting all HV ABC in-service on the network (both the 185mm2 and 35mm2 materials). The results of a detailed investigation into the root cause of these asset failures determined that the non-metallic screened HV ABC was susceptible to degradation from electrical discharge between the cable and supporting aluminium catenary wire. The progressive degradation leads to insulation breakdown between the cable and catenary and this failure can result in a fire start.
In response to the increasing failures UE developed a plan to proactively replace this faulty asset over a 10 year period. In 2014/15, 4.48km of cable was replaced and a further 3.54km is underway and due to be completed by June 2016.
United Energy’s initial HV ABC replacement proposal was accepted under the VBRC assessment of our submission as discussed in the AER - Preliminary decision United Energy distribution determination - Attachment 6 - Capital expenditure - October 2015 report.
United Energy initially requested $19M from the AER to replace approximately 30km of conductor over the 2016-20 regulatory control period. This replacement was a continuation of a ten year strategy for removing unscreened HV ABC from the UE network that commenced in 2014.
In 2015 there has been a significant escalation in fault frequency and fire starts in HBRA, causing further deterioration in network safety risk. The increase fault frequency has also increased community concern regarding fire starts from these assets. In addition, CFA/DELWP fire ignition risk area mapping has become available. These are considered significant new developments which UE has taken into consideration to update and refine the plan to address this faulty asset. The updated plan takes into consideration all these factors in developing a more aggressive replacement program targeting total replacement within the 2016-20 regulatory period.
As a result United Energy is requesting an additional $11M in it resubmission for the 2016 – 2020 regulatory control period.
Based on our understanding of our assets and the last few years of available data, we forecast a reduction of 4 asset failures with no fires, 2 asset failures resulting in fire on asset and 2 vegetation fires from contact with asset, each year in the 2016 – 2020 period through implementation of the $30M HV ABC replacement program. It should be noted however that with the recent acceleration in failures and fire starts, the main benefit is in addressing the escalating fire risk.
6 United Energy, Regulatory Proposal 2016–20: Attachment NET 449 – AER Category Expenditure Explanation Statement: Asset Class – Connectors and Conductors, April 2015, Table 8, p. 23.
Network Safety Assessment
RRP 5-5 - Network Safety Assessment.docx Page 54 of 55
8.5 Connectors (Ampact)
United Energy’s current standard for non-tension connectors is the explosive fired wedge (Ampact) connector. During the late 1990s there was a bulk non-tension connector replacement program that addressed a failure mode of PG Clamp connectors and replaced them with Ampacts. Some PG Clamp type connectors remain on the network.
Failures of Ampact connectors have been occurring as a result of their incorrect installation. Specifically, when conductors of different thicknesses are joined (commonly copper and aluminium conductors) the Ampact must be connected in the correct orientation. The failures manifest in two ways:
Galvanic corrosion causes a high impedance connection and hot joint that eventually causes failure (primary cause of fault).
Incorrect installation results in poor connection strength which then fails due to mechanical stress under a fault current. This resulting in a sustained outage that otherwise would have been a momentary outage (secondary cause of fault).
In instances where Ampact has been installed correctly it has been performing well. There are currently there are no other systemic issues related to other connector types.
Replacement is required of incorrectly installed Ampact connectors as they are progressively identified on the network to prevent their failure and therefore mitigate the risk of fire starts. Ampact replacement numbers have been forecast based on historical replacement trends.
Based on our understanding of our assets and the last few years of available data, we forecast a reduction of 1 asset failures no fire start and 1 asset failure with vegetation fire start, each year in the 2016 – 2020 period through implementation of the $5M capex Ampact replacement program.
8.6 Armour Rods, Dampers and Spacers
Armour rods are a fitting used to protect the power conductor from damage caused by bending, compression, abrasion and fatigue due to wind-induced vibration and flashovers. They are helical rods wound over the conductor where it sits on an insulator.
Vibration dampers are an additional device used to reduce fatigue caused through wind-induced vibration. They are often helical rods wound over the conductor a short distance away from the crossarm.
As previously mentioned in this document, spacers are insulated rods that are tied between the conductors to stop them from clashing.
United Energy's bushfire mitigation expenditure program for armour rods, vibration dampers and spacers is in response to a mandatory program of work required under a compulsory Electrical Safety Management Scheme (ESMS) and is required to comply with applicable regulatory obligations and requirements. The fitting of armour rods and vibration dampers was directed by ESV as an outcome of the 2009 Victoria Bushfires Royal Commission.
The obligations for armour rods, vibration dampers and spacers are contained in the Fire Prevention Plan. United Energy has demonstrated it has an obligation to undertake this work in the next regulatory control period.
The AER have confirmed, in the AER - Preliminary decision United Energy distribution determination - Attachment 6 - Capital expenditure - October 2015 report, that as United Energy was directed to undertake this work they are satisfied this is a discrete program of work that does not fall within United Energy's business as usual level of capex to manage asset fire safety.
The AER have confirmed acceptance of United Energy's forecast of $4.779 million for armour rods and vibration dampers; and $0.475 million ($2015, including overheads & escalation) for spacers. The AER agreed the cost estimates reasonably reflect the capex criteria.

Network Safety Assessment
RRP 5-5 - Network Safety Assessment.docx Page 55 of 55
8.7 REFCL’s
Reference:
DMA and MTN ZSS REFCL Installation – Justification Statement
Bushfire Mitigation ALARP Risk Assessment – UE PR 2511
Overhead line faults cause fires on days of extreme temperature, high winds, and low humidity and in areas of dry vegetation, particularly in HRBA regions.
Rapid Earth Fault Current Limiting (REFCL) is a relatively new technology which can limits the energy that flows into a fault to mitigate the risk of bushfire. The REFCL device is capable of detecting when a power line has fallen to the ground and can almost instantaneously shut off power on the fallen line.
The technology requires new primary and secondary equipment to be installed at the zone substations as well as replacement of surge arrestors and other assets on the distribution network where they do not meet the required the rating for impedance earthed systems.
Compared with other options such as replacing overhead lines with underground cables, REFCL is an affordable and practical application to reduce safety risks.
United Energy has undertaken a bushfire mitigation ALARP risk assessment, and identified that the installation of two REFCLs will reduce UE’s overall bushfire risk by 35 per cent at a cost commensurate with the value of the risk reduction, and has thus been assessed as satisfying the ALARP criteria.
United Energy proposes to install the two REFCLs in the 2016 – 2020 regulatory control period at Dromana and Mornington substations, which supply the areas in UE’s territory with the highest bushfire risk.
We have amended our Bushfire Mitigation Plan to include the installation of the two REFCL devices, and submitted this to ESV. Once approved, it will become a mandatory obligation to complete the installations.
Based on our understanding of our network, REFCL technology and the last few years of available safety performance data, we forecast a reduction of 5 vegetation fires from asset failure each year in the 2016 – 2020 period through implementation of the $7.5M capex REFCL program.
8.8 SWER
United Energy has decided not to proceed with the replacement of SWER lines to mitigate bushfires, based on the outcome of its bushfire mitigation ALARP risk assessment.
Related Documents