NETWORK PLANNING IN ASSOCIATION WITH 2017

Welcome message from author
This document is posted to help you gain knowledge. Please leave a comment to let me know what you think about it! Share it to your friends and learn new things together.
Transcript

Network PlaNNiNg
In assocIatIon wIth
2017
Network PlaNNiNg 2017
2 | FlightGlobal FlightGlobal | 3
Network PlaNNiNg 2017
coNteNtsstrong demand keeps profits on upward path 4-5
top 100 airlines by traffic 6-7
top 30 airline groups by traffic 9
top 100 airports by traffic 10-11
airport leaders 12-13
airline start-ups and suspensions 14-15
alliance players 16-17
Leading European airports 18
capacity snapshot – Europe 19
the information contained in our databases and used in this presentation has been assembled from many sources, and whilst reasonable care has been taken to ensure accuracy, the information is supplied on the understanding that no legal liability whatsoever shall attach to FlightGlobal, its offices, or employees in respect of any error or omission that may have occurred.
© 2017 FlightGlobal,part of Reed Business Information Ltd
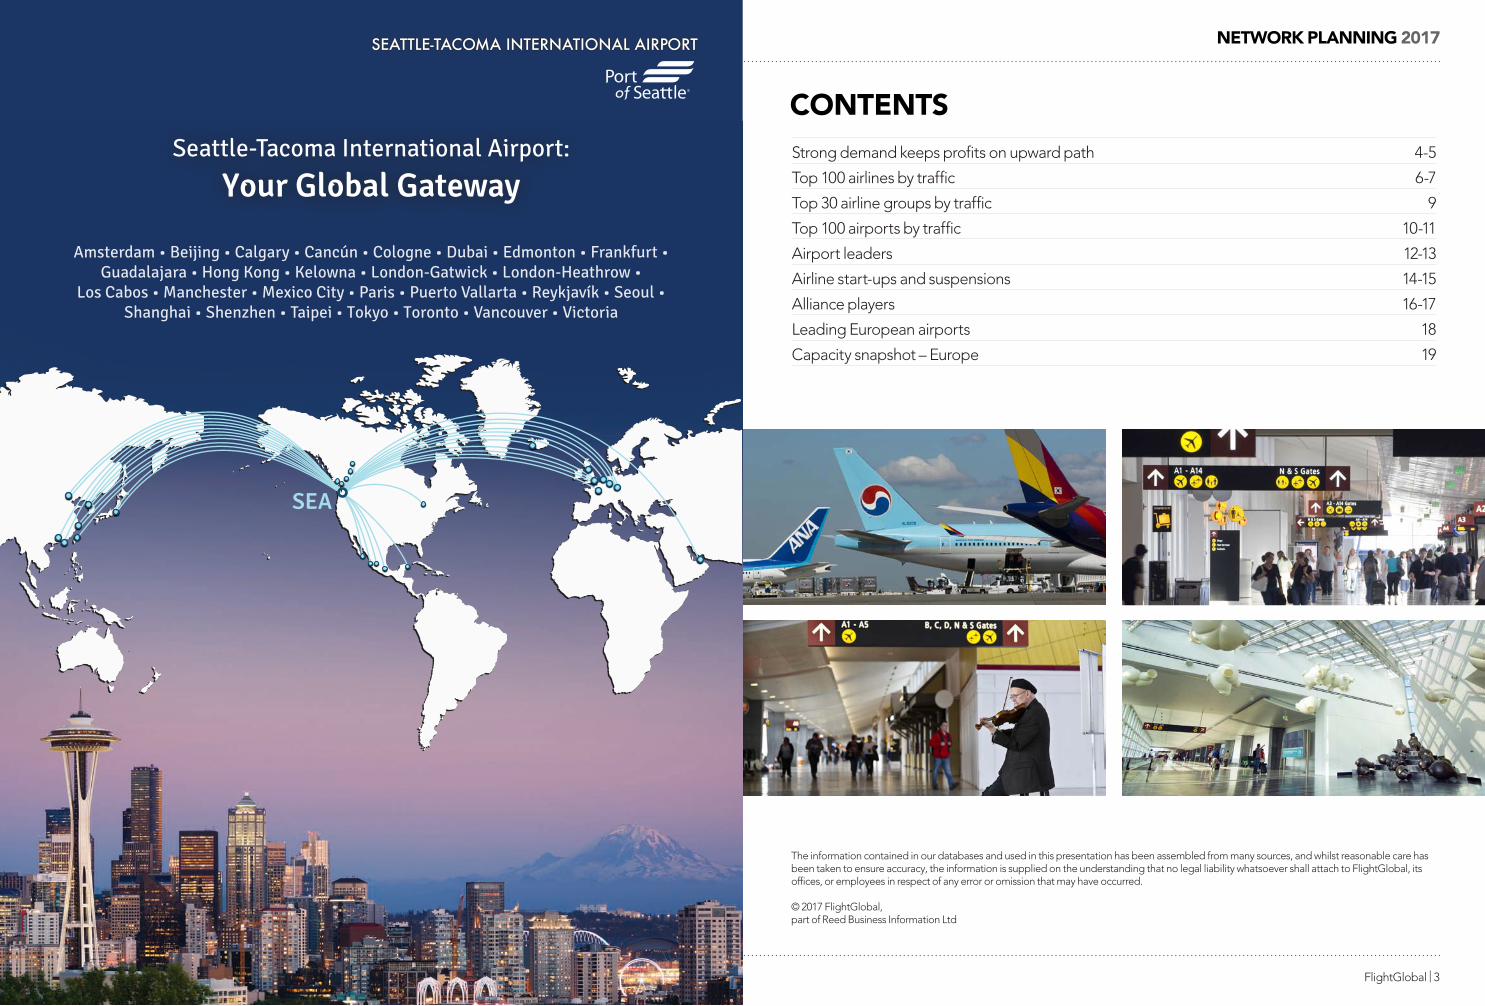
Seattle-Tacoma International Airport:
Your Global Gateway
Amsterdam
Paris
SEA
Network PlaNNiNg 2017
4 | FlightGlobal FlightGlobal | 5
Network PlaNNiNg 2017
stroNg demaNd keePs Profits oN uPward Pathwhile relatively little has changed in terms of industry profitability since Iata issued its first projection for 2017, the slightly improved outlook it outlined in June during its aGM underscores significant movement in some of the drivers.
crucially, demand – both passenger and, perhaps even more unexpectedly, air freight – is much stronger than Iata originally anticipated.
“I think there have been some quite significant changes,” notes Iata chief economist Brian Pearce. “the first one, which is unambiguously positive, is we have seen quite an improvement in business and consumer confidence and a return of economic activity. and the industry typically does well in those conditions.
“I think the challenge, and we’ve seen this in the first quarter numbers, is also quite an acceleration in costs. the outturn of this year will really depend on the balance of those two potentially opposing forces.”
Iata now sees airline passenger traffic growing 7.4% in 2017 – more than two percentage points higher than expected six months ago. that rate of growth would result in 275 million more passengers – the highest-ever growth in annual passenger numbers, in absolute terms – and take global passenger levels past the four-million mark.
that would mark a third consecutive year of traffic growth in excess of 7% – well above historic average rates. one of the main drivers of the high growth in 2015 and 2016 was lower fares – as airlines passed on some of the bounty of lower fuel costs through fare cuts. while some price-stimulation remains, interestingly it is the stronger economic outlook that is playing a more significant part in driving traffic growth this year.
Iata is factoring in world economic growth of 2.9% for 2017. this would represent the strongest year of economic growth since 2011.
“the combination of stronger growth and still quite substantial price stimulation means we are much more optimistic about air transport,” says Pearce.
not that falling yields are out of the picture altogether. Few airline commentaries in the first-quarter results season failed to mention continued yield pressure.
Iata had originally expected a flat yield environment during 2017. But It now expects unit revenues to be down 2% across the year. that would be a sixth consecutive year of falling yields, albeit at a much lower level of decline.
“we have started to see this levelling-out,” says Pearce.
the more positive change for cargo. the seemingly moribund sector sparking into life with a doubling of air freight traffic expectations to 7.5%. that would mark the highest rate of air freight growth since 2010 – a year which in part included recovering ground from the sharp falls from the financial crisis – and 2004 before that.
If the stronger demand and load factor picture was unexpected, a creeping-up of costs was less surprising.
“In the first quarter we have seen a rise in unit costs of about 5%, so that’s the emerging challenge for airlines. the key cost driver is fuel, and that’s particularly evident in the Us, but also maintenance costs, labour and also infrastructure,” says Pearce. “this is partly the downside of the upturn in economic activity, which has tightened labour markets in some countries and is adding to upward cost pressures.”
all of which has resulted in a slightly improved outlook for 2017 than Iata had been projecting six months ago. Iata now sees airlines posting collective profits of $31.4 billion – an improvement of $1.6 billion on its original expectations. that is just $3.4 billion short of 2016, net profit for which Iata has revised downwards slightly to $34.8 billion in part because of higher hit from fuel hedging losses.
that makes it one of its most profitable years ever – behind 2015 and 2016, the biggest years for net and operating profits respectively.
notably, Iata has improved its outlook for every region except north america. the outlook for both asia-Pacific and European carriers is aided by the better cargo market, Latin american carriers by the recovery of the key Brazilian economy, and african business by rising commodity prices – though it remains the only region in the red. high-profile challenges in the Middle East are expected to keep profits
for the carriers in the region at their lowest level for four years.
But Iata has scaled back its projection for north american profits by $2.7 billion on what they were projecting six months ago. north american carriers remain the most profitable, for a fifth consecutive year, and at $15.4 billion would still contribute almost half of industry net profit. however, the gap with asia-Pacific and European carriers is less pronounced than in the past.
that slip in north american profits from the high of 2015 is driven by higher costs, notably in fuel expenditure – where there is limited hedging in place – and a tighter labour market. Us carriers also continued to find an upturn in yields elusive in the first quarter.
notably, it means that the industry, on the whole at least, is on course to deliver returns above cost of capital for a third consecutive year.
BRIEFING IATA AGM
flightglobal.com/airlines8 | Flight Airline Business | July-August 2017
Airline leaders came together for the 2017 IATA AGM in the Mexican resort of Cancun, where it was clear that while outside factors continue to cast a shadow across the industry, the sector as a whole remains in good health
Resistance tested by external woes
If a reminder was needed of the potential for external events to
impact the airline industry, de-velopments both immediately before and during June’s IATA annual general meeting in Can-cun provided just that.
Delegates woke on the morning of 5 June to news that Qatar had been diplomatically isolated and denied airspace access by several neighbouring countries. That was set to hit IATA member Qatar Airways’ network – as well as those of other carriers – and threatened to reduce traffic in a region that was already showing signs of slowing growth (see pages 14-15).
“We are not in favour of bans, and we would like connectivity
De Juniac: aviation is a great example of globalisation’s benefits
GRAHAM DUNN, LEWIS HARPER, EDWARD RUSSELL, ELLIS TAYLOR & GHIM-LAY YEO CANCUN
Bill
yPix
to be restored as soon as possi-ble,” said IATA director-general Alexandre de Juniac during the AGM’s opening press briefing.
This development came days after the UK was hit by a terro rist attack, the latest in a series of incidents in Europe that
have threatened to dent travel demand.
All of this happened while news was sinking in that US president Donald Trump was to withdraw the USA from the Paris Agreement on climate change, raising concerns about its com-mitment to aviation’s CORSIA mechanism. Trump had also kicked off a renewed effort to enforce a travel ban on people from certain Middle Eastern countries by launching an – ulti-mately partially successful – challenge in the Supreme Court to rulings that blocked his origi-nal executive order.
For an industry already grappling with a ban on personal electronic devices (PEDs) in
While relatively little has changed in terms of industry profitability since IATA issued its first projection for 2017, the slightly improved out-look revealed in June underscores movement in some of the drivers.
Crucially, demand – both pas-senger and, perhaps more unex-pectedly, air freight – is stronger than IATA originally anticipated.
IATA now sees airline passenger traffic growing 7.4% in 2017 – more than two percentage points higher than expected six months ago. That rate of growth would result in 275 million more passengers – the highest-ever growth in annual pas-senger numbers, in absolute terms – and take global passenger levels past the four-million mark.
That would mark a third consec-utive year of traffic growth in ex-cess of 7%. One of the main driv-ers of the high growth in 2015 and 2016 was lower fares as airlines passed on lower fuel costs. While some price-stimulation remains, it is the stronger economic outlook that is a more significant this year.
IATA is factoring in world eco-nomic growth of 2.9% for 2017. This
would represent the strongest year of economic growth since 2011.
“The combination of stronger growth and still quite substantial price stimulation means we are much more optimistic about air transport,” says IATA chief econo-mist Brian Pearce.
But falling yields are not out of the picture altogether. IATA origi-nally expected a flat yield environ-ment during 2017. It now projects unit revenues down 2% across the year. “We have started to see this
levelling out,” says Pearce. “A lot of that is because the economy is growing quite a lot.”
High levels of capacity growth in many markets also contributed to lower yields. While IATA expects airlines to add more capacity dur-ing the year, this will be offset by traffic growth. “Airlines have been adding new capacity. But given the strength of demand we’ve seen, load factors have risen to new highs in most regions,” says Pearce. “That’s one of the key rea-
sons why we see profits doing bet-ter than we originally expected.”
CARGO LIFTEven more notable is the positive change for cargo. That seemingly moribund sector sparked into life with a doubling of air freight traf-fic expectations, to 7.5%. This would be the highest rate of air freight growth since 2010 – a year which in part included recovering ground from the sharp falls from the financial crisis – and 2004 before that.
But costs too are creeping up. “In the first quarter we have seen a rise in unit costs of about 5%, so that’s the emerging challenge for airlines. The key cost driver is fuel, particularly in the US, but also maintenance costs, labour and also infrastructure,” says Pearce.
All of this has resulted in a slightly improved outlook for 2017 than IATA projected six months ago. It now sees airlines posting collective profits of $31.4 billion – an improvement of $1.6 billion on its original expectations. That is just $3.4 billion short of 2016.
Profits maintaining their altitude on stronger travel demand
North America Asia Europe
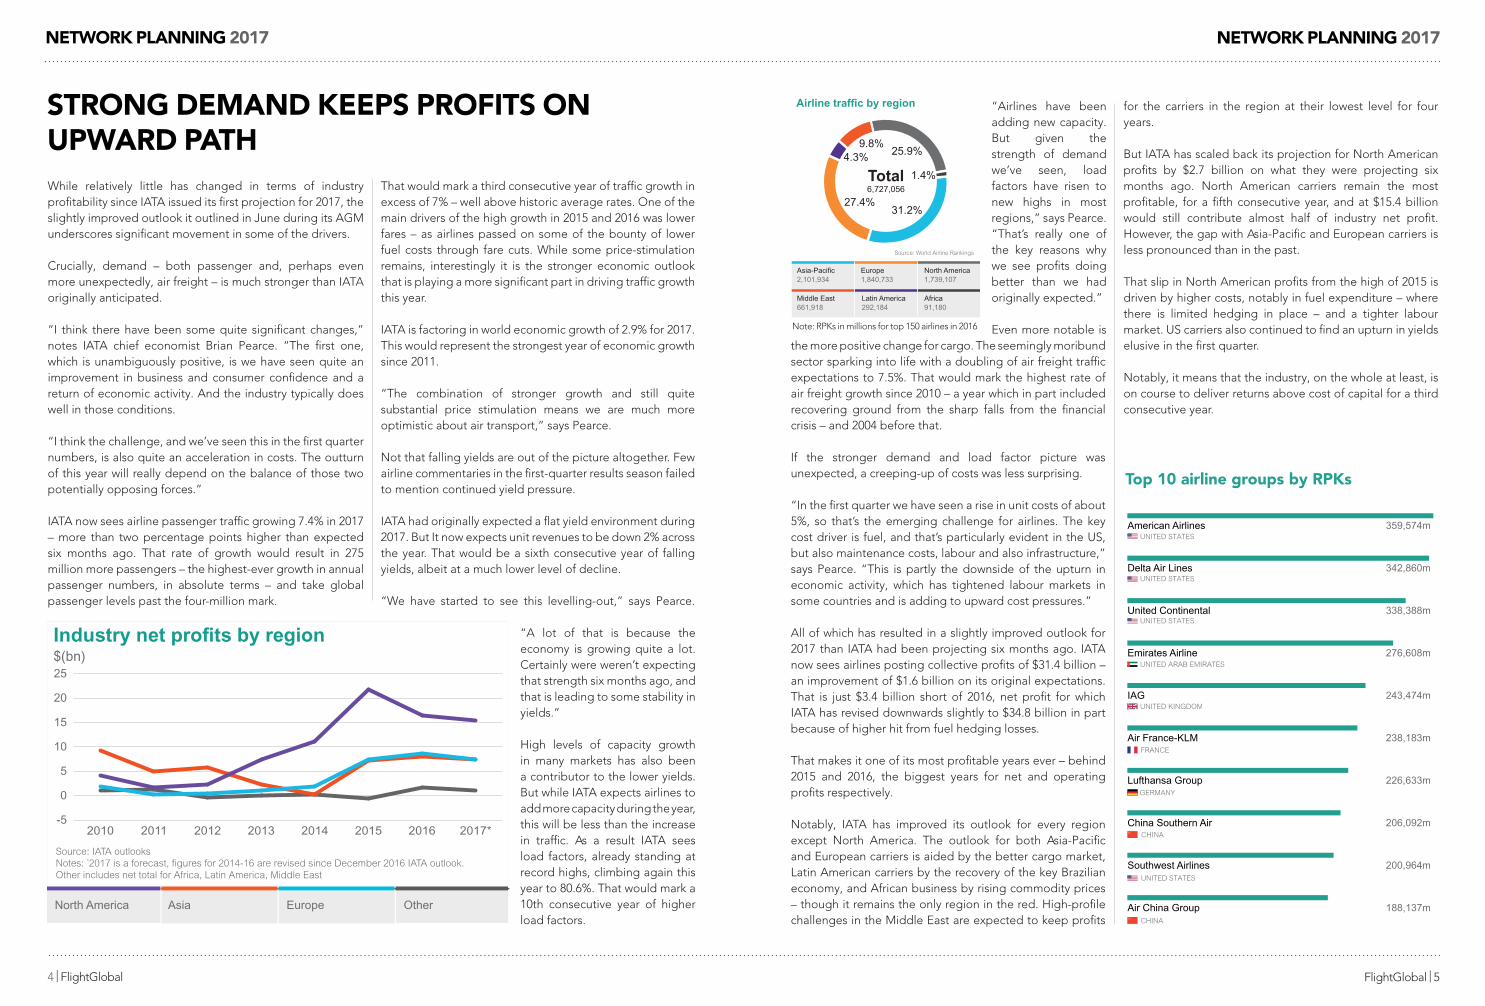
$(bn)Industry net profits by region
Source: IATA outlooks Notes: *2017 is a forecast, figures for 2014-16 are revised since December 2016 IATA outlook. Other includes net total for Africa, Latin America, Middle East
-5
0
5
10
15
20
25
2017*2016201520142013201220112010
Other
“a lot of that is because the economy is growing quite a lot. certainly were weren’t expecting that strength six months ago, and that is leading to some stability in yields.”
high levels of capacity growth in many markets has also been a contributor to the lower yields. But while Iata expects airlines to add more capacity during the year, this will be less than the increase in traffic. as a result Iata sees load factors, already standing at record highs, climbing again this year to 80.6%. that would mark a 10th consecutive year of higher load factors.
Source: World Airline Rankings
1.4%
25.9%9.8%
27.4% 31.2%
4.3%
Europe1,840,733
North America1,739,107
Asia-Pacific2,101,934
Latin America292,184
Africa91,180
Middle East661,918
Total6,727,056
Airline traffic by region “airlines have been adding new capacity. But given the strength of demand we’ve seen, load factors have risen to new highs in most regions,” says Pearce. “that’s really one of the key reasons why we see profits doing better than we had originally expected.”
Even more notable is
CHINA
UNITED ARAB EMIRATES
UNITED STATES
American Airlines 359,574m
Delta Air Lines 342,860m
United Continental 338,388m
Emirates Airline 276,608m
IAG 243,474m
Air France-KLM 238,183m
Lufthansa Group 226,633m
China Southern Air 206,092m
Southwest Airlines 200,964m
Air China Group 188,137m
UNITED STATES
UNITED STATES
UNITED STATES
UNITED KINGDOM
CHINA
FRANCE
GERMANY
top 10 airline groups by rPks
note: RPKs in millions for top 150 airlines in 2016
Network PlaNNiNg 2017
6 | FlightGlobal FlightGlobal | 7
Network PlaNNiNg 2017
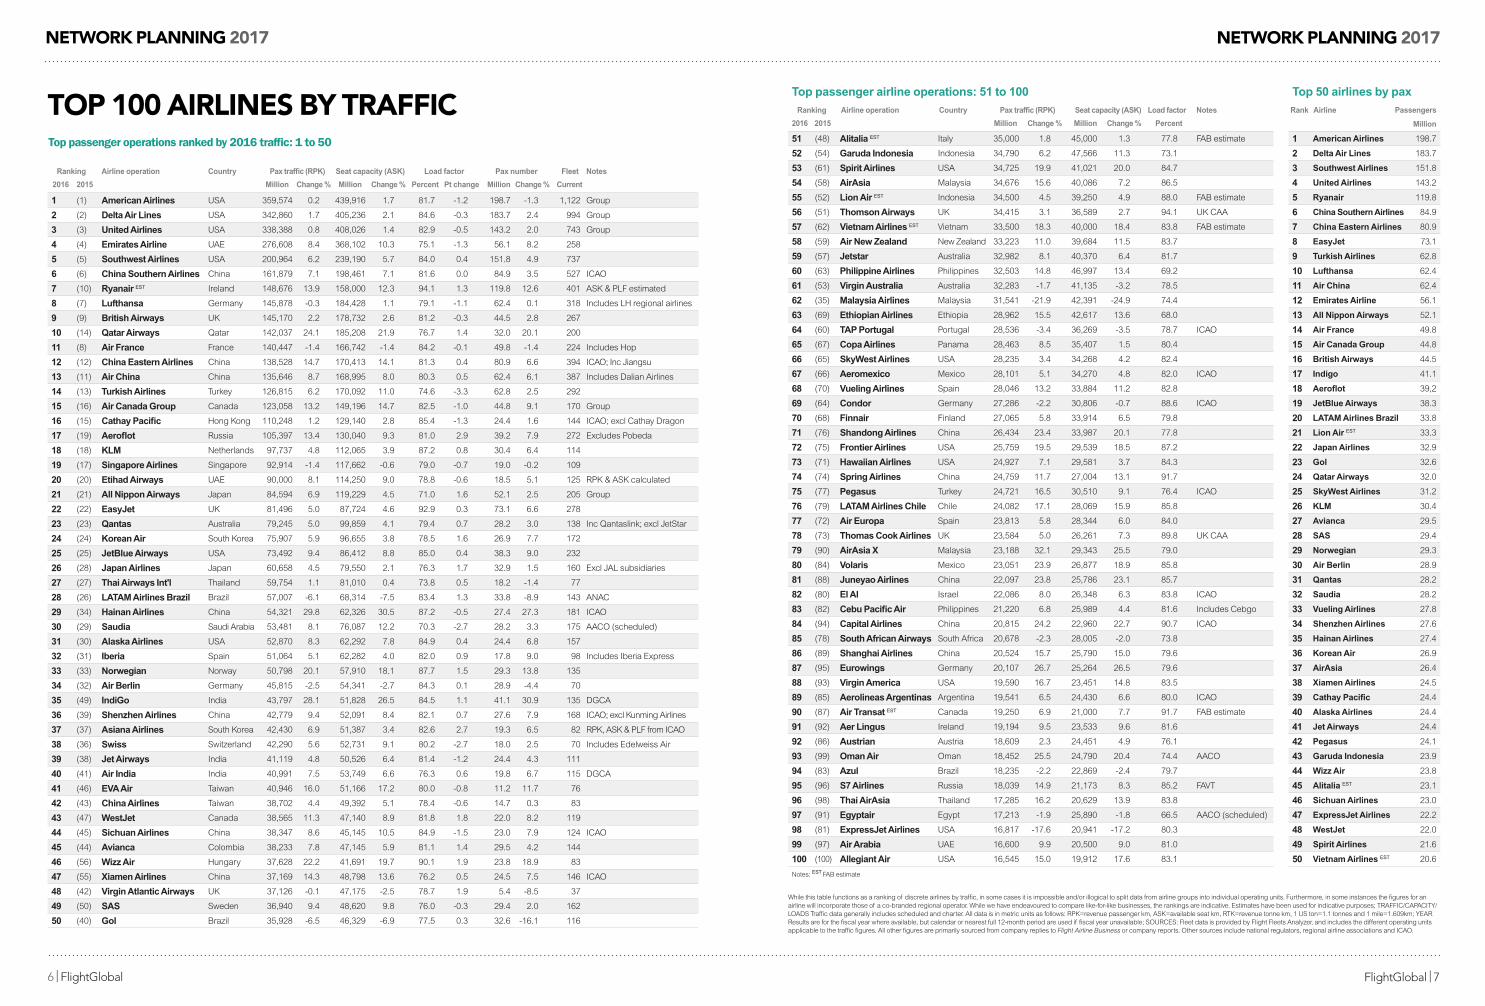
toP 100 airliNes by trafficTop passenger operations ranked by 2016 traffic: 1 to 50
WORLD AIRLINES RANKINGS TRAFFIC
36 | Flight Airline Business | July-August 2017 flightglobal.com/airlines
Top 100 airlines by trafficDATA COMPILED BY SILVA ISHAK FLIGHTGLOBAL DATA RESEARCH TEAM
Top passenger airline operations: 1 to 50 Ranking Airline operation Country Pax traffic (RPK) Seat capacity (ASK) Load factor Pax number Fleet Notes
2016 2015 Million Change % Million Change % Percent Pt change Million Change % Current
1 (1) American Airlines USA 359,574 0.2 439,916 1.7 81.7 -1.2 198.7 -1.3 1,122 Group
2 (2) Delta Air Lines USA 342,860 1.7 405,236 2.1 84.6 -0.3 183.7 2.4 994 Group
3 (3) United Airlines USA 338,388 0.8 408,026 1.4 82.9 -0.5 143.2 2.0 743 Group
4 (4) Emirates Airline UAE 276,608 8.4 368,102 10.3 75.1 -1.3 56.1 8.2 258
5 (5) Southwest Airlines USA 200,964 6.2 239,190 5.7 84.0 0.4 151.8 4.9 737
6 (6) China Southern Airlines China 161,879 7.1 198,461 7.1 81.6 0.0 84.9 3.5 527 ICAO
7 (10) Ryanair EST Ireland 148,676 13.9 158,000 12.3 94.1 1.3 119.8 12.6 401 ASK & PLF estimated
8 (7) Lufthansa Germany 145,878 -0.3 184,428 1.1 79.1 -1.1 62.4 0.1 318 Includes LH regional airlines
9 (9) British Airways UK 145,170 2.2 178,732 2.6 81.2 -0.3 44.5 2.8 267
10 (14) Qatar Airways Qatar 142,037 24.1 185,208 21.9 76.7 1.4 32.0 20.1 200
11 (8) Air France France 140,447 -1.4 166,742 -1.4 84.2 -0.1 49.8 -1.4 224 Includes Hop
12 (12) China Eastern Airlines China 138,528 14.7 170,413 14.1 81.3 0.4 80.9 6.6 394 ICAO; Inc Jiangsu
13 (11) Air China China 135,646 8.7 168,995 8.0 80.3 0.5 62.4 6.1 387 Includes Dalian Airlines
14 (13) Turkish Airlines Turkey 126,815 6.2 170,092 11.0 74.6 -3.3 62.8 2.5 292
15 (16) Air Canada Group Canada 123,058 13.2 149,196 14.7 82.5 -1.0 44.8 9.1 170 Group
16 (15) Cathay Pacific Hong Kong 110,248 1.2 129,140 2.8 85.4 -1.3 24.4 1.6 144 ICAO; excl Cathay Dragon
17 (19) Aeroflot Russia 105,397 13.4 130,040 9.3 81.0 2.9 39.2 7.9 272 Excludes Pobeda
18 (18) KLM Netherlands 97,737 4.8 112,065 3.9 87.2 0.8 30.4 6.4 114
19 (17) Singapore Airlines Singapore 92,914 -1.4 117,662 -0.6 79.0 -0.7 19.0 -0.2 109
20 (20) Etihad Airways UAE 90,000 8.1 114,250 9.0 78.8 -0.6 18.5 5.1 125 RPK & ASK calculated
21 (21) All Nippon Airways Japan 84,594 6.9 119,229 4.5 71.0 1.6 52.1 2.5 205 Group
22 (22) EasyJet UK 81,496 5.0 87,724 4.6 92.9 0.3 73.1 6.6 278
23 (23) Qantas Australia 79,245 5.0 99,859 4.1 79.4 0.7 28.2 3.0 138 Inc Qantaslink; excl JetStar
24 (24) Korean Air South Korea 75,907 5.9 96,655 3.8 78.5 1.6 26.9 7.7 172
25 (25) JetBlue Airways USA 73,492 9.4 86,412 8.8 85.0 0.4 38.3 9.0 232
26 (28) Japan Airlines Japan 60,658 4.5 79,550 2.1 76.3 1.7 32.9 1.5 160 Excl JAL subsidiaries
27 (27) Thai Airways Int'l Thailand 59,754 1.1 81,010 0.4 73.8 0.5 18.2 -1.4 77
28 (26) LATAM Airlines Brazil Brazil 57,007 -6.1 68,314 -7.5 83.4 1.3 33.8 -8.9 143 ANAC
29 (34) Hainan Airlines China 54,321 29.8 62,326 30.5 87.2 -0.5 27.4 27.3 181 ICAO
30 (29) Saudia Saudi Arabia 53,481 8.1 76,087 12.2 70.3 -2.7 28.2 3.3 175 AACO (scheduled)
31 (30) Alaska Airlines USA 52,870 8.3 62,292 7.8 84.9 0.4 24.4 6.8 157
32 (31) Iberia Spain 51,064 5.1 62,282 4.0 82.0 0.9 17.8 9.0 98 Includes Iberia Express
33 (33) Norwegian Norway 50,798 20.1 57,910 18.1 87.7 1.5 29.3 13.8 135
34 (32) Air Berlin Germany 45,815 -2.5 54,341 -2.7 84.3 0.1 28.9 -4.4 70
35 (49) IndiGo India 43,797 28.1 51,828 26.5 84.5 1.1 41.1 30.9 135 DGCA
36 (39) Shenzhen Airlines China 42,779 9.4 52,091 8.4 82.1 0.7 27.6 7.9 168 ICAO; excl Kunming Airlines
37 (37) Asiana Airlines South Korea 42,430 6.9 51,387 3.4 82.6 2.7 19.3 6.5 82 RPK, ASK & PLF from ICAO
38 (36) Swiss Switzerland 42,290 5.6 52,731 9.1 80.2 -2.7 18.0 2.5 70 Includes Edelweiss Air
39 (38) Jet Airways India 41,119 4.8 50,526 6.4 81.4 -1.2 24.4 4.3 111
40 (41) Air India India 40,991 7.5 53,749 6.6 76.3 0.6 19.8 6.7 115 DGCA
41 (46) EVA Air Taiwan 40,946 16.0 51,166 17.2 80.0 -0.8 11.2 11.7 76
42 (43) China Airlines Taiwan 38,702 4.4 49,392 5.1 78.4 -0.6 14.7 0.3 83
43 (47) WestJet Canada 38,565 11.3 47,140 8.9 81.8 1.8 22.0 8.2 119
44 (45) Sichuan Airlines China 38,347 8.6 45,145 10.5 84.9 -1.5 23.0 7.9 124 ICAO
45 (44) Avianca Colombia 38,233 7.8 47,145 5.9 81.1 1.4 29.5 4.2 144
46 (56) Wizz Air Hungary 37,628 22.2 41,691 19.7 90.1 1.9 23.8 18.9 83
47 (55) Xiamen Airlines China 37,169 14.3 48,798 13.6 76.2 0.5 24.5 7.5 146 ICAO
48 (42) Virgin Atlantic Airways UK 37,126 -0.1 47,175 -2.5 78.7 1.9 5.4 -8.5 37
49 (50) SAS Sweden 36,940 9.4 48,620 9.8 76.0 -0.3 29.4 2.0 162
50 (40) Gol Brazil 35,928 -6.5 46,329 -6.9 77.5 0.3 32.6 -16.1 116
ABU_210717_040-041.indd 36 14/07/2017 14:22
July-August 2017 | Flight Airline Business | 37flightglobal.com/airlines
While this table functions as a ranking of discrete airlines by traffic, in some cases it is impossible and/or illogical to split data from airline groups into individual operating units. Furthermore, in some instances the figures for an airline will incorporate those of a co-branded regional operator. While we have endeavoured to compare like-for-like businesses, the rankings are indicative. Estimates have been used for indicative purposes; TRAFFIC/CAPACITY/LOADS Traffic data generally includes scheduled and charter. All data is in metric units as follows: RPK=revenue passenger km, ASK=available seat km, RTK=revenue tonne km, 1 US ton=1.1 tonnes and 1 mile=1.609km; YEAR Results are for the fiscal year where available, but calendar or nearest full 12-month period are used if fiscal year unavailable; SOURCES: Fleet data is provided by Flight Fleets Analyzer, and includes the different operating units applicable to the traffic figures. All other figures are primarily sourced from company replies to Flight Airline Business or company reports. Other sources include national regulators, regional airline associations and ICAO.
Top passenger airline operations: 51 to 100 Ranking Airline operation Country Pax traffic (RPK) Seat capacity (ASK) Load factor Notes
2016 2015 Million Change % Million Change % Percent
51 (48) Alitalia EST Italy 35,000 1.8 45,000 1.3 77.8 FAB estimate
52 (54) Garuda Indonesia Indonesia 34,790 6.2 47,566 11.3 73.1
53 (61) Spirit Airlines USA 34,725 19.9 41,021 20.0 84.7
54 (58) AirAsia Malaysia 34,676 15.6 40,086 7.2 86.5
55 (52) Lion Air EST Indonesia 34,500 4.5 39,250 4.9 88.0 FAB estimate
56 (51) Thomson Airways UK 34,415 3.1 36,589 2.7 94.1 UK CAA
57 (62) Vietnam Airlines EST Vietnam 33,500 18.3 40,000 18.4 83.8 FAB estimate
58 (59) Air New Zealand New Zealand 33,223 11.0 39,684 11.5 83.7
59 (57) Jetstar Australia 32,982 8.1 40,370 6.4 81.7
60 (63) Philippine Airlines Philippines 32,503 14.8 46,997 13.4 69.2
61 (53) Virgin Australia Australia 32,283 -1.7 41,135 -3.2 78.5
62 (35) Malaysia Airlines Malaysia 31,541 -21.9 42,391 -24.9 74.4
63 (69) Ethiopian Airlines Ethiopia 28,962 15.5 42,617 13.6 68.0
64 (60) TAP Portugal Portugal 28,536 -3.4 36,269 -3.5 78.7 ICAO
65 (67) Copa Airlines Panama 28,463 8.5 35,407 1.5 80.4
66 (65) SkyWest Airlines USA 28,235 3.4 34,268 4.2 82.4
67 (66) Aeromexico Mexico 28,101 5.1 34,270 4.8 82.0 ICAO
68 (70) Vueling Airlines Spain 28,046 13.2 33,884 11.2 82.8
69 (64) Condor Germany 27,286 -2.2 30,806 -0.7 88.6 ICAO
70 (68) Finnair Finland 27,065 5.8 33,914 6.5 79.8
71 (76) Shandong Airlines China 26,434 23.4 33,987 20.1 77.8
72 (75) Frontier Airlines USA 25,759 19.5 29,539 18.5 87.2
73 (71) Hawaiian Airlines USA 24,927 7.1 29,581 3.7 84.3
74 (74) Spring Airlines China 24,759 11.7 27,004 13.1 91.7
75 (77) Pegasus Turkey 24,721 16.5 30,510 9.1 76.4 ICAO
76 (79) LATAM Airlines Chile Chile 24,082 17.1 28,069 15.9 85.8
77 (72) Air Europa Spain 23,813 5.8 28,344 6.0 84.0
78 (73) Thomas Cook Airlines UK 23,584 5.0 26,261 7.3 89.8 UK CAA
79 (90) AirAsia X Malaysia 23,188 32.1 29,343 25.5 79.0
80 (84) Volaris Mexico 23,051 23.9 26,877 18.9 85.8
81 (88) Juneyao Airlines China 22,097 23.8 25,786 23.1 85.7
82 (80) El Al Israel 22,086 8.0 26,348 6.3 83.8 ICAO
83 (82) Cebu Pacific Air Philippines 21,220 6.8 25,989 4.4 81.6 Includes Cebgo
84 (94) Capital Airlines China 20,815 24.2 22,960 22.7 90.7 ICAO
85 (78) South African Airways South Africa 20,678 -2.3 28,005 -2.0 73.8
86 (89) Shanghai Airlines China 20,524 15.7 25,790 15.0 79.6
87 (95) Eurowings Germany 20,107 26.7 25,264 26.5 79.6
88 (93) Virgin America USA 19,590 16.7 23,451 14.8 83.5
89 (85) Aerolineas Argentinas Argentina 19,541 6.5 24,430 6.6 80.0 ICAO
90 (87) Air Transat EST Canada 19,250 6.9 21,000 7.7 91.7 FAB estimate
91 (92) Aer Lingus Ireland 19,194 9.5 23,533 9.6 81.6
92 (86) Austrian Austria 18,609 2.3 24,451 4.9 76.1
93 (99) Oman Air Oman 18,452 25.5 24,790 20.4 74.4 AACO
94 (83) Azul Brazil 18,235 -2.2 22,869 -2.4 79.7
95 (96) S7 Airlines Russia 18,039 14.9 21,173 8.3 85.2 FAVT
96 (98) Thai AirAsia Thailand 17,285 16.2 20,629 13.9 83.8
97 (91) Egyptair Egypt 17,213 -1.9 25,890 -1.8 66.5 AACO (scheduled)
98 (81) ExpressJet Airlines USA 16,817 -17.6 20,941 -17.2 80.3
99 (97) Air Arabia UAE 16,600 9.9 20,500 9.0 81.0
100 (100) Allegiant Air USA 16,545 15.0 19,912 17.6 83.1
Notes: EST FAB estimate
1 American Airlines 198.7
2 Delta Air Lines 183.7
3 Southwest Airlines 151.8
4 United Airlines 143.2
5 Ryanair 119.8
6 China Southern Airlines 84.9
7 China Eastern Airlines 80.9
8 EasyJet 73.1
9 Turkish Airlines 62.8
10 Lufthansa 62.4
11 Air China 62.4
12 Emirates Airline 56.1
13 All Nippon Airways 52.1
14 Air France 49.8
15 Air Canada Group 44.8
16 British Airways 44.5
17 Indigo 41.1
18 Aeroflot 39,2
19 JetBlue Airways 38.3
20 LATAM Airlines Brazil 33.8
21 Lion Air EST 33.3
22 Japan Airlines 32.9
23 Gol 32.6
24 Qatar Airways 32.0
25 SkyWest Airlines 31.2
26 KLM 30.4
27 Avianca 29.5
28 SAS 29.4
29 Norwegian 29.3
30 Air Berlin 28.9
31 Qantas 28.2
32 Saudia 28.2
33 Vueling Airlines 27.8
34 Shenzhen Airlines 27.6
35 Hainan Airlines 27.4
36 Korean Air 26.9
37 AirAsia 26.4
38 Xiamen Airlines 24.5
39 Cathay Pacific 24.4
40 Alaska Airlines 24.4
41 Jet Airways 24.4
42 Pegasus 24.1
43 Garuda Indonesia 23.9
44 Wizz Air 23.8
45 Alitalia EST 23.1
46 Sichuan Airlines 23.0
47 ExpressJet Airlines 22.2
48 WestJet 22.0
49 Spirit Airlines 21.6
50 Vietnam Airlines EST 20.6
Top 50 airlines by paxRank Airline Passengers
Million
ABU_210717_040-041.indd 37 14/07/2017 14:22
Network PlaNNiNg 2017
8 | FlightGlobal FlightGlobal | 9
Network PlaNNiNg 2017
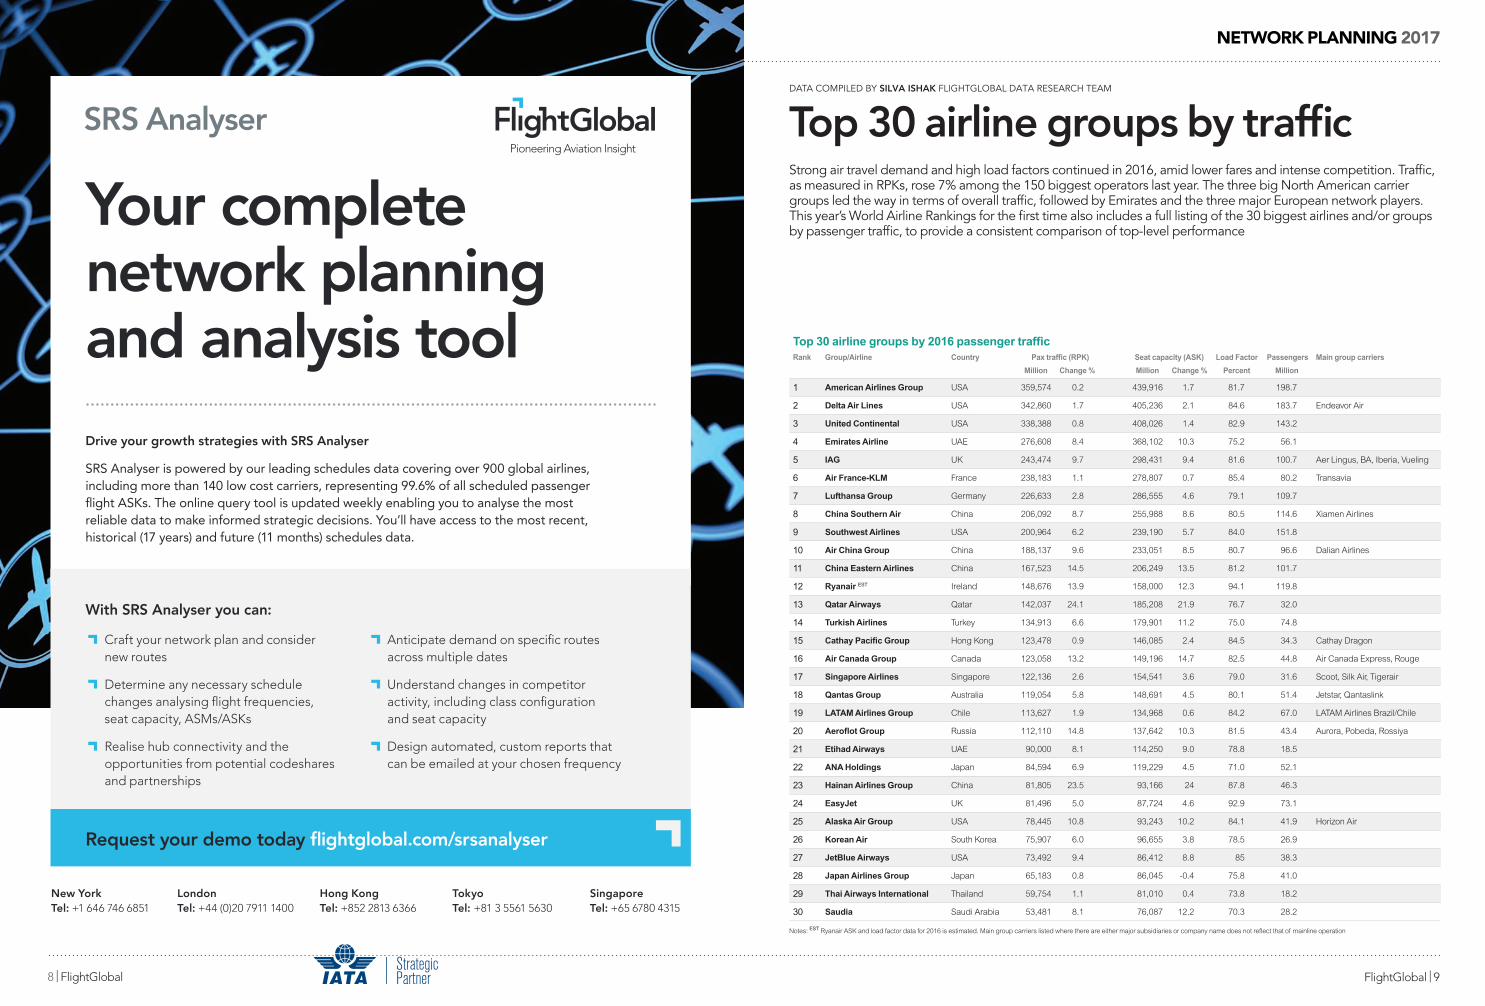
Your complete network planning and analysis toolDrive your growth strategies with SRS Analyser
SRS Analyser is powered by our leading schedules data covering over 900 global airlines, including more than 140 low cost carriers, representing 99.6% of all scheduled passenger
historical (17 years) and future (11 months) schedules data.
Request your demo today
With SRS Analyser you can:
New York Tel: +1 646 746 6851
Hong Kong Tel: +852 2813 6366
Singapore Tel: +65 6780 4315
London Tel: +44 (0)20 7911 1400
and seat capacity
seat capacity, ASMs/ASKs
Tokyo Tel: +81 3 5561 5630
SRS Analyser
WORLD AIRLINE RANKINGS TRAFFIC
July-August 2017 | Flight Airline Business | 35flightglobal.com/airlines
Top 30 airline groups by traffic DATA COMPILED BY SILVA ISHAK FLIGHTGLOBAL DATA RESEARCH TEAM
Top 30 airline groups by 2016 passenger trafficRank Group/Airline Country Pax traffic (RPK) Seat capacity (ASK) Load Factor Passengers Main group carriers
Million Change % Million Change % Percent Million
1 American Airlines Group USA 359,574 0.2 439,916 1.7 81.7 198.7
2 Delta Air Lines USA 342,860 1.7 405,236 2.1 84.6 183.7 Endeavor Air
3 United Continental USA 338,388 0.8 408,026 1.4 82.9 143.2
4 Emirates Airline UAE 276,608 8.4 368,102 10.3 75.2 56.1
5 IAG UK 243,474 9.7 298,431 9.4 81.6 100.7 Aer Lingus, BA, Iberia, Vueling
6 Air France-KLM France 238,183 1.1 278,807 0.7 85.4 80.2 Transavia
7 Lufthansa Group Germany 226,633 2.8 286,555 4.6 79.1 109.7
8 China Southern Air China 206,092 8.7 255,988 8.6 80.5 114.6 Xiamen Airlines
9 Southwest Airlines USA 200,964 6.2 239,190 5.7 84.0 151.8
10 Air China Group China 188,137 9.6 233,051 8.5 80.7 96.6 Dalian Airlines
11 China Eastern Airlines China 167,523 14.5 206,249 13.5 81.2 101.7
12 Ryanair EST Ireland 148,676 13.9 158,000 12.3 94.1 119.8
13 Qatar Airways Qatar 142,037 24.1 185,208 21.9 76.7 32.0
14 Turkish Airlines Turkey 134,913 6.6 179,901 11.2 75.0 74.8
15 Cathay Pacific Group Hong Kong 123,478 0.9 146,085 2.4 84.5 34.3 Cathay Dragon
16 Air Canada Group Canada 123,058 13.2 149,196 14.7 82.5 44.8 Air Canada Express, Rouge
17 Singapore Airlines Singapore 122,136 2.6 154,541 3.6 79.0 31.6 Scoot, Silk Air, Tigerair
18 Qantas Group Australia 119,054 5.8 148,691 4.5 80.1 51.4 Jetstar, Qantaslink
19 LATAM Airlines Group Chile 113,627 1.9 134,968 0.6 84.2 67.0 LATAM Airlines Brazil/Chile
20 Aeroflot Group Russia 112,110 14.8 137,642 10.3 81.5 43.4 Aurora, Pobeda, Rossiya
21 Etihad Airways UAE 90,000 8.1 114,250 9.0 78.8 18.5
22 ANA Holdings Japan 84,594 6.9 119,229 4.5 71.0 52.1
23 Hainan Airlines Group China 81,805 23.5 93,166 24 87.8 46.3
24 EasyJet UK 81,496 5.0 87,724 4.6 92.9 73.1
25 Alaska Air Group USA 78,445 10.8 93,243 10.2 84.1 41.9 Horizon Air
26 Korean Air South Korea 75,907 6.0 96,655 3.8 78.5 26.9
27 JetBlue Airways USA 73,492 9.4 86,412 8.8 85 38.3
28 Japan Airlines Group Japan 65,183 0.8 86,045 -0.4 75.8 41.0
29 Thai Airways International Thailand 59,754 1.1 81,010 0.4 73.8 18.2
30 Saudia Saudi Arabia 53,481 8.1 76,087 12.2 70.3 28.2
Strong air travel demand and high load factors continued in 2016, amid lower fares and intense competition. Traffic, as measured in RPKs, rose 7% among the 150 biggest operators last year. The three big North American carrier groups led the way in terms of overall traffic, followed by Emirates and the three major European network players. This year’s World Airline Rankings for the first time also includes a full listing of the 30 biggest airlines and/or groups by passenger traffic, to provide a consistent comparison of top-level performance
Notes: EST Ryanair ASK and load factor data for 2016 is estimated. Main group carriers listed where there are either major subsidiaries or company name does not reflect that of mainline operation
Network PlaNNiNg 2017
10 | FlightGlobal FlightGlobal | 11
Network PlaNNiNg 2017
toP 100 airPorts by traffic
Ranking City Airport Code Country Passengers Available seats per week
2016 2015 Number (000) Change % Number (000) Av seats change %1 (1) Atlanta Hartsfield Int'l ATL USA 104,172 2.6 2,581 1.3
2 (2) Beijing Capital PEK China 94,393 5.0 2,513 2.7
3 (3) Dubai International DXB UAE 83,654 7.2 2,446 5.9
4 (7) Los Angeles International LAX USA 80,922 8.0 2,181 5.4
5 (5) Tokyo Haneda Int'l HND Japan 80,122 6.4 2,198 4.2
6 (4) Chicago O'Hare International ORD USA 77,961 1.3 1,964 1.9
7 (6) London Heathrow LHR UK 75,676 1.0 2,077 -0.2
8 (8) Hong Kong International HKG Hong Kong 70,502 2.9 1,734 1.9
9 (13) Shanghai Pudong International PVG China 66,002 9.8 1,809 6.3
10 (9) Paris Charles de Gaulle CDG France 65,933 0.3 1,666 1.0
11 (10) Dallas/Fort Worth International DFW USA 65,671 0.2 1,603 3.2
12 (14) Amsterdam Schiphol AMS Netherlands 63,600 9.1 1,629 6.8
13 (12) Frankfurt International FRA Germany 60,792 -0.4 1,759 4.5
14 (11) Istanbul Ataturk International IST Turkey 60,119 -2.0 1,631 -1.8
15 (17) Guangzhou Baiyun International CAN China 59,732 8.2 1,652 7.3
16 (15) New York JFK JFK USA 58,800 3.5 1,523 1.5
17 (16) Singapore Changi SIN Singapore 58,698 5.9 1,612 3.3
18 (19) Denver International DEN USA 58,267 7.9 1,667 9.6
19 (18) Jakarta Soekarno Hatta Int'l CGK Indonesia 58,195 7.6 1,781 0.2
20 (22) Seoul Incheon International ICN South Korea 57,765 17.2 1,414 6.0
21 (25) Delhi Indira Gandhi Int'l DEL India 55,631 21.0 1,636 10.5
22 (20) Bangkok Suvarnabhumi BKK Thailand 55,473 5.9 1,471 4.7
23 (21) San Francisco Internationa SFO USA 53,107 6.1 1,425 2.9
24 (23) Kuala Lumpur International KUL Malaysia 52,624 7.5 1,437 10.6
25 (24) Madrid Barajas MAD Spain 50,421 7.7 1,259 4.3
26 (26) Las Vegas McCarran Int'l LAS USA 47,436 4.5 1,382 3.3
27 (32) Chengdu Shuangliu Int'l CTU China 46,039 9.0 1,266 10.9
28 (31) Seattle Tacoma International SEA USA 45,737 8.0 1,184 2.1
29 (35) Mumbai International BOM India 44,681 10.0 1,206 3.9
30 (28) Miami International MIA USA 44,585 0.5 1,048 0.3
31 (27) Charlotte Douglas CLT USA 44,422 -1.0 1,169 3.5
32 (33) Toronto Pearson International YYZ Canada 44,336 8.0 1,094 5.0
33 (39) Barcelona El Prat BCN Spain 44,155 11.2 1,209 8.4
34 (29) Phoenix Sky Harbor PHX USA 43,384 -1.4 1,268 5.5
35 (37) London Gatwick LGW UK 43,137 7.1 1,101 7.4
36 (44) Taipei Taoyuan International TPE Taiwan 42,296 9.9 1,067 0.7
37 (34) Munich International MUC Germany 42,278 3.1 1,277 7.1
38 (46) Kunming Changshui Int'l KMG China 41,980 11.9 1,343 19.1
39 (38) Shenzhen Baoan International SZX China 41,975 5.7 1,229 10.3
40 (43) Orlando International MCO USA 41,923 8.0 1,183 4.9
41 (40) Sydney Kingsford Smith Int'l SYD Australia 41,870 5.6 1,067 3.2
42 (36) Rome Fiumicino FCO Italy 41,745 3.2 1,067 0.0
43 (45) Mexico City Benito Juarez Int'l MEX Mexico 41,710 8.5 1,085 8.4
44 (30) Houston George Bush IAH USA 41,616 -3.3 1,063 1.9
45 (41) Shanghai Hongqiao Int'l SHA China 40,460 3.5 1,076 4.9
46 (47) Newark Liberty International EWR USA 40,351 7.6 1,117 10.7
47 (49) Manila Ninoy Aquino Int'l MNL Philippines 39,517 8.0 1,009 1.9
48 (48) Tokyo Narita International NRT Japan 39,054 4.6 955 -1.2
49 (49) Minneapolis-St. Paul International MSP USA 37,518 2.6 962 4.0
50 (58) Doha International DOH Qatar 37,300 20.5 1,101 9.7
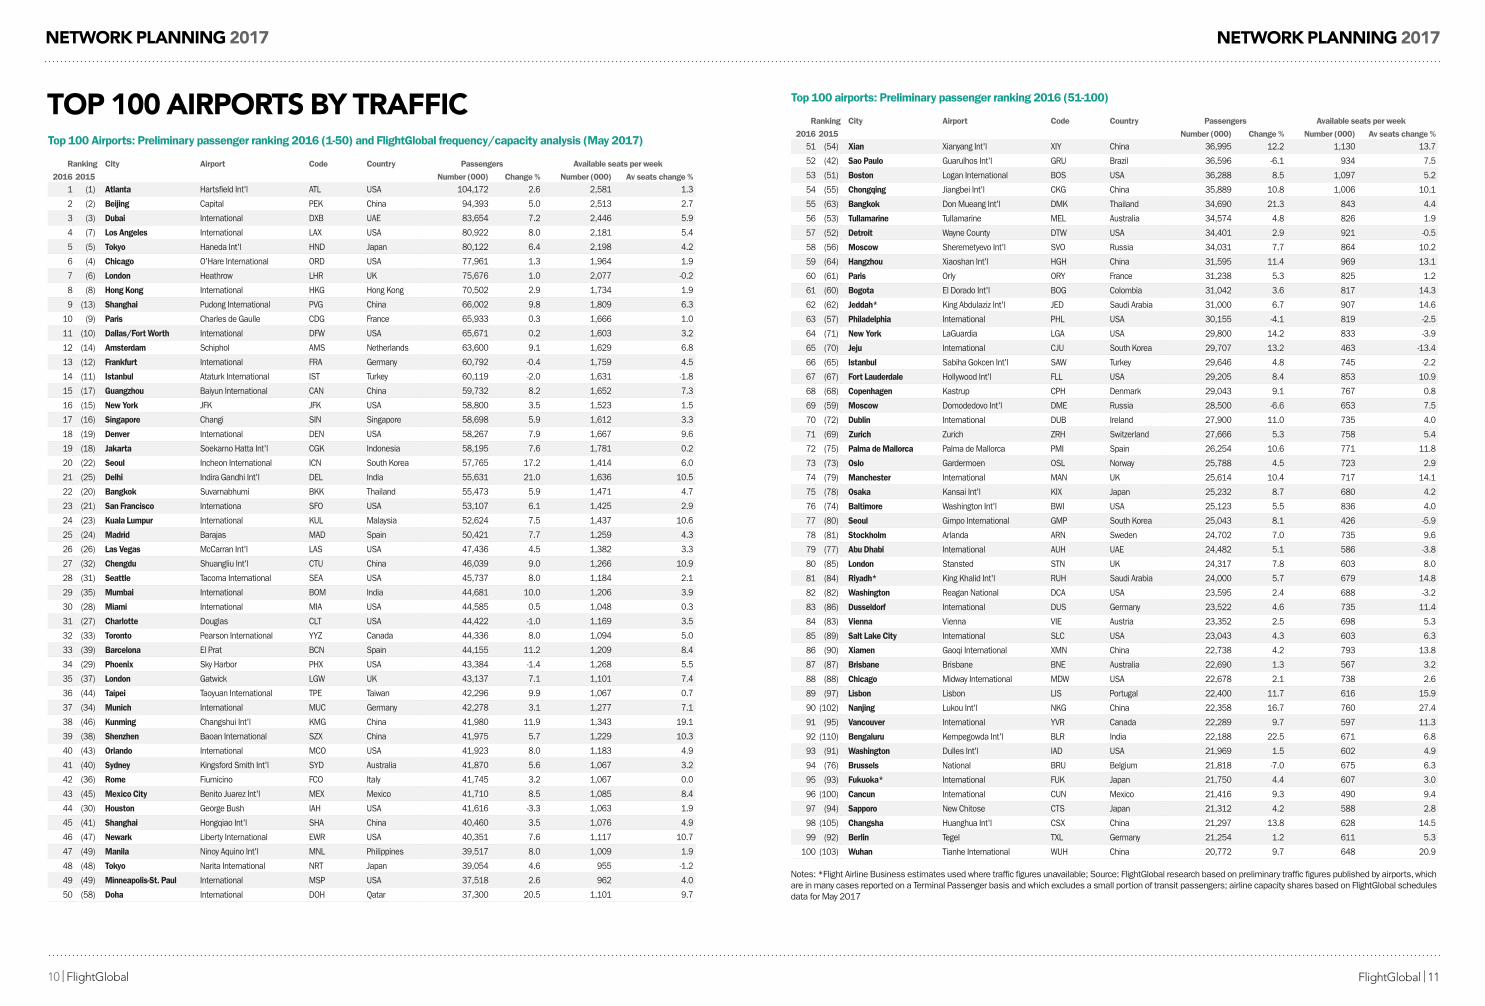
Top 100 Airports: Preliminary passenger ranking 2016 (1-50) and FlightGlobal frequency/capacity analysis (May 2017)
Ranking City Airport Code Country Passengers Available seats per week
2016 2015 Number (000) Change % Number (000) Av seats change %51 (54) Xian Xianyang Int'l XIY China 36,995 12.2 1,130 13.7
52 (42) Sao Paulo Guarulhos Int'l GRU Brazil 36,596 -6.1 934 7.5
53 (51) Boston Logan International BOS USA 36,288 8.5 1,097 5.2
54 (55) Chongqing Jiangbei Int'l CKG China 35,889 10.8 1,006 10.1
55 (63) Bangkok Don Mueang Int'l DMK Thailand 34,690 21.3 843 4.4
56 (53) Tullamarine Tullamarine MEL Australia 34,574 4.8 826 1.9
57 (52) Detroit Wayne County DTW USA 34,401 2.9 921 -0.5
58 (56) Moscow Sheremetyevo Int'l SVO Russia 34,031 7.7 864 10.2
59 (64) Hangzhou Xiaoshan Int'l HGH China 31,595 11.4 969 13.1
60 (61) Paris Orly ORY France 31,238 5.3 825 1.2
61 (60) Bogota El Dorado Int'l BOG Colombia 31,042 3.6 817 14.3
62 (62) Jeddah* King Abdulaziz Int'l JED Saudi Arabia 31,000 6.7 907 14.6
63 (57) Philadelphia International PHL USA 30,155 -4.1 819 -2.5
64 (71) New York LaGuardia LGA USA 29,800 14.2 833 -3.9
65 (70) Jeju International CJU South Korea 29,707 13.2 463 -13.4
66 (65) Istanbul Sabiha Gokcen Int'l SAW Turkey 29,646 4.8 745 -2.2
67 (67) Fort Lauderdale Hollywood Int'l FLL USA 29,205 8.4 853 10.9
68 (68) Copenhagen Kastrup CPH Denmark 29,043 9.1 767 0.8
69 (59) Moscow Domodedovo Int'l DME Russia 28,500 -6.6 653 7.5
70 (72) Dublin International DUB Ireland 27,900 11.0 735 4.0
71 (69) Zurich Zurich ZRH Switzerland 27,666 5.3 758 5.4
72 (75) Palma de Mallorca Palma de Mallorca PMI Spain 26,254 10.6 771 11.8
73 (73) Oslo Gardermoen OSL Norway 25,788 4.5 723 2.9
74 (79) Manchester International MAN UK 25,614 10.4 717 14.1
75 (78) Osaka Kansai Int'l KIX Japan 25,232 8.7 680 4.2
76 (74) Baltimore Washington Int'l BWI USA 25,123 5.5 836 4.0
77 (80) Seoul Gimpo International GMP South Korea 25,043 8.1 426 -5.9
78 (81) Stockholm Arlanda ARN Sweden 24,702 7.0 735 9.6
79 (77) Abu Dhabi International AUH UAE 24,482 5.1 586 -3.8
80 (85) London Stansted STN UK 24,317 7.8 603 8.0
81 (84) Riyadh* King Khalid Int'l RUH Saudi Arabia 24,000 5.7 679 14.8
82 (82) Washington Reagan National DCA USA 23,595 2.4 688 -3.2
83 (86) Dusseldorf International DUS Germany 23,522 4.6 735 11.4
84 (83) Vienna Vienna VIE Austria 23,352 2.5 698 5.3
85 (89) Salt Lake City International SLC USA 23,043 4.3 603 6.3
86 (90) Xiamen Gaoqi International XMN China 22,738 4.2 793 13.8
87 (87) Brisbane Brisbane BNE Australia 22,690 1.3 567 3.2
88 (88) Chicago Midway International MDW USA 22,678 2.1 738 2.6
89 (97) Lisbon Lisbon LIS Portugal 22,400 11.7 616 15.9
90 (102) Nanjing Lukou Int'l NKG China 22,358 16.7 760 27.4
91 (95) Vancouver International YVR Canada 22,289 9.7 597 11.3
92 (110) Bengaluru Kempegowda Int'l BLR India 22,188 22.5 671 6.8
93 (91) Washington Dulles Int'l IAD USA 21,969 1.5 602 4.9
94 (76) Brussels National BRU Belgium 21,818 -7.0 675 6.3
95 (93) Fukuoka* International FUK Japan 21,750 4.4 607 3.0
96 (100) Cancun International CUN Mexico 21,416 9.3 490 9.4
97 (94) Sapporo New Chitose CTS Japan 21,312 4.2 588 2.8
98 (105) Changsha Huanghua Int'l CSX China 21,297 13.8 628 14.5
99 (92) Berlin Tegel TXL Germany 21,254 1.2 611 5.3
100 (103) Wuhan Tianhe International WUH China 20,772 9.7 648 20.9
Top 100 airports: Preliminary passenger ranking 2016 (51-100)
Notes: *Flight Airline Business estimates used where traffic figures unavailable; Source: FlightGlobal research based on preliminary traffic figures published by airports, which are in many cases reported on a Terminal Passenger basis and which excludes a small portion of transit passengers; airline capacity shares based on FlightGlobal schedules data for May 2017
Network PlaNNiNg 2017
12 | FlightGlobal FlightGlobal | 13
Network PlaNNiNg 2017
flightglobal.com/airlines
AIRPORTS TRAFFIC SNAPSHOT
28 | Flight Airline Business | May 2017
Top 10 airports passenger traffic
Atlanta HartsfieldInternational
104m
1Beijing Captital
94m
2 DubaiInternational
84m
3 Los AngelesInternational
81m
4 Tokyo HanedaInternational
80m
5 Chicago O’HareInternational
78m
6
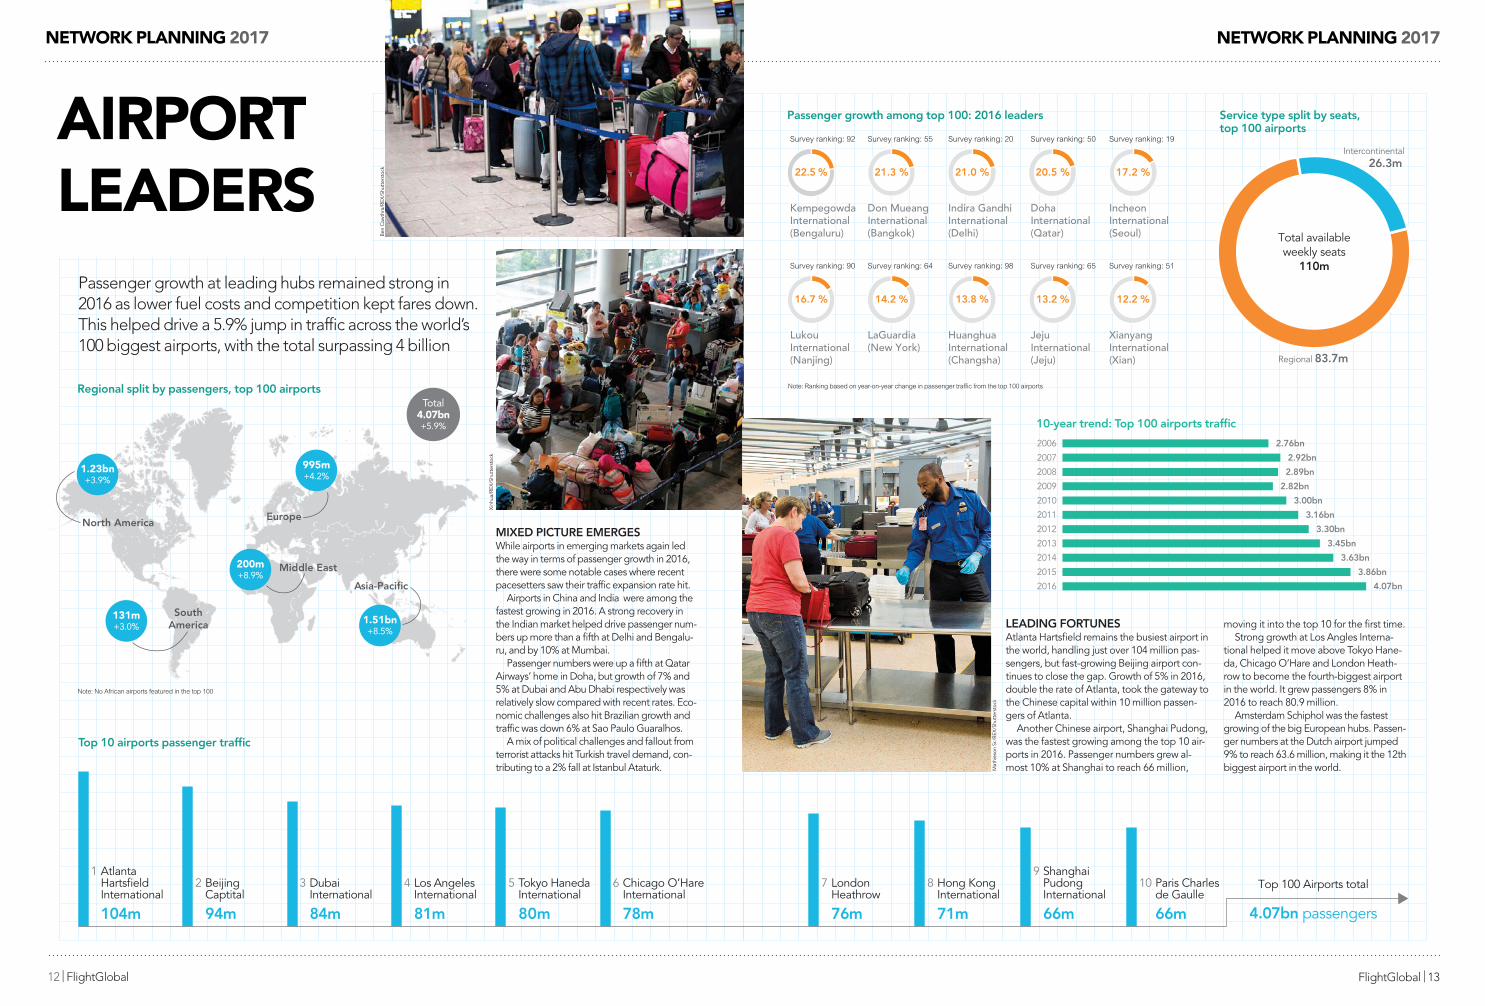
Passenger growth at leading hubs remained strong in 2016 as lower fuel costs and competition kept fares down. This helped drive a 5.9% jump in traffic across the world’s 100 biggest airports, with the total surpassing 4 billion
Getting busier
MIXED PICTURE EMERGESWhile airports in emerging markets again led the way in terms of passenger growth in 2016, there were some notable cases where recent pacesetters saw their traffic expansion rate hit.
Airports in China and India were among the fastest growing in 2016. A strong recovery in the Indian market helped drive passenger num-bers up more than a fifth at Delhi and Bengalu-ru, and by 10% at Mumbai.
Passenger numbers were up a fifth at Qatar Airways’ home in Doha, but growth of 7% and 5% at Dubai and Abu Dhabi respectively was relatively slow compared with recent rates. Eco-nomic challenges also hit Brazilian growth and traffic was down 6% at Sao Paulo Guaralhos.
A mix of political challenges and fallout from terrorist attacks hit Turkish travel demand, con-tributing to a 2% fall at Istanbul Ataturk.
Ben
Caw
thra
/REX
/Shu
tter
stoc
k
Europe
Middle East
Asia-Pacific
North America
SouthAmerica
1.23bn+3.9%
200m+8.9%
131m+3.0%
1.51bn+8.5%
995m+4.2%
Total4.07bn+5.9%
Regional split by passengers, top 100 airports
Note: No African airports featured in the top 100
Xin
hua/
REX
/Shu
tter
stoc
k
flightglobal.com/airlines May 2017 | Flight Airline Business | 29
Top 100 Airports total
4.07bn passengers
LondonHeathrow
76m
7 Hong KongInternational
71m
8Shanghai PudongInternational
66m
9 Paris Charlesde Gaulle
66m
10
LEADING FORTUNESAtlanta Hartsfield remains the busiest airport in the world, handling just over 104 million pas-sengers, but fast-growing Beijing airport con-tinues to close the gap. Growth of 5% in 2016, double the rate of Atlanta, took the gateway to the Chinese capital within 10 million passen-gers of Atlanta.
Another Chinese airport, Shanghai Pudong, was the fastest growing among the top 10 air-ports in 2016. Passenger numbers grew al-most 10% at Shanghai to reach 66 million,
moving it into the top 10 for the first time.Strong growth at Los Angles Interna-
tional helped it move above Tokyo Hane-da, Chicago O’Hare and London Heath-row to become the fourth-biggest airport in the world. It grew passengers 8% in 2016 to reach 80.9 million.
Amsterdam Schiphol was the fastest growing of the big European hubs. Passen-ger numbers at the Dutch airport jumped 9% to reach 63.6 million, making it the 12th biggest airport in the world.M
athi
eson
Sr./
REX
/Shu
tter
stoc
k
Kempegowda International (Bengaluru)
Indira Gandhi International (Delhi)
Incheon International (Seoul)
Don Mueang International (Bangkok)
Doha International (Qatar)
Note: Ranking based on year-on-year change in passenger traffic from the top 100 airports
Passenger growth among top 100: 2016 leaders
Lukou International (Nanjing)
Huanghua International (Changsha)
Xianyang International (Xian)
LaGuardia (New York)
Jeju International (Jeju)
22.5 % 21.0 % 17.2 %21.3 % 20.5 %
16.7 % 13.8 % 12.2 %14.2 % 13.2 %
Survey ranking: 92
Survey ranking: 90
Survey ranking: 55 Survey ranking: 20 Survey ranking: 50 Survey ranking: 19
Survey ranking: 64 Survey ranking: 98 Survey ranking: 65 Survey ranking: 51
2.76bn
2.92bn
2.89bn
2.82bn
3.00bn
3.16bn
3.30bn
3.45bn
3.63bn
3.86bn
4.07bn2016
2015
2014
2013
2012
2011
2010
2009
2008
2007
2006
10-year trend: Top 100 airports traffic
201m
1.51bn 995m
Intercontinental26.3m
Regional 83.7m
Total available weekly seats
110m
Service type split by seats, top 100 airports airPort
leaders
Network PlaNNiNg 2017
14 | FlightGlobal FlightGlobal | 15
Network PlaNNiNg 2017
susPeNsioNsthe relatively benign operating environment – with solid economic growth supporting increased air travel demand, set against still favourable oil prices – is reflected in the low number of airline collapses or suspensions of service.
But there remain some challenging markets – few more so than Venezuela. Long-running problems repatriating revenues earned in local currency had already prompted many international carriers to scale back or cut altogether their services into Venezuela. Unrest in the country earlier this year and continued political uncertainty have prompted more carriers to pull the plug.
Venezuela’s airlines, meanwhile, have been forced to ground aircraft and cut service due to difficulties in accessing foreign currencies to pay for spare parts and other expenses. then, in august, Venezuela’s oldest airline aeropostal was forced to cease operations as the ongoing crisis in the country expanded to local carriers.
challenges in the region have also created problems for Inselair, which resulted in its aruba-based subsidiary filing for bankruptcy in June. Inselair aruba had been grounded even before it entered bankruptcy administration in June and has remained so, but its curacao-based counterpart continues to operate Fokker 50s connecting four Dutch caribbean territories.
there remains hope that a potential partnership with synergy aerospace, parent to colombia’s avianca, could allow Inselair to operate under the avianca curacao brand. In april, synergy signed a letter of intent with curacao’s government to form a strategic partnership to rescue the troubled caribbean carrier, but the bankruptcy of Inselair’s aruba subsidiary delayed the effort.
In asia, Indian carrier air costa in June had its air operator’s permit suspended by India’s Directorate General of civil aviation following three months of inactivity. the carrier suspended operations on 28 February after hitting financial troubles, and at the time said it was in talks with an investor to receive a cash injection that would allow it to restart operations.
Efforts meanwhile continue to restore the operations of another Indian carrier, air Pegasus. a deal emerged at the start of the year under which Bengaluru-based Flyeasy would acquire a stake in air Pegusus and work began on restarting operations in March. But services are still to resume.
air Pegasus, which suspended operations in July 2016, is now hopeful of restarting operations within a month, as it awaits approval from country’s aviation regulator for its recapitalisation plan.
shyson thomas, air Pegasus’s managing director, says that following the approval, the grounded carrier will look to reapply for an air operator’s permit. Its previous permit was cancelled in october 2016.
thomas adds that air Pegasus has completed the sale of a 30% stake in the company to Flyeasy, itself awaiting regulatory approval to start operations. the deal, valued at $3 million, will contribute to air Pegasus’s recapitalisation plan.
another Indian carrier, atR-operator air carnival, suspended flights earlier this year.
Indian ocean carrier Mega Maldives airlines meanwhile suspended services at the start of May, to undergo a restructuring programme.
the carrier described the suspension as temporary and says it is focusing on its recapitalisation and restructuring. Unconfirmed reports suggest the airline is closing in on a resumption of services.
Elsewhere, turkish regional carrier Borajet – which was acquired by sBK holdings at the turn of the year – suspended operations in april to carry out restructuring with a view to resuming its scheduled operations in 2018.
one of last year’s biggest airline casualties was taiwanese carrier transasia airways, which ceased flights in november. In January, its shareholders voted for its dissolution, and its route rights were reassigned later that month.
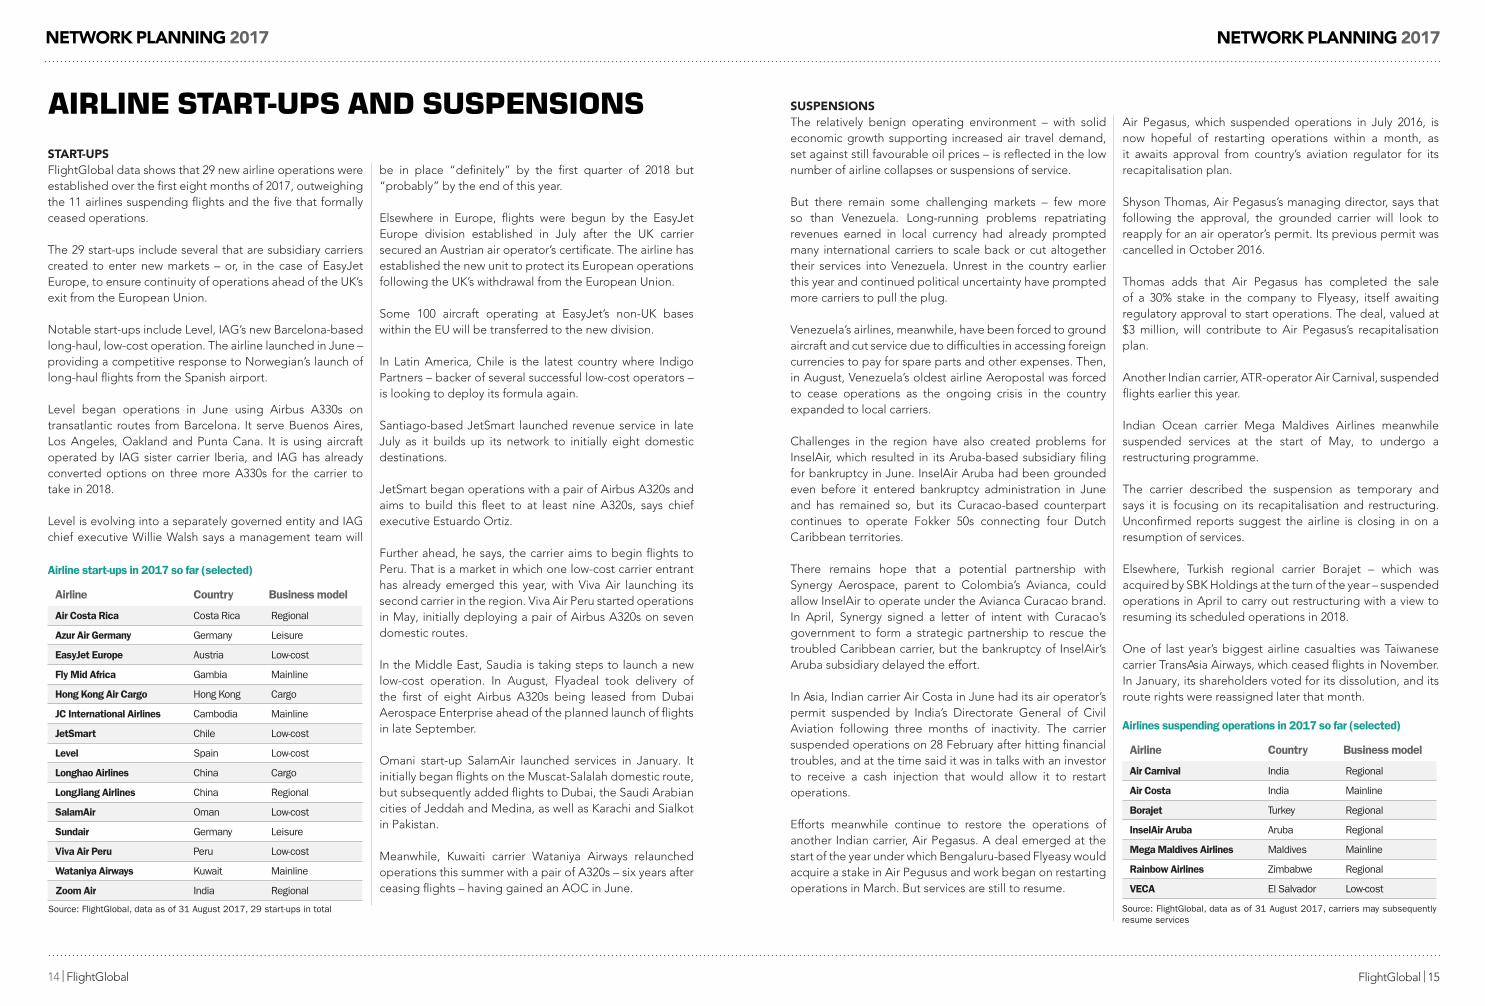
Airline Country Business model
Air Costa Rica Costa Rica Regional
Azur Air Germany Germany Leisure
EasyJet Europe Austria Low-cost
Fly Mid Africa Gambia Mainline
Hong Kong Air Cargo Hong Kong Cargo
JC International Airlines Cambodia Mainline
JetSmart Chile Low-cost
Level Spain Low-cost
Longhao Airlines China Cargo
LongJiang Airlines China Regional
SalamAir Oman Low-cost
Sundair Germany Leisure
Viva Air Peru Peru Low-cost
Wataniya Airways Kuwait Mainline
Zoom Air India Regional
Airline start-ups in 2017 so far (selected)
Source: FlightGlobal, data as of 31 August 2017, 29 start-ups in total
airline start-ups and suspensionsstart-uPsFlightGlobal data shows that 29 new airline operations were established over the first eight months of 2017, outweighing the 11 airlines suspending flights and the five that formally ceased operations.
the 29 start-ups include several that are subsidiary carriers created to enter new markets – or, in the case of EasyJet Europe, to ensure continuity of operations ahead of the UK’s exit from the European Union.
notable start-ups include Level, IaG’s new Barcelona-based long-haul, low-cost operation. the airline launched in June – providing a competitive response to norwegian’s launch of long-haul flights from the spanish airport.
Level began operations in June using airbus a330s on transatlantic routes from Barcelona. It serve Buenos aires, Los angeles, oakland and Punta cana. It is using aircraft operated by IaG sister carrier Iberia, and IaG has already converted options on three more a330s for the carrier to take in 2018.
Level is evolving into a separately governed entity and IaG chief executive willie walsh says a management team will
be in place “definitely” by the first quarter of 2018 but “probably” by the end of this year.
Elsewhere in Europe, flights were begun by the EasyJet Europe division established in July after the UK carrier secured an austrian air operator’s certificate. the airline has established the new unit to protect its European operations following the UK’s withdrawal from the European Union.
some 100 aircraft operating at EasyJet’s non-UK bases within the EU will be transferred to the new division.
In Latin america, chile is the latest country where Indigo Partners – backer of several successful low-cost operators – is looking to deploy its formula again.
santiago-based Jetsmart launched revenue service in late July as it builds up its network to initially eight domestic destinations.
Jetsmart began operations with a pair of airbus a320s and aims to build this fleet to at least nine a320s, says chief executive Estuardo ortiz.
Further ahead, he says, the carrier aims to begin flights to Peru. that is a market in which one low-cost carrier entrant has already emerged this year, with Viva air launching its second carrier in the region. Viva air Peru started operations in May, initially deploying a pair of airbus a320s on seven domestic routes.
In the Middle East, saudia is taking steps to launch a new low-cost operation. In august, Flyadeal took delivery of the first of eight airbus a320s being leased from Dubai aerospace Enterprise ahead of the planned launch of flights in late september.
omani start-up salamair launched services in January. It initially began flights on the Muscat-salalah domestic route, but subsequently added flights to Dubai, the saudi arabian cities of Jeddah and Medina, as well as Karachi and sialkot in Pakistan.
Meanwhile, Kuwaiti carrier wataniya airways relaunched operations this summer with a pair of a320s – six years after ceasing flights – having gained an aoc in June.
Airline Country Business model
Air Carnival India Regional
Air Costa India Mainline
Borajet Turkey Regional
InselAir Aruba Aruba Regional
Mega Maldives Airlines Maldives Mainline
Rainbow Airlines Zimbabwe Regional
VECA El Salvador Low-cost
Airlines suspending operations in 2017 so far (selected)
Source: FlightGlobal, data as of 31 August 2017, carriers may subsequently resume services
Network PlaNNiNg 2017
16 | FlightGlobal FlightGlobal | 17
Network PlaNNiNg 2017
flightglobal.com/airlines
ALLIANCES SNAPSHOT
26 | Flight Airline Business | September 2017
Better together?
Adria Airways
Aegean
Air Canada
Air China
Air India
Air New Zealand
ANA
Asiana Airlines
Austrian
Avianca
Avianca El Salvador
Brussels Airlines
Copa Airlines
Croatia Airlines
Egyptair
Ethiopian Airlines
EVA Air
LOTLufthansa
SAS
Shenzhen Airlines
Singapore Airlines
South African Airways
Swiss
TAP
Thai Airways
Turkish AirlinesUnited Airlines
Air Berlin
American Airlines
British Airways
Cathay Pacific
Finnair
Iberia
Japan Airlines
LATAM Brazil
LATAM Chile
Malaysia Airlines
Qantas
Qatar Airways
Royal Jordanian
S7 Airlines
SriLankan Airlines
Aeroflot
Aerolineas Argentinas
Aeromexico
Air Europa
Air France
AlitaliaChina Airlines
China Eastern
China Southern
Czech Airlines
Delta Air Lines
Garuda Indonesia
Kenya Airways
KLM
Korean Air
Middle East Airlines
Saudia
Tarom Vietnam Airlines
Xiamen Airlines
Star
Alli
ance
Cre
dit
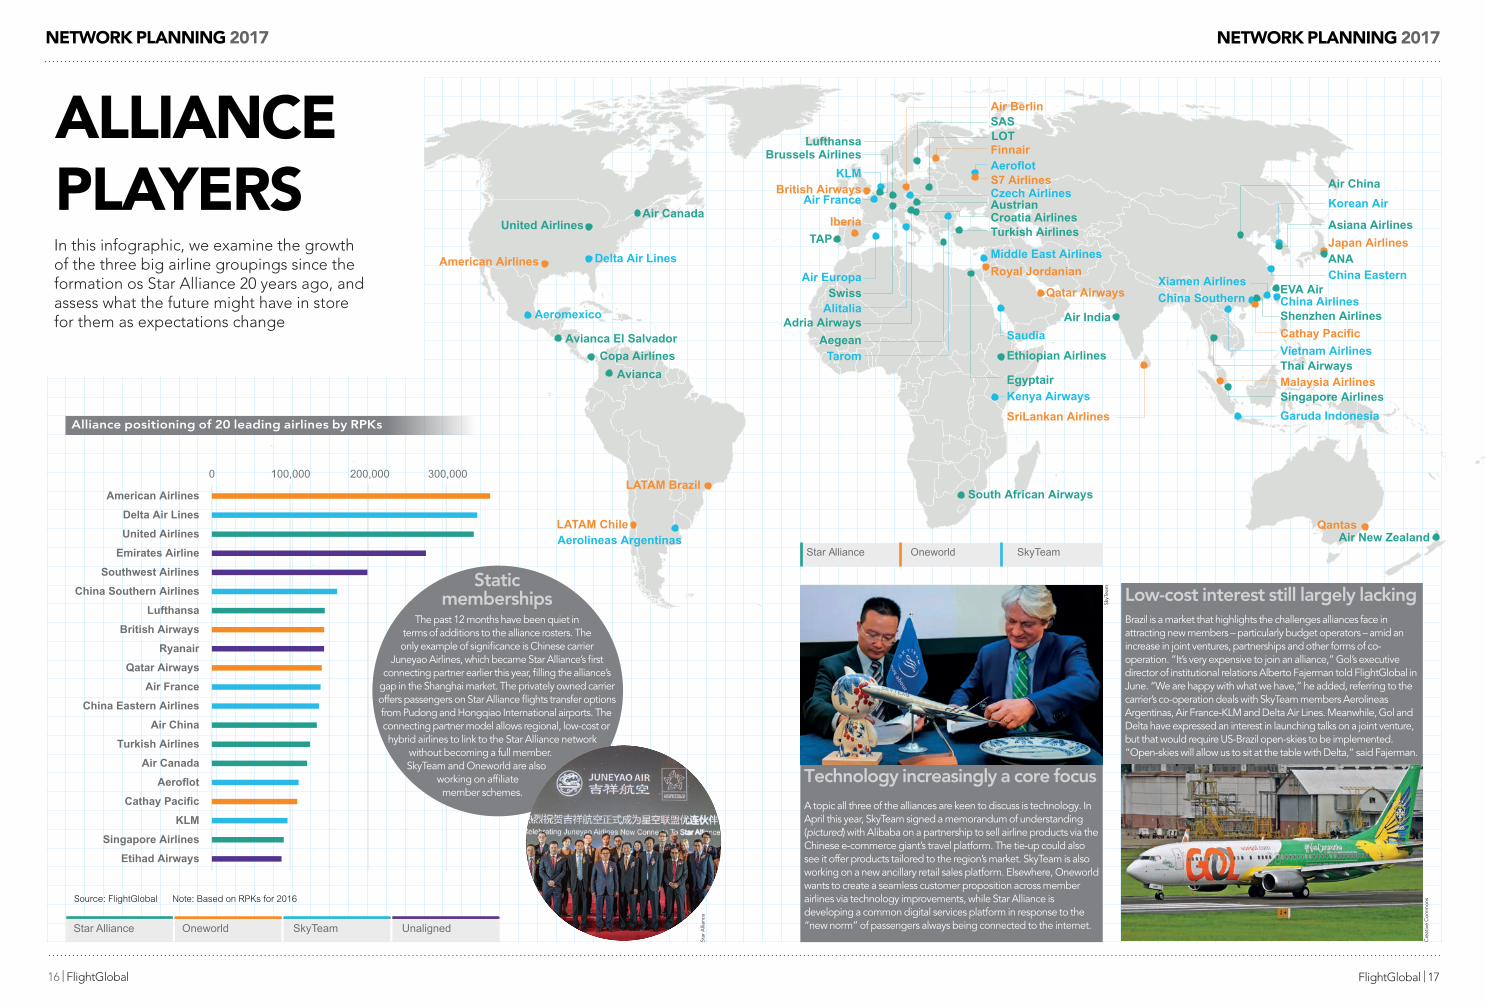
Alliance positioning of 20 leading airlines by RPKs
In this infographic and across the next few pages, we examine the growth of the three big airline groupings since the formation of Star Alliance 20 years ago, and assess what the future might have in store for them as expectations change
Etihad Airways
Singapore Airlines
KLM
Cathay Pacific
Aeroflot
Air Canada
Turkish Airlines
Air China
China Eastern Airlines
Air France
Qatar Airways
Ryanair
British Airways
Lufthansa
China Southern Airlines
Southwest Airlines
Emirates Airline
United Airlines
Delta Air Lines
American Airlines
0 100,000 200,000 300,000
Revenue passenger kilometres
Note: Based on RPKs for 2016Source: FlightGlobal
Star Alliance SkyTeam UnalignedOneworld
Static memberships
The past 12 months have been quiet in terms of additions to the alliance rosters. The only example of significance is Chinese carrier
Juneyao Airlines, which became Star Alliance’s first connecting partner earlier this year, filling the alliance’s
gap in the Shanghai market. The privately owned carrier offers passengers on Star Alliance flights transfer options from Pudong and Hongqiao International airports. The connecting partner model allows regional, low-cost or hybrid airlines to link to the Star Alliance network
without becoming a full member. SkyTeam and Oneworld are also
working on affiliate member schemes.
ABU_180817_026-027.indd 26 11/08/2017 12:32
flightglobal.com/airlines September 2017 | Flight Airline Business | 27
Adria Airways
Aegean
Air Canada
Air China
Air India
Air New Zealand
ANA
Asiana Airlines
Austrian
Avianca
Avianca El Salvador
Brussels Airlines
Copa Airlines
Croatia Airlines
Egyptair
Ethiopian Airlines
EVA Air
LOTLufthansa
SAS
Shenzhen Airlines
Singapore Airlines
South African Airways
Swiss
TAP
Thai Airways
Turkish AirlinesUnited Airlines
Air Berlin
American Airlines
British Airways
Cathay Pacific
Finnair
Iberia
Japan Airlines
LATAM Brazil
LATAM Chile
Malaysia Airlines
Qantas
Qatar Airways
Royal Jordanian
S7 Airlines
SriLankan Airlines
Aeroflot
Aerolineas Argentinas
Aeromexico
Air Europa
Air France
AlitaliaChina Airlines
China Eastern
China Southern
Czech Airlines
Delta Air Lines
Garuda Indonesia
Kenya Airways
KLM
Korean Air
Middle East Airlines
Saudia
Tarom Vietnam Airlines
Xiamen Airlines
Brazil is a market that highlights the challenges alliances face in attracting new members – particularly budget operators – amid an increase in joint ventures, partnerships and other forms of co-operation. “It’s very expensive to join an alliance,” Gol’s executive director of institutional relations Alberto Fajerman told FlightGlobal in June. “We are happy with what we have,” he added, referring to the carrier’s co-operation deals with SkyTeam members Aerolineas Argentinas, Air France-KLM and Delta Air Lines. Meanwhile, Gol and Delta have expressed an interest in launching talks on a joint venture, but that would require US-Brazil open-skies to be implemented. “Open-skies will allow us to sit at the table with Delta,” said Fajerman.
Low-cost interest still largely lacking
SkyT
eam
Cre
ativ
e C
omm
ons
A topic all three of the alliances are keen to discuss is technology. In April this year, SkyTeam signed a memorandum of understanding (pictured) with Alibaba on a partnership to sell airline products via the Chinese e-commerce giant’s travel platform. The tie-up could also see it offer products tailored to the region’s market. SkyTeam is also working on a new ancillary retail sales platform. Elsewhere, Oneworld wants to create a seamless customer proposition across member airlines via technology improvements, while Star Alliance is developing a common digital services platform in response to the “new norm” of passengers always being connected to the internet.
Technology increasingly a core focus
Star Alliance SkyTeamOneworld
ABU_180817_026-027.indd 27 11/08/2017 15:08
alliaNce PlayersIn this infographic, we examine the growth of the three big airline groupings since the formation os star alliance 20 years ago, and assess what the future might have in store for them as expectations change
Network PlaNNiNg 2017
18 | FlightGlobal FlightGlobal | 19
Network PlaNNiNg 2017
caPacity sNaPshot – euroPe
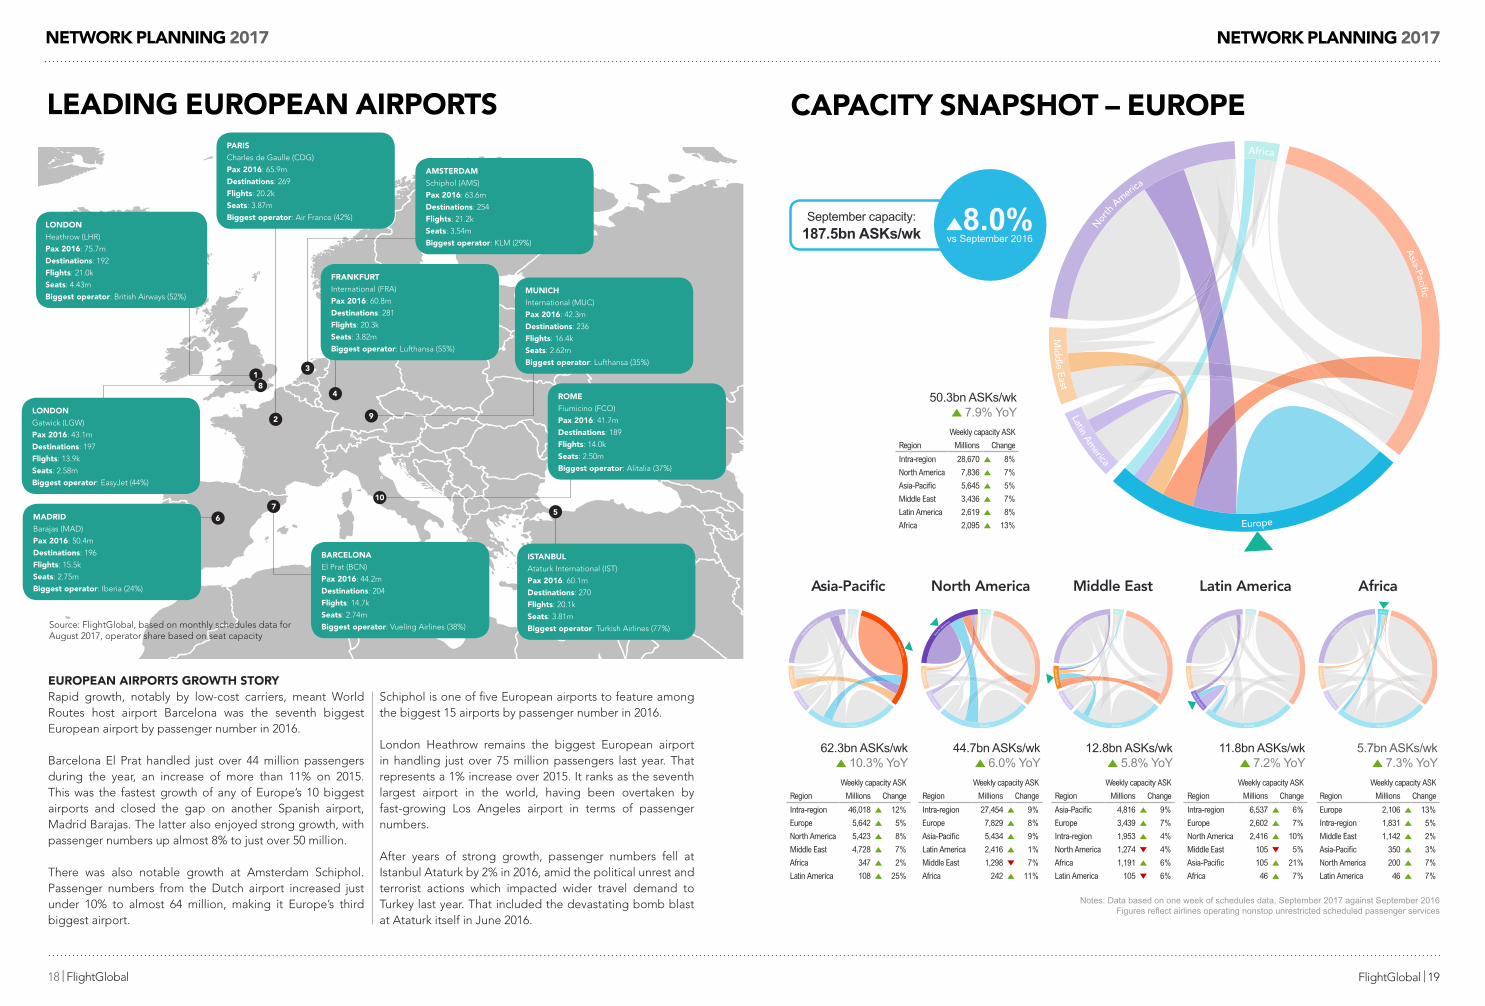
euroPeaN airPorts growth storyRapid growth, notably by low-cost carriers, meant world Routes host airport Barcelona was the seventh biggest European airport by passenger number in 2016.
Barcelona El Prat handled just over 44 million passengers during the year, an increase of more than 11% on 2015. this was the fastest growth of any of Europe’s 10 biggest airports and closed the gap on another spanish airport, Madrid Barajas. the latter also enjoyed strong growth, with passenger numbers up almost 8% to just over 50 million.
there was also notable growth at amsterdam schiphol. Passenger numbers from the Dutch airport increased just under 10% to almost 64 million, making it Europe’s third biggest airport.
schiphol is one of five European airports to feature among the biggest 15 airports by passenger number in 2016.
London heathrow remains the biggest European airport in handling just over 75 million passengers last year. that represents a 1% increase over 2015. It ranks as the seventh largest airport in the world, having been overtaken by fast-growing Los angeles airport in terms of passenger numbers.
after years of strong growth, passenger numbers fell at Istanbul ataturk by 2% in 2016, amid the political unrest and terrorist actions which impacted wider travel demand to turkey last year. that included the devastating bomb blast at ataturk itself in June 2016.
leadiNg euroPeaN airPorts
source: FlightGlobal, based on monthly schedules data foraugust 2017, operator share based on seat capacity
1
2
Parischarles de Gaulle (cDG)
Pax 2016: 65.9m
destinations: 269
flights: 20.2k
seats: 3.87m
biggest operator: air France (42%)
4
fraNkfurtInternational (FRa)
Pax 2016: 60.8m
destinations: 281
flights: 20.3k
seats: 3.82m
biggest operator: Lufthansa (55%)
5
istaNbulataturk International (Ist)
Pax 2016: 60.1m
destinations: 270
flights: 20.1k
seats: 3.81m
biggest operator: turkish airlines (77%)
6madridBarajas (MaD)
Pax 2016: 50.4m
destinations: 196
flights: 15.5k
seats: 2.75m
biggest operator: Iberia (24%)
7
barceloNaEl Prat (Bcn)
Pax 2016: 44.2m
destinations: 204
flights: 14.7k
seats: 2.74m
biggest operator: Vueling airlines (38%)
8
loNdoNheathrow (LhR)
Pax 2016: 75.7m
destinations: 192
flights: 21.0k
seats: 4.43m
biggest operator: British airways (52%)
loNdoNGatwick (LGw)
Pax 2016: 43.1m
destinations: 197
flights: 13.9k
seats: 2.58m
biggest operator: EasyJet (44%)
muNichInternational (MUc)
Pax 2016: 42.3m
destinations: 236
flights: 16.4k
seats: 2.62m
biggest operator: Lufthansa (35%)
9
amsterdamschiphol (aMs)
Pax 2016: 63.6m
destinations: 254
flights: 21.2k
seats: 3.54m
biggest operator: KLM (29%)
3
10
romeFiumicino (Fco)
Pax 2016: 41.7m
destinations: 189
flights: 14.0k
seats: 2.50m
biggest operator: alitalia (37%)
Africa
Asia-Pacific
Europe
Latin America
Middle East
Nor
th A
merica
Asia-Pacific
Weekly capacity ASK
Region Millions Change
Intra-region 46,018 12%
Europe 5,642 5%
North America 5,423 8%
Middle East 4,728 7%
Africa 347 2%
Latin America 108 25%
Weekly capacity ASK
Region Millions Change
Intra-region 27,454 9%
Europe 7,829 8%
Asia-Pacific 5,434 9%
Latin America 2,416 1%
Middle East 1,298 7%
Africa 242 11%
Africa
Asia-Pacific
Europe
Latin America
Middle East
Nor
th A
merica
44.7bn ASKs/wk 6.0% YoY
North America
Focus on: Europe
Weekly capacity ASK
Region Millions Change
Intra-region 28,670 8%
North America 7,836 7%
Asia-Pacific 5,645 5%
Middle East 3,436 7%
Latin America 2,619 8%
Africa 2,095 13%
50.3bn ASKs/wk 7.9% YoY
Africa
Asia-Pacific
Europe
Latin America
Middle East
Nor
th A
merica
5.7bn ASKs/wk 7.3% YoY
Weekly capacity ASK
Region Millions Change
Europe 2,106 13%
Intra-region 1,831 5%
Middle East 1,142 2%
Asia-Pacific 350 3%
North America 200 7%
Latin America 46 7%
Africa
62.3bn ASKs/wk 10.3% YoY
Africa
Asia-Pacific
Europe
Latin America
Middle East
Nor
th A
merica
Weekly capacity ASK
Region Millions Change
Intra-region 6,537 6%
Europe 2,602 7%
North America 2,416 10%
Middle East 105 5%
Asia-Pacific 105 21%
Africa 46 7%
11.8bn ASKs/wk 7.2% YoY
Latin AmericaAfrica
Asia-Pacific
Europe
Latin America
Middle East
Nor
th A
merica
Weekly capacity ASK
Region Millions Change
Asia-Pacific 4,816 9%
Europe 3,439 7%
Intra-region 1,953 4%
North America 1,274 4%
Africa 1,191 6%
Latin America 105 6%
12.8bn ASKs/wk 5.8% YoY
Middle East
Notes: Data based on one week of schedules data, September 2017 against September 2016Figures reflect airlines operating nonstop unrestricted scheduled passenger services
September capacity:
187.5bn ASKs/wk 8.0%vs September 2016
Africa
Asia-Pacific
Europe
Latin America
Middle East
Nor
th A
merica

20 | FlightGlobal
Long known as a world leader in innovation, Seattle is the birthplace of some of the world’s most well-known companies, including Microsoft, Amazon, Starbucks, and Boeing.
The ninth busiest airport in North America, Seattle-Tacoma International Airport connects this vibrant region with over 100 nonstop destinations worldwide.
Dale Chihuly Garden and Glass, Seattle
Seattle Hub of Innovation
Related Documents


