Network Management Lecture 3

Network Management Lecture 3. Network Faults Hardware Software.
Jan 03, 2016
Welcome message from author
This document is posted to help you gain knowledge. Please leave a comment to let me know what you think about it! Share it to your friends and learn new things together.
Transcript

Network Management
Lecture 3
Network Faults
HardwareSoftware

Gathering Information to Identify a problem
The two methods are:
Critical network events are transmitted by a network device when a fault condition occurs.e.g failure of a link, restart of a device. A completely failed device can not send critical network events.
Occasional polling of network devices can help find faults in a timely manner. There is a tradeoff between the bandwidth used for polling versus the notification time.

Fault Management on a network management systemA simple tool can point out the existence of a problem but can not indicate its cause. E.g. ping
A more complex tool can inform you when it detects a problem, by logging network events or by polling; provided the network devices are sophisticated enough to report network events.

Fault Management of a network Management System continued….
An Advance Tool performs quite a bit of fault management but it doesn’t perform the final step: correcting the problem.If the basic steps will not find the fault for us than we have to isolate the issues.Example: A mail not reaching the destination.


Impact of Fault on the Network
A fault management tool must be capable of analyzing how a fault can affect other areas of the data network. Only then could it provide you with a complete fault analysis.
E.g. “LINK FAILURE between Europe Node and United States Node.”

Impact of Fault on the Network
E.g. “LINK FAILURE between Europe Node and United States Node. STOPS DECnet and IBM SNA traffic between Europe and United States.”
E.g. “LINK FAILURE between Europe Node and United States Node. IMPACT ON DECnet and IBM SNA traffic between Europe and United States.”
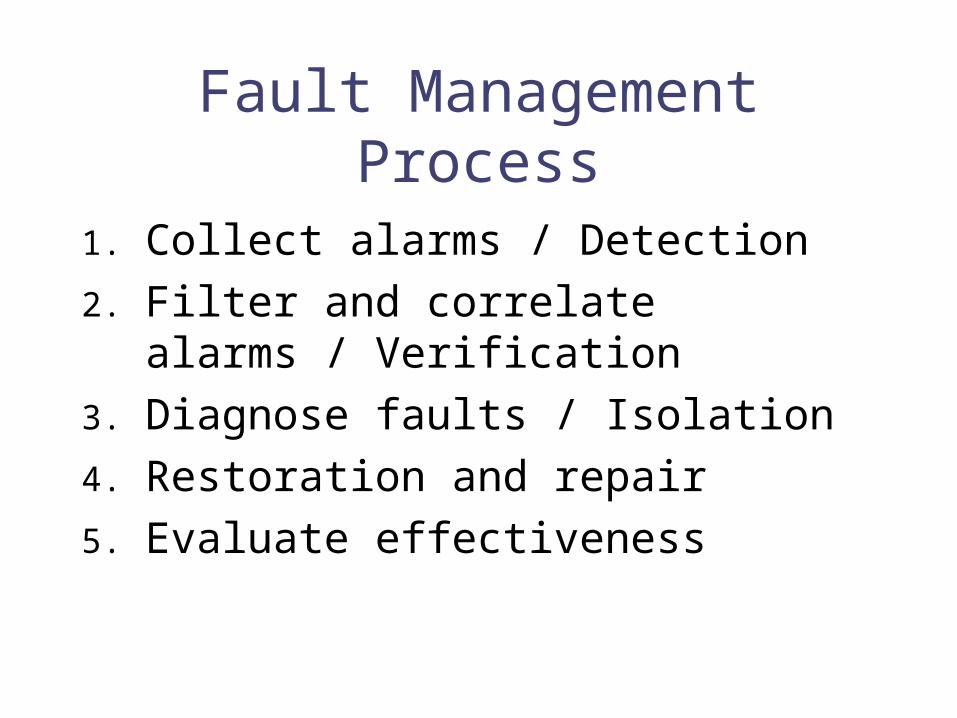
Fault Management Process
1. Collect alarms / Detection
2. Filter and correlate alarms / Verification
3. Diagnose faults / Isolation
4. Restoration and repair
5. Evaluate effectiveness
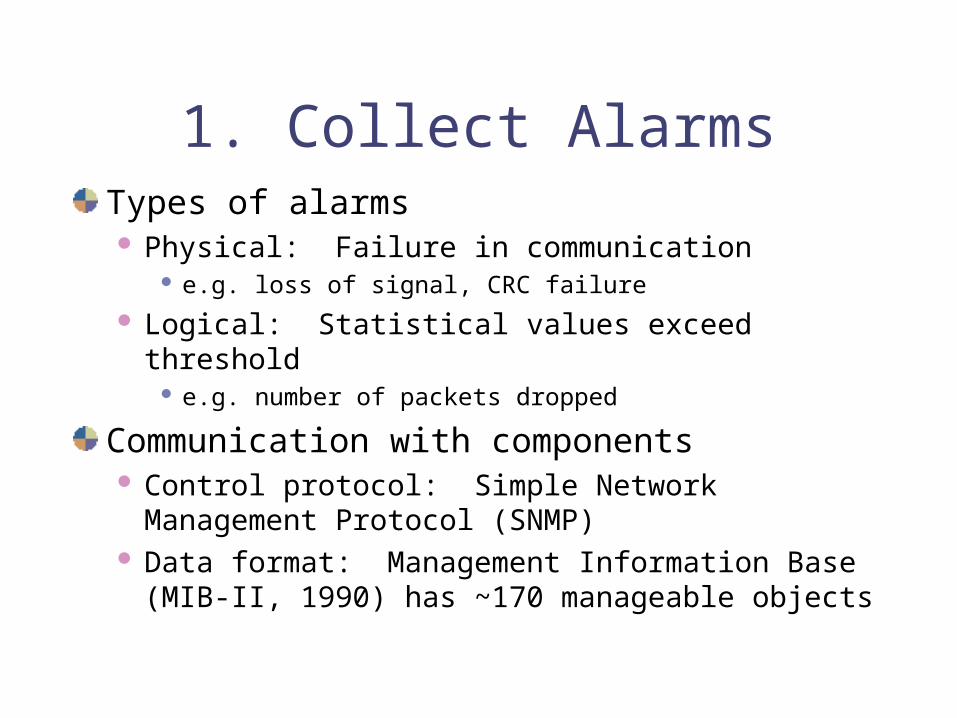
1. Collect AlarmsTypes of alarms Physical: Failure in communication
e.g. loss of signal, CRC failure
Logical: Statistical values exceed threshold e.g. number of packets dropped
Communication with components Control protocol: Simple Network Management
Protocol (SNMP) Data format: Management Information Base (MIB-
II, 1990) has ~170 manageable objects
Fault DetectionCC (Continuity Check)
Heartbeat message sent periodicallySender does not expect acknowledgementReceiver starts timer to expect periodic CC
from senderLoss of n consecutive CCs results in failure
detectionFailures detected include:
Hard and soft failures

2. Filter and Correlate Alarms
FilterEliminate redundant alarmsSuppress noncritical alarms Inhibit low-priority alarms in presence of
high-priority alarms
CorrelateAnalyze and interpret multiple alarms to
assign new meaning (derived alarm)

Fault Verification
Non-intrusive Unicast LoopbackVerify the detected faultSender sends a request to receiver and
expects a responseReceiver will typically be the one from whom CCs
stopVerification is done via the response

3. Diagnose Faults
May require additional tests/diagnostics on circuits or componentsAutomated or manual
Analyze all info from alarms, tests, performance monitoring
Identify smallest system module that needs to be repaired or replaced
4. Restoration and Repair
Restoration: Continue service in presence of fault Switch over to spares Reroute around trouble spot Restore software or data from backup
Repair Replace parts Repair cables Debug software
Retest to verify fault is eliminated

5. Evaluate Effectiveness
Questions to answer :How often do faults occur?How many faults affect service?How long is service interrupted?How long to repair?
Provides assessment of:Performance of fault management systemReliability of equipment

Event Correlation Techniques
• Basic elements• Detection and filtering of events• Correlation of observed events using AI• Localize the source of the problem• Identify the cause of the problem
• Techniques• Rule-based reasoning• Model-based reasoning• Case-based reasoning• Codebook correlation model• State transition graph model• Finite state machine model
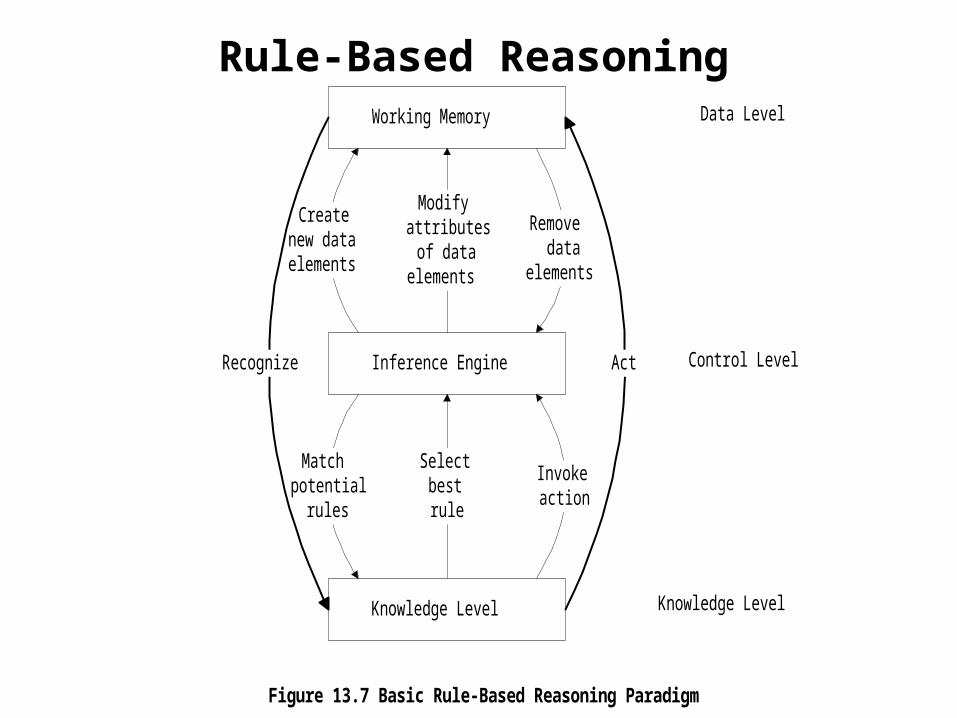
Rule-Based ReasoningWorking Memory
Inference Engine
Modifyattributes
of dataelements
Removedata
elements
Createnew dataelements
Knowledge Level
Selectbestrule
Invokeaction
Matchpotential
rules
ActRecognize
Data Level
Control Level
Knowledge Level
Figure 13.7 Basic Rule-Based Reasoning Paradigm
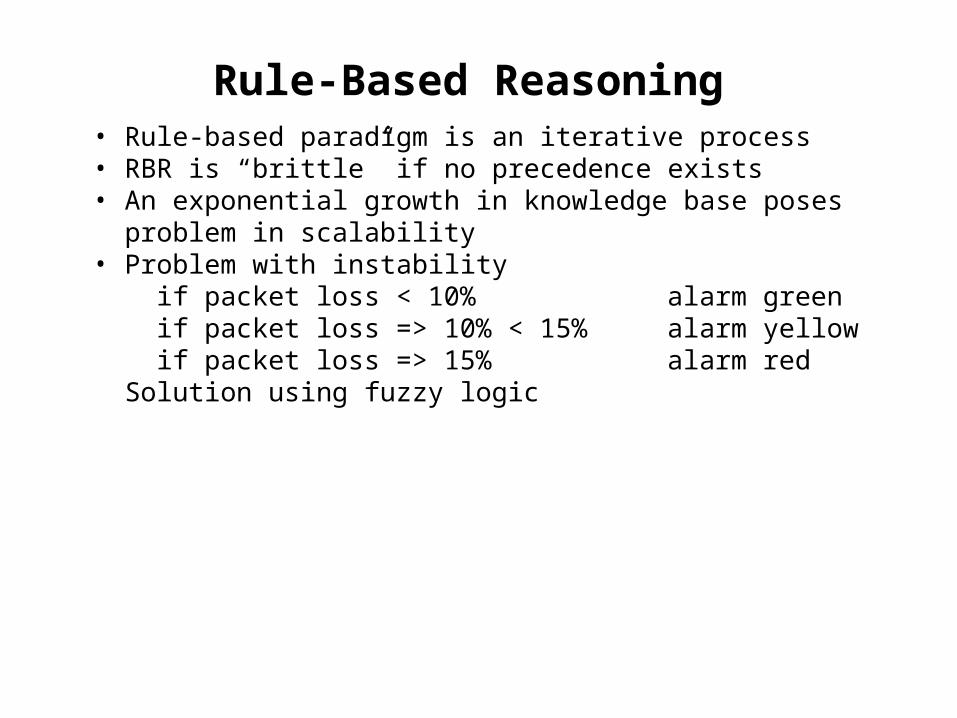
Rule-Based Reasoning• Rule-based paradigm is an iterative process• RBR is “brittle” if no precedence exists• An exponential growth in knowledge base poses problem in scalability• Problem with instability if packet loss < 10% alarm green if packet loss => 10% < 15% alarm yellow if packet loss => 15% alarm red Solution using fuzzy logic
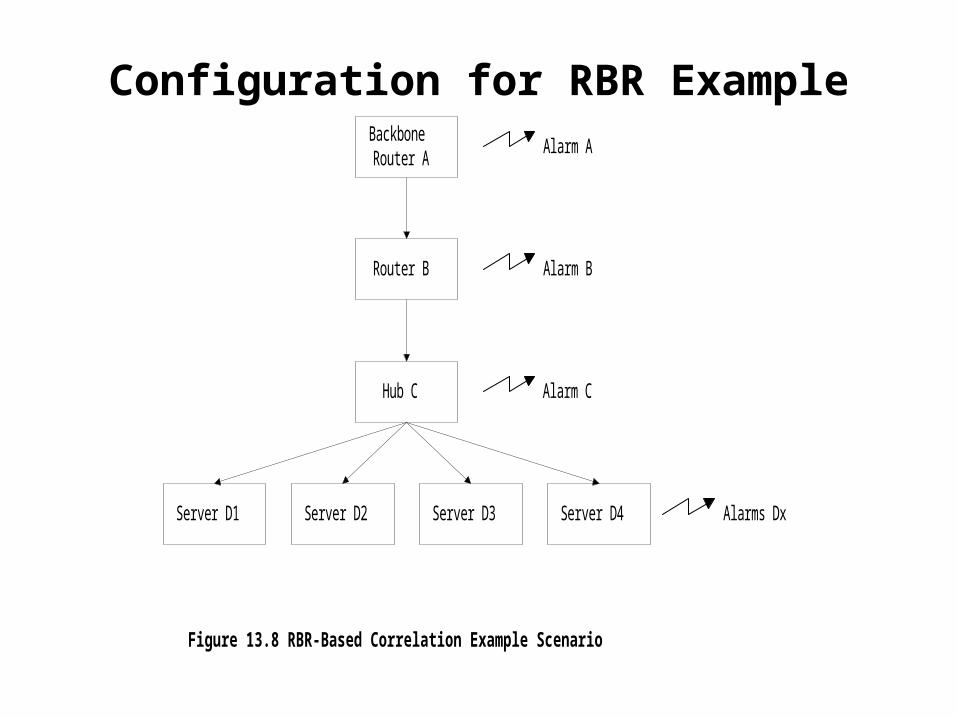
Configuration for RBR ExampleBackboneRouter A
Router B
Hub C
Server D2 Server D3 Server D4Server D1
Alarm B
Alarm C
Alarm A
Alarms Dx
Figure 13.8 RBR-Based Correlation Example Scenario

RBR Example
The correlation rule can be specified as follows:Rule 0: Alarm A : Send rootcause alarm ARule 1 Alarm B If Alarm A present Related to A and ignoreRule 2 Alarm C If Alarm B present Related to B and ignoreRule 3 Alarm Dx if Alarm C present Related to C and ignore
Correlation window: 20 seconds.
Correlation window = 20 seconds
Arrival of Alarm A | Alarm A sentArrival of Alarm B |
(Correlated by rule 1)Arrival of Alarm C |
(Correlated by rule 2)Arrival of Alarms Dx |
(correlated by rule 3)End of correlation window |

Model-Based Reasoning
BackboneNetwork
Router
Hub1 Hub2 Hub3
NMS / Correlator
RouterModel
Hub2Model
Hub3Model
Hub1Model
Physical Network Equivalent Model
Figure 13.11 Model-Based Reasoning Event Correlator
• Object-oriented model• Model is a representation of the component it models• Model has attributes and relations to other models• Relationship between objects reflected in a similar relationship between models
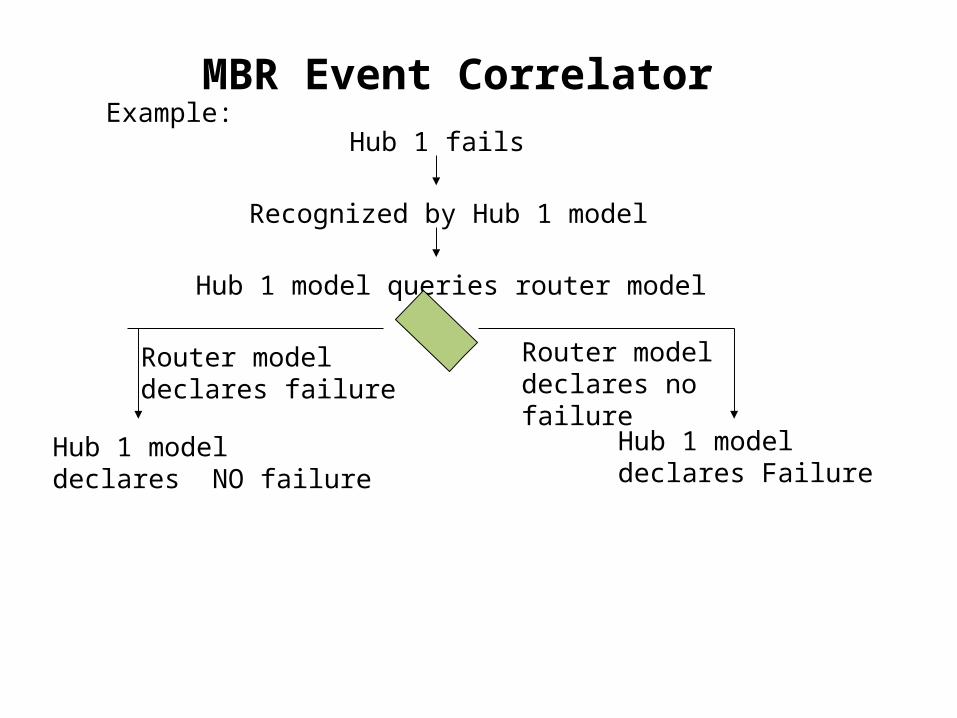
MBR Event CorrelatorExample:
Recognized by Hub 1 model
Hub 1 model queries router model
Hub 1 fails
Router modeldeclares failure
Hub 1 modeldeclares NO failure
Router modeldeclares nofailure
Hub 1 modeldeclares Failure
Case-Based Reasoning
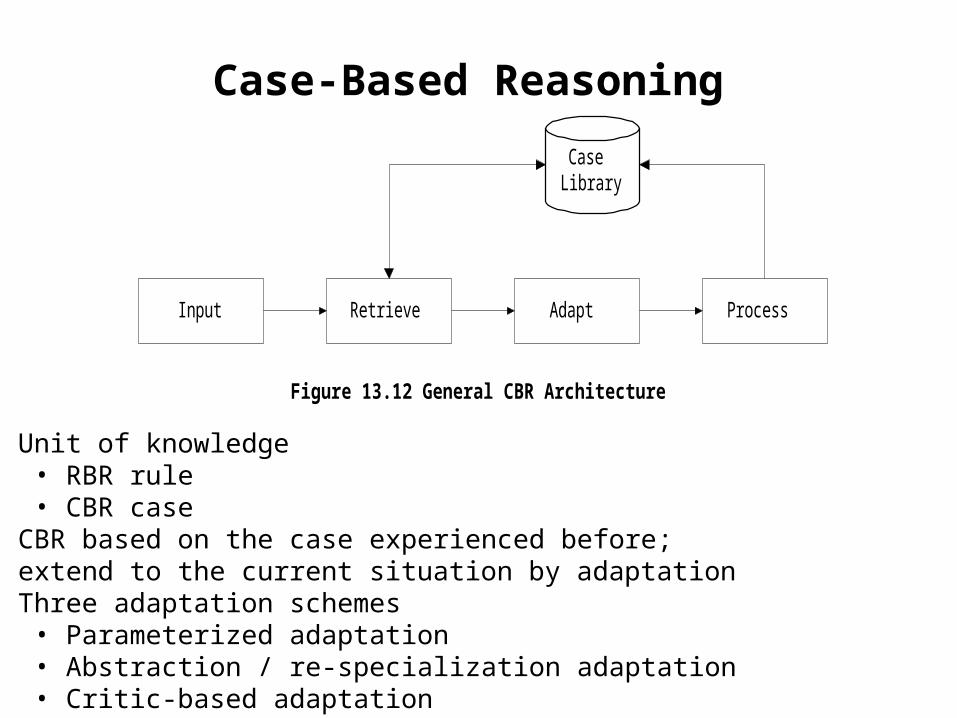
Input Retrieve Adapt Process
CaseLibrary
Figure 13.12 General CBR Architecture
• Unit of knowledge• RBR rule• CBR case
• CBR based on the case experienced before; extend to the current situation by adaptation• Three adaptation schemes
• Parameterized adaptation• Abstraction / re-specialization adaptation• Critic-based adaptation

CBR: Matching Trouble Ticket
Example: File transfer throughput problem
Trouble: file_transfer_throughput=FAdditional data: noneResolution: A=f(F), adjust_network_load=AResolution status: good
Figure 13.13 Matching Trouble Ticket

CBR: Parameterized Adaptation
Trouble: file_transfer_throughput=F'Additional data: noneResolution: A'=f(F'), adjust_network_load=A'Resolution status: good
Figure 13.14 Parameterized Adaptation
• A = f(F)• A’ = f(F’)• Functional relationship f(x) remains the same

CBR: Abstraction / Re-specialization
• Two possible resolutions• A = f(F) Adjust network load level• B = g(F) Adjust bandwidth
• Resolution based on constraint imposed

CBR: Critic-Based Adaptation
Trouble: file_transfer_throughput=FAdditional data: network_load=NResolution: A=f(F,N), adjust_network_load=AResolution status: good
Figure 13.16 Critic-Based Adaptation
• Human expertise introduces a new case• N (network load) is an additional parameter added to the functional relationship
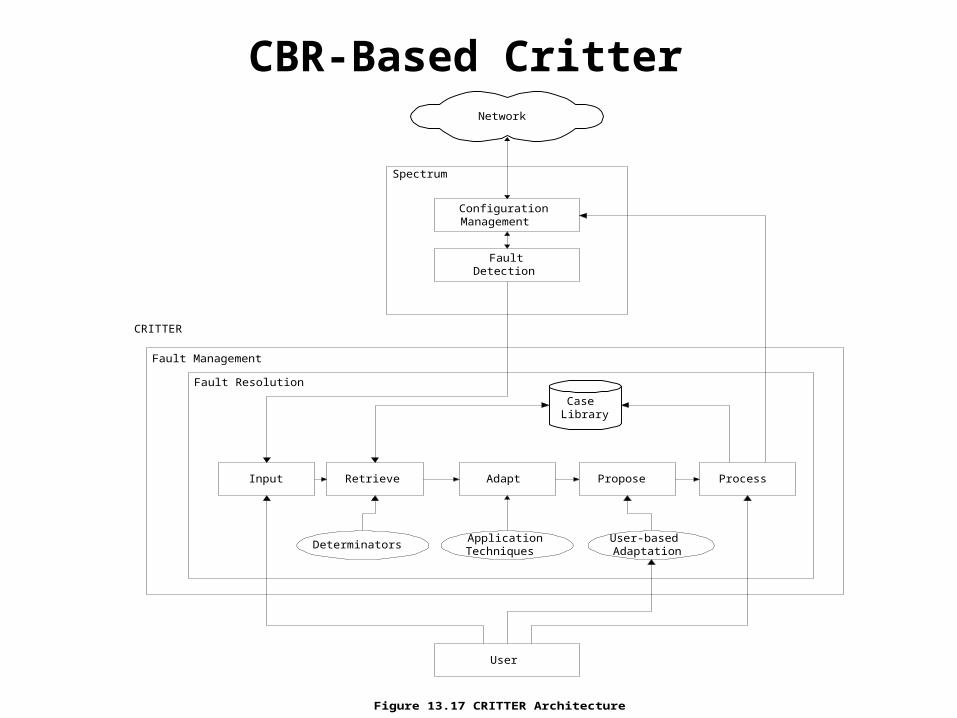
CBR-Based Critter
Fault Management
Fault Resolution
Spectrum
ConfigurationManagement
FaultDetection
Network
Input Retrieve Adapt Process
CaseLibrary
User
DeterminatorsApplicationTechniques
User-basedAdaptation
Propose
Figure 13.17 CRITTER Architecture
CRITTER
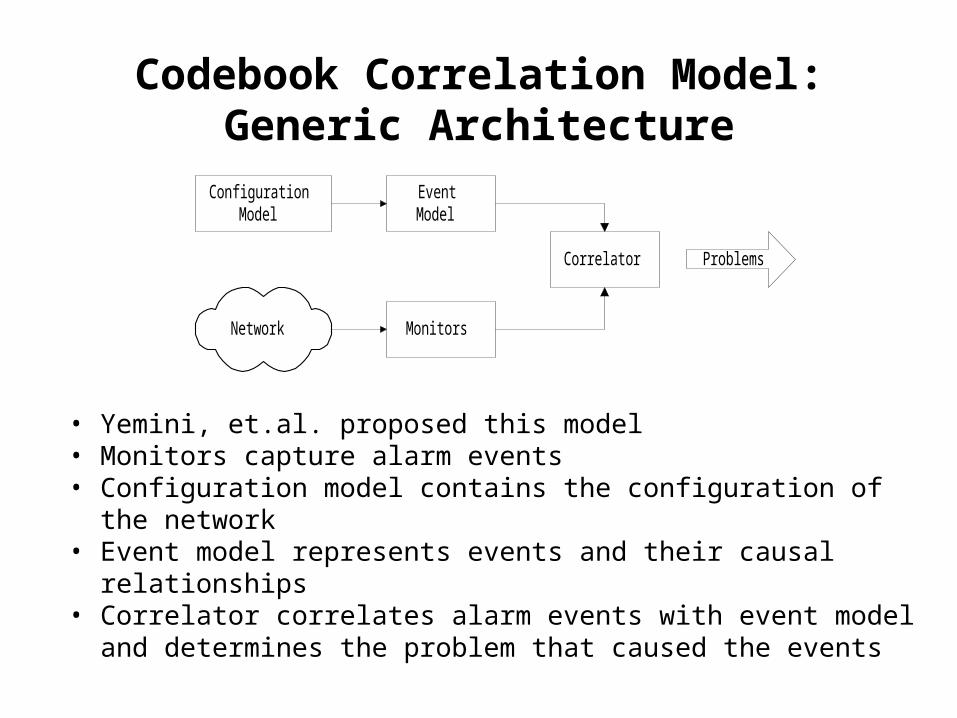
Codebook Correlation Model:Generic Architecture
• Yemini, et.al. proposed this model • Monitors capture alarm events• Configuration model contains the configuration of the network• Event model represents events and their causal relationships• Correlator correlates alarm events with event model and determines the problem that caused the events
Network Monitors
EventModel
ConfigurationModel
Correlator Problems

Codebook Approach
• Correlation algorithms based upon coding approach to even correlation• Problem events viewed as messages generated by a system and encoded in sets of alarms• Correlator decodes the problem messages to identify the problems
Approach:
Two phases: 1. Codebook selection phase: Problems to be monitored identified and the symptoms they generate are associated with the problem. This generates codebook (problem-symptom matrix)2. Correlator compares alarm events with codebook and identifies the problem.
Causality Graph
E1
E5E4
E2 E3
E6 E7
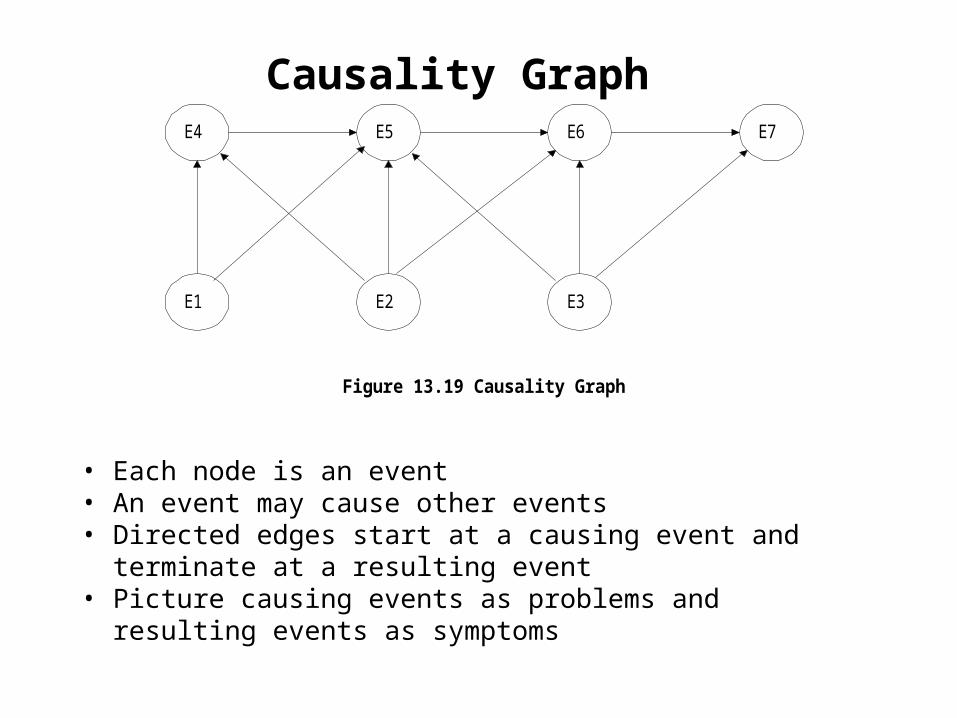
Figure 13.19 Causality Graph
• Each node is an event• An event may cause other events • Directed edges start at a causing event and terminate at a resulting event• Picture causing events as problems and resulting events as symptoms
Labeled Causality Graph
P1
S2S1
P2 P3
S3 S4
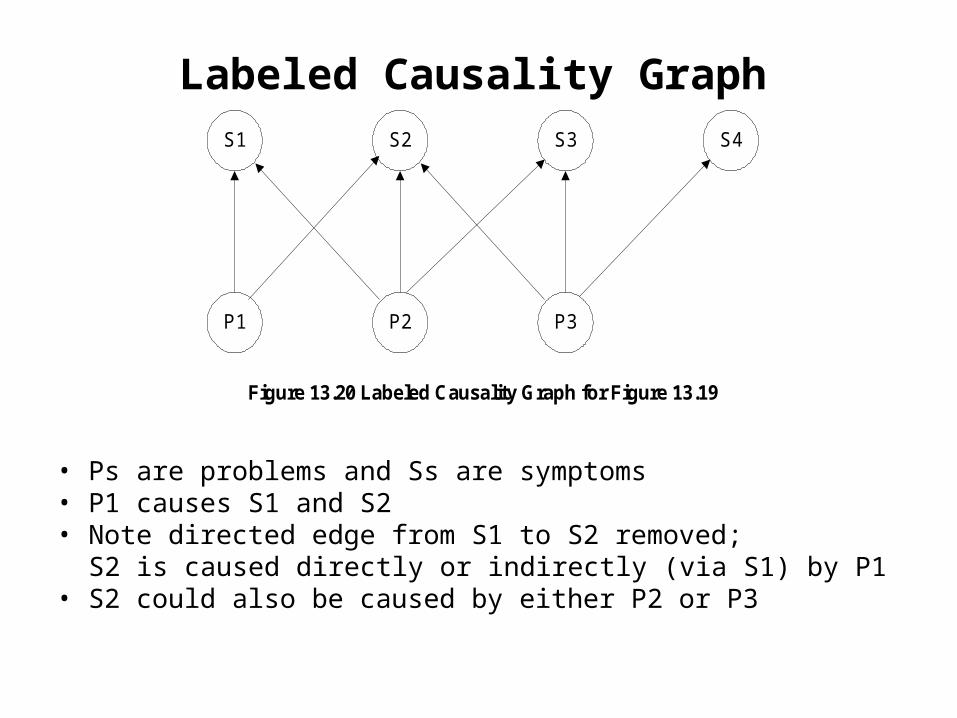
Figure 13.20 Labeled Causality Graph for Figure 13.19
• Ps are problems and Ss are symptoms• P1 causes S1 and S2• Note directed edge from S1 to S2 removed; S2 is caused directly or indirectly (via S1) by P1• S2 could also be caused by either P2 or P3

Codebook
P1 P2 P3S1 1 1 0S2 1 1 1S3 0 1 1S4 0 0 1
• Codebook is problem-symptom matrix• It is derived from causality graph after removing directed edges of propagation of symptoms• Number of symptoms => number of problems• 2 rows are adequate to identify uniquely 3 problems
Correlation Matrix
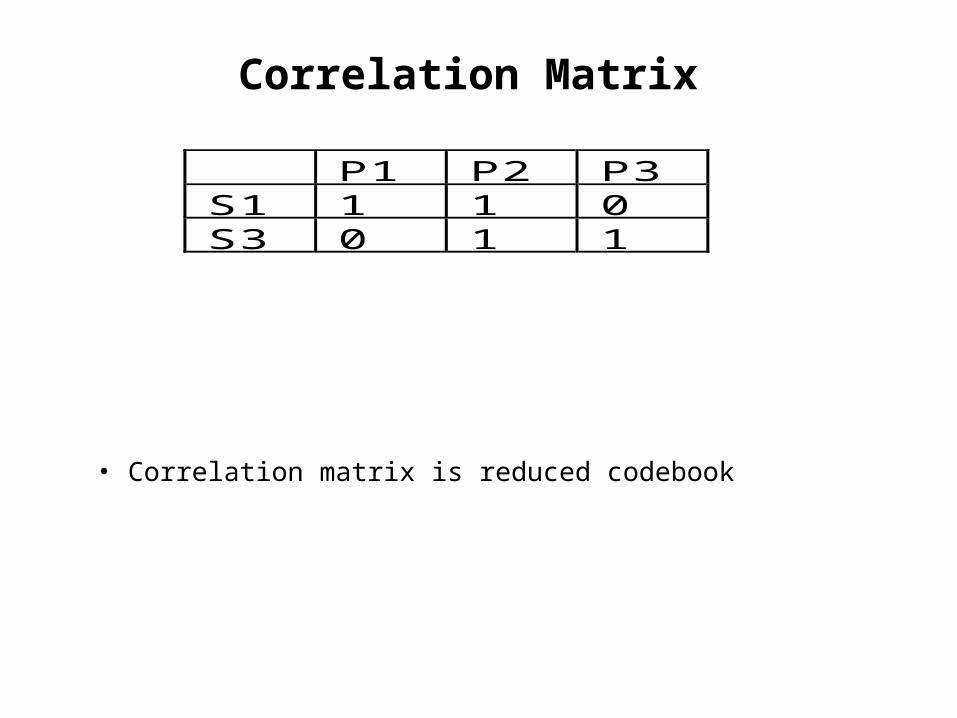
P1 P2 P3S1 1 1 0S3 0 1 1
• Correlation matrix is reduced codebook
Generalized Causality Graph
1
3
7
8
9
115
10
4
2
6
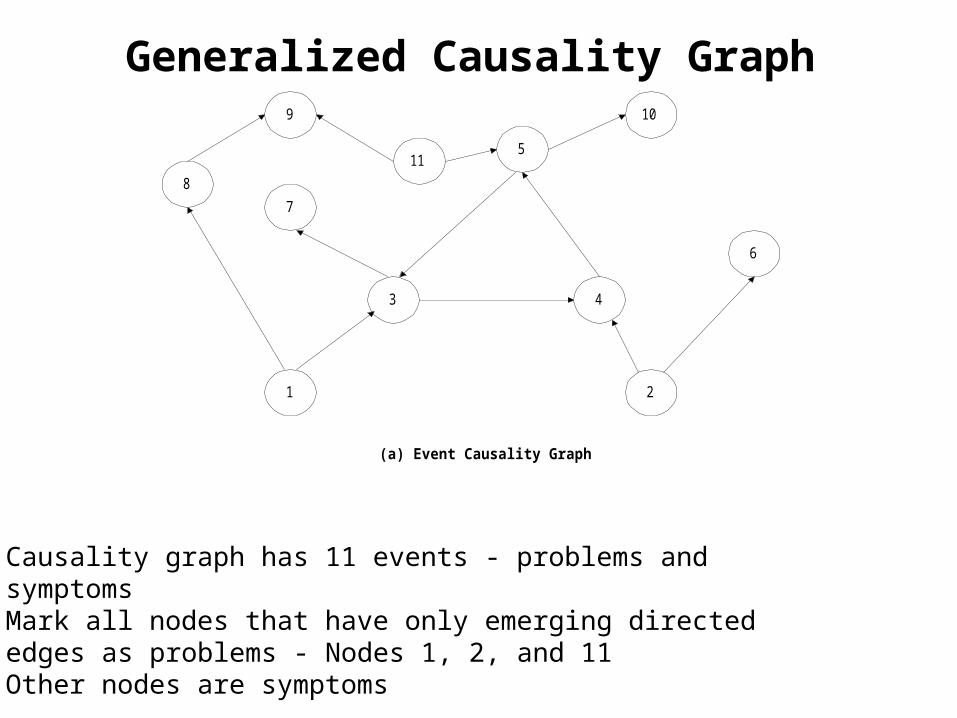
(a) Event Causality Graph
• Causality graph has 11 events - problems and symptoms• Mark all nodes that have only emerging directed edges as problems - Nodes 1, 2, and 11• Other nodes are symptoms
P-S Causality Graph
1
3
7
8
9
115
10
4
2
6
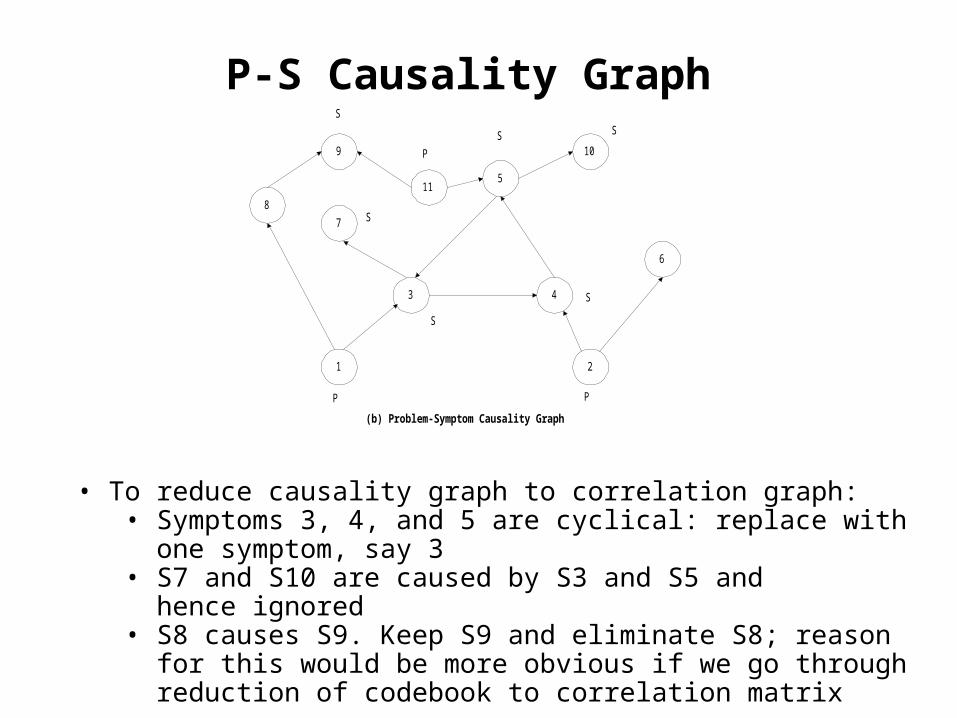
(b) Problem-Symptom Causality Graph
P P
SS
P
S
S
S
S
• To reduce causality graph to correlation graph:• Symptoms 3, 4, and 5 are cyclical: replace with one symptom, say 3• S7 and S10 are caused by S3 and S5 and hence ignored• S8 causes S9. Keep S9 and eliminate S8; reason for this would be more obvious if we go through reduction of codebook to correlation matrix
Correlation Graph and Matrix
1
39
11 2
6
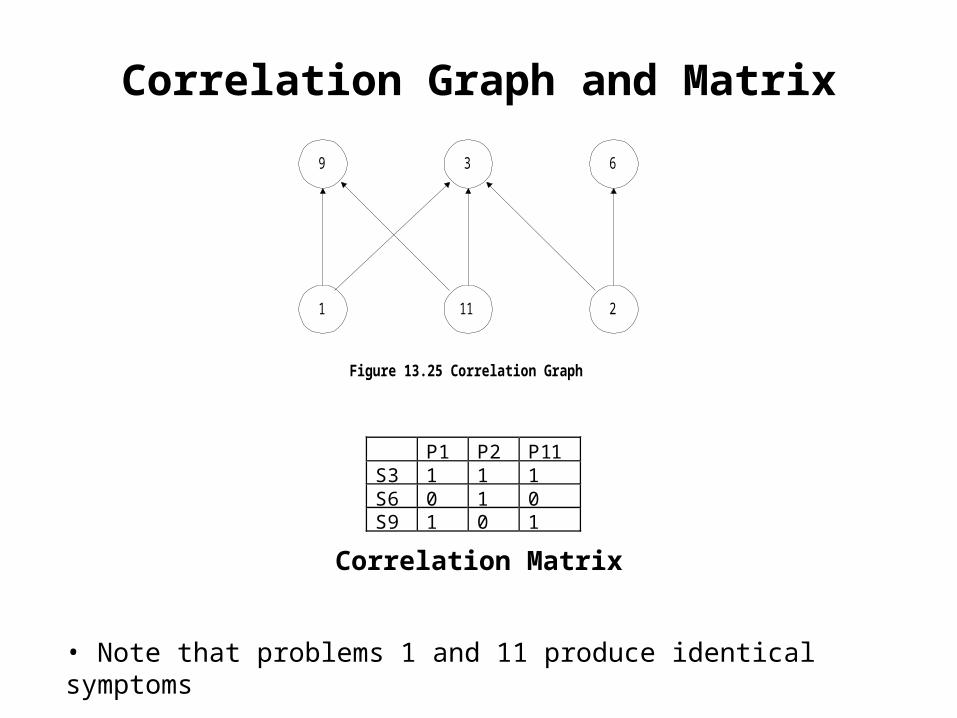
Figure 13.25 Correlation Graph
• Note that problems 1 and 11 produce identical symptoms
P1 P2 P11S3 1 1 1S6 0 1 0S9 1 0 1
Correlation Matrix
State Transition Model
ping node
receive response
pingresponse
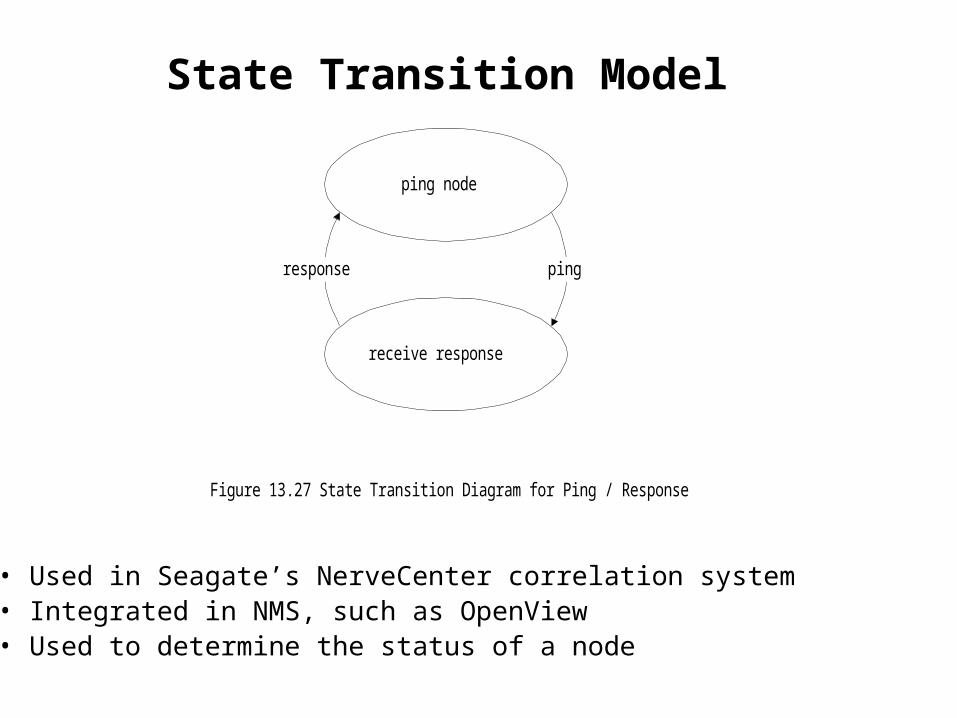
Figure 13.27 State Transition Diagram for Ping / Response
• Used in Seagate’s NerveCenter correlation system• Integrated in NMS, such as OpenView• Used to determine the status of a node
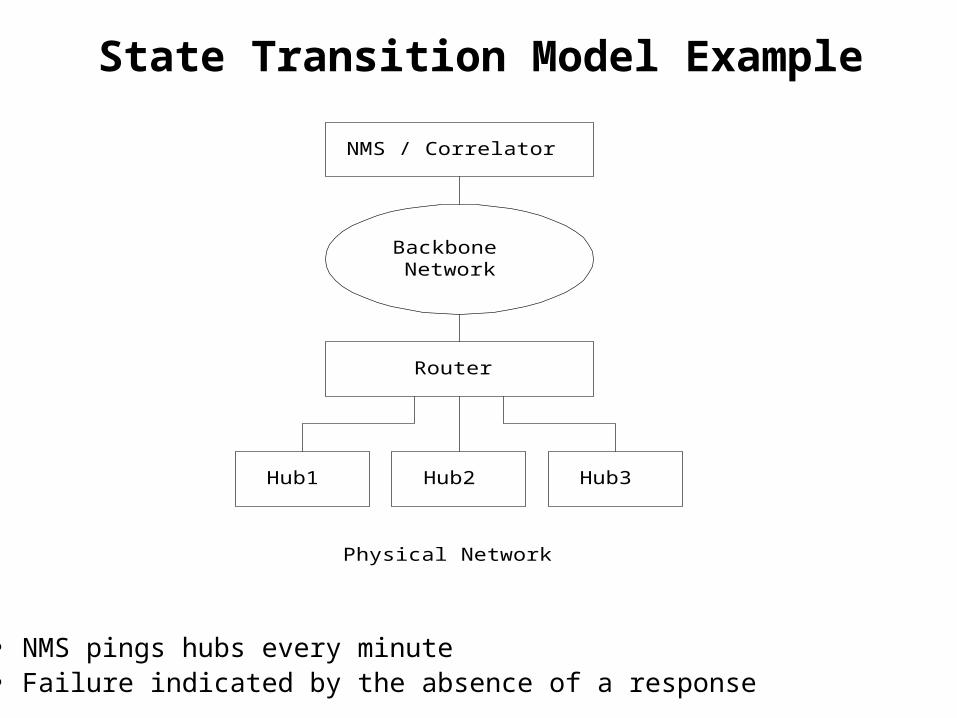
State Transition Model Example
BackboneNetwork
Router
Hub1 Hub2 Hub3
NMS / Correlator
Physical Network
• NMS pings hubs every minute• Failure indicated by the absence of a response

State Transition Graphping hub
receive response
pingresponse
pinged twice(Ground state)
No response
pinged 3 times
No response
receive responsefrom router
Request
Response
ping router
No response
No responsefrom Router,
No action
Response receivedfrom Router
Action: Send Alarm
Figure 13.28 State Transition Graph Example

Finite State Machine Model
Send Request
Receive Response Send Response
Receive Request
Client Server
RequestResponse
RequestMessage
ResponseMessage
CommunicationChannel
ReceiveSend
Figure 13.29 Communicating Finite State Machine
• Finite state machine model is a passive system; state transition graph model is an active system• An observer agent is present in each node and reports abnormalities, such as a Web agent• A central system correlates events reported by the agents• Failure is detected by a node entering an illegal state
Reporting
Goals of data collections and reporting:operational management trend analysis of traffic volumesmonitor levels of delivered servicemonitor usage patterns

Reporting
Balance of cost of data collection and analysis against benefit of resultant data sets
Data collection points affect ability to gather data
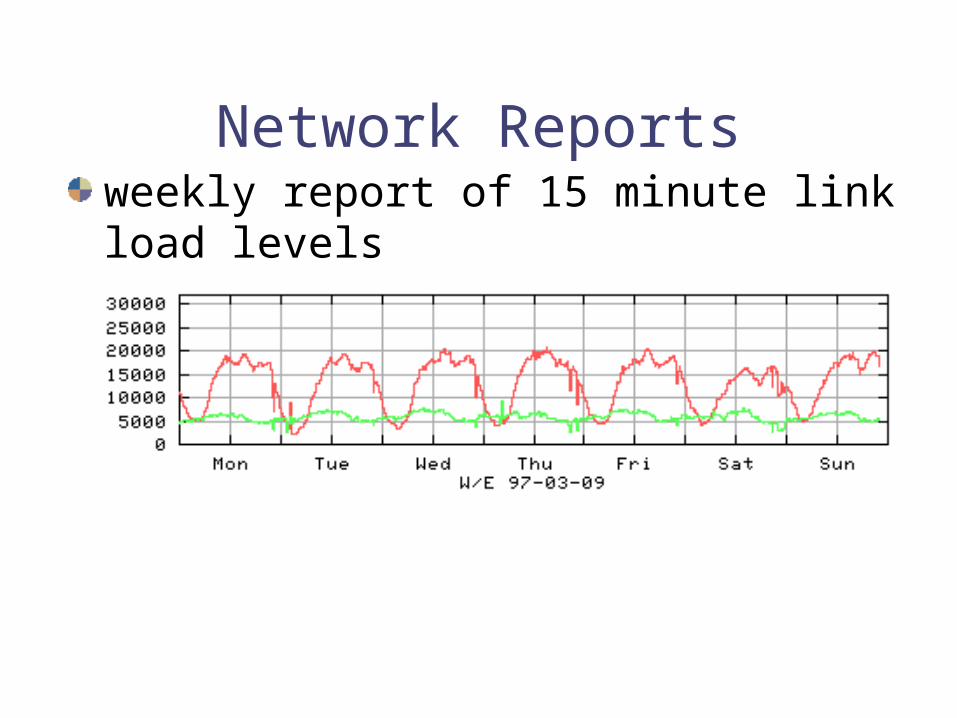
Network Reportsweekly report of 15 minute link load levels

Network Reports
monthly reports
quarterly trend reports and projections
Related Documents