RESEARCH Open Access Network analysis of quantitative proteomics on asthmatic bronchi: effects of inhaled glucocorticoid treatment Serena E O’Neil 1* , Brigita Sitkauskiene 2 , Agne Babusyte 2 , Algirda Krisiukeniene 2 , Kristina Stravinskaite-Bieksiene 2 , Raimundas Sakalauskas 2 , Carina Sihlbom 3 , Linda Ekerljung 1 , Elisabet Carlsohn 3 and Jan Lötvall 1 Abstract Background: Proteomic studies of respiratory disorders have the potential to identify protein biomarkers for diagnosis and disease monitoring. Utilisation of sensitive quantitative proteomic methods creates opportunities to determine individual patient proteomes. The aim of the current study was to determine if quantitative proteomics of bronchial biopsies from asthmatics can distinguish relevant biological functions and whether inhaled glucocorticoid treatment affects these functions. Methods: Endobronchial biopsies were taken from untreated asthmatic patients (n = 12) and healthy controls (n = 3). Asthmatic patients were randomised to double blind treatment with either placebo or budesonide (800 μg daily for 3 months) and new biopsies were obtained. Proteins extracted from the biopsies were digested and analysed using isobaric tags for relative and absolute quantitation combined with a nanoLC-LTQ Orbitrap mass spectrometer. Spectra obtained were used to identify and quantify proteins. Pathways analysis was performed using Ingenuity Pathway Analysis to identify significant biological pathways in asthma and determine how the expression of these pathways was changed by treatment. Results: More than 1800 proteins were identified and quantified in the bronchial biopsies of subjects. The pathway analysis revealed acute phase response signalling, cell-to-cell signalling and tissue development associations with proteins expressed in asthmatics compared to controls. The functions and pathways associated with placebo and budesonide treatment showed distinct differences, including the decreased association with acute phase proteins as a result of budesonide treatment compared to placebo. Conclusions: Proteomic analysis of bronchial biopsy material can be used to identify and quantify proteins using highly sensitive technologies, without the need for pooling of samples from several patients. Distinct pathophysiological features of asthma can be identified using this approach and the expression of these features is changed by inhaled glucocorticoid treatment. Quantitative proteomics may be applied to identify mechanisms of disease that may assist in the accurate and timely diagnosis of asthma. Trial registration: ClinicalTrials.gov registration NCT01378039 Keywords: asthma, quantitative proteomics, bronchial biopsies, glucocorticoid, network analysis, iTRAQ, isobaric tags for relative and absolute quantitation, Ingenuity Pathway Analysis * Correspondence: [email protected] 1 Krefting Research Centre, Department of Internal Medicine, University of Gothenburg, Sweden Full list of author information is available at the end of the article O’Neil et al. Respiratory Research 2011, 12:124 http://respiratory-research.com/content/12/1/124 © 2011 O’Neil et al; licensee BioMed Central Ltd. This is an Open Access article distributed under the terms of the Creative Commons Attribution License (http://creativecommons.org/licenses/by/2.0), which permits unrestricted use, distribution, and reproduction in any medium, provided the original work is properly cited.

Welcome message from author
This document is posted to help you gain knowledge. Please leave a comment to let me know what you think about it! Share it to your friends and learn new things together.
Transcript
RESEARCH Open Access
Network analysis of quantitative proteomics onasthmatic bronchi: effects of inhaledglucocorticoid treatmentSerena E O’Neil1*, Brigita Sitkauskiene2, Agne Babusyte2, Algirda Krisiukeniene2, Kristina Stravinskaite-Bieksiene2,Raimundas Sakalauskas2, Carina Sihlbom3, Linda Ekerljung1, Elisabet Carlsohn3 and Jan Lötvall1
Abstract
Background: Proteomic studies of respiratory disorders have the potential to identify protein biomarkers fordiagnosis and disease monitoring. Utilisation of sensitive quantitative proteomic methods creates opportunities todetermine individual patient proteomes. The aim of the current study was to determine if quantitative proteomicsof bronchial biopsies from asthmatics can distinguish relevant biological functions and whether inhaledglucocorticoid treatment affects these functions.
Methods: Endobronchial biopsies were taken from untreated asthmatic patients (n = 12) and healthy controls (n =3). Asthmatic patients were randomised to double blind treatment with either placebo or budesonide (800 μgdaily for 3 months) and new biopsies were obtained. Proteins extracted from the biopsies were digested andanalysed using isobaric tags for relative and absolute quantitation combined with a nanoLC-LTQ Orbitrap massspectrometer. Spectra obtained were used to identify and quantify proteins. Pathways analysis was performedusing Ingenuity Pathway Analysis to identify significant biological pathways in asthma and determine how theexpression of these pathways was changed by treatment.
Results: More than 1800 proteins were identified and quantified in the bronchial biopsies of subjects. The pathwayanalysis revealed acute phase response signalling, cell-to-cell signalling and tissue development associations withproteins expressed in asthmatics compared to controls. The functions and pathways associated with placebo andbudesonide treatment showed distinct differences, including the decreased association with acute phase proteinsas a result of budesonide treatment compared to placebo.
Conclusions: Proteomic analysis of bronchial biopsy material can be used to identify and quantify proteins usinghighly sensitive technologies, without the need for pooling of samples from several patients. Distinctpathophysiological features of asthma can be identified using this approach and the expression of these features ischanged by inhaled glucocorticoid treatment. Quantitative proteomics may be applied to identify mechanisms ofdisease that may assist in the accurate and timely diagnosis of asthma.
Trial registration: ClinicalTrials.gov registration NCT01378039
Keywords: asthma, quantitative proteomics, bronchial biopsies, glucocorticoid, network analysis, iTRAQ, isobarictags for relative and absolute quantitation, Ingenuity Pathway Analysis
* Correspondence: [email protected] Research Centre, Department of Internal Medicine, University ofGothenburg, SwedenFull list of author information is available at the end of the article
O’Neil et al. Respiratory Research 2011, 12:124http://respiratory-research.com/content/12/1/124
© 2011 O’Neil et al; licensee BioMed Central Ltd. This is an Open Access article distributed under the terms of the Creative CommonsAttribution License (http://creativecommons.org/licenses/by/2.0), which permits unrestricted use, distribution, and reproduction inany medium, provided the original work is properly cited.
BackgroundAsthma is one of the most common chronic diseases inthe world and poses a vast burden on society with lim-ited new treatments being developed [1,2]. Understand-ing asthma has proven to be a challenge, althoughimmunological tools and genomic studies have startedto dissect mechanisms of asthma using animal modelsand cell cultures expressing certain limited characteris-tics of the disease. However, human asthma is nottotally reflected in these systems, therefore the identifi-cation of the mechanisms of human disease and theirinteractions is needed.In humans, the investigation of asthma mechanisms is
commonly explored using clinical examinations andrelatively small patient samples. The gene and proteininvestigation of asthma pathogenesis has progressedfrom local to global studies. Genomic efforts to identifygenes and mechanisms related to asthma pathogenesisin humans have identified multiple areas of interest, asreviewed by Rolph et al [3]. While genomic studies pro-vide a wealth of information, it is their translated pro-ducts, the proteins, which direct cellular functions. Theglobal proteome in asthma has yet to be thoroughlyinvestigated, which may more efficiently identifymechanisms and markers of asthma.To date, the proteomic studies of asthma fall into
three broad categories; tissues, fluids and cells, each pos-ing different analytical challenges. The majority of stu-dies concerning asthma have been conducted onbronchoalveolar lavage fluid (BALF) and lung tissue ofmouse models [4-7], which can only represent certainfeatures of asthma. The few efforts in human asthmahave mainly centred around cell cultures [8], sputum[9], BALF [10], T lymphocytes [11] and more recently,exhaled breath condensate [12]. While these samplespresent aspects of asthma, they do not totally reflect thesite of disease, the bronchi. These proteomics studieshave generated a list of identified proteins using meth-ods like SDS-PAGE, 2-DE, LC-MS/MS, SELDI-TOF andMALDI-TOF [13]. Despite being successively used inother fields [14-18], the use of quantitative proteomics,specifically isobaric tags for relative and absolute quanti-tation (iTRAQ®) technology, has not been applied tounderstanding the complexity of asthma.In the present study, we aimed to analyse the global
proteome of bronchial biopsies taken from asthmaticsand compare it to the proteome of healthy controls. Inaddition, the effects of budesonide treatment on theasthmatic bronchial proteome were also examined. Uti-lising sensitive, high throughput iTRAQ® technology toquantify proteins, the resulting proteome was analysedusing Ingenuity Pathways Analysis (IPA). Distinct pro-teome differences were observed in asthmatics
compared to controls, with increased acute phaseresponse and actin based signalling. The effects of glu-cocorticoid treatment were seen with changes in thefunctions displayed between placebo treated and bude-sonide treated patients, specifically, the reduction of theacute phase association and increased cellular processes.This study is the first to present quantitative proteomicsof small clinically relevant tissue from asthmatic indivi-duals, as well as determining the effects of inhaled glu-cocorticoid treatment on this proteome.
MethodsObjectives1. Determine if quantitative proteomic analysis of indivi-dual biopsies can identify biologically relevant mechan-isms of disease.2. Determine if the proteome of bronchial biopsies are
modified with inhaled glucocorticoid treatment.
Participant Selection and DemographicsThe proteomics study was conducted on 12 non-smok-ing out-patients, aged 40-80 years, with a clinical historyof asthma. Patients had stable, mild to moderate asthma,in accordance with the Global Initiative for Asthmaguidelines [19]. Three non-smoking, non-asthmatic sub-jects were used as controls. Subjects were recruited anddiagnosed by a pulmonologist based on clinical history,lung function measurements and methacholine provoca-tion prior to inclusion in the study.To be included in the study, subjects were required to
have abstained from inhaled and oral glucocorticoids sixweeks prior to the study and long acting bronchodilatorsfour weeks prior. Pregnancy was a criterion for exclu-sion. Control subjects were required to have a baselineFEV1 > 80% of predicted. Subjects without hypoxemiawere included.No subject had exacerbations or respiratory infections
in the four weeks prior to their first visit or any respira-tory disorders other than asthma. Subjects who had ser-ious uncontrolled diseases, had any evidence of aninterfering condition by X-ray or had participated inanother clinical study in the two months prior, wereexcluded from participating in the current study. Sub-jects receiving treatment with cromolyn sodium ornedocromyl, oral beta2 - agonists, long acting anti-choli-nergic or leukotriene modifiers were also excluded.
Ethics StatementThe study was approved by the Regional Bioethics Com-mittee of Kaunas University of Medicine (protocol no.48/2004) with written informed consent received fromall participants. The study is registered with Clinical-Trials.gov (Identifier: NCT01378039).
O’Neil et al. Respiratory Research 2011, 12:124http://respiratory-research.com/content/12/1/124
Page 2 of 15
Study DesignThe study was performed in a double blind, placebocontrolled design. The patients with asthma were rando-mised to three months treatment with either inhaledbudesonide (400 μg twice daily) or placebo twice daily.Salbutamol was allowed as needed.Spirometry was performed and methacholine respon-
siveness measured using a CustovitM pneumotacho-metric spirometer (Custo Med, Germany). Fractionalexhaled nitric oxide (FENO) was measured using theNiox Mino® analyzer (Aerocrine AB, Sweden) at a flowrate of 50 mL/s. An average of three measurements wasused for analysis.Skin prick tests (SPT) were performed using standard
allergens, Dermatophagoides pteronyssinus, Dermatopha-goides farinae, cat epithelia, mixed mould, mixedgrasses, Betulaceae and mixed weeds (Stallergenes,France).
Bronchial BiopsyA bronchoscope (Olympus BF-B3R) and forceps (Olym-pus FB-20C -1, 2.6 channel diameter, length 1050 mm;both from Olympus Corporation, Tokyo, Japan) wereused to take endobronchial biopsies (1-2 mm) from theleft upper, middle and lower lobes, segmental and sub-segmental bronchus. Biopsies were immediately trans-ferred to individual microtubes and snap frozen withliquid nitrogen, before being stored at -80°C. Controlsubjects (healthy non-smokers) had bronchial biopsiestaken on one occasion only. When consenting, patientshad biopsies taken prior to, and following, the treatmentperiod.
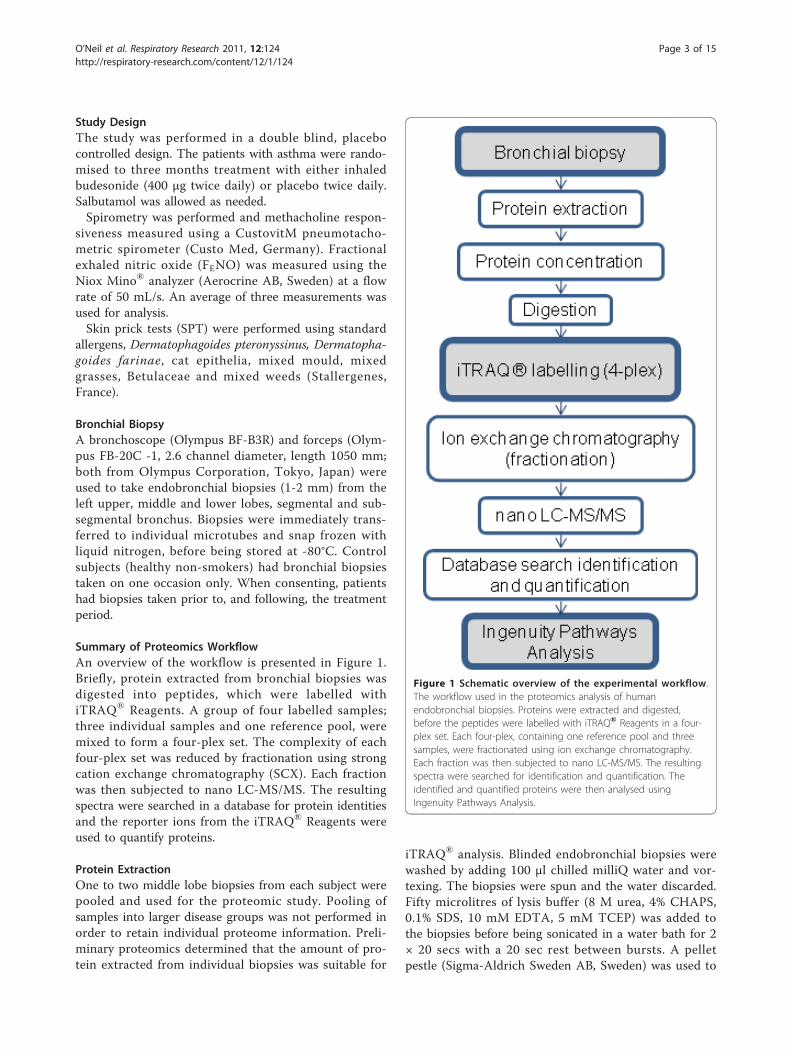
Summary of Proteomics WorkflowAn overview of the workflow is presented in Figure 1.Briefly, protein extracted from bronchial biopsies wasdigested into peptides, which were labelled withiTRAQ® Reagents. A group of four labelled samples;three individual samples and one reference pool, weremixed to form a four-plex set. The complexity of eachfour-plex set was reduced by fractionation using strongcation exchange chromatography (SCX). Each fractionwas then subjected to nano LC-MS/MS. The resultingspectra were searched in a database for protein identitiesand the reporter ions from the iTRAQ® Reagents wereused to quantify proteins.
Protein ExtractionOne to two middle lobe biopsies from each subject werepooled and used for the proteomic study. Pooling ofsamples into larger disease groups was not performed inorder to retain individual proteome information. Preli-minary proteomics determined that the amount of pro-tein extracted from individual biopsies was suitable for
iTRAQ® analysis. Blinded endobronchial biopsies werewashed by adding 100 μl chilled milliQ water and vor-texing. The biopsies were spun and the water discarded.Fifty microlitres of lysis buffer (8 M urea, 4% CHAPS,0.1% SDS, 10 mM EDTA, 5 mM TCEP) was added tothe biopsies before being sonicated in a water bath for 2× 20 secs with a 20 sec rest between bursts. A pelletpestle (Sigma-Aldrich Sweden AB, Sweden) was used to
Figure 1 Schematic overview of the experimental workflow.The workflow used in the proteomics analysis of humanendobronchial biopsies. Proteins were extracted and digested,before the peptides were labelled with iTRAQ® Reagents in a four-plex set. Each four-plex, containing one reference pool and threesamples, were fractionated using ion exchange chromatography.Each fraction was then subjected to nano LC-MS/MS. The resultingspectra were searched for identification and quantification. Theidentified and quantified proteins were then analysed usingIngenuity Pathways Analysis.
O’Neil et al. Respiratory Research 2011, 12:124http://respiratory-research.com/content/12/1/124
Page 3 of 15
homogenise the biopsies, with 50 μl of lysis buffer usedto rinse the pestle. The homogenate was incubated for 1hr at room temperature with shaking, followed by cen-trifugation at 16 000 × g for 10 min. The tube was thenstored at -20°C prior to tryptic digestion. The tube wascentrifuged briefly prior to extraction of the supernatantfor further applications. The protein concentration ofeach sample was determined using the Pierce BCA Pro-tein Assay (Thermo Fisher Scientific, IL, USA). A refer-ence pool was made by pooling aliquots from remainingextracted protein samples. This common sample allowsfor the normalisation and comparison of all sets.
iTRAQ Labelling of Peptides65 μg of protein from each sample was withdrawn anddiluted four times with dissolution solution (0.5 MTEAB (triethylammonium bicarbonate) and milli-Qwater)) and the samples were reduced with TCEP ((tris(2-carboxyethyl)phosphine) and alkylated with MMTS(methyl methanethiolsulfonate) before digestion withtrypsin (Promega Corporation, WI, USA). Each samplein the four-plex set, consisting of one pooled referencesample and three individual patient samples, was thenlabelled with the iTRAQ® Reagents 114, 115, 116, and117 respectively, following manufacturer’s instructions(Applied Biosystems, Foster City, CA, USA). The refer-ence pool was always labelled with iTRAQ® Reagent114, while the patient samples were randomised to theremaining three iTRAQ® Reagents within theexperiment.
Strong Cation Exchange (SCX) Fractionation of iTRAQ-labelled PeptidesSCX chromatography was used to remove unboundiTRAQ® Reagents and to reduce the sample complexityby fractionation. The concentrated peptides were acidi-fied by 10% formic acid and diluted with SCX solvent A(25 mM ammonium formate, pH 2.8, 20% ACN (aceto-nitrile)) and injected onto a PolySULFOETHYL A SCXcolumn (PolyLC Incorporated, MD, USA) (2.1 mm i.d.× 10 cm length, 5 μm particle size, 300 Å pore size).SCX chromatography and fractionation was carried outon an ÄKTA purifier system (GE Healthcare, Buckin-ghamshire, UK) at 0.25 mL/min flow rate using the fol-lowing gradient: 0% B (500 mM ammonium formate,pH 2.8, 20% ACN) for 5 min; 0-40% B for 20 min; 40-100% B for 10 min and 100% B held for 10 min. UVabsorbance at 254 and 280 nm was monitored, whilefractions were collected at 0.5 mL intervals and drieddown in a SpeedVac. The 15 peptide-containing frac-tions were desalted on PepClean C-18 Spin Columnsaccording to manufacturer’s instructions (Thermo FisherScientific Inc, IL, USA).
LC-MS/MS Analysis on LTQ-OrbitrapThe desalted and dried fractions were reconstituted into0.1% formic acid and analysed on an LTQ-Orbitrap XL(Thermo Fisher Scientific) interfaced with an in-houseconstructed nano-LC system, described elsewhere [20].Briefly, 2 μl sample injections were made with an HTC-PAL autosampler (CTC Analytics AG, Zwingen, Swit-zerland) connected to an Agilent 1200 binary pump(Agilent Technologies, CA, USA). The peptides weretrapped on a pre-column (45 × 0.075 mm i.d.) and sepa-rated on a reversed phase column, 200 × 0.050 mm.Both columns are packed in-house with 3 μm Reprosil-Pur C18-AQ particles. The flow through the analyticalcolumn was reduced by a split to approximately 100 nl/min and the gradient was as followed; 0-5 min 0.1% for-mic acid, 6-103 min 7-40% ACN, 0.1% formic acid, 104-108 min 40-80% ACN 0.1% formic acid.LTQ-Orbitrap settings were: spray voltage 1.4 kV, 1
microscan for MS1 scans at 60 000 resolution (m/z400), full MS mass range m/z 400-2000. The LTQ-Orbi-trap was operated in a data-dependent mode, that is,one MS1 scan precursor ions followed by CID (collisioninduced dissociation) and HCD (high energy collisiondissociation) MS2 scans of the three most abundantdoubly or triply protonated ions in each MS1 scan. Thesettings for the MS2 were as follows; 1 microscan forHCD-MS2 at 7500 resolution (at m/z 400), mass rangem/z 100-2000 with a collision energy of 50%, 1 micro-scan for CID-MS2 with a collision energy of 30%.
Database Search and iTRAQ QuantificationMS raw data files from all 15 SCX fractions for onefour-plex iTRAQ set were merged for relative quantifi-cation and identification using Proteome Discoverer ver-sion 1.2 (Thermo Fisher Scientific). The database searchfor each set was performed by the Mascot search engineusing the following criteria: Homo sapiens in Swissprotversion 2010_12, MS peptide tolerance as 5 ppm, MS/MS tolerance as 0.5 Da, trypsin digestion allowing twomissed cleavages with variable modifications; methionineoxidation, cysteine methylthiolation, tyrosine iTRAQ4-plex (+144 Da) and fixed modifications; N-terminaliTRAQ4plex, lysine iTRAQ4plex. The detected proteinthreshold in the software was set to 99% confidence andone peptide. The identified proteins were grouped bysharing the same sequences to minimise redundancy.For iTRAQ quantification, the ratios of iTRAQ repor-
ter ion intensities in MS/MS spectra (m/z 114.11-117.11) from raw data sets were used to calculate foldchanges between samples. Ratios were derived by Pro-teome Discoverer version 1.2 using the following cri-teria: fragment ion tolerance as 50 ppm for the mostconfident centroid peak, iTRAQ reagent purity
O’Neil et al. Respiratory Research 2011, 12:124http://respiratory-research.com/content/12/1/124
Page 4 of 15
corrections factors was used, ion intensity threshold of1000 and missing values were replaced with the mini-mum intensity. Only peptides unique for a given proteinwere considered for relative quantitation, excludingthose common to other isoforms or proteins of thesame family. Proteome Discoverer normalised the chan-nel ratios and these normalised ratios were thenexported into Excel for manual data interpretation.
Bioinformatics Analysis of Proteomic DataIdentified proteins were further analysed using IPA (ver-sion 8.8) (Ingenuity® Systems, http://www.ingenuity.com) to statistically determine the functions and path-ways most strongly associated with the protein list. Priorto upload and analysis using IPA, the mean ratio of eachquantified protein in a group was calculated and the foldchange between the groups calculated. IPA utilises theIngenuity Pathways Analysis Knowledge Base (IPA KB),a manually curated database of protein interactionsfrom the literature, to analyse data. A dataset containinggene (or chemical) identifiers and corresponding expres-sion values was uploaded into the application. Eachidentifier was mapped to its corresponding object in theIPA KB. A fold change cut-off of 1.5 was set to identifymolecules whose expression was significantly differen-tially regulated. These proteins and their associationwith the IPA KB were used to generate networks andperform functional and canonical pathway analyses. Thesignificance of the associations was assessed with theFisher’s exact test and the Benjamini-Hochberg multipletesting correction.The PANTHER (Protein ANalysis THrough Evolu-
tionary Relationships) Classification System [21] wasused to further examine the significantly expressedmolecules [22].
Statistical AnalysisDifferences and changes in clinical measurements weredetermined using Student’s t-tests. Unpaired analyseswere used for comparing naive asthmatics to controls,while paired t-tests were used for comparing pre andpost treatment results. The changes due to treatment(delta change) between the two patient groups werecompared using an unpaired t-test. Data are expressedas mean ± standard error of the mean (SEM) or as themean followed by range. A p value of < 0.05 was consid-ered statistically significant.Student’s t-tests were also used to determine signifi-
cantly modified protein expression between groups. Anunpaired t-test was performed on those proteins thathad values for at least three samples of both healthycontrols and untreated asthma. A paired t-test wasperformed on those proteins that had values for atleast three samples of both pre and post treated
groups. A p value of < 0.05 was considered statisticallysignificant.
Principal Component AnalysisA principal component analysis (PCA) was performedusing the MultiExperiment Viewer (version 4.7), which ispart of the TM4 Microarray Software Suite [23,24]. Usingall proteins quantified in the dataset, the PCA was per-formed to visualise the relationship between the samples.
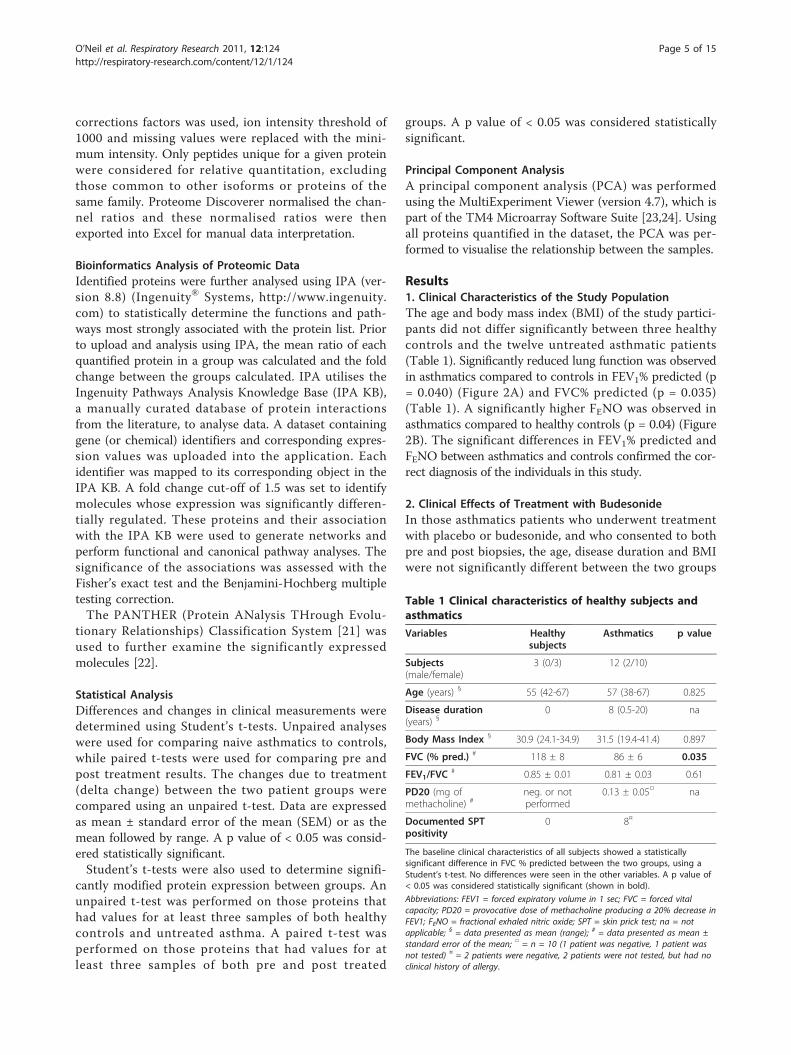
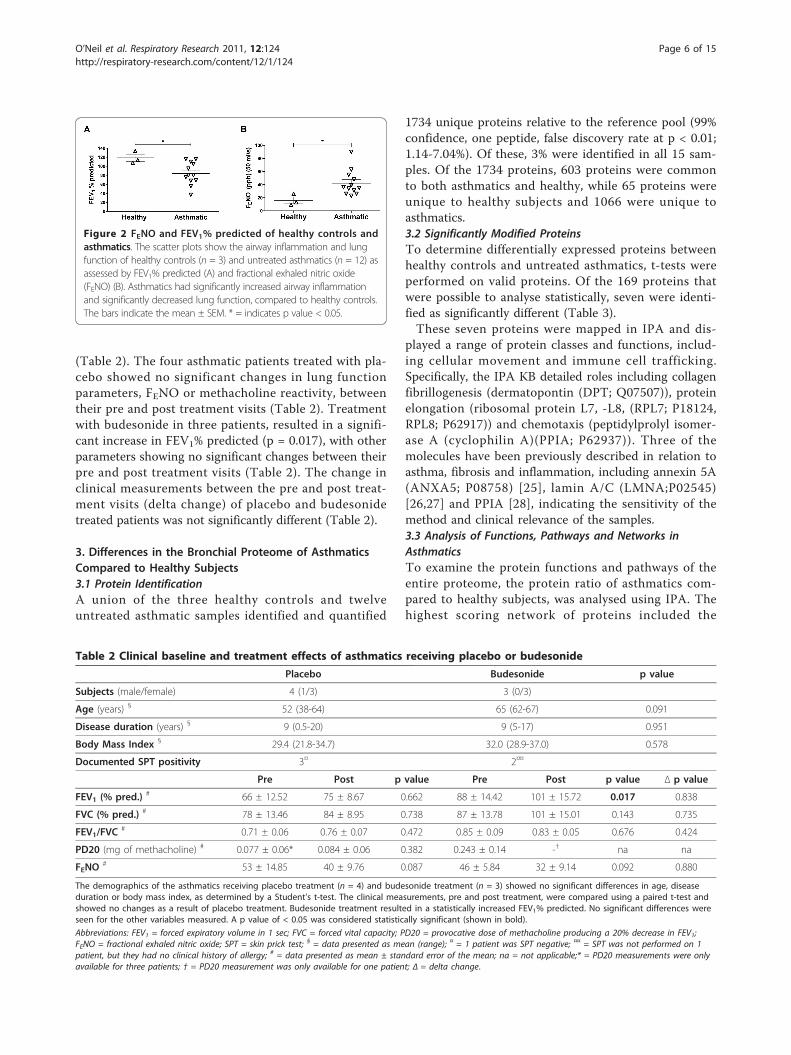
Results1. Clinical Characteristics of the Study PopulationThe age and body mass index (BMI) of the study partici-pants did not differ significantly between three healthycontrols and the twelve untreated asthmatic patients(Table 1). Significantly reduced lung function was observedin asthmatics compared to controls in FEV1% predicted (p= 0.040) (Figure 2A) and FVC% predicted (p = 0.035)(Table 1). A significantly higher FENO was observed inasthmatics compared to healthy controls (p = 0.04) (Figure2B). The significant differences in FEV1% predicted andFENO between asthmatics and controls confirmed the cor-rect diagnosis of the individuals in this study.
2. Clinical Effects of Treatment with BudesonideIn those asthmatics patients who underwent treatmentwith placebo or budesonide, and who consented to bothpre and post biopsies, the age, disease duration and BMIwere not significantly different between the two groups
Table 1 Clinical characteristics of healthy subjects andasthmatics
Variables Healthysubjects
Asthmatics p value
Subjects(male/female)
3 (0/3) 12 (2/10)
Age (years) § 55 (42-67) 57 (38-67) 0.825
Disease duration(years) §
0 8 (0.5-20) na
Body Mass Index § 30.9 (24.1-34.9) 31.5 (19.4-41.4) 0.897
FVC (% pred.) # 118 ± 8 86 ± 6 0.035
FEV1/FVC# 0.85 ± 0.01 0.81 ± 0.03 0.61
PD20 (mg ofmethacholine) #
neg. or notperformed
0.13 ± 0.05□ na
Documented SPTpositivity
0 8¤
The baseline clinical characteristics of all subjects showed a statisticallysignificant difference in FVC % predicted between the two groups, using aStudent’s t-test. No differences were seen in the other variables. A p value of< 0.05 was considered statistically significant (shown in bold).
Abbreviations: FEV1 = forced expiratory volume in 1 sec; FVC = forced vitalcapacity; PD20 = provocative dose of methacholine producing a 20% decrease inFEV1; FENO = fractional exhaled nitric oxide; SPT = skin prick test; na = notapplicable; § = data presented as mean (range); # = data presented as mean ±standard error of the mean; □ = n = 10 (1 patient was negative, 1 patient wasnot tested) ¤ = 2 patients were negative, 2 patients were not tested, but had noclinical history of allergy.
O’Neil et al. Respiratory Research 2011, 12:124http://respiratory-research.com/content/12/1/124
Page 5 of 15
(Table 2). The four asthmatic patients treated with pla-cebo showed no significant changes in lung functionparameters, FENO or methacholine reactivity, betweentheir pre and post treatment visits (Table 2). Treatmentwith budesonide in three patients, resulted in a signifi-cant increase in FEV1% predicted (p = 0.017), with otherparameters showing no significant changes between theirpre and post treatment visits (Table 2). The change inclinical measurements between the pre and post treat-ment visits (delta change) of placebo and budesonidetreated patients was not significantly different (Table 2).
3. Differences in the Bronchial Proteome of AsthmaticsCompared to Healthy Subjects3.1 Protein IdentificationA union of the three healthy controls and twelveuntreated asthmatic samples identified and quantified
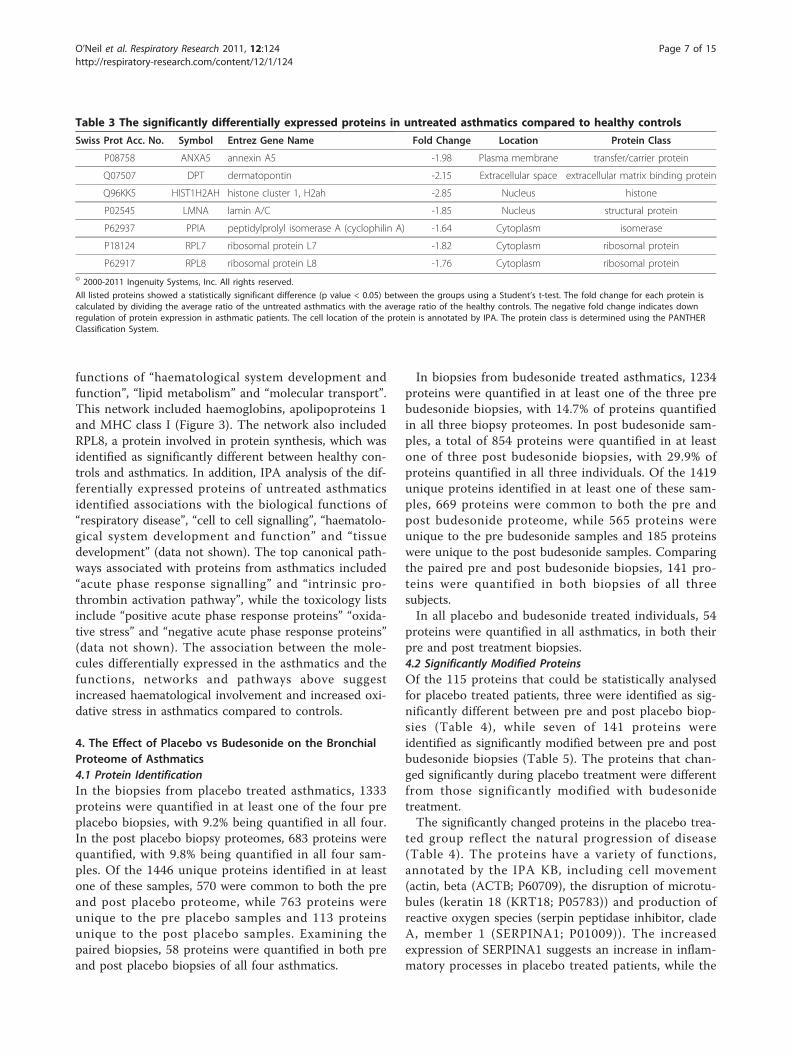
1734 unique proteins relative to the reference pool (99%confidence, one peptide, false discovery rate at p < 0.01;1.14-7.04%). Of these, 3% were identified in all 15 sam-ples. Of the 1734 proteins, 603 proteins were commonto both asthmatics and healthy, while 65 proteins wereunique to healthy subjects and 1066 were unique toasthmatics.3.2 Significantly Modified ProteinsTo determine differentially expressed proteins betweenhealthy controls and untreated asthmatics, t-tests wereperformed on valid proteins. Of the 169 proteins thatwere possible to analyse statistically, seven were identi-fied as significantly different (Table 3).These seven proteins were mapped in IPA and dis-
played a range of protein classes and functions, includ-ing cellular movement and immune cell trafficking.Specifically, the IPA KB detailed roles including collagenfibrillogenesis (dermatopontin (DPT; Q07507)), proteinelongation (ribosomal protein L7, -L8, (RPL7; P18124,RPL8; P62917)) and chemotaxis (peptidylprolyl isomer-ase A (cyclophilin A)(PPIA; P62937)). Three of themolecules have been previously described in relation toasthma, fibrosis and inflammation, including annexin 5A(ANXA5; P08758) [25], lamin A/C (LMNA;P02545)[26,27] and PPIA [28], indicating the sensitivity of themethod and clinical relevance of the samples.3.3 Analysis of Functions, Pathways and Networks inAsthmaticsTo examine the protein functions and pathways of theentire proteome, the protein ratio of asthmatics com-pared to healthy subjects, was analysed using IPA. Thehighest scoring network of proteins included the
Figure 2 FENO and FEV1% predicted of healthy controls andasthmatics. The scatter plots show the airway inflammation and lungfunction of healthy controls (n = 3) and untreated asthmatics (n = 12) asassessed by FEV1% predicted (A) and fractional exhaled nitric oxide(FENO) (B). Asthmatics had significantly increased airway inflammationand significantly decreased lung function, compared to healthy controls.The bars indicate the mean ± SEM. * = indicates p value < 0.05.
Table 2 Clinical baseline and treatment effects of asthmatics receiving placebo or budesonide
Placebo Budesonide p value
Subjects (male/female) 4 (1/3) 3 (0/3)
Age (years) § 52 (38-64) 65 (62-67) 0.091
Disease duration (years) § 9 (0.5-20) 9 (5-17) 0.951
Body Mass Index § 29.4 (21.8-34.7) 32.0 (28.9-37.0) 0.578
Documented SPT positivity 3¤ 2¤¤
Pre Post p value Pre Post p value Δ p value
FEV1 (% pred.) # 66 ± 12.52 75 ± 8.67 0.662 88 ± 14.42 101 ± 15.72 0.017 0.838
FVC (% pred.) # 78 ± 13.46 84 ± 8.95 0.738 87 ± 13.78 101 ± 15.01 0.143 0.735
FEV1/FVC# 0.71 ± 0.06 0.76 ± 0.07 0.472 0.85 ± 0.09 0.83 ± 0.05 0.676 0.424
PD20 (mg of methacholine) # 0.077 ± 0.06* 0.084 ± 0.06 0.382 0.243 ± 0.14 -† na na
FENO# 53 ± 14.85 40 ± 9.76 0.087 46 ± 5.84 32 ± 9.14 0.092 0.880
The demographics of the asthmatics receiving placebo treatment (n = 4) and budesonide treatment (n = 3) showed no significant differences in age, diseaseduration or body mass index, as determined by a Student’s t-test. The clinical measurements, pre and post treatment, were compared using a paired t-test andshowed no changes as a result of placebo treatment. Budesonide treatment resulted in a statistically increased FEV1% predicted. No significant differences wereseen for the other variables measured. A p value of < 0.05 was considered statistically significant (shown in bold).
Abbreviations: FEV1 = forced expiratory volume in 1 sec; FVC = forced vital capacity; PD20 = provocative dose of methacholine producing a 20% decrease in FEV1;FENO = fractional exhaled nitric oxide; SPT = skin prick test; § = data presented as mean (range); ¤ = 1 patient was SPT negative; ¤¤ = SPT was not performed on 1patient, but they had no clinical history of allergy; # = data presented as mean ± standard error of the mean; na = not applicable;* = PD20 measurements were onlyavailable for three patients; † = PD20 measurement was only available for one patient; Δ = delta change.
O’Neil et al. Respiratory Research 2011, 12:124http://respiratory-research.com/content/12/1/124
Page 6 of 15
functions of “haematological system development andfunction”, “lipid metabolism” and “molecular transport”.This network included haemoglobins, apolipoproteins 1and MHC class I (Figure 3). The network also includedRPL8, a protein involved in protein synthesis, which wasidentified as significantly different between healthy con-trols and asthmatics. In addition, IPA analysis of the dif-ferentially expressed proteins of untreated asthmaticsidentified associations with the biological functions of“respiratory disease”, “cell to cell signalling”, “haematolo-gical system development and function” and “tissuedevelopment” (data not shown). The top canonical path-ways associated with proteins from asthmatics included“acute phase response signalling” and “intrinsic pro-thrombin activation pathway”, while the toxicology listsinclude “positive acute phase response proteins” “oxida-tive stress” and “negative acute phase response proteins”(data not shown). The association between the mole-cules differentially expressed in the asthmatics and thefunctions, networks and pathways above suggestincreased haematological involvement and increased oxi-dative stress in asthmatics compared to controls.
4. The Effect of Placebo vs Budesonide on the BronchialProteome of Asthmatics4.1 Protein IdentificationIn the biopsies from placebo treated asthmatics, 1333proteins were quantified in at least one of the four preplacebo biopsies, with 9.2% being quantified in all four.In the post placebo biopsy proteomes, 683 proteins werequantified, with 9.8% being quantified in all four sam-ples. Of the 1446 unique proteins identified in at leastone of these samples, 570 were common to both the preand post placebo proteome, while 763 proteins wereunique to the pre placebo samples and 113 proteinsunique to the post placebo samples. Examining thepaired biopsies, 58 proteins were quantified in both preand post placebo biopsies of all four asthmatics.
In biopsies from budesonide treated asthmatics, 1234proteins were quantified in at least one of the three prebudesonide biopsies, with 14.7% of proteins quantifiedin all three biopsy proteomes. In post budesonide sam-ples, a total of 854 proteins were quantified in at leastone of three post budesonide biopsies, with 29.9% ofproteins quantified in all three individuals. Of the 1419unique proteins identified in at least one of these sam-ples, 669 proteins were common to both the pre andpost budesonide proteome, while 565 proteins wereunique to the pre budesonide samples and 185 proteinswere unique to the post budesonide samples. Comparingthe paired pre and post budesonide biopsies, 141 pro-teins were quantified in both biopsies of all threesubjects.In all placebo and budesonide treated individuals, 54
proteins were quantified in all asthmatics, in both theirpre and post treatment biopsies.4.2 Significantly Modified ProteinsOf the 115 proteins that could be statistically analysedfor placebo treated patients, three were identified as sig-nificantly different between pre and post placebo biop-sies (Table 4), while seven of 141 proteins wereidentified as significantly modified between pre and postbudesonide biopsies (Table 5). The proteins that chan-ged significantly during placebo treatment were differentfrom those significantly modified with budesonidetreatment.The significantly changed proteins in the placebo trea-
ted group reflect the natural progression of disease(Table 4). The proteins have a variety of functions,annotated by the IPA KB, including cell movement(actin, beta (ACTB; P60709), the disruption of microtu-bules (keratin 18 (KRT18; P05783)) and production ofreactive oxygen species (serpin peptidase inhibitor, cladeA, member 1 (SERPINA1; P01009)). The increasedexpression of SERPINA1 suggests an increase in inflam-matory processes in placebo treated patients, while the
Table 3 The significantly differentially expressed proteins in untreated asthmatics compared to healthy controls
Swiss Prot Acc. No. Symbol Entrez Gene Name Fold Change Location Protein Class
P08758 ANXA5 annexin A5 -1.98 Plasma membrane transfer/carrier protein
Q07507 DPT dermatopontin -2.15 Extracellular space extracellular matrix binding protein
Q96KK5 HIST1H2AH histone cluster 1, H2ah -2.85 Nucleus histone
P02545 LMNA lamin A/C -1.85 Nucleus structural protein
P62937 PPIA peptidylprolyl isomerase A (cyclophilin A) -1.64 Cytoplasm isomerase
P18124 RPL7 ribosomal protein L7 -1.82 Cytoplasm ribosomal protein
P62917 RPL8 ribosomal protein L8 -1.76 Cytoplasm ribosomal protein© 2000-2011 Ingenuity Systems, Inc. All rights reserved.
All listed proteins showed a statistically significant difference (p value < 0.05) between the groups using a Student’s t-test. The fold change for each protein iscalculated by dividing the average ratio of the untreated asthmatics with the average ratio of the healthy controls. The negative fold change indicates downregulation of protein expression in asthmatic patients. The cell location of the protein is annotated by IPA. The protein class is determined using the PANTHERClassification System.
O’Neil et al. Respiratory Research 2011, 12:124http://respiratory-research.com/content/12/1/124
Page 7 of 15
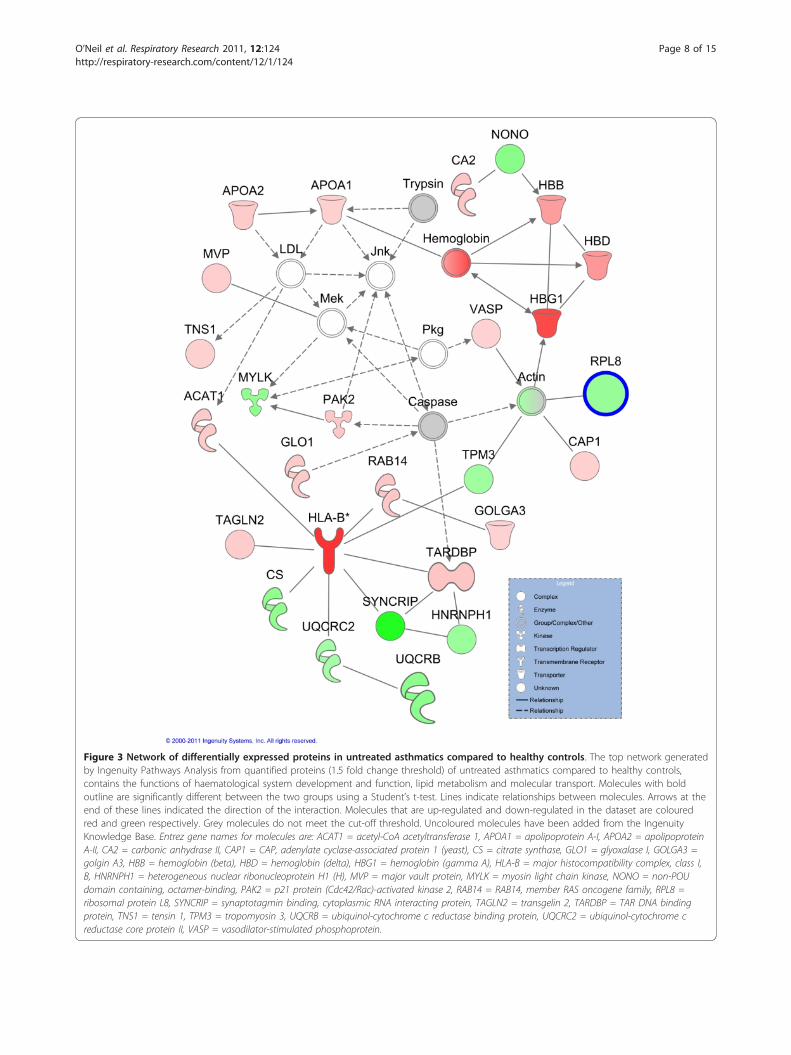
Figure 3 Network of differentially expressed proteins in untreated asthmatics compared to healthy controls. The top network generatedby Ingenuity Pathways Analysis from quantified proteins (1.5 fold change threshold) of untreated asthmatics compared to healthy controls,contains the functions of haematological system development and function, lipid metabolism and molecular transport. Molecules with boldoutline are significantly different between the two groups using a Student’s t-test. Lines indicate relationships between molecules. Arrows at theend of these lines indicated the direction of the interaction. Molecules that are up-regulated and down-regulated in the dataset are colouredred and green respectively. Grey molecules do not meet the cut-off threshold. Uncoloured molecules have been added from the IngenuityKnowledge Base. Entrez gene names for molecules are: ACAT1 = acetyl-CoA acetyltransferase 1, APOA1 = apolipoprotein A-I, APOA2 = apolipoproteinA-II, CA2 = carbonic anhydrase II, CAP1 = CAP, adenylate cyclase-associated protein 1 (yeast), CS = citrate synthase, GLO1 = glyoxalase I, GOLGA3 =golgin A3, HBB = hemoglobin (beta), HBD = hemoglobin (delta), HBG1 = hemoglobin (gamma A), HLA-B = major histocompatibility complex, class I,B, HNRNPH1 = heterogeneous nuclear ribonucleoprotein H1 (H), MVP = major vault protein, MYLK = myosin light chain kinase, NONO = non-POUdomain containing, octamer-binding, PAK2 = p21 protein (Cdc42/Rac)-activated kinase 2, RAB14 = RAB14, member RAS oncogene family, RPL8 =ribosomal protein L8, SYNCRIP = synaptotagmin binding, cytoplasmic RNA interacting protein, TAGLN2 = transgelin 2, TARDBP = TAR DNA bindingprotein, TNS1 = tensin 1, TPM3 = tropomyosin 3, UQCRB = ubiquinol-cytochrome c reductase binding protein, UQCRC2 = ubiquinol-cytochrome creductase core protein II, VASP = vasodilator-stimulated phosphoprotein.
O’Neil et al. Respiratory Research 2011, 12:124http://respiratory-research.com/content/12/1/124
Page 8 of 15
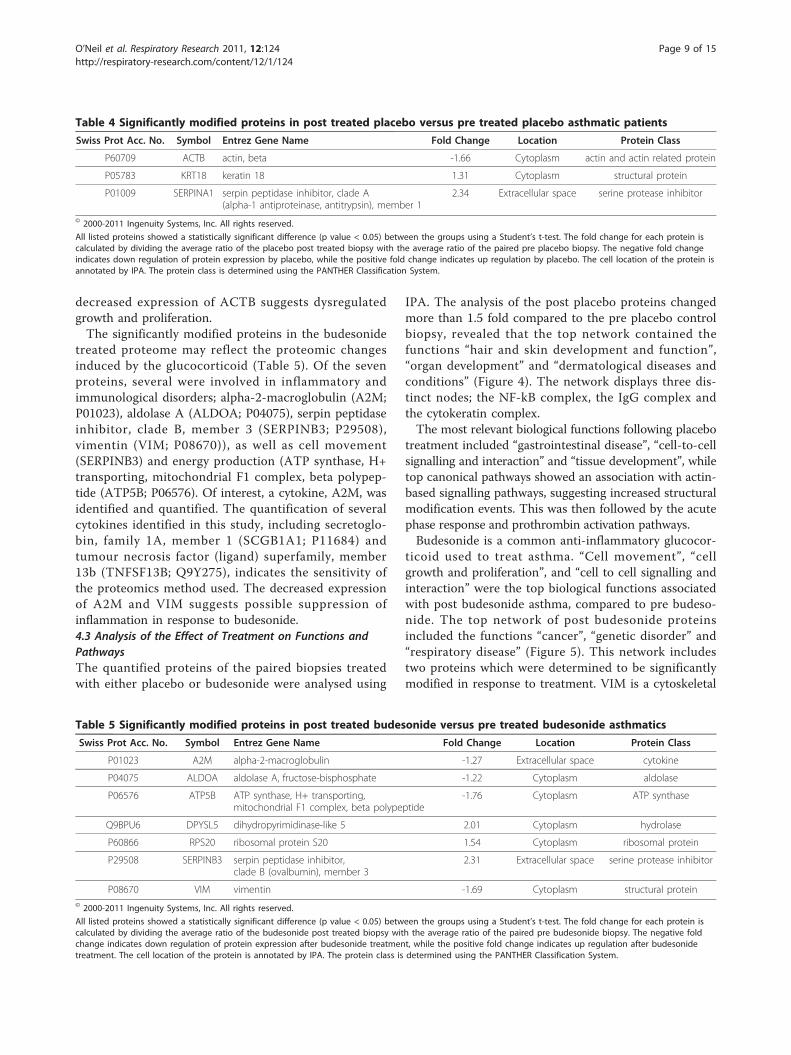
decreased expression of ACTB suggests dysregulatedgrowth and proliferation.The significantly modified proteins in the budesonide
treated proteome may reflect the proteomic changesinduced by the glucocorticoid (Table 5). Of the sevenproteins, several were involved in inflammatory andimmunological disorders; alpha-2-macroglobulin (A2M;P01023), aldolase A (ALDOA; P04075), serpin peptidaseinhibitor, clade B, member 3 (SERPINB3; P29508),vimentin (VIM; P08670)), as well as cell movement(SERPINB3) and energy production (ATP synthase, H+transporting, mitochondrial F1 complex, beta polypep-tide (ATP5B; P06576). Of interest, a cytokine, A2M, wasidentified and quantified. The quantification of severalcytokines identified in this study, including secretoglo-bin, family 1A, member 1 (SCGB1A1; P11684) andtumour necrosis factor (ligand) superfamily, member13b (TNFSF13B; Q9Y275), indicates the sensitivity ofthe proteomics method used. The decreased expressionof A2M and VIM suggests possible suppression ofinflammation in response to budesonide.4.3 Analysis of the Effect of Treatment on Functions andPathwaysThe quantified proteins of the paired biopsies treatedwith either placebo or budesonide were analysed using
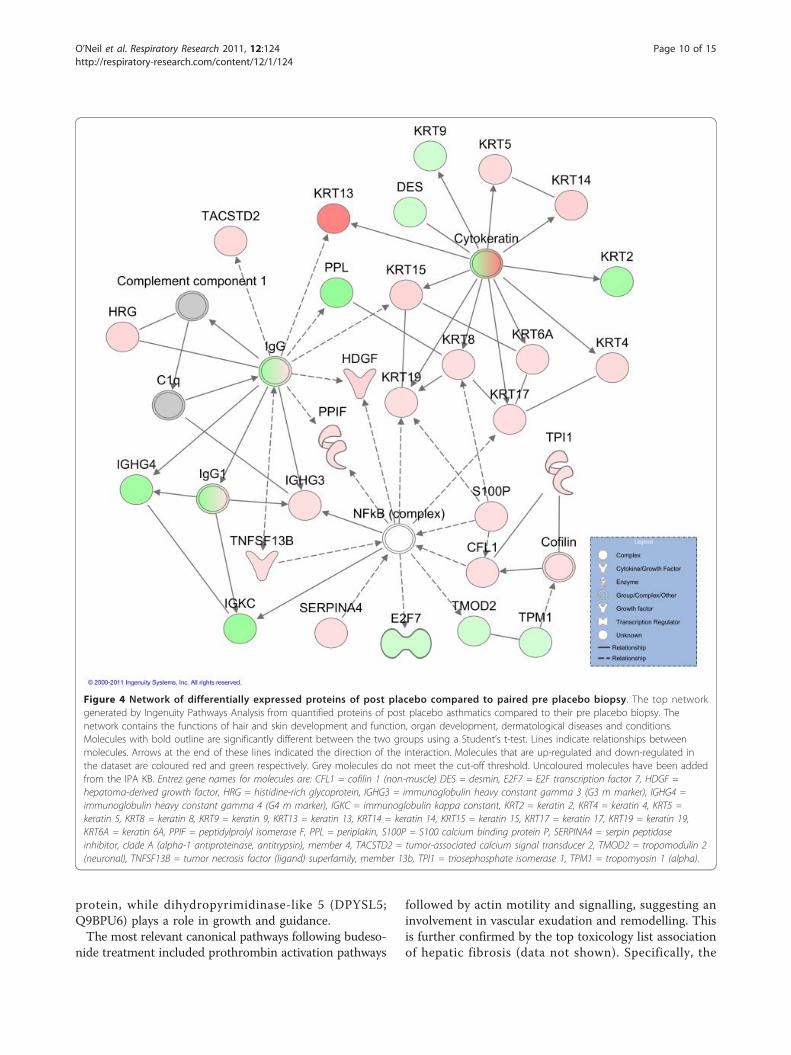
IPA. The analysis of the post placebo proteins changedmore than 1.5 fold compared to the pre placebo controlbiopsy, revealed that the top network contained thefunctions “hair and skin development and function”,“organ development” and “dermatological diseases andconditions” (Figure 4). The network displays three dis-tinct nodes; the NF-kB complex, the IgG complex andthe cytokeratin complex.The most relevant biological functions following placebo
treatment included “gastrointestinal disease”, “cell-to-cellsignalling and interaction” and “tissue development”, whiletop canonical pathways showed an association with actin-based signalling pathways, suggesting increased structuralmodification events. This was then followed by the acutephase response and prothrombin activation pathways.Budesonide is a common anti-inflammatory glucocor-
ticoid used to treat asthma. “Cell movement”, “cellgrowth and proliferation”, and “cell to cell signalling andinteraction” were the top biological functions associatedwith post budesonide asthma, compared to pre budeso-nide. The top network of post budesonide proteinsincluded the functions “cancer”, “genetic disorder” and“respiratory disease” (Figure 5). This network includestwo proteins which were determined to be significantlymodified in response to treatment. VIM is a cytoskeletal
Table 4 Significantly modified proteins in post treated placebo versus pre treated placebo asthmatic patients
Swiss Prot Acc. No. Symbol Entrez Gene Name Fold Change Location Protein Class
P60709 ACTB actin, beta -1.66 Cytoplasm actin and actin related protein
P05783 KRT18 keratin 18 1.31 Cytoplasm structural protein
P01009 SERPINA1 serpin peptidase inhibitor, clade A(alpha-1 antiproteinase, antitrypsin), member 1
2.34 Extracellular space serine protease inhibitor
© 2000-2011 Ingenuity Systems, Inc. All rights reserved.
All listed proteins showed a statistically significant difference (p value < 0.05) between the groups using a Student’s t-test. The fold change for each protein iscalculated by dividing the average ratio of the placebo post treated biopsy with the average ratio of the paired pre placebo biopsy. The negative fold changeindicates down regulation of protein expression by placebo, while the positive fold change indicates up regulation by placebo. The cell location of the protein isannotated by IPA. The protein class is determined using the PANTHER Classification System.
Table 5 Significantly modified proteins in post treated budesonide versus pre treated budesonide asthmatics
Swiss Prot Acc. No. Symbol Entrez Gene Name Fold Change Location Protein Class
P01023 A2M alpha-2-macroglobulin -1.27 Extracellular space cytokine
P04075 ALDOA aldolase A, fructose-bisphosphate -1.22 Cytoplasm aldolase
P06576 ATP5B ATP synthase, H+ transporting,mitochondrial F1 complex, beta polypeptide
-1.76 Cytoplasm ATP synthase
Q9BPU6 DPYSL5 dihydropyrimidinase-like 5 2.01 Cytoplasm hydrolase
P60866 RPS20 ribosomal protein S20 1.54 Cytoplasm ribosomal protein
P29508 SERPINB3 serpin peptidase inhibitor,clade B (ovalbumin), member 3
2.31 Extracellular space serine protease inhibitor
P08670 VIM vimentin -1.69 Cytoplasm structural protein© 2000-2011 Ingenuity Systems, Inc. All rights reserved.
All listed proteins showed a statistically significant difference (p value < 0.05) between the groups using a Student’s t-test. The fold change for each protein iscalculated by dividing the average ratio of the budesonide post treated biopsy with the average ratio of the paired pre budesonide biopsy. The negative foldchange indicates down regulation of protein expression after budesonide treatment, while the positive fold change indicates up regulation after budesonidetreatment. The cell location of the protein is annotated by IPA. The protein class is determined using the PANTHER Classification System.
O’Neil et al. Respiratory Research 2011, 12:124http://respiratory-research.com/content/12/1/124
Page 9 of 15
protein, while dihydropyrimidinase-like 5 (DPYSL5;Q9BPU6) plays a role in growth and guidance.The most relevant canonical pathways following budeso-
nide treatment included prothrombin activation pathways
followed by actin motility and signalling, suggesting aninvolvement in vascular exudation and remodelling. Thisis further confirmed by the top toxicology list associationof hepatic fibrosis (data not shown). Specifically, the
Figure 4 Network of differentially expressed proteins of post placebo compared to paired pre placebo biopsy. The top networkgenerated by Ingenuity Pathways Analysis from quantified proteins of post placebo asthmatics compared to their pre placebo biopsy. Thenetwork contains the functions of hair and skin development and function, organ development, dermatological diseases and conditions.Molecules with bold outline are significantly different between the two groups using a Student’s t-test. Lines indicate relationships betweenmolecules. Arrows at the end of these lines indicated the direction of the interaction. Molecules that are up-regulated and down-regulated inthe dataset are coloured red and green respectively. Grey molecules do not meet the cut-off threshold. Uncoloured molecules have been addedfrom the IPA KB. Entrez gene names for molecules are: CFL1 = cofilin 1 (non-muscle) DES = desmin, E2F7 = E2F transcription factor 7, HDGF =hepatoma-derived growth factor, HRG = histidine-rich glycoprotein, IGHG3 = immunoglobulin heavy constant gamma 3 (G3 m marker), IGHG4 =immunoglobulin heavy constant gamma 4 (G4 m marker), IGKC = immunoglobulin kappa constant, KRT2 = keratin 2, KRT4 = keratin 4, KRT5 =keratin 5, KRT8 = keratin 8, KRT9 = keratin 9, KRT13 = keratin 13, KRT14 = keratin 14, KRT15 = keratin 15, KRT17 = keratin 17, KRT19 = keratin 19,KRT6A = keratin 6A, PPIF = peptidylprolyl isomerase F, PPL = periplakin, S100P = S100 calcium binding protein P, SERPINA4 = serpin peptidaseinhibitor, clade A (alpha-1 antiproteinase, antitrypsin), member 4, TACSTD2 = tumor-associated calcium signal transducer 2, TMOD2 = tropomodulin 2(neuronal), TNFSF13B = tumor necrosis factor (ligand) superfamily, member 13b, TPI1 = triosephosphate isomerase 1, TPM1 = tropomyosin 1 (alpha).
O’Neil et al. Respiratory Research 2011, 12:124http://respiratory-research.com/content/12/1/124
Page 10 of 15
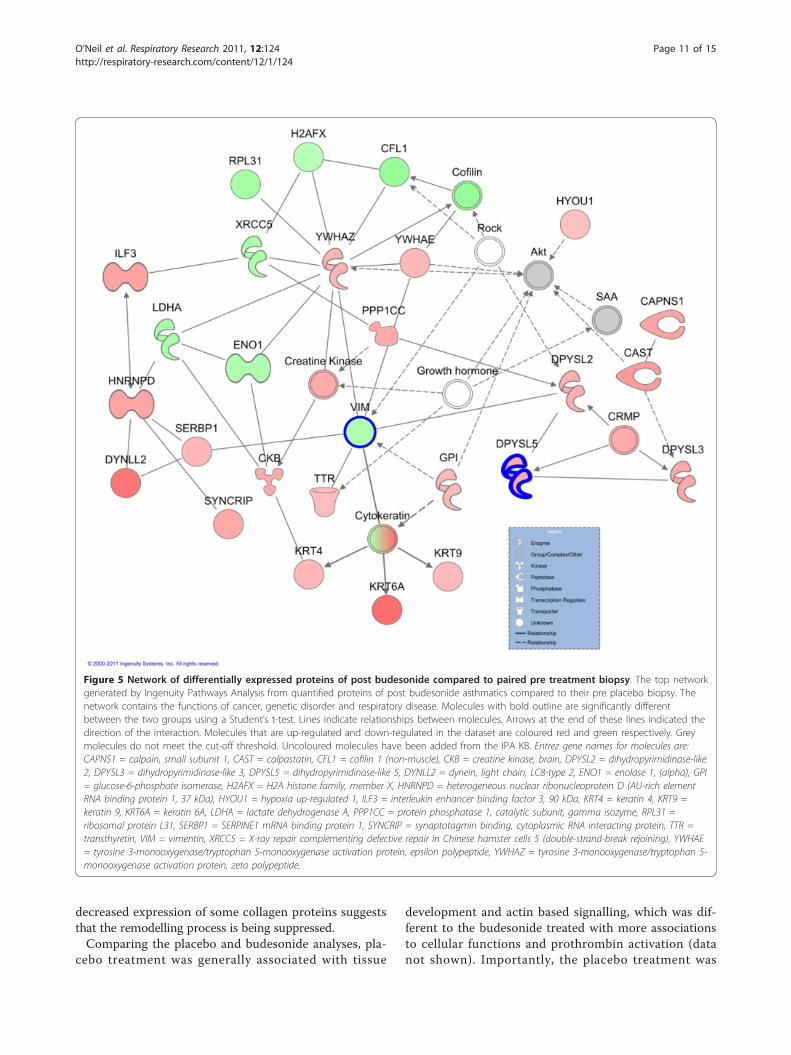
decreased expression of some collagen proteins suggeststhat the remodelling process is being suppressed.Comparing the placebo and budesonide analyses, pla-
cebo treatment was generally associated with tissue
development and actin based signalling, which was dif-ferent to the budesonide treated with more associationsto cellular functions and prothrombin activation (datanot shown). Importantly, the placebo treatment was
Figure 5 Network of differentially expressed proteins of post budesonide compared to paired pre treatment biopsy. The top networkgenerated by Ingenuity Pathways Analysis from quantified proteins of post budesonide asthmatics compared to their pre placebo biopsy. Thenetwork contains the functions of cancer, genetic disorder and respiratory disease. Molecules with bold outline are significantly differentbetween the two groups using a Student’s t-test. Lines indicate relationships between molecules. Arrows at the end of these lines indicated thedirection of the interaction. Molecules that are up-regulated and down-regulated in the dataset are coloured red and green respectively. Greymolecules do not meet the cut-off threshold. Uncoloured molecules have been added from the IPA KB. Entrez gene names for molecules are:CAPNS1 = calpain, small subunit 1, CAST = calpastatin, CFL1 = cofilin 1 (non-muscle), CKB = creatine kinase, brain, DPYSL2 = dihydropyrimidinase-like2, DPYSL3 = dihydropyrimidinase-like 3, DPYSL5 = dihydropyrimidinase-like 5, DYNLL2 = dynein, light chain, LC8-type 2, ENO1 = enolase 1, (alpha), GPI= glucose-6-phosphate isomerase, H2AFX = H2A histone family, member X, HNRNPD = heterogeneous nuclear ribonucleoprotein D (AU-rich elementRNA binding protein 1, 37 kDa), HYOU1 = hypoxia up-regulated 1, ILF3 = interleukin enhancer binding factor 3, 90 kDa, KRT4 = keratin 4, KRT9 =keratin 9, KRT6A = keratin 6A, LDHA = lactate dehydrogenase A, PPP1CC = protein phosphatase 1, catalytic subunit, gamma isozyme, RPL31 =ribosomal protein L31, SERBP1 = SERPINE1 mRNA binding protein 1, SYNCRIP = synaptotagmin binding, cytoplasmic RNA interacting protein, TTR =transthyretin, VIM = vimentin, XRCC5 = X-ray repair complementing defective repair in Chinese hamster cells 5 (double-strand-break rejoining), YWHAE= tyrosine 3-monooxygenase/tryptophan 5-monooxygenase activation protein, epsilon polypeptide, YWHAZ = tyrosine 3-monooxygenase/tryptophan 5-monooxygenase activation protein, zeta polypeptide.
O’Neil et al. Respiratory Research 2011, 12:124http://respiratory-research.com/content/12/1/124
Page 11 of 15
associated with hepatic fibrosis and positive acute phaseproteins. These associations were reduced in budesonidetreatment, with a drastically decreased association withacute phase proteins.A PCA was performed in order to visualise the rela-
tionship between the 22 samples, including healthy con-trols, untreated asthmatics, placebo treated asthmaticsand budesonide treated asthmatics. A total of 1833unique proteins were identified in at least one of the 22samples in the dataset and the expression data analysedby PCA. Principal components 1 and 2 represented37.47% of the overall variability of the data. A biplot ofthese two components revealed a tight cluster of healthycontrols, within a larger cluster of asthmatics. The pro-teome of two untreated asthmatics, two post placeboasthmatics and one post budesonide asthmatic separatefrom the main cluster (data not shown). The PCA sug-gests minimal variation in the proteome of the healthycontrols and demonstrated the known heterogeneity ofasthma.
DiscussionThere has been rapid growth in the identification of bio-markers and mechanisms using proteomic methods.Clinical proteomics is challenged by limited patientnumbers and limited patient material. This study hasshown for the first time that bronchial biopsy materialcan contain sufficient material for quantitative proteo-mic analysis. In addition, the individual proteomes ofpatients can be determined and features of asthma,including structural changes and cellular movement, canbe identified.The current study has shown for the first time that
small clinically relevant tissue samples (bronchial biop-sies) can be used to successfully analyse the proteome ofpatients with asthma. By combining iTRAQ® technologywith sensitive LC-MS/MS, proteins extracted fromendobronchial biopsies were identified and it was possi-ble to quantify characteristics of asthma, including theexpression of proteins involved in oxidative stress,immune cell trafficking and inflammatory responses.Importantly, we also show that treatment with aninhaled glucocorticoid significantly affects the proteomeand associated relevant functions, again arguing thatquantitative proteomic studies can identify disease rele-vant processes in the bronchi and can reflect responsesto treatment.The number of patients utilised for this proteomics
study was relatively low, as bronchial biopsies were notavailable from all subjects due to some declining toundergo bronchoscopies. As this was not anticipated, itis unlikely that a selection bias for the bronchial biopsyresults was introduced. Despite the low numbers, a sig-nificant difference in several measurements was found
between the studied groups and the paired samples addstrength to the study. It is interesting to observe thatboth FEV1% predicted and FENO were significantly dif-ferent in the asthma group compared with the controls,confirming the correct diagnosis of the individuals.Despite being far from powered, the study was able todetermine clinical effects of inhaled glucocorticoids, asobserved by an improvement in percent predicted FEV1
by the applied treatment, again confirming the correctdiagnosis and clinically relevant treatment effects. Futurescreening studies of this depth will probably be con-ducted in small patient subsets, due to the invasive nat-ure of the sampling. The current study is not only thefirst to utilise quantitative proteomics in bronchial biop-sies in asthma, but also the largest study determiningthe proteome of asthma.The bronchial biopsies from the asthmatics, taken
through fibreoptic bronchoscopes, are a few milli-metres in size, subsequently resulting in a small yieldof extracted protein. Despite these limitations, the cou-pling of the iTRAQ® technology and the nanoLC-LTQ-Orbitrap XL instrument successfully identified alarge number of proteins in the samples, includingmany that were relevant to asthma and respiratory dis-eases. As might be expected from tissue samples, thecurrently applied technique was able to identify andquantify a larger number of proteins than any previousproteomic study in asthma using BALF [10] or specificcells [11,29], despite no affinity depletion of high abun-dance proteins. Interestingly, the low abundance ofcytokines usually prevents their quantification in pro-teomics studies. However, this study has identified andquantified several cytokines in bronchial biopsies,including SCGB1A1 and TNFSF13B. These two cyto-kines had increased expression with placebo treatment,which was reduced in budesonide treatment. SCGB1A1is a transient marker of inflammation [30], whileTNFSF13B has been associated with both Th1 andTh2 inflammation [31,32]. Other cytokines identified,but not quantified, included interleukin 6, chemokine(C-C motif) ligand 5 (CCL5; P13501) and macrophagemigration inhibitory factor (MIF; P14174), again docu-menting the relatively high sensitivity of the proteo-mics method utilised. Currently, no proteomicsmethod will identify and quantify all proteins presentin a biological sample. The identification of low abun-dant proteins such as cytokines and other regulatorymolecules, which may have profound biological effectsat low concentrations, may require an even more sen-sitive methodology to be adequately measured. It ispossible that with exclusion lists of irrelevant proteins,many more low abundance proteins could be identified[33]. In addition, multiple reaction monitoring massspectrometry may also allow the identification of low
O’Neil et al. Respiratory Research 2011, 12:124http://respiratory-research.com/content/12/1/124
Page 12 of 15
abundance proteins, as well as serve as a method forvalidation [34].Both the significant proteins, as well as the IPA
results, show clear differences in the proteome of bron-chial biopsies of asthmatics vs healthy controls. Asthmarelevant proteins that were shown to be different inasthmatics vs controls included SCGB1A1, SERPINA1,thrombins and fibrinogens. LMNA, one of the signifi-cantly differentially expressed proteins of asthmatics, hasbeen shown to be decreased in fibroblasts from fibroticlungs compared to non-fibrotic lungs [27]. The alteredexpression of these proteins in the bronchi of asthmaticssupports the evidence of inflammatory process in theairways of the studied individuals. Interestingly, the topnetwork expressed in asthma vs controls connects “hae-matological system development and function” with“lipid metabolism” and “molecular transport”.After treatment with placebo, the proteomic analysis
showed some significantly modified proteins betweenpost and pre treatment. The expression of these proteinsmay occur for two possible reasons. Firstly, they may bedue in part to inherent experimental variation, perhapsdepending on slight differences in the cellular composi-tion in the biopsies. Secondly, the changes during pla-cebo treatment could be due to the natural progressionof disease over the treatment period.Treatment with budesonide changes protein expres-
sion to a larger extent than placebo treatment and sev-eral of these changed proteins, including fibronectin(FN1; P02751) and SCGB1A1, are likely to be related toeffects of the glucocorticoid. The top network of mole-cules generated for budesonide treatment included “can-cer”, “genetic disorder” and “respiratory disease” andincludes proteins such as keratin 6A (KRT6A; P02538),dihydropyrimidinase-like 5 (DPYSL5; Q9BPU6), andinterleukin enhancer binding factor 3 (ILF3; Q12906)which had increased expression, while downregulatedproteins included cofilin 1(CFL1; P23528), alpha enolase1(ENO1; P06733) and VIM (Figure 5). ILF3, has recentlybeen described as a regulator of HS4-dependent IL13transcription, an important cytokine in Th2 immuneresponses [35]. A decreased expression of VIM, amesenchymal marker, may suggest reduced remodellingin response to budesonide, as epithelial to mesenchymaltransition has been seen to contribute to remodelling[36,37]. With roles in inflammation and remodelling,these proteins will need to be validated and furtherinvestigated as potential targets.Inhaled glucocorticoids are potent anti-inflammatories
recommended for asthmatics. Budesonide has been seento reduce inflammatory cells [38] and correct geneexpression [39] in bronchial biopsies, however, globalproteome changes had not been analysed. A biologicalfunction that is significantly affected by inhaled
budesonide is “immune cell trafficking”, in addition tothe functions of “tissue development” and “haematologi-cal systems development and function”, which wasobserved to change during placebo treatment and is alsodifferent between untreated asthma and controls. Thegeneral anti-inflammatory effect of budesonide can beseen with the improved lung function of the asthmaticsand with the reduced association with acute phase pro-teins. Thus, our data show that protein networks andfunctions relevant, or likely to be relevant, to asthma,are altered by inhaled glucocorticoids.The application of iTRAQ® technology with LC-MS/
MS has been used in several other diseases and samples[14,15]. This study is the first to describe the applicationof this method to examine the asthmatic bronchialbiopsy proteome and effects of glucocorticoid treatment.Studying the proteome of asthma is a complicated task,for several reasons. For one, the heterogeneity of asthmaargues the existence of several different subtypes of dis-ease and the current study is too small to include sub-classifications of disease [40]. The principal componentanalysis allowed the visualisation of the relationshipbetween the samples of this study. While the healthycontrols clustered together, as anticipated, the asthmaticsamples showed more variability. This may reflect theknown variability of the disease, with its multiple pheno-types [41]. The budesonide treated samples did not clus-ter together, which is not unexpected, as the responsethe inhaled glucocorticoids can vary substantiallybetween asthmatic patients [42]. Therefore, this studyreflects the mechanism and features of asthma in gen-eral and will need to be expanded in phenotypes ofasthma to further dissect the mechanisms of disease.A limitation of the current study is the experimental
and biological variation occurring at multiple levels. Thisis true for any clinical proteomics study of clinical pro-teomics in disease, but is especially relevant in asthma, adisease with extensive variability in intrinsic biologicalactivity over time. It must be cautioned that to developrelevant biomarkers of disease from the current study,the results will need to be further validated by othermethods in order to address the limitations of potentialfalse discovery, small sample size and gender specific pro-teome differences. Following this, verification will berequired in an independent group of patients, as well asother inflammatory and respiratory diseases. While thefindings of the current study have not been validated, theresults from the IPA support their involvement in pro-cesses associated with asthma, including structuralchanges, collagen accumulation and angiogenesis [43].
ConclusionsThis extensive proteomic study has identified globalmechanisms and features common to asthma and has
O’Neil et al. Respiratory Research 2011, 12:124http://respiratory-research.com/content/12/1/124
Page 13 of 15
determined for the first time that these features can beidentified from small biopsy samples of individuals withthe disease. However, the limited patient number andheterogeneity of asthma argues that even more detailedstudies will be required in the future to identify newmechanisms of disease. Thus, to further understand thecomplexities of asthma in the many phenotypes that aredisplayed, well characterised subsets of patients, repre-senting different phenotypes of asthma will need to beexamined.
List of Abbreviations2-DE: two-dimensional electrophoresis; ACN: acetonitrile; BALF:bronchoalveolar lavage fluid; BMI: body mass index; CHAPS: 3-[(3-cholamidopropyl)dimethylammonio]-1-propanesulphonate; CID: collisioninduced dissociation; EDTA: ethylenediaminetetraacetic acid; FENO: fractionalexhaled nitric oxide; FEV1: forced expiratory volume in 1 sec; FVC: forcedvital capacity; HCD: high energy collision dissociation; IPA: Ingenuity PathwayAnalysis; IPA KB: Ingenuity Pathway Analysis Knowledge Base; iTRAQ: isobarictags for relative and absolute quantitation; LC-MS/MS: liquidchromatography tandem mass spectrometry; MALDI-TOF: matrix-assistedlaser-desorption ionization time-of-flight; MMTS: methylmethanethiolsulfonate; MS: mass spectrometry; m/z mass-to-charge ratio;nanoLC-LTQ: nano liquid chromatography linear trap quadrupole; nano LC-MS/MS: nano liquid chromatography tandem mass spectrometry; PANTHER:Protein ANalysis THrough Evolutionary Relationships; PD20: provocative doseof methacholine producing a 20% decrease in FEV1; SCX: strong cationexchange; SDS-PAGE: sodium dodecyl sulphate polyacrylamide gelelectrophoresis; SELDI-TOF: surface-enhanced laser desorption/ionizationtime-of-flight; SEM: standard error of the mean; SPT: skin prick test; TEAB:triethylammonium bicarbonate; TCEP: ((tris(2-carboxyethyl)phosphine).
AcknowledgementsThe authors would like to thank the Proteomics Core Facility at theSahlgrenska Academy, University of Gothenburg. The purchase of LTQ-Orbitrap XL was made possible through a grant from the Knut and AliceWallenberg Foundation (KAW2007.0118) to Gunnar C. Hansson. Funding forthe proteomics study was provided by the VBG GROUP’s Herman KreftingFoundation for Allergy and Asthma Research and the Swedish ResearchCouncil. The funding bodies did not play any role in the study design,collection and interpretation of the data or writing of the manuscript.
Author details1Krefting Research Centre, Department of Internal Medicine, University ofGothenburg, Sweden. 2Department of Pulmonology and Immunology,Lithuanian University of Health Sciences, Lithuania. 3Proteomics Core Facility,Sahlgrenska Academy, University of Gothenburg, Sweden.
Authors’ contributionsBS, AB, AK, KSB and RS conducted the randomised trial, including biopsysampling. LE participated in the design of the proteomic study. EC and CSparticipated in the proteomic experimental design and performed theproteomic experiments. SO participated in the design of the proteomicstudy, analysed the patient and proteomic data and drafted the manuscript.JL conceived the proteomics study, participated in the design and helpeddraft the manuscript. All authors approved the final manuscript.
Competing interestsThe authors declare that they have no competing interests.
Received: 24 May 2011 Accepted: 22 September 2011Published: 22 September 2011
References1. Lemanske RF Jr, Busse WW: Asthma: clinical expression and molecular
mechanisms. Journal of Allergy and Clinical Immunology 2010, 125:S95-102.
2. Masoli M, Fabian D, Holt S, Beasley R: The global burden of asthma:executive summary of the GINA Dissemination Committee report. Allergy2004, 59:469-478.
3. Rolph MS, Sisavanh M, Liu SM, Mackay CR: Clues to asthma pathogenesisfrom microarray expression studies. Pharmacology and Therapeutics 2006,109:284-294.
4. Greenlee KJ, Corry DB, Engler DA, Matsunami RK, Tessier P, Cook RG,Werb Z, Kheradmand F: Proteomic identification of in vivo substrates formatrix metalloproteinases 2 and 9 reveals a mechanism for resolution ofinflammation. Journal of Immunology 2006, 177:7312-7321.
5. Jeong H, Rhim T, Ahn MH, Yoon PO, Kim SH, Chung IY, Uh S, Kim SI,Park CS: Proteomic analysis of differently expressed proteins in a mousemodel for allergic asthma. J Korean Med Sci 2005, 20:579-585.
6. Wong WS, Zhao J: Proteome analysis of chronically inflamed lungs in amouse chronic asthma model. International Archives of Allergy andImmunology 2008, 147:179-189.
7. Zhang L, Wang M, Kang X, Boontheung P, Li N, Nel AE, Loo JA: Oxidativestress and asthma: proteome analysis of chitinase-like proteins andFIZZ1 in lung tissue and bronchoalveolar lavage fluid. Journal ofProteome Research 2009, 8:1631-1638.
8. Larsen K, Malmstrom J, Wildt M, Dahlqvist C, Hansson L, Marko-Varga G,Bjermer L, Scheja A, Westergren-Thorsson G: Functional and phenotypicalcomparison of myofibroblasts derived from biopsies and bronchoalveolarlavage in mild asthma and scleroderma. Respir Res 2006, 7:11.
9. Gray RD, MacGregor G, Noble D, Imrie M, Dewar M, Boyd AC, Innes JA,Porteous DJ, Greening AP: Sputum proteomics in inflammatory andsuppurative respiratory diseases. American Journal of Respiratory andCritical Care Medicine 2008, 178:444-452.
10. Wu J, Kobayashi M, Sousa EA, Liu W, Cai J, Goldman SJ, Dorner AJ,Projan SJ, Kavuru MS, Qiu Y, Thomassen MJ: Differential proteomic analysisof bronchoalveolar lavage fluid in asthmatics following segmentalantigen challenge. Molecular and Cellular Proteomics 2005, 4:1251-1264.
11. Jeong HC, Lee SY, Lee EJ, Jung KH, Kang EH, Kim JH, Park EK, Lee SH,Uhm CS, Cho Y, et al: Proteomic analysis of peripheral T-lymphocytes inpatients with asthma. Chest 2007, 132:489-496.
12. Bloemen K, Van Den Heuvel R, Govarts E, Hooyberghs J, Nelen V, Witters E,Desager K, Schoeters G: A new approach to study exhaled proteins aspotential biomarkers for asthma. Clin Exp Allergy 2011, 41:346-356.
13. Cho WC: Proteomics technologies and challenges. Genomics ProteomicsBioinformatics 2007, 5:77-85.
14. Romero R, Kusanovic JP, Gotsch F, Erez O, Vaisbuch E, Mazaki-Tovi S,Moser A, Tam S, Leszyk J, Master SR, et al: Isobaric labeling and tandemmass spectrometry: a novel approach for profiling and quantifyingproteins differentially expressed in amniotic fluid in preterm labor withand without intra-amniotic infection/inflammation. Journal of Maternal-Fetal and Neonatal Medicine 2010, 23:261-280.
15. Wang H, Chavali S, Mobini R, Muraro A, Barbon F, Boldrin D, Aberg N,Benson M: A pathway-based approach to find novel markers of localglucocorticoid treatment in intermittent allergic rhinitis. Allergy 2011,66:132-140.
16. Chaerkady R, Letzen B, Renuse S, Sahasrabuddhe NA, Kumar P, All AH,Thakor NV, Delanghe B, Gearhart JD, Pandey A, Kerr CL: Quantitativetemporal proteomic analysis of human embryonic stem celldifferentiation into oligodendrocyte progenitor cells. Proteomics .
17. Dean RA, Overall CM: Proteomics discovery of metalloproteinasesubstrates in the cellular context by iTRAQ labeling reveals a diverseMMP-2 substrate degradome. Mol Cell Proteomics 2007, 6:611-623.
18. Neilson KA, Mariani M, Haynes PA: Quantitative proteomic analysis ofcold-responsive proteins in rice. Proteomics 2011, 11:1696-1706.
19. Global Strategy for Asthma Management and Prevention. NIHpublication No 02-3659 Global Initiative for Asthma National Institutes ofHealth National Heart, Lung and Blood Institute 2002.
20. Carlsohn E, Nystrom J, Karlsson H, Svennerholm AM, Nilsson CL:Characterization of the outer membrane protein profile from disease-related Helicobacter pylori isolates by subcellular fractionation and nano-LC FT-ICR MS analysis. Journal of Proteome Research 2006, 5:3197-3204.
21. Thomas PD, Campbell MJ, Kejariwal A, Mi H, Karlak B, Daverman R,Diemer K, Muruganujan A, Narechania A: PANTHER: a library of proteinfamilies and subfamilies indexed by function. Genome Research 2003,13:2129-2141.
O’Neil et al. Respiratory Research 2011, 12:124http://respiratory-research.com/content/12/1/124
Page 14 of 15
22. Thomas PD, Kejariwal A, Guo N, Mi H, Campbell MJ, Muruganujan A,Lazareva-Ulitsky B: Applications for protein sequence-function evolutiondata: mRNA/protein expression analysis and coding SNP scoring tools.Nucleic Acids Research 2006, 34:W645-650.
23. Saeed AI, Bhagabati NK, Braisted JC, Liang W, Sharov V, Howe EA, Li J,Thiagarajan M, White JA, Quackenbush J: TM4 microarray software suite.Methods Enzymol 2006, 411:134-193.
24. Saeed AI, Sharov V, White J, Li J, Liang W, Bhagabati N, Braisted J, Klapa M,Currier T, Thiagarajan M, et al: TM4: a free, open-source system formicroarray data management and analysis. Biotechniques 2003,34:374-378.
25. Watanabe Y, Hashimoto Y, Shiratsuchi A, Takizawa T, Nakanishi Y:Augmentation of fatality of influenza in mice by inhibition ofphagocytosis. Biochem Biophys Res Commun 2005, 337:881-886.
26. Altraja S, Jaama J, Valk E, Altraja A: Changes in the proteome of humanbronchial epithelial cells following stimulation with leucotriene E4 andtransforming growth factor-beta1. Respirology 2009, 14:39-45.
27. Waldburg N, Kahne T, Reisenauer A, Rocken C, Welte T, Buhling F: Clinicalproteomics in lung diseases. Pathol Res Pract 2004, 200:147-154.
28. Sherry B, Yarlett N, Strupp A, Cerami A: Identification of cyclophilin as aproinflammatory secretory product of lipopolysaccharide-activatedmacrophages. Proc Natl Acad Sci USA 1992, 89:3511-3515.
29. van Diepen A, Brand HK, Sama I, Lambooy LH, van den Heuvel LP, van derWell L, Huynen M, Osterhaus AD, Andeweg AC, Hermans PW: Quantitativeproteome profiling of respiratory virus-infected lung epithelial cells. JProteomics 2010, 73:1680-1693.
30. Lakind JS, Holgate ST, Ownby DR, Mansur AH, Helms PJ, Pyatt D, Hays SM:A critical review of the use of Clara cell secretory protein (CC16) as abiomarker of acute or chronic pulmonary effects. Biomarkers 2007,12:445-467.
31. Kang JS, Yoon YD, Ahn JH, Kim SC, Kim KH, Kim HM, Moon EY: B cell-activating factor is a novel diagnosis parameter for asthma. InternationalArchives of Allergy and Immunology 2006, 141:181-188.
32. Sutherland AP, Ng LG, Fletcher CA, Shum B, Newton RA, Grey ST, Rolph MS,Mackay F, Mackay CR: BAFF augments certain Th1-associatedinflammatory responses. Journal of Immunology 2005, 174:5537-5544.
33. Voisin SN, Krakovska O, Matta A, Desouza LV, Romaschin AD, Colgan TJ,Siu KW: Identification of Novel Molecular Targets for Endometrial CancerUsing a Drill-Down LC-MS/MS Approach with iTRAQ. PLoS ONE 2011, 6:e16352.
34. Nishimura T, Nomura M, Tojo H, Hamasaki H, Fukuda T, Fujii K, Mikami S,Bando Y, Kato H: Proteomic analysis of laser-microdissected paraffin-embedded tissues: (2) MRM assay for stage-related proteins upon non-metastatic lung adenocarcinoma. J Proteomics 2010, 73:1100-1110.
35. Kiesler P, Haynes PA, Shi L, Kao PN, Wysocki VH, Vercelli D: NF45 and NF90regulate HS4-dependent interleukin-13 transcription in T cells. Journal ofBiological Chemistry 2010, 285:8256-8267.
36. Hackett TL, Warner SM, Stefanowicz D, Shaheen F, Pechkovsky DV,Murray LA, Argentieri R, Kicic A, Stick SM, Bai TR, Knight DA: Induction ofepithelial-mesenchymal transition in primary airway epithelial cells frompatients with asthma by transforming growth factor-beta1. AmericanJournal of Respiratory and Critical Care Medicine 2009, 180:122-133.
37. Johnson JR, Roos A, Berg T, Nord M, Fuxe J: Chronic respiratoryaeroallergen exposure in mice induces epithelial-mesenchymaltransition in the large airways. PLoS ONE 2011, 6:e16175.
38. Hoshino M, Nakagawa T, Sano Y, Hirai K: Effect of inhaled corticosteroidon an immunoreactive thymus and activation-regulated chemokineexpression in the bronchial biopsies from asthmatics. Allergy 2005,60:317-322.
39. Laprise C, Sladek R, Ponton A, Bernier MC, Hudson TJ, Laviolette M:Functional classes of bronchial mucosa genes that are differentiallyexpressed in asthma. BMC Genomics 2004, 5:21.
40. Lotvall J, Akdis CA, Bacharier LB, Bjermer L, Casale TB, Custovic A,Lemanske RF Jr, Wardlaw AJ, Wenzel SE, Greenberger PA: Asthmaendotypes: a new approach to classification of disease entities withinthe asthma syndrome. Journal of Allergy and Clinical Immunology 2011,127:355-360.
41. Haldar P, Pavord ID, Shaw DE, Berry MA, Thomas M, Brightling CE,Wardlaw AJ, Green RH: Cluster analysis and clinical asthma phenotypes.Am J Respir Crit Care Med 2008, 178:218-224.
42. Berry M, Morgan A, Shaw DE, Parker D, Green R, Brightling C, Bradding P,Wardlaw AJ, Pavord ID: Pathological features and inhaled corticosteroidresponse of eosinophilic and non-eosinophilic asthma. Thorax 2007,62:1043-1049.
43. Barnes PJ: Immunology of asthma and chronic obstructive pulmonarydisease. Nature Reviews Immunology 2008, 8:183-192.
doi:10.1186/1465-9921-12-124Cite this article as: O’Neil et al.: Network analysis of quantitativeproteomics on asthmatic bronchi: effects of inhaled glucocorticoidtreatment. Respiratory Research 2011 12:124.
Submit your next manuscript to BioMed Centraland take full advantage of:
• Convenient online submission
• Thorough peer review
• No space constraints or color figure charges
• Immediate publication on acceptance
• Inclusion in PubMed, CAS, Scopus and Google Scholar
• Research which is freely available for redistribution
Submit your manuscript at www.biomedcentral.com/submit
O’Neil et al. Respiratory Research 2011, 12:124http://respiratory-research.com/content/12/1/124
Page 15 of 15
Related Documents