Welcome message from author
This document is posted to help you gain knowledge. Please leave a comment to let me know what you think about it! Share it to your friends and learn new things together.
Transcript
Netwerken, Visualisaties & Computer Vision
21 mei Tjerk Timan

introductie
- intro: netwerk analyse - oefening 1: een Wordle - oefening 2: Facebook netwerken - oefening 3: Open Data Rotterdam &
Tableau - intermezzo: Visualisatie - taxonomy - show and tell: Computer Vision en
Processing

Oefening 1: Wordle


> https://wiki.digitalmethods.net/Dmi/ToolDatabase
> open de volgende websites
> http://www.wordle.net/create
De te nemen stappen: > selecteer een website OF een text > schoon de text op via bijvoorbeeld https://tools.digitalmethods.net/beta/sentences/ of https://tools.digitalmethods.net/beta/textRipper/ > knip en plak de schone text en/of de url in het Wordle-programma > OF maak eerst een TAG-cloud: https://tools.digitalmethods.net/beta/svgcloud/ en gebruik daarna: https://tools.digitalmethods.net/beta/tagcloudToWordle/
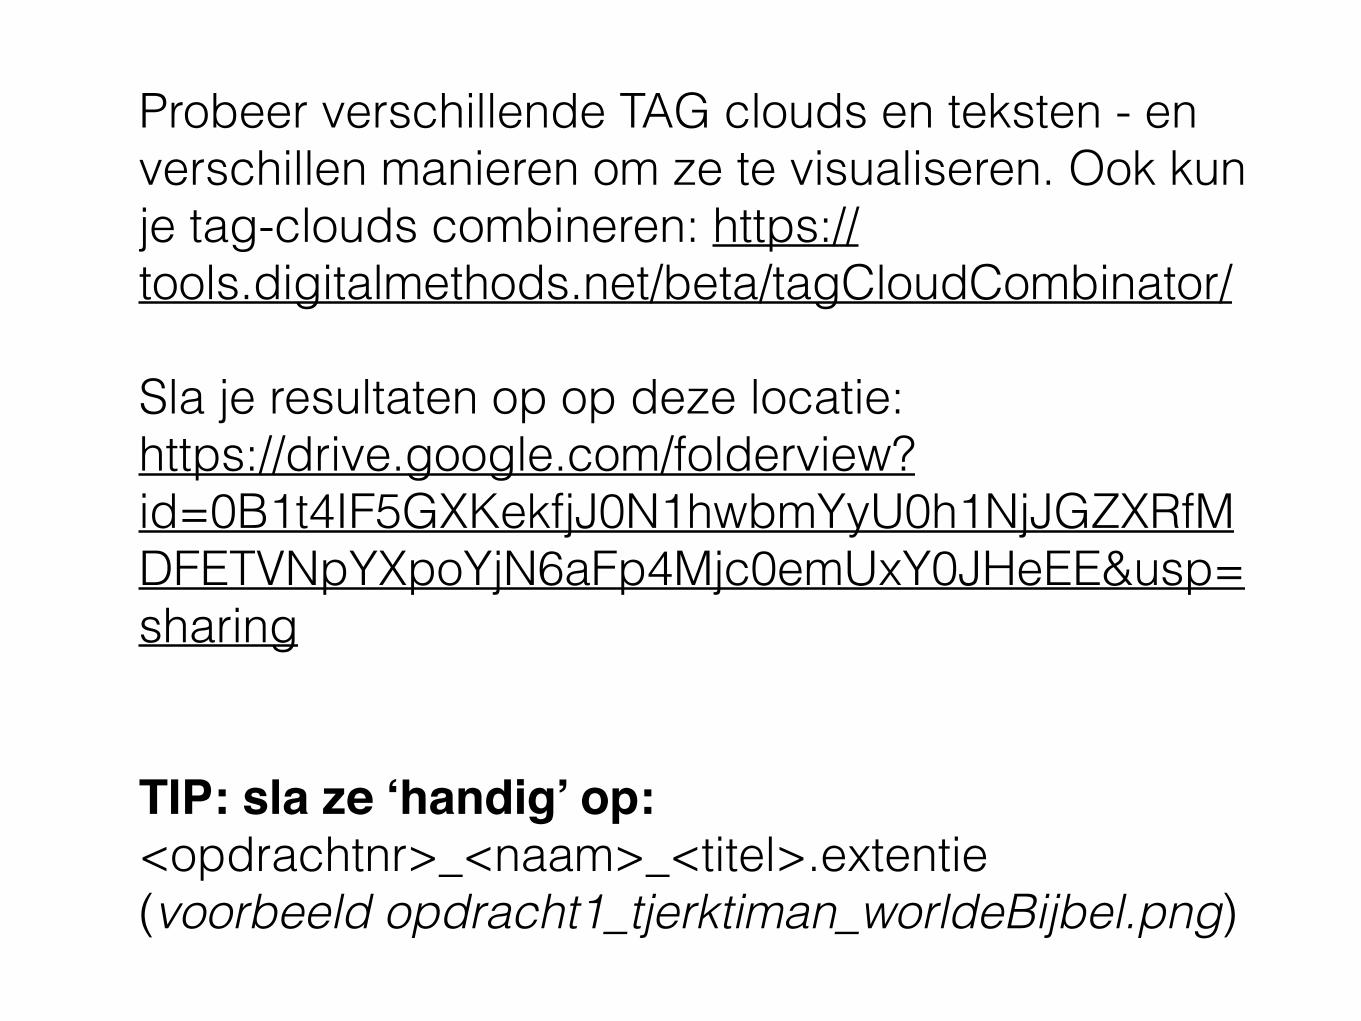
Probeer verschillende TAG clouds en teksten - en verschillen manieren om ze te visualiseren. Ook kun je tag-clouds combineren: https://tools.digitalmethods.net/beta/tagCloudCombinator/
Sla je resultaten op op deze locatie: https://drive.google.com/folderview?id=0B1t4IF5GXKekfjJ0N1hwbmYyU0h1NjJGZXRfMDFETVNpYXpoYjN6aFp4Mjc0emUxY0JHeEE&usp=sharing
TIP: sla ze ‘handig’ op: <opdrachtnr>_<naam>_<titel>.extentie (voorbeeld opdracht1_tjerktiman_worldeBijbel.png)

Network analysis

Oefening 2: Maak een sociogram


> Verdeel de klas in 4 groepen> maak per een een sociogram:> baseer dit op een zelfgekozen variabele (studie, wie elkaar het langste kent etc)> teken (via software (http://www.sometics.com/nl/sociogram) of met pen en papier
variant: > baseer je sociogram op een waarde/ hang een gewicht aan je variabele (wie kent elkaar het BESTE van schaal 1 tot 3, of met wie zou je WEL of NIET op vakantie gaan

Een stuk(je) theorie in het Engels

network analysts [...] see a structure of connections, within which the actor is embedded. Actors are described by their relations, not by their attributes. And, the relations themselves are just as fundamental as the actors that they connect.
Network analysis
Network data are defined by actors and by relations (or "nodes" and "edges")
actors are usually not sampled independently, as in many other kinds of studies (most typically, surveys)
types of network data

If one actor happens to be selected, then we must also include all other actors to whom our ego has (or could have) ties. As a result, network approaches tend to study whole populations by means of census, rather than by sample
scope of network

census sample

2. a more "demographic" or "ecological" approach to defining population boundaries.
The boundaries of the populations studied by network analysts are of two main types.
1) those imposed or created by the actors themselves.
boundaries of network

actor-defined: “the network of EU lobbyists for sustainability in healthcare”
(post)demographic “all Twitter users between 25 and 35 in Rotterdam”

individual persons > being embedded in networks > embedded in networks > embedded in networks.
collecting network data:
selecting,or sampling, from among a set of kinds of relations that we might have measured.
"multi-modal":
About modalities

nested networks selecting relations

- sampling from a population of possible relations.
- research question and theory indicate which of the kinds of relations among actors are the most relevant to our study
- we do not sample - but rather select - relations.
sample size and selection

Ego-Networks

ego-networks
"Ego" is an individual "focal" node. A network has as many egos as it has nodes. Egos can be persons, groups, organizations, or whole societies.

ego- neighborhoods
"Neighborhood" is the collection of ego and all nodes to whom ego has a connection at some path length.
"N-step neighborhood" expands the definition of the size of ego's neighborhood by including all nodes to whom ego has a connection at a path length of N, and all the connections among all of these actors.
"Strong and weak tie neighborhoods." Most analysis of ego networks uses binary data - two actors are connected or they aren't, and this defines the ego neighborhood.
But if we have measured the strength of the relation between two actors, and even its valence (positive or negative), we need to make choices about when we are going to decide that another actor is ego's neighbor.
Neighborhood strength

in and out neighbourhoods
- Most of the analysis of ego networks uses simple graphs (i.e. graphs that are symmetric, and show only connection/not, not direction).
- An "out" neighborhood would include all the actors to whom ties are directed from ego. - An "in" neighborhood would include all the actors who sent ties directly to ego.
ties
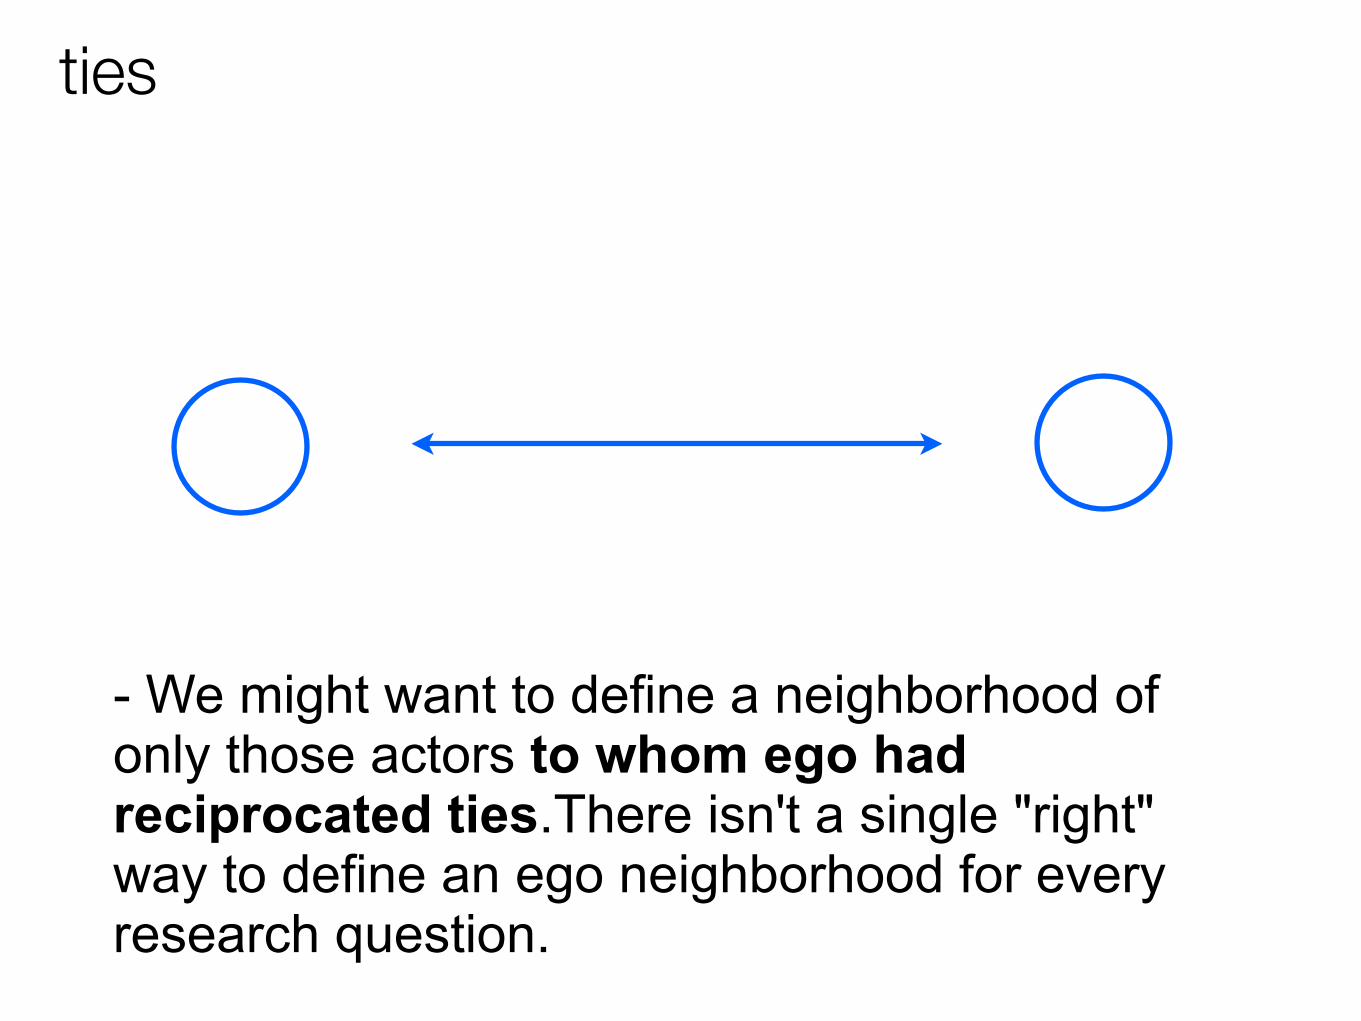
- We might want to define a neighborhood of only those actors to whom ego had reciprocated ties.There isn't a single "right" way to define an ego neighborhood for every research question.

cut-off value
With ties that are measured as strengths or probabilities, a reasonable approach is to define a cut-off value (or, better, explore several reasonable alternatives).
cut-off value

Hoe bepaal je de grens van een netwerk?
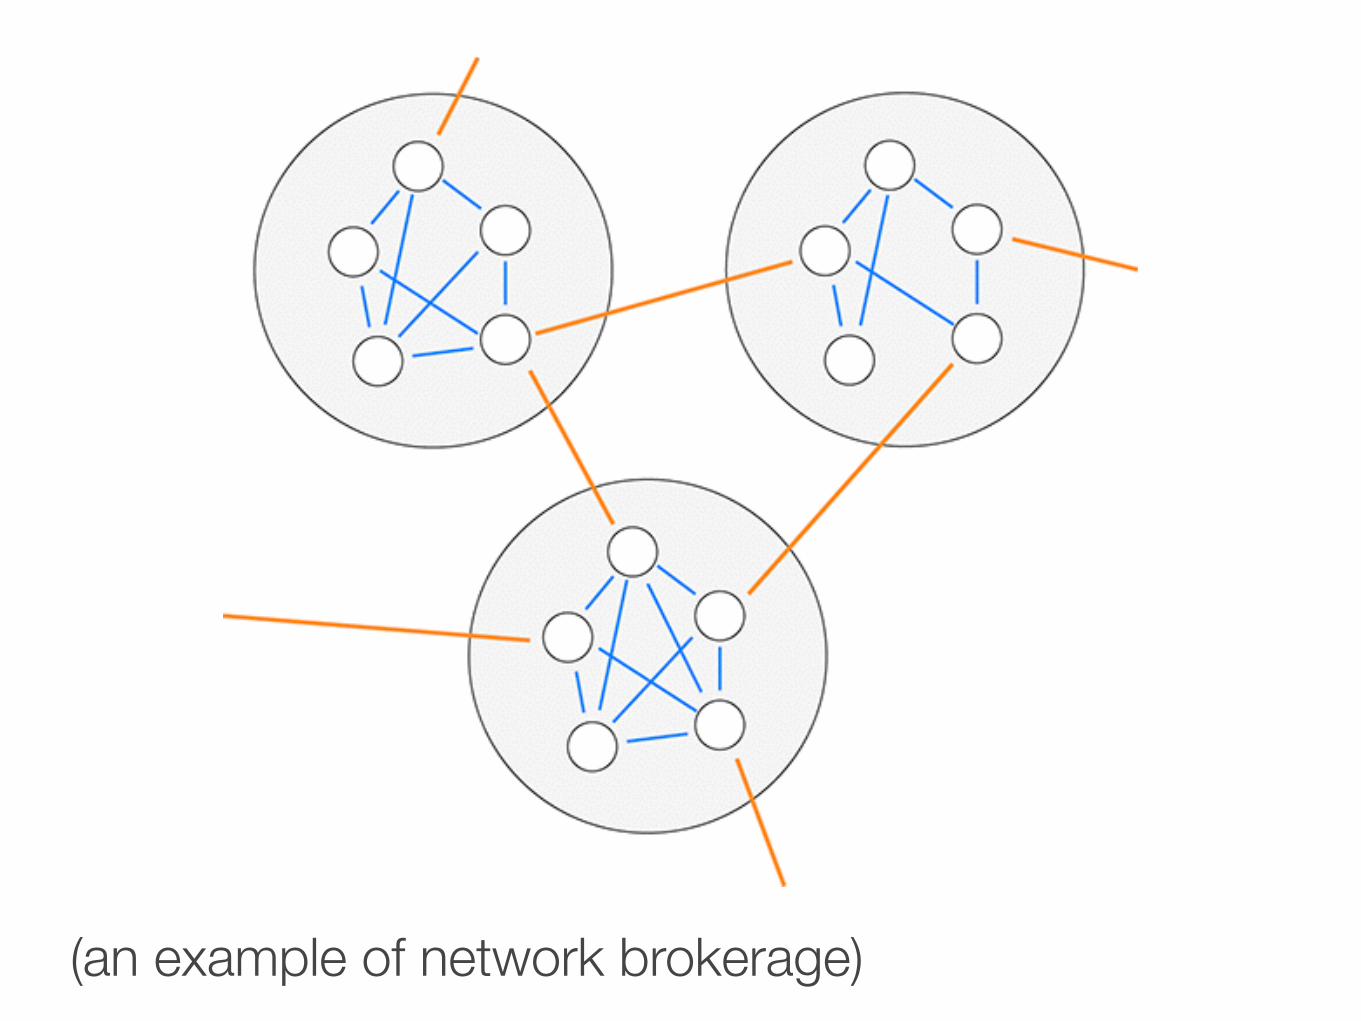
(an example of network brokerage)
About types of data
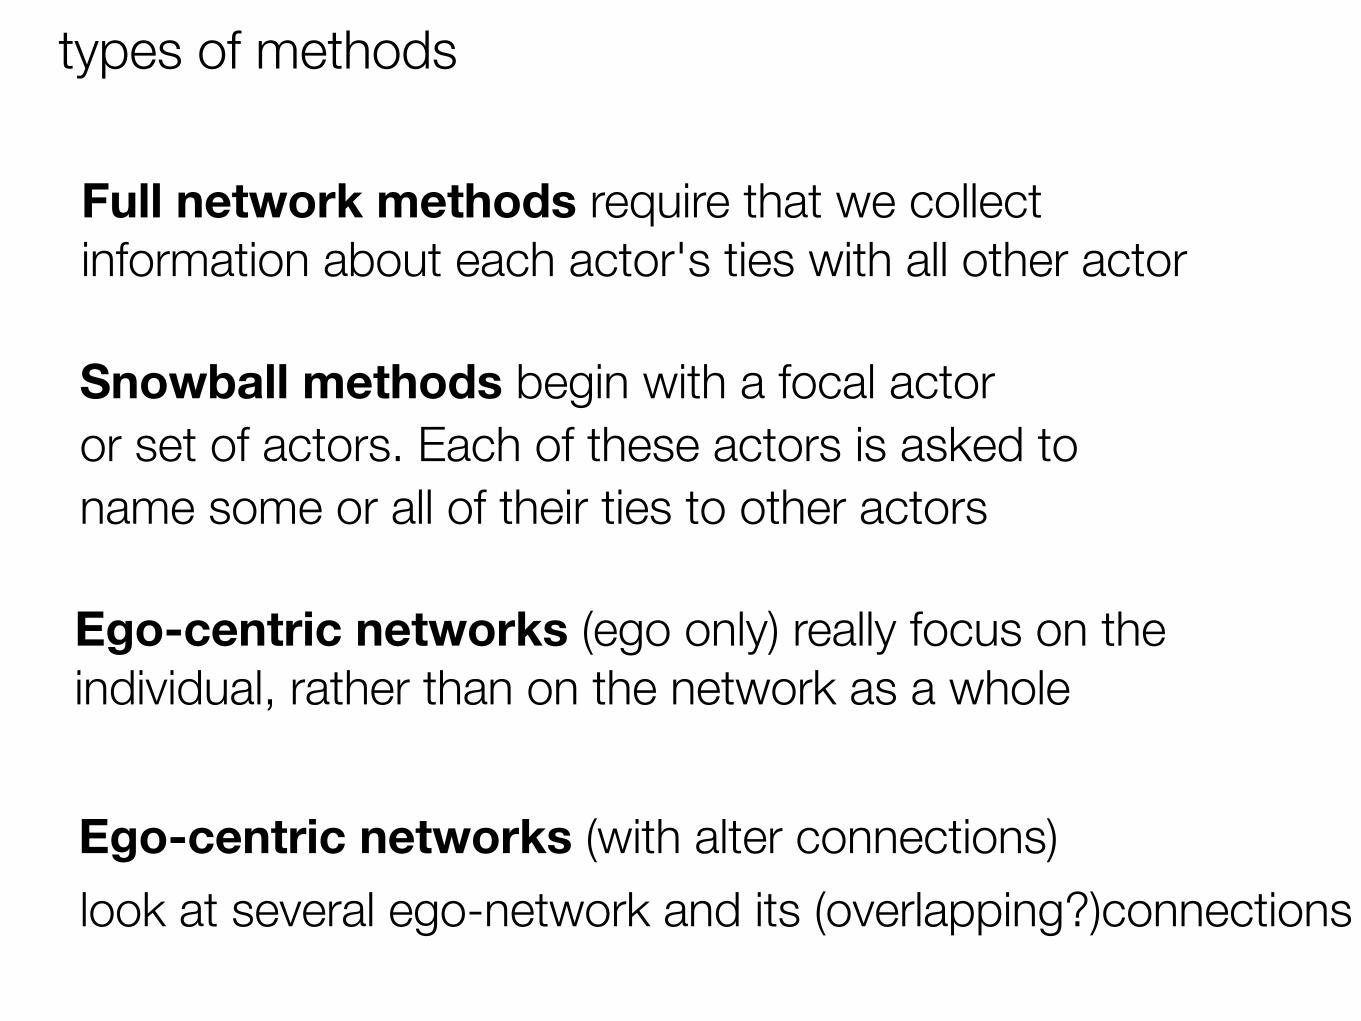
Full network methods require that we collect information about each actor's ties with all other actor
Snowball methods begin with a focal actor or set of actors. Each of these actors is asked to name some or all of their ties to other actors
Ego-centric networks (with alter connections)
Ego-centric networks (ego only) really focus on the individual, rather than on the network as a whole
look at several ego-network and its (overlapping?)connections
types of methods

About arrays

scales of data
Binary measures of relations:
Multiple-category nominal measures of relations:
Grouped ordinal measures of relations:
Full-rank ordinal measures of relations:
Interval measures of relations:
0/1, true/false
good friend/acquaintance/stranger
like/dislike/neutral, simple/oke/difficult
0-1-2-3-4-5-6-7-8-9
0-10/10-20/25 or higher

Oefening 2: Facebook netwerken

De te nemen stappen (mits je een Facebook account hebt) > ga naar Netvizz (Google Netvizz) > log in op Netvizz via je Facebook account > daarna zie je dit:


> kies 1 van de eerste 2 opties: informatie over pagina’s of groepen > download het GFX (Gephi) bestand en/of de CSV
GEPHI > Open Gephi en open het zojuist gedownloade bestand OF rechtermuis op het bestand > openen met… > geef > als het goed is, zie je nu dit:
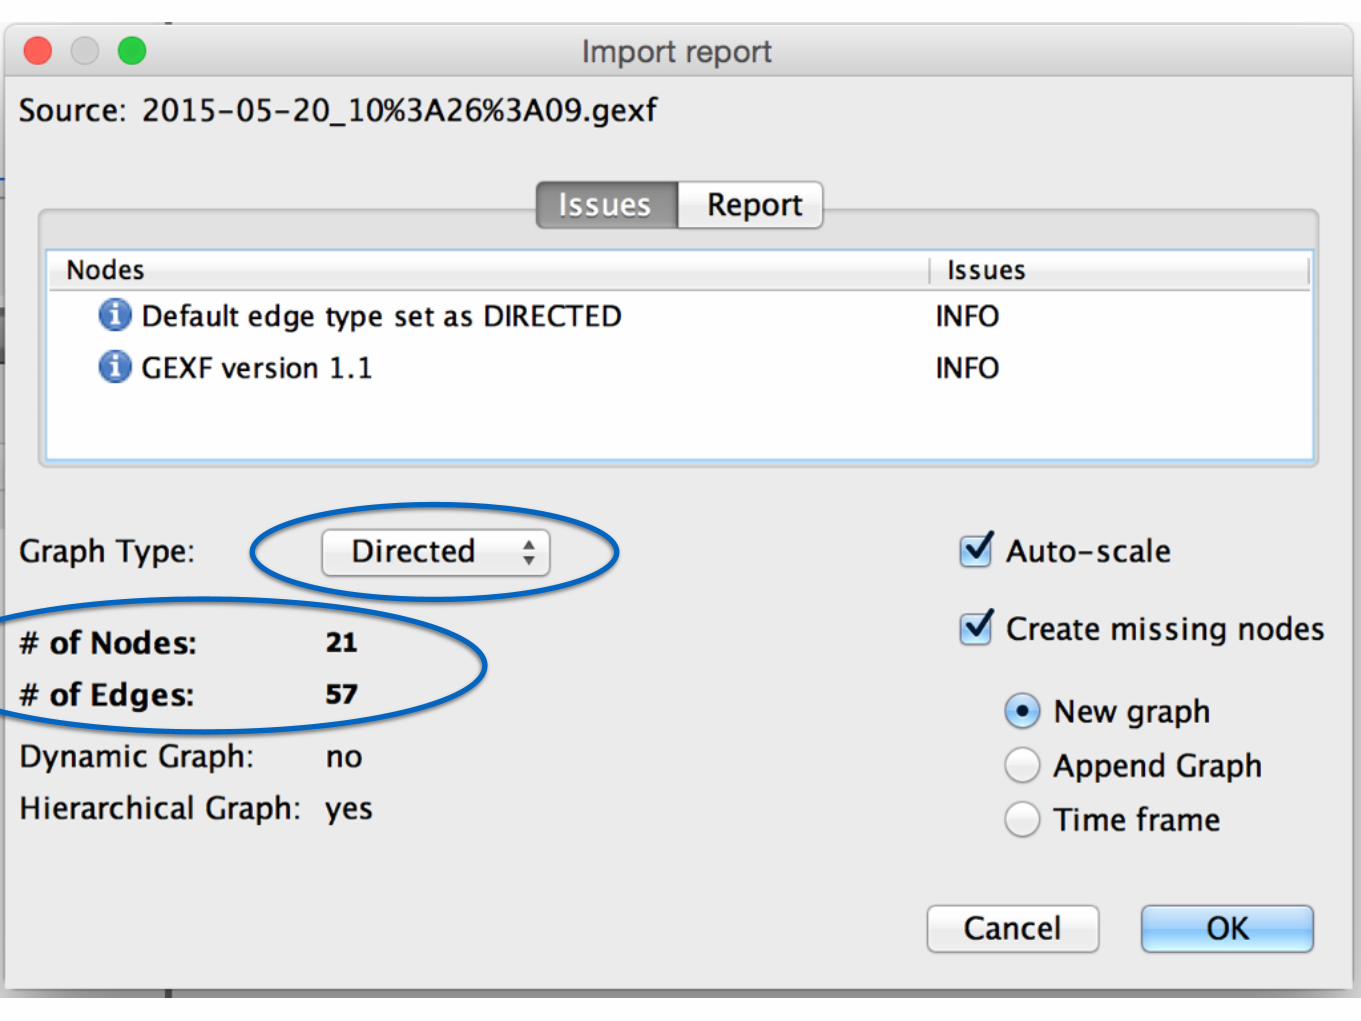
> Merk op dat je hier de termen “node” en “edge” terugziet > verander niets en klik op “OK” > nu zie je waarschijnlijk zoiets als dit:

dit zijn statistische analyses
(kun je even vergeten)dit is het visuele venster
dit is het layout- aanpassingen menu

In Gephi kun je van alles (en het duurt te lang om alles uit te leggen), maar om je netwerk meer inzichtelijk te maken, probeer de volgende stappen zoals hier omschreven:
http://www.obviousleaks.org/step-by-step-gephi-tutorial/
en een iets moeilijkere hier:
https://persuasionradio.wordpress.com/2010/05/06/using-netvizz-gephi-to-analyze-a-facebook-network/
Neem hier de tijd voor (half uur- 40 minuten)
> zet je resultaat (screenshot) weer op de google drive

bekijk ook je eigen profiel via “wolfram alpha”!
http://www.wolframalpha.com/facebook/
Oefening 3: Open Data in Tableau

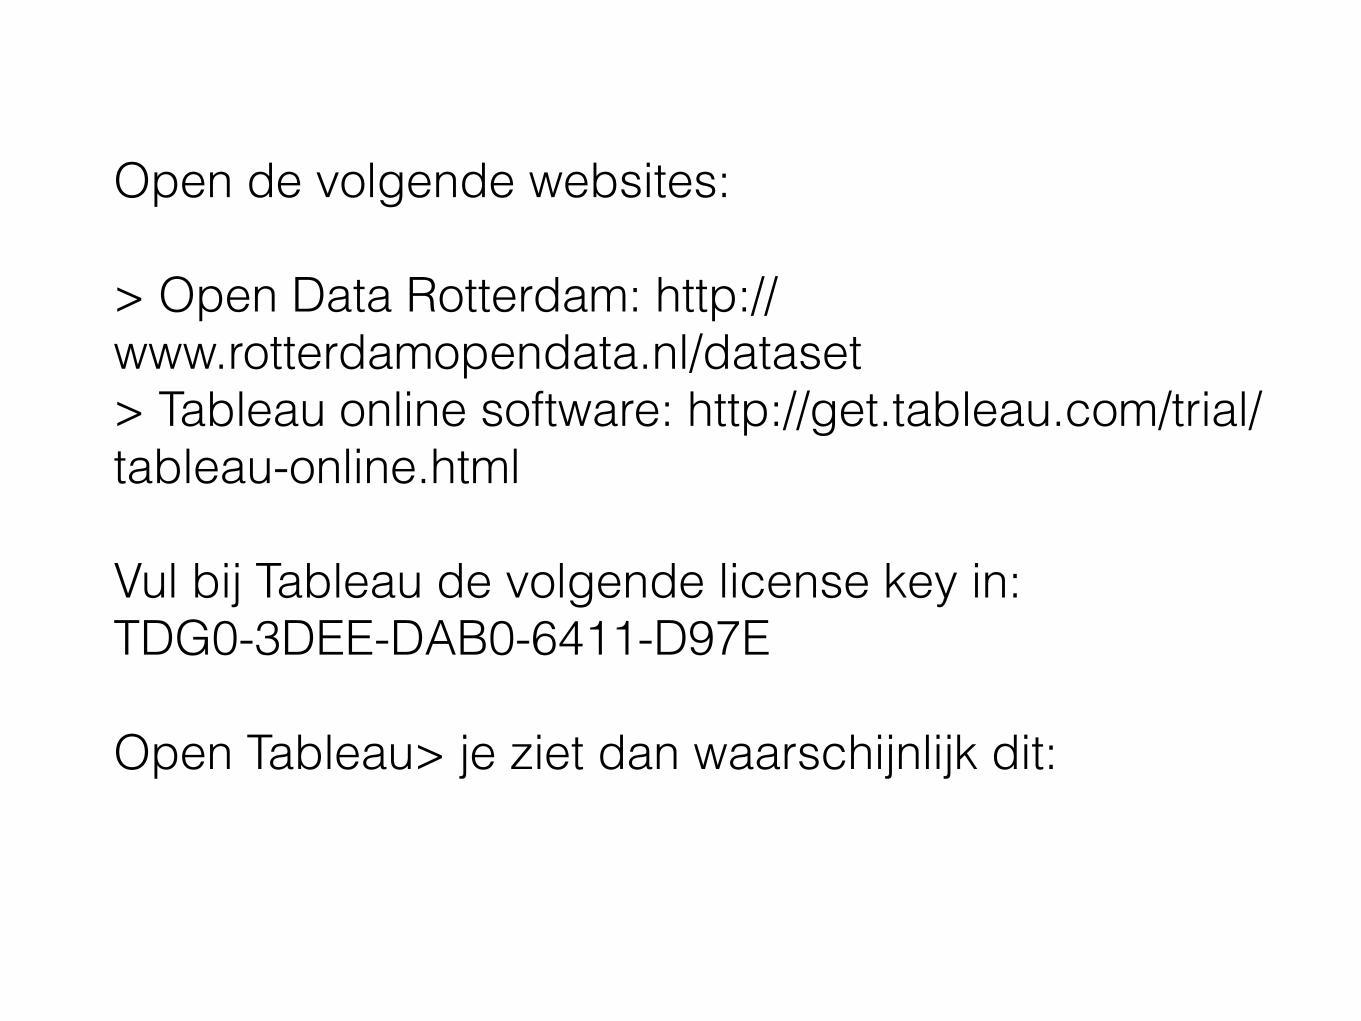
Open de volgende websites:
> Open Data Rotterdam: http://www.rotterdamopendata.nl/dataset > Tableau online software: http://get.tableau.com/trial/tableau-online.html
Vul bij Tableau de volgende license key in: TDG0-3DEE-DAB0-6411-D97E
Open Tableau> je ziet dan waarschijnlijk dit:

• Landing Page: http://www.tableau.com/tft/activation • Desktop Key: TDG0-3DEE-DAB0-6411-D97E • Instructions: Click on the link above and select Get
Started. On the form, enter your university email address for “Business email”; and under "Organization", please input the name of your school.

Het parkeervoorbeeld:
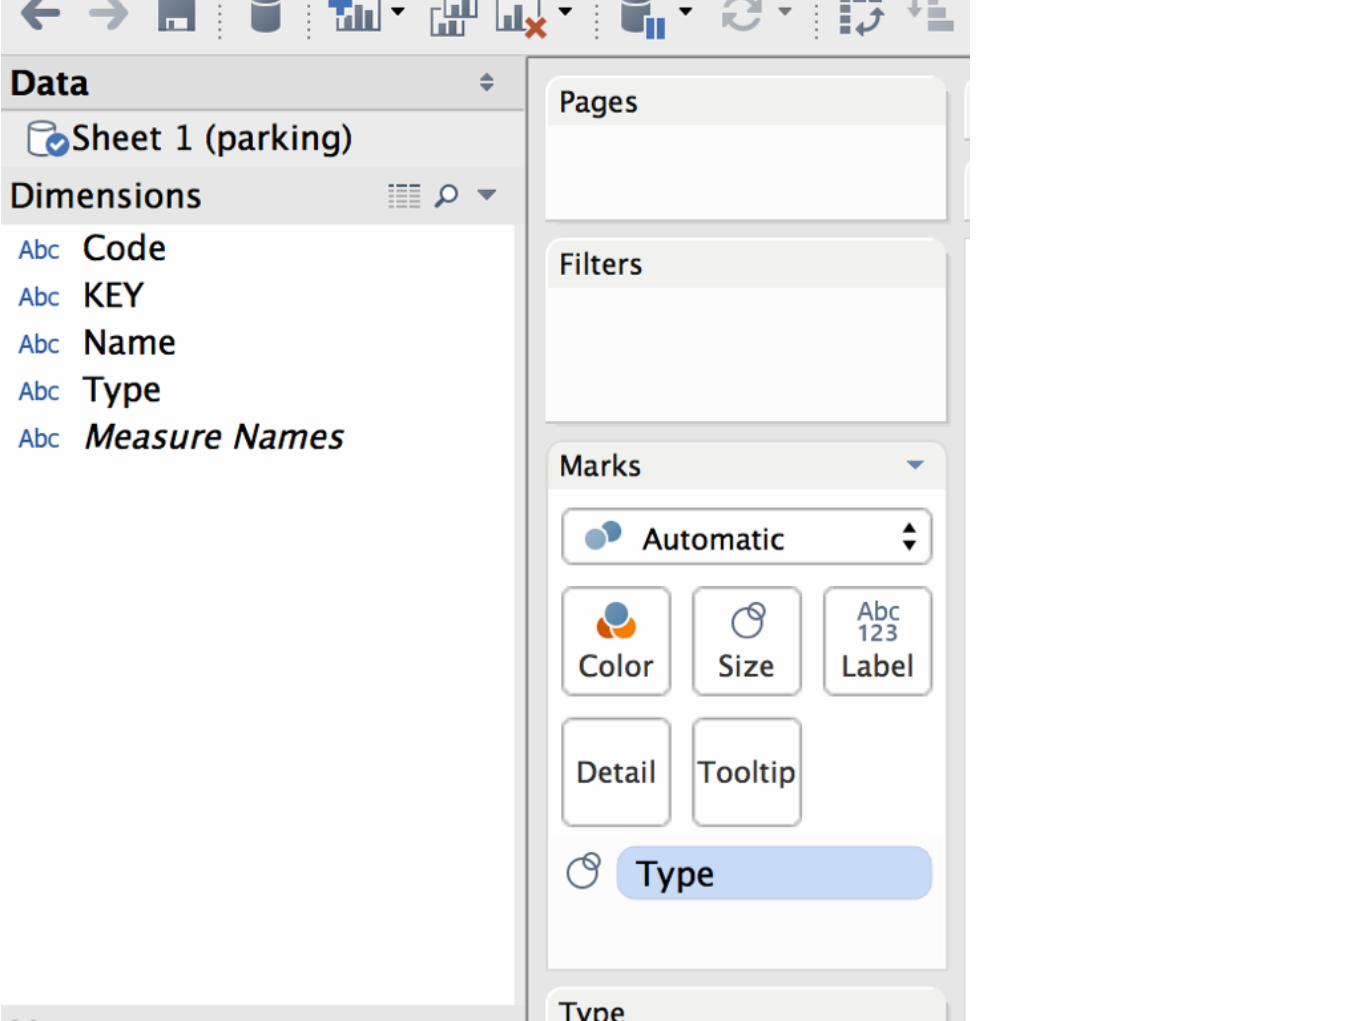
> er zijn 3 bestanden in CSV formaat te vinden op Opendata Rotterdam. > download deze 3 bestanden. > open ze in excel (of vergelijkbaars, bijvoorbeeld Numbers of OpenOffice) > Sla de bestanden op als .xls of .xlsx > Open ‘parking.xls’ in Tableau > druk op ‘go to worksheet’


De latitude en longitude staan nog op “#”: hier moet je geografische waardes van maken.
> klik op de variabele > change geographical role > latitude (je doet hetzelfde voor long) > daarna dubbelklik of sleep je lat en long naar de balk ‘rows en ‘columns’ > sleep aan de linkerkantboven de dimensies type of name naar Marks> size of Marks> color > wat zie je nu? > verander en speel met variabelen en visualisaties on te zien wat je te weten kunt komen
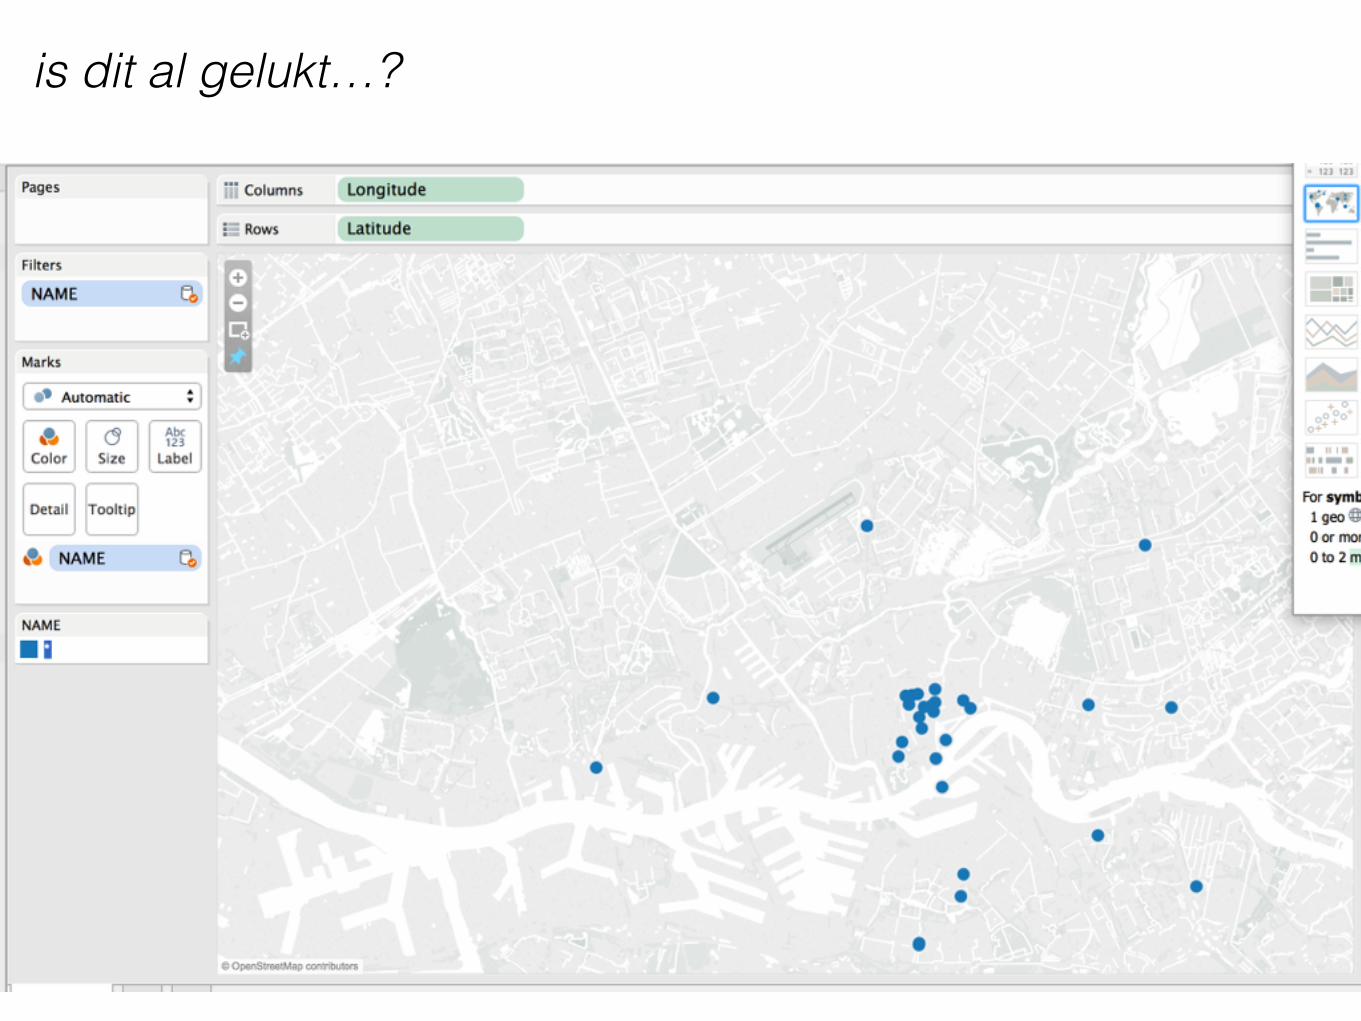
is dit al gelukt…?
Een volgende stap is om relaties te vinden in verschillende datasets
> Ga naar ‘connect to data’ > sleep en/of selecteer het bestand “parkeer cluster” > “go to worksheet”
q: wat is de ‘brugvariabele’ tussen deze twee datasets?
> probeer de clusters op de kaart te krijgen en/of informatie uit de tweede dataset te combineren met de eerste
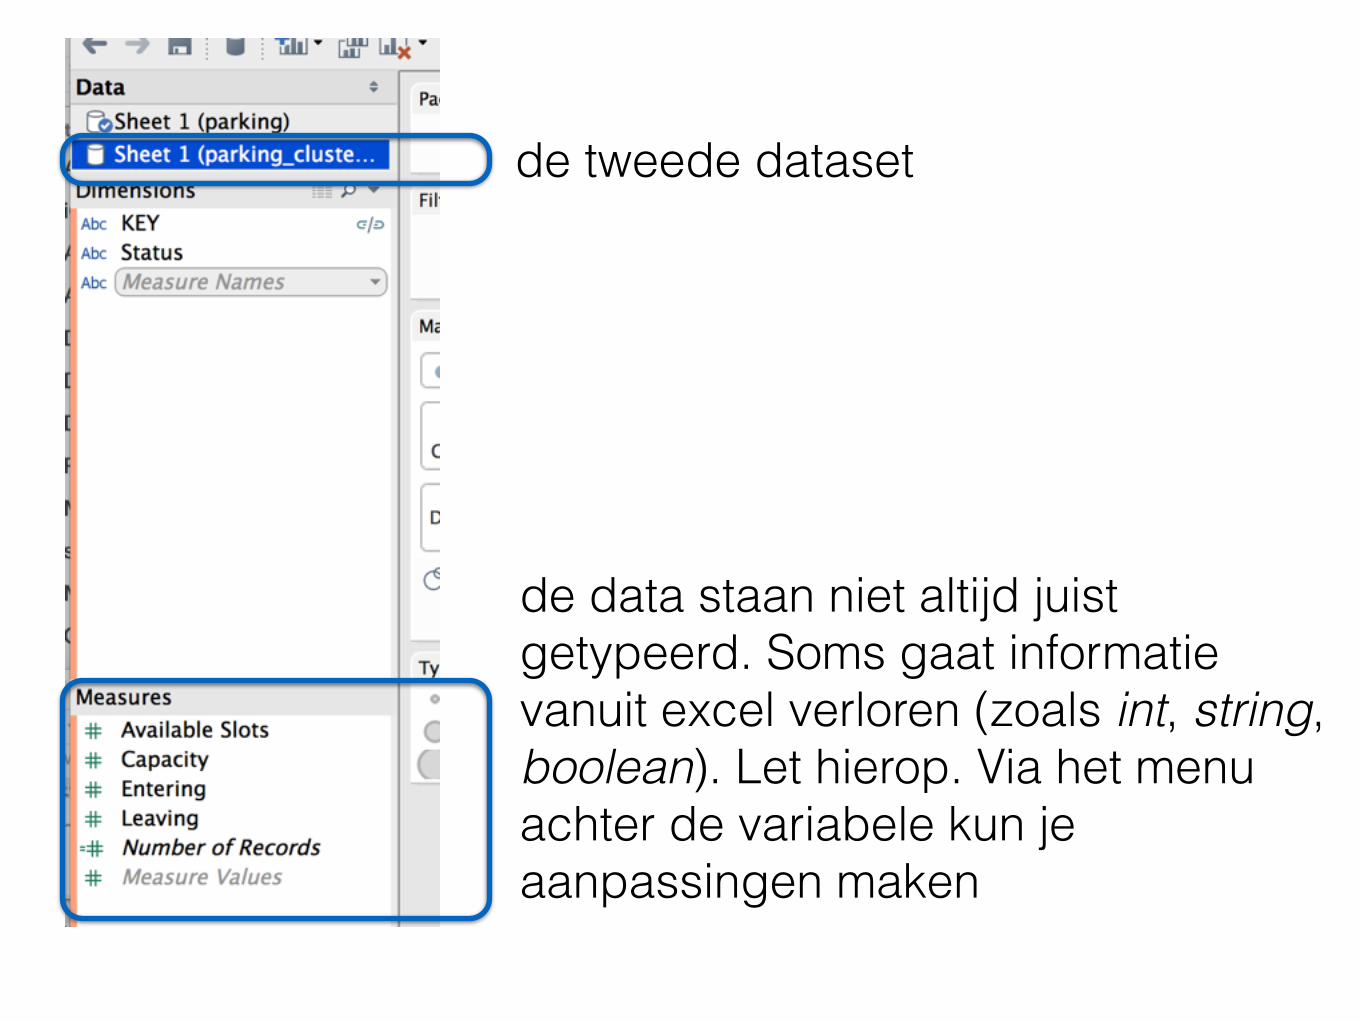
de tweede dataset
de data staan niet altijd juist getypeerd. Soms gaat informatie vanuit excel verloren (zoals int, string, boolean). Let hierop. Via het menu achter de variabele kun je aanpassingen maken

> probeer verschillende variabelen en visualisaties
> maak screenshots en zet deze weer op de google drive!
(kort) Taxonomie van visualisaties
http://www.dutchcowboys.nl/design/30037
> visualisaties zijn er allerlei soorten en maten, maar hoeveel soorten en maten (en wat voor soort soorten?)
waarom visualisaties?

> http://guides.library.duke.edu/vis_types
> http://www.datalabs.com.au/articles/15-most-common-types-of-data-visualisation/
twee links naar goede overzichten:

hoe zien computers ons? <optioneel> << misschien op de 25e>>

> ga naar de DMI website > zoek naar de “trackertracker” > vul de url in waarnaar je wilt zoeken > zet de ‘trackertracker’ op n+1 (weet je nog, het bepalen van de grootte van je netwerk?) > als de ‘trackertracker’ klaar, is, download bij ‘output’ het GEFX bestand > open het in Gephi > probeer zoiets te krijgen:


Linkshttp://gephi.github.io/users/install/https://www.tableau.com/products/trial(de Google Drive):
http://bit.ly/1PZ0b5Zhttp://www.cbs.nl/nl-NL/menu/publicaties/webpublicaties/interactief/default.htm
https://onzetaal.nl/taaladvies/advies/woordfrequentie
https://docs.google.com/document/d/1AlJd_ZXL9QQuXscf467HpeeseK6JXm1FMui6tku5EzQ/edit
Related Documents