F-1 NETSOL TECHNOLOGIES, INC. AND SUBSIDIARIES INDEX TO CONSOLIDATED FINANCIAL STATEMENTS Description Page Report of Independent Registered Public Accounting Firm ...................................................................... F-2 Financial Statements Consolidated Balance Sheets as of June 30, 2015 and 2014...................................................................... F-3 Consolidated Statements of Operations and Comprehensive Income (Loss) for the Years Ended June 30, 2015 and 2014 ............................................................................................. F-4 Consolidated Statement of Equity for the Years Ended June 30, 2015 and 2014 ...................................... F-5 Consolidated Statements of Cash Flows for the Years Ended June 30, 2015 and 2014 ............................ F-7 Notes to Consolidated Financial Statements .............................................................................................. F-9

Welcome message from author
This document is posted to help you gain knowledge. Please leave a comment to let me know what you think about it! Share it to your friends and learn new things together.
Transcript

F-1
NETSOL TECHNOLOGIES, INC. AND SUBSIDIARIES
INDEX TO CONSOLIDATED FINANCIAL STATEMENTS
Description Page
Report of Independent Registered Public Accounting Firm ...................................................................... F-2
Financial Statements
Consolidated Balance Sheets as of June 30, 2015 and 2014 ...................................................................... F-3
Consolidated Statements of Operations and Comprehensive Income (Loss)
for the Years Ended June 30, 2015 and 2014 ............................................................................................. F-4
Consolidated Statement of Equity for the Years Ended June 30, 2015 and 2014 ...................................... F-5
Consolidated Statements of Cash Flows for the Years Ended June 30, 2015 and 2014 ............................ F-7
Notes to Consolidated Financial Statements .............................................................................................. F-9

F-2
REPORT OF INDEPENDENT REGISTERED PUBLIC ACCOUNTING FIRM
Board of Directors
NetSol Technologies, Inc. and subsidiaries
Calabasas, California
We have audited the accompanying consolidated balance sheets of NetSol Technologies, Inc. and
subsidiaries (the “Company”) as of June 30, 2015 and 2014, and the related consolidated statements
of operations, comprehensive income (loss), stockholders’ equity and cash flows for each of the two
years in the period then ended. These financial statements are the responsibility of the Company’s
management. Our responsibility is to express an opinion on these consolidated financial statements
based on our audits.
We conducted our audits of these statements in accordance with the standards of the Public Company
Accounting Oversight Board (United States). Those standards require that we plan and perform the
audit to obtain reasonable assurance about whether the consolidated financial statements are free of
material misstatement. An audit includes examining, on a test basis, evidence supporting the amounts
and disclosures in the financial statements, assessing the accounting principles used and significant
estimates made by management, as well as evaluating the overall financial statement presentation. We
believe that our audits provide a reasonable basis for our opinion.
In our opinion, the consolidated financial statements referred to above present fairly, in all material
respects, the consolidated financial position of NetSol Technologies, Inc. and subsidiaries as of June
30, 2015 and 2014 and the results of their operations and their cash flows for each of the two years in
the period then ended in conformity with accounting principles generally accepted in the United
States of America.
Los Angeles, CA
September 15, 2015
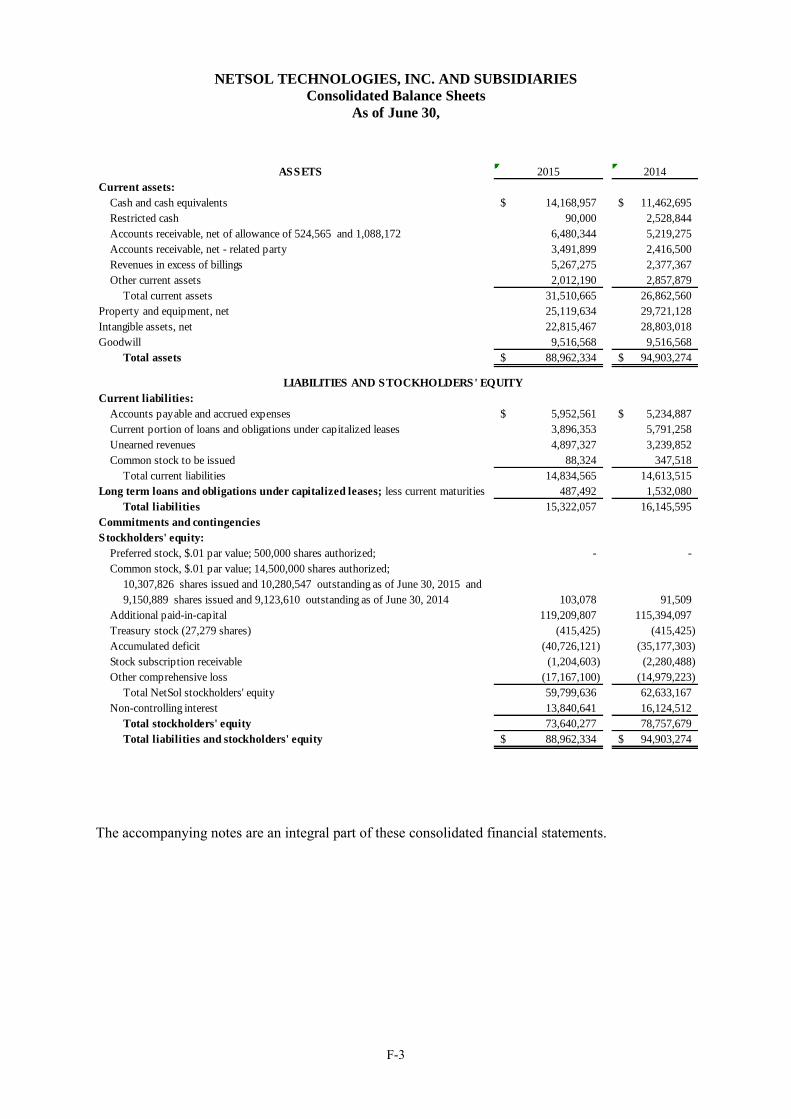
NETSOL TECHNOLOGIES, INC. AND SUBSIDIARIES
Consolidated Balance Sheets
As of June 30,
F-3
ASSETS 2015 2014
Current assets:
Cash and cash equivalents 14,168,957$ 11,462,695$
Restricted cash 90,000 2,528,844
Accounts receivable, net of allowance of 524,565 and 1,088,172 6,480,344 5,219,275
Accounts receivable, net - related party 3,491,899 2,416,500
Revenues in excess of billings 5,267,275 2,377,367
Other current assets 2,012,190 2,857,879
Total current assets 31,510,665 26,862,560
Property and equipment, net 25,119,634 29,721,128
Intangible assets, net 22,815,467 28,803,018
Goodwill 9,516,568 9,516,568
Total assets 88,962,334$ 94,903,274$
LIABILITIES AND STOCKHOLDERS' EQUITY
Current liabilities:
Accounts payable and accrued expenses 5,952,561$ 5,234,887$
Current portion of loans and obligations under capitalized leases 3,896,353 5,791,258
Unearned revenues 4,897,327 3,239,852
Common stock to be issued 88,324 347,518
Total current liabilities 14,834,565 14,613,515
Long term loans and obligations under capitalized leases; less current maturities 487,492 1,532,080
Total liabilities 15,322,057 16,145,595
Commitments and contingencies
Stockholders' equity:
Preferred stock, $.01 par value; 500,000 shares authorized; - -
Common stock, $.01 par value; 14,500,000 shares authorized;
10,307,826 shares issued and 10,280,547 outstanding as of June 30, 2015 and
9,150,889 shares issued and 9,123,610 outstanding as of June 30, 2014 103,078 91,509
Additional paid-in-capital 119,209,807 115,394,097
Treasury stock (27,279 shares) (415,425) (415,425)
Accumulated deficit (40,726,121) (35,177,303)
Stock subscription receivable (1,204,603) (2,280,488)
Other comprehensive loss (17,167,100) (14,979,223)
Total NetSol stockholders' equity 59,799,636 62,633,167
Non-controlling interest 13,840,641 16,124,512
Total stockholders' equity 73,640,277 78,757,679
Total liabilities and stockholders' equity 88,962,334$ 94,903,274$
The accompanying notes are an integral part of these consolidated financial statements.

NETSOL TECHNOLOGIES, INC. AND SUBSIDIARIES
Consolidated Statements of Operations
For the Years Ended June 30,
F-4
2015 2014
Net Revenues:
License fees 6,328,989$ 5,433,053$
Maintenance fees 12,196,073 10,034,681
Services 24,827,822 15,230,708
Maintenance fees - related party 395,951 492,535
Services - related party 7,299,743 5,193,826
Total net revenues 51,048,578 36,384,803
Cost of revenues:
Salaries and consultants 19,289,536 15,621,806
Travel 2,374,864 1,705,554
Depreciation and amortization 8,336,857 6,844,588
Other 3,020,107 3,548,392
Total cost of revenues 33,021,364 27,720,340
Gross profit 18,027,214 8,664,463
Operating expenses:
Selling and marketing 6,092,530 4,572,108
Depreciation and amortization 2,006,957 1,886,148
General and administrative 14,778,641 15,046,328
Research and development cost 314,892 249,712
Total operating expenses 23,193,020 21,754,296
Loss from operations (5,165,806) (13,089,833)
Other income and (expenses)
Loss on sale of assets (64,598) (229,805)
Interest expense (166,962) (255,677)
Interest income 331,432 261,251
Gain (loss) on foreign currency exchange transactions (453,770) 50,777
Share of net loss from equity investment - (545,483)
Other income 684,030 50,578
Total other income (expenses) 330,132 (668,359)
Net loss before income taxes (4,835,674) (13,758,192)
Income tax provision (413,498) (338,282)
Net loss from continuing operations (5,249,172) (14,096,474)
Income from discontinued operations - 1,158,752
Net loss (5,249,172) (12,937,722)
Non-controlling interest (299,646) 1,581,675
Net loss attributable to NetSol (5,548,818)$ (11,356,047)$
Amount attributable to NetSol common shareholders:
Loss from continuing operations (5,548,818)$ (12,514,799)$
Income from discontinued operations - 1,158,752
Net loss (5,548,818)$ (11,356,047)$
Net loss per share:
Net loss per share from continuing operations:
Basic (0.57)$ (1.38)$
Diluted (0.57)$ (1.38)$
Net income per share from discontinued operations:
Basic -$ 0.13$
Diluted -$ 0.13$
Net loss per common share
Basic (0.57)$ (1.25)$
Diluted (0.57)$ (1.25)$
Weighted average number of shares outstanding
Basic 9,728,122 9,063,345
Diluted 9,728,122 9,063,345
The accompanying notes are an integral part of these consolidated financial statements.

NETSOL TECHNOLOGIES, INC. AND SUBSIDIARIES
Consolidated Statements of Comprehensive Income (Loss)
For the Years Ended June 30,
F-5
For the Year
Ended June 30,
2015 2014
Net loss (5,548,818)$ (11,356,047)$
Other comprehensive income (loss):
Translation adjustment (3,239,086) 1,129,441
Comprehensive income (loss) (8,787,904) (10,226,606)
Comprehensive income (loss) attributable to non-controlling interest (1,051,209) 394,552
Comprehensive income (loss) attributable to NetSol (7,736,695)$ (10,621,158)$
The accompanying notes are an integral part of these consolidated financial statements

NETSOL TECHNOLOGIES, INC. AND SUBSIDIARIES
Consolidated Statement of Stockholders’ Equity
For the Years Ended June 30, 2015 and 2014
F-6
Stock Other
Additional Sub- Compre- Non Total
Common Stock Paid-in Treasury Accumulated scriptions Shares to hensive Controlling Stockholders'
Shares Amount Capital Shares Deficit Receivable be Issued Loss Interest Equity
Balance at
June 30, 2013 8,929,523 89,295$ 114,292,510$ (415,425)$ (23,821,256)$ (2,280,488)$ -$ (15,714,112)$ 17,271,263$ 89,421,787
Exercise of common
stock options 112,793 1,129 708,306 - - - - - - 709,435
Exercise of subsidiary common
stock options - - (823,048) - - - - - 1,179,077 356,029
Common stock issued for:
Services 81,573 815 816,602 - - - 259,193 - - 1,076,610
Common stock issued for:
accounts payable 27,000 270 209,790 - - - - - - 210,060
Equity component shown as
current liability at
June 30, 2013 - - - - - - 88,325 - - 88,325
June 30, 2014 - - - - - - (347,518) - - (347,518)
Fair value
of options issued - - 189,937 - - - - - - 189,937
Acquisition of non controlling
interest in subsidiary - - - - - - - - (95,254) (95,254)
Dividend
to non controlling interest - - - - - - - - (1,008,543) (1,008,543)
Adjustment of financing cost - - - - - - - - -
Sale of subsidiary (34,908) (34,908)
Foreign currency
translation adjustment - - - - - - - 734,889 394,552 1,129,441
Net loss for the year - - - - (11,356,047) - - (1,581,675) (12,937,722)
Balance at
June 30, 2014 9,150,889 91,509$ 115,394,097$ (415,425)$ (35,177,303)$ (2,280,488)$ -$ (14,979,223)$ 16,124,512$ 78,757,679$
The accompanying notes are an integral part of these consolidated financial statements.
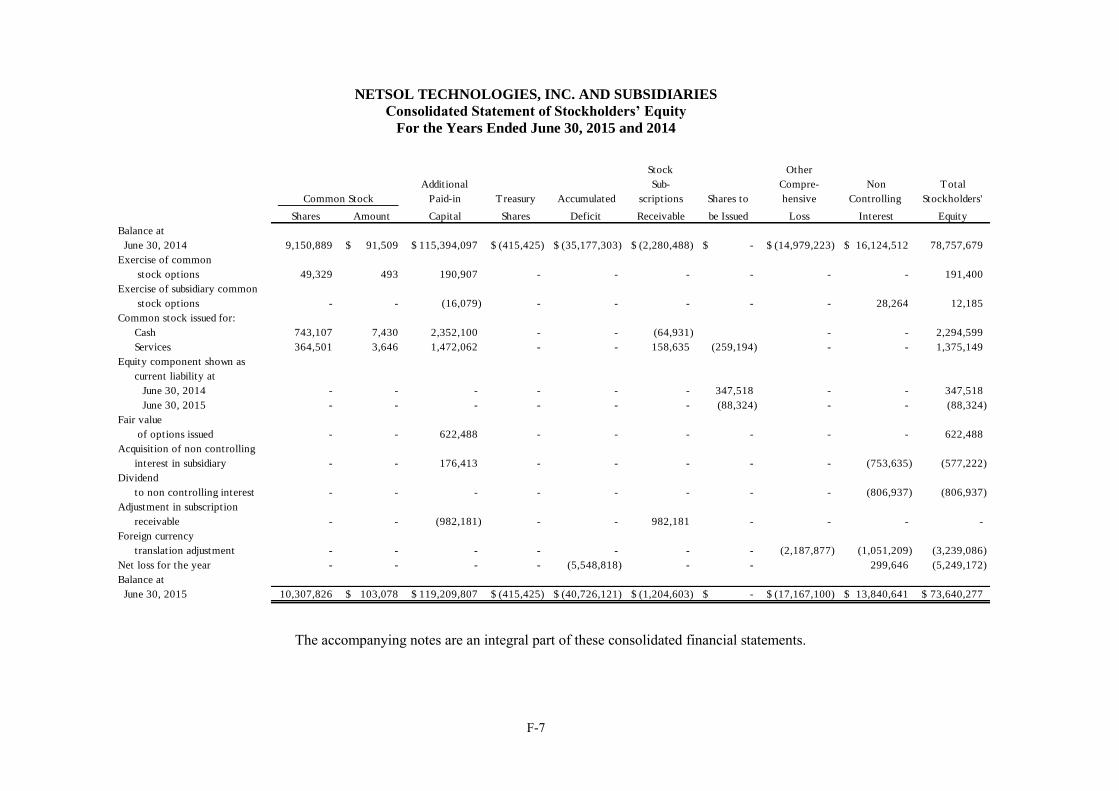
NETSOL TECHNOLOGIES, INC. AND SUBSIDIARIES
Consolidated Statement of Stockholders’ Equity
For the Years Ended June 30, 2015 and 2014
F-7
Stock Other
Additional Sub- Compre- Non Total
Common Stock Paid-in Treasury Accumulated scriptions Shares to hensive Controlling Stockholders'
Shares Amount Capital Shares Deficit Receivable be Issued Loss Interest Equity
Balance at
June 30, 2014 9,150,889 91,509$ 115,394,097$ (415,425)$ (35,177,303)$ (2,280,488)$ -$ (14,979,223)$ 16,124,512$ 78,757,679
Exercise of common
stock options 49,329 493 190,907 - - - - - - 191,400
Exercise of subsidiary common
stock options - - (16,079) - - - - - 28,264 12,185
Common stock issued for:
Cash 743,107 7,430 2,352,100 - - (64,931) - - 2,294,599
Services 364,501 3,646 1,472,062 - - 158,635 (259,194) - - 1,375,149
Equity component shown as
current liability at
June 30, 2014 - - - - - - 347,518 - - 347,518
June 30, 2015 - - - - - - (88,324) - - (88,324)
Fair value
of options issued - - 622,488 - - - - - - 622,488
Acquisition of non controlling
interest in subsidiary - - 176,413 - - - - - (753,635) (577,222)
Dividend
to non controlling interest - - - - - - - - (806,937) (806,937)
Adjustment in subscription
receivable - - (982,181) - - 982,181 - - - -
Foreign currency
translation adjustment - - - - - - - (2,187,877) (1,051,209) (3,239,086)
Net loss for the year - - - - (5,548,818) - - 299,646 (5,249,172)
Balance at
June 30, 2015 10,307,826 103,078$ 119,209,807$ (415,425)$ (40,726,121)$ (1,204,603)$ -$ (17,167,100)$ 13,840,641$ 73,640,277$
The accompanying notes are an integral part of these consolidated financial statements.

NETSOL TECHNOLOGIES, INC. AND SUBSIDIARIES
Consolidated Statements of Cash Flows
For the Years Ended June 30,
F-8
2015 2014
Cash flows from operating activities:
Net loss (5,249,172)$ (12,937,722)$
Adjustments to reconcile net loss
to net cash provided by operating activities:
Depreciation and amortization 10,343,814 8,730,736
Provision for bad debts (434,928) 1,023,796
Share of net loss from investment under equity method - 545,483
Loss on sale of assets 64,598 229,805
Gain on sale of subsidiary - (1,870,871)
Stock issued for services 1,375,149 1,076,610
Fair market value of warrants and stock options granted 622,488 189,937
Impairment of goodwill - 136,762
Changes in operating assets and liabilities:
Accounts receivable (871,959) 7,094,977
Accounts receivable - related party (1,179,931) (309,773)
Revenues in excess of billing (3,013,730) 12,825,849
Other current assets 580,618 216,357
Accounts payable and accrued expenses 726,700 1,060,832
Unearned revenue 2,114,635 622,124
Net cash provided by operating activities 5,078,282 18,634,902
Cash flows from investing activities:
Purchases of property and equipment (3,558,712) (13,236,136)
Sales of property and equipment 1,102,615 88,641
Sale of subsidiary - 1,810,700
Purchase of non-controlling interest in subsidiaries (577,222) (17,852)
Increase in intangible assets - (3,385,151)
Net cash used in investing activities (3,033,319) (14,739,798)
Cash flows from financing activities:
Proceeds from sale of common stock 2,294,599 -
Proceeds from the exercise of stock options and warrants 191,400 709,435
Proceeds from exercise of subsidiary options 12,185 356,029
Restricted cash 2,438,844 (653,607)
Dividend paid by subsidiary to Non controlling interest (806,937) (1,008,543)
Proceeds from bank loans 1,410,313 3,244,382
Payments on capital lease obligations and loans - net (4,079,174) (2,880,840)
Net cash provided by (used in) financing activities 1,461,230 (233,144)
Effect of exchange rate changes (799,931) (73,583)
Net increase in cash and cash equivalents 2,706,262 3,588,377
Cash and cash equivalents, beginning of the period 11,462,695 7,874,318
Cash and cash equivalents, end of period 14,168,957$ 11,462,695$
The accompanying notes are an integral part of these consolidated financial statements.

NETSOL TECHNOLOGIES, INC. AND SUBSIDIARIES
Consolidated Statements of Cash Flows
For the Years Ended June 30,
F-9
For the Year
Ended June 30,
2015 2014
SUPPLEMENTAL DISCLOSURES:
Cash paid during the period for:
Interest 162,904$ 325,691$
Taxes 503,924$ 402,482$
NON-CASH INVESTING AND FINANCING ACTIVITIES:
Stock issued for the payment of vendors -$ 210,060$
982,181$ -$
Adjustment of uncollectable subscription receivable with additional paid
in capital
The accompanying notes are an integral part of these consolidated financial statements.
NETSOL TECHNOLOGIES, INC. AND SUBSIDIARIES
Notes to Consolidated Financial Statements
June 30, 2015 and 2014
F-10
NOTE 1 – ORGANIZATION AND DESCRIPTION OF BUSINESS
NetSol Technologies, Inc. and subsidiaries (collectively, the “Company”), formerly known as NetSol
International, Inc. and Mirage Holdings, Inc., was incorporated under the laws of the State of Nevada
on March 18, 1997. During November 1998, Mirage Collections, Inc., a wholly owned and non-
operating subsidiary, was dissolved.
The Company designs, develops, markets, and exports proprietary software products to customers in
the automobile finance and leasing, banking, healthcare, and financial services industries worldwide.
The Company also provides system integration, consulting, IT products and services in exchange for
fees from customers.
NOTE 2 – SUMMARY OF SIGNIFICANT ACCOUNTING POLICIES
(A) Principles of Consolidation
The accompanying consolidated financial statements include the accounts of the Company as follows:
Wholly-owned Subsidiaries
NetSol Technologies Americas, Inc. (“NTA”)
NetSol Technologies Limited (“NetSol UK”)
NetSol Technologies Australia Pty Limited (“NetSol Australia”)
NetSol Technologies Europe Limited (“NTE”)
NTPK (Thailand) Co. Limited (“NTPK Thailand”)
NetSol Technologies Thailand Limited (“NetSol Thai”)
NetSol Connect (Private), Ltd. (“Connect”)
NetSol Technologies (Beijing) Co. Ltd. (NetSol Beijing)
NetSol Omni (Private) Ltd. (“Omni”)
NetSol Technologies (GmbH) (“NTG”)
Majority-owned Subsidiaries
NetSol Technologies, Ltd. (“NetSol PK”)
NetSol Innovation (Private) Limited (“NetSol Innovation”)
Vroozi, Inc. (“Vroozi”) – discontinued on March 31, 2014
Virtual Lease Services Holdings Limited (“VLSH”)
Virtual Lease Services Limited (“VLS”)
Virtual Lease Services (Ireland) Limited (VLSIL)
The Company consolidates any variable interest entities of which it is the primary beneficiary. Equity
investments through which the Company exercises significant influence over but does not control the
investee and is not the primary beneficiary of the investee’s activities are accounted for using the
equity method. Investments through which the Company is not able to exercise significant influence
over the investee and which do not have readily determinable fair values are accounted for under the
cost method. All material inter-company accounts have been eliminated in the consolidation.
NETSOL TECHNOLOGIES, INC. AND SUBSIDIARIES
Notes to Consolidated Financial Statements
June 30, 2015 and 2014
F-11
(B) Basis of Presentation
The accompanying consolidated financial statements are prepared in accordance with accounting
principles generally accepted in the United States of America (“US GAAP”) and pursuant to the rules
and regulations of the Securities and Exchange Commission (“SEC”).
(C) Use of Estimates
The preparation of consolidated financial statements in conformity with accounting principles
generally accepted in the United States of America requires management to make estimates and
assumptions that affect the reported amounts of assets and liabilities and disclosure of contingent
assets and liabilities at the date of the financial statements and the reported amounts of revenues and
expenses during the reporting period. Actual results could differ from those estimates.
(D) Cash and Cash Equivalents
Cash and cash equivalents include all highly liquid debt instruments with original maturities of three
months or less which are not securing any corporate obligations.
(E) Concentration of Credit Risk
Cash includes cash on hand and demand deposits in accounts maintained within the United States as
well as in foreign countries. Certain financial instruments, which subject the Company to
concentration of credit risk, consist of cash and restricted cash. The Company maintains balances at
financial institutions which, from time to time, may exceed Federal Deposit Insurance Corporation
insured limits for the banks located in the Unites States. Balances at financial institutions within
certain foreign countries are not covered by insurance. As of June 30, 2015 and 2014, the Company
had uninsured deposits related to cash deposits in accounts maintained within foreign entities of
approximately $8,969,443 and $8,399,136, respectively. The Company has not experienced any losses
in such accounts.
The Company’s operations are carried out globally. Accordingly, the Company's business, financial
condition and results of operations may be influenced by the political, economic and legal
environments of each country and by the general state of the country’s economy. The Company's
operations in each foreign country are subject to specific considerations and significant risks not
typically associated with companies in economically developed nations. These include risks
associated with, among others, the political, economic and legal environments and foreign currency
exchange. The Company's results may be adversely affected by changes in governmental policies with
respect to laws and regulations, anti-inflationary measures, currency conversion and remittance
abroad, and rates and methods of taxation, among other things.
(F) Restricted Cash
The Company has certificates of deposits (“CDs”) in various configurations and maturity dates with
Habib American Bank. A portion of these CDs are restricted as collateral to secure outstanding
balances on an existing line of credit, and become unrestricted to the extent that they are not required
for collateralization purposes. As of June 30, 2015 and 2014, the outstanding balance on the line of
NETSOL TECHNOLOGIES, INC. AND SUBSIDIARIES
Notes to Consolidated Financial Statements
June 30, 2015 and 2014
F-12
credit was $nil and $1,990,984, respectively, with a corresponding restriction to the CDs balances.
The line of credit had a maximum available balance of $2,000,000.
In addition, the Company has placed $90,000 in a savings account with HSBC as collateral against a
standby letter of credit issued by the bank in favor of the landlord for office space.
One of the Company’s subsidiary also has certificates of deposits with Habib American Bank. These
CDs are restricted as collateral to secure outstanding balances on an existing line of credit, and
become unrestricted to the extent that they are not required for collateralization purposes. As of June
30, 2015 and 2014, the outstanding balance on the line of credit was $nil and $447,860, respectively,
with a corresponding restriction to the CDs balances. The line of credit had a maximum available
balance of $500,000.
(G) Allowance for Doubtful Accounts
The Company maintains an allowance for doubtful accounts for estimated losses inherent in its
accounts receivable portfolio. In establishing the required allowance, management regularly reviews
the composition of accounts receivable and analyzes customer credit worthiness, customer
concentrations, current economic trends and changes in customer payment patterns. Reserves are
recorded primarily on a specific identification basis. Account balances are charged off against the
allowance after all means of collection have been exhausted and the potential for recovery is
considered remote. As of June 30, 2015 and 2014, the Company had recorded allowance for doubtful
accounts of $524,565 and $1,088,172, respectively.
(H) Revenues in Excess of Billings
Revenues in excess of billings represent the total of the project to be billed to the customer over the
revenues recognized per US GAAP. As the customers are billed under the terms of their contract, the
corresponding amount is transferred from this account to “Accounts Receivable.”
(I) Property and Equipment
Property and equipment are stated at cost. Expenditures for maintenance and repairs are charged to
earnings as incurred; additions, renewals and betterments are capitalized. When property and
equipment are retired or otherwise disposed of, the related cost and accumulated depreciation are
removed from the respective accounts, and any gain or loss is included in operations. Depreciation is
computed using various methods over the estimated useful lives of the assets, ranging from three to
twenty years. Following is the summery of estimated useful lives of the assets:
Category Estimated Useful Life
Computer Equipment 3 to 5 Years
Office furniture and equipment: 5 to 10 Years
Building 20 Years
Autos 5 Years
Assets under capital leases 3 to 10 Years
Improvements 5 to 10 Years

NETSOL TECHNOLOGIES, INC. AND SUBSIDIARIES
Notes to Consolidated Financial Statements
June 30, 2015 and 2014
F-13
The Company capitalizes costs of materials, consultants, and payroll and payroll-related costs for
employees incurred in developing internal-use computer software. These costs are included with
“Computer equipment and software.”
(J) Impairment of Long-Lived Assets
The Company tests long-lived assets for impairment whenever events or changes in circumstances
indicate that the carrying amount of an asset may not be recoverable through the estimated
undiscounted cash flows expected to result from the use and eventual disposition of the assets.
Whenever any such impairment exists, an impairment loss will be recognized for the amount by
which the carrying value exceeds the fair value.
(K) Intangible Assets
Intangible assets consist of product licenses, renewals, enhancements, copyrights, trademarks, trade
names, and customer lists. Intangible assets with finite lives are amortized over the estimated useful
life and are evaluated for impairment at least on an annual basis and whenever events or changes in
circumstances indicate that the carrying value may not be recoverable. The Company assesses
recoverability by determining whether the carrying value of such assets will be recovered through the
discounted expected future cash flows. If the future discounted cash flows are less than the carrying
amount of these assets, the Company recognizes an impairment loss based on the excess of the
carrying amount over the fair value of the assets.
(L) Software Development Costs
Costs incurred to internally develop computer software products or to enhance an existing product are
recorded as research and development costs and expensed when incurred until technological
feasibility for the respective product is established. Thereafter, all software development costs are
capitalized and reported at the lower of unamortized cost or net realizable value. Capitalization ceases
when the product or enhancement is available for general release to customers.
The Company makes on-going evaluations of the recoverability of its capitalized software projects by
comparing the amount capitalized for each product to the estimated present value of expected future
net income from the product. If such evaluations indicate that the unamortized software development
costs exceed the present value of expected future net income, the Company writes off the amount
which the unamortized software development costs exceed such present value. Capitalized and
purchased computer software development costs are being amortized ratably based on the projected
revenue associated with the related software or on a straight-line basis.
(M) Goodwill
Goodwill represents the excess of the aggregate purchase price over the fair value of the net assets
acquired in a purchase businesses combination. Goodwill is reviewed for impairment on an annual
basis, or more frequently if events or changes in circumstances indicate that the carrying amount of
goodwill may be impaired. The goodwill impairment test is a two-step test. Under the first step, the
fair value of the reporting unit is compared with its carrying value including goodwill. If the fair value
of the reporting unit exceeds its carrying value, step two does not need to be performed. If the fair
NETSOL TECHNOLOGIES, INC. AND SUBSIDIARIES
Notes to Consolidated Financial Statements
June 30, 2015 and 2014
F-14
value of the reporting unit is less than its carrying value, an indication of goodwill impairment exists
for the reporting unit and the enterprise must perform step two of the impairment test. Under step two,
an impairment loss is recognized for any excess of the carrying amount of the reporting unit’s
goodwill over the implied fair value of that goodwill. The implied fair value of goodwill is determined
by allocating the fair value of the reporting unit in a manner similar to a purchase price allocation. The
residual fair value after this allocation is the implied fair value of the reporting unit goodwill.
(N) Fair Value of Financial Instruments
The Company applies the provisions of ASC 820-10, “Fair Value Measurements and Disclosures.”
ASC 820-10 defines fair value, and establishes a three-level valuation hierarchy for disclosures of fair
value measurement that enhances disclosure requirements for fair value measures. For certain
financial instruments, including cash and cash equivalents, restricted cash, accounts receivable,
accounts payable and short-term debt, the carrying amounts approximate fair value due to their
relatively short maturities. The carrying amounts of the long-term debt approximate their fair values
based on current interest rates for instruments with similar characteristics.
The three levels of valuation hierarchy are defined as follows:
Level 1: Valuations consist of unadjusted quoted prices in active markets for identical assets and
liabilities and has the highest priority.
Level 2: Valuations rely on quoted prices in markets that are not active or observable inputs over the
full term of the asset or liability.
Level 3: Valuations are based on prices or third party or internal valuation models that require inputs
that are significant to the fair value measurement and are less observable and thus have the
lowest priority.
Management analyzes all financial instruments with features of both liabilities and equity under ASC
480, “Distinguishing Liabilities From Equity” and ASC 815, “Derivatives and Hedging.” Derivative
liabilities are adjusted to reflect fair value at each period end, with any increase or decrease in the fair
value being recorded in results of operations as adjustments to fair value of derivatives. The effects of
interactions between embedded derivatives are calculated and accounted for in arriving at the overall
fair value of the financial instruments. In addition, the fair values of freestanding derivative
instruments such as warrant and option derivatives are valued using the Black-Scholes model.
(O) Revenue Recognition
The Company recognizes revenue from license contracts without major customization when a non-
cancelable, non-contingent license agreement has been signed, delivery of the software has occurred,
the fee is fixed or determinable, and collectability is probable. Revenue from the sale of licenses with
major customization, modification, and development is recognized on a percentage of completion
method. Revenue from the implementation of software is recognized on a percentage of completion
method.
NETSOL TECHNOLOGIES, INC. AND SUBSIDIARIES
Notes to Consolidated Financial Statements
June 30, 2015 and 2014
F-15
Revenue from consulting services is recognized as the services are performed for time-and-materials
contracts. Revenue from training and development services is recognized as the services are
performed. Revenue from maintenance agreements is recognized ratably over the term of the
maintenance agreement, which in most instances is one year.
(P) Multiple Element Arrangements
The Company may enter into multiple element revenue arrangements in which a customer may
purchase a number of different combinations of software licenses, consulting services, maintenance
and support, as well as training and development.
Vendor specific objective evidence (“VSOE”) of fair value for each element is based on the price for
which the element is sold separately. The Company determines the VSOE of fair value of each
element based on historical evidence of the Company’s stand-alone sales of these elements to third-
parties or from the stated renewal rate for the elements contained in the initial software license
arrangement. When VSOE of fair value does not exist for any undelivered element, revenue is
deferred until the earlier of the point at which such VSOE of fair value exists or until all elements of
the arrangement have been delivered. The only exception to this guidance is when the only
undelivered element is maintenance and support or other services, then the entire arrangement fee is
recognized ratably over the performance period.
(Q) Unearned Revenue
Unearned revenue represents billings in excess of revenue earned on contracts and are recognized on a
pro-rata basis over the life of the contract. Unearned revenue was $4,897,327 and $3,239,852 as of
June 30, 2015 and 2014, respectively.
(R) Cost of Revenues
Cost of revenues includes salaries and benefits for technical employees, consultant costs, amortization
of capitalized computer software development costs, depreciation of computer and equipment, travel
costs, and indirect costs such as rent and insurance.
(S) Advertising Costs
The Company expenses the cost of advertising as incurred. Advertising costs for the years ended June
30, 2015 and 2014 were $250,801 and $237,391, respectively.
(T) Share-Based Compensation
The Company records stock compensation in accordance with ASC 718, Compensation – Stock
Compensation. ASC 718 requires companies to measure compensation cost for stock employee
compensation at fair value at the grant date and recognize the expense over the employee’s requisite
service period. The Company recognizes in the statement of operations the grant-date fair value of
stock options and other equity-based compensation issued to employees and non-employees.
NETSOL TECHNOLOGIES, INC. AND SUBSIDIARIES
Notes to Consolidated Financial Statements
June 30, 2015 and 2014
F-16
(U) Income Taxes
Income taxes are accounted for under the asset and liability method. Deferred tax assets and liabilities
are recognized for the future tax consequences attributable to differences between the financial
statement carrying amounts of existing assets and liabilities and their respective tax bases and
operating loss and tax credit carry forwards. Deferred tax assets and liabilities are measured using
enacted tax rates expected to apply to taxable income in the years in which those temporary
differences are expected to be recovered or settled. The effect on deferred tax assets and liabilities of a
change in tax rates is recognized in income in the period that includes the enactment date. A valuation
allowance is provided for deferred tax assets if it is more likely than not these items will either expire
before the Company is able to realize their benefits, or that future deductibility is uncertain.
When tax returns are filed, it is highly certain that some positions taken would be sustained upon
examination by the taxing authorities, while others are subject to uncertainty about the merits of the
position taken or the amount of the position that would be ultimately sustained. The benefit of a tax
position is recognized in the financial statements in the period during which, based on all available
evidence, management believes it is more likely than not that the position will be sustained upon
examination, including the resolution of appeals or litigation processes, if any. Tax positions taken are
not offset or aggregated with other positions. Tax positions that meet the more-likely-than-not
recognition threshold are measured as the largest amount of tax benefit that is more than 50 percent
likely of being realized upon settlement with the applicable taxing authority. The portion of the
benefits associated with tax positions taken that exceeds the amount measured as described above is
reflected as a liability for unrecognized tax benefits in the balance sheets along with any associated
interest and penalties that would be payable to the taxing authorities upon examination. Applicable
interest and penalties associated with unrecognized tax benefits are classified as additional income
taxes in the statements of operations.
(V) Foreign Currency Translation
The Company transacts business in various foreign currencies. The accounts of NetSol UK, NTE, VLSH
and VLS use the British Pound; VLSIL and NTG use the Euro; NetSol PK, Connect, Omni and
NetSol Innovation use Pakistan Rupees; NTPK Thailand and NetSol Thai use Thai Baht; NetSol
Australia uses the Australian dollar; and NetSol Beijing uses the Chinese Yuan as the functional
currencies. NetSol Technologies, Inc., and its subsidiaries, NTA and Vroozi, use the U.S. dollar as the
functional currency. Consequently, revenues and expenses of operations outside the United States are
translated into U.S. Dollars using average exchange rates while assets and liabilities of operations outside the
United States are translated into U.S. Dollars using exchange rates at the balance sheet date. The effects of
foreign currency translation adjustments are recorded to other comprehensive income. Accumulated
translation losses classified as an item of accumulated other comprehensive loss in the stockholders’
equity section of the consolidated balance sheets were $17,167,100 and $14,979,223 as of June 30,
2015 and 2014, respectively. During the years ended June 30, 2015 and 2014, comprehensive income
(loss) in the consolidated statements of operations included NetSol’s share of translation loss of
$2,187,877 and gain of $734,889, respectively.

NETSOL TECHNOLOGIES, INC. AND SUBSIDIARIES
Notes to Consolidated Financial Statements
June 30, 2015 and 2014
F-17
Net foreign exchange transaction gains (losses) included in non-operating income (expense) in the
accompanying consolidated statements of operations were $(453,770) and $50,777 for the years
ended June 30, 2015 and 2014, respectively.
(W) Statement of Cash Flows
The Company's cash flows from operations are calculated based upon the local currencies. As a result,
amounts related to assets and liabilities reported on the statement of cash flows will not necessarily
agree with changes in the corresponding balances on the consolidated balance sheet.
(X) Segment Reporting
The Company defines operating segments as components about which separate financial information
is available that is evaluated regularly by the chief operating decision maker in deciding how to
allocate resources and in assessing performances. The Company allocates its resources and assesses
the performance of its sales activities based on the geographic locations of its subsidiaries (see Note
17).
(Y) Reclassifications
Certain 2014 balances have been reclassified to conform to the 2015 presentation.
(Z) New Accounting Pronouncements
In April 2014, the Financial Accounting Standards Board (FASB) issued Accounting Standards Update (ASU)
2014-08, "Presentation of Financial Statements (Topic 205) and Property, Plant and Equipment (Topic
360)." ASU 2014-08 amends the requirements for reporting discontinued operations and requires additional
disclosures about discontinued operations. Under the new guidance, only disposals representing a strategic shift
in operations or that have a major effect on the Company's operations and financial results should be presented
as discontinued operations. This new accounting guidance is effective for annual periods beginning after
December 15, 2014. The Company is currently evaluating the impact of adopting ASU 2014-08 on the
Company's results of operations or financial condition.
In May 2014, the ("FASB") issued Accounting Standards Update ("ASU") 2014-09, Revenue from Contracts
with Customers, which provides a single comprehensive model for entities to use in accounting for revenue
arising from contracts with customers and will supersede most current revenue recognition guidance. The
standard’s core principle is that a company will recognize revenue when it transfers promised goods or services
to customers in an amount that reflects the consideration to which the company expects to be entitled in
exchange for those goods or services. In August 2015, the FASB deferred the effective date of the new revenue
standard by one year, which will make it effective for the Company in the first quarter of its fiscal year ending
June 30, 2019. The Company is currently in the process of evaluating the impact of adoption of this ASU on its
consolidated financial statements.
In June 2014, the FASB issued Accounting Standards Update No. 2014-12, Compensation — Stock
Compensation (Topic 718), Accounting for Share-Based Payments When the Terms of an Award
Provide That a Performance Target Could Be Achieved after the Requisite Service Period (a
NETSOL TECHNOLOGIES, INC. AND SUBSIDIARIES
Notes to Consolidated Financial Statements
June 30, 2015 and 2014
F-18
consensus of the FASB Emerging Issues Task Force) (ASU 2014-12). The guidance applies to all
reporting entities that grant their employees share-based payments in which the terms of the award
provide that a performance target that affects vesting could be achieved after the requisite service
period. The amendments require that a performance target that affects vesting and that could be
achieved after the requisite service period be treated as a performance condition. For all entities, the
amendments in this Update are effective for annual periods and interim periods within those annual
periods beginning after December 15, 2015. Earlier adoption is permitted. The effective date is the
same for both public business entities and all other entities. The Company is currently evaluating the
impact of adopting ASU 2014-12 on the Company's results of operations or financial condition.
In August 2014, the FASB issued Accounting Standards Update No. 2014-15, Presentation of
Financial Statements – Going Concern (Subtopic 205-40), Disclosure of Uncertainties about an
Entities Ability to Continue as a Going Concern (ASU 2014-15). The guidance in ASU 2014-15 sets
forth management's responsibility to evaluate whether there is substantial doubt about an entity's
ability to continue as a going concern as well as required disclosures. ASU 2014-15 indicates that,
when preparing financial statements for interim and annual financial statements, management should
evaluate whether conditions or events, in the aggregate, raise substantial doubt about the entity's
ability to continue as a going concern for one year from the date the financial statements are issued or
are available to be issued. This evaluation should include consideration of conditions and events that
are either known or are reasonably knowable at the date the financial statements are issued or are
available to be issued, as well as whether it is probable that management's plans to address the
substantial doubt will be implemented and, if so, whether it is probable that the plans will alleviate the
substantial doubt. ASU 2014-15 is effective for annual periods ending after December 15, 2016, and
interim periods and annual periods thereafter. Early application is permitted. The adoption of this
guidance is not expected to have a material impact on the Company’s consolidated financial
statements.
In January 2015, the FASB issued Accounting Standards Update No. 2015-01, Income Statement –
Extraordinary and Unusual items (Subtopic 225-20), Simplifying Income Statement Presentation by
Eliminating the Concept of Extraordinary Items (ASU 2015-01). The amendment eliminates from
U.S. GAAP the concept of extraordinary items. This guidance is effective for the Company in the
first quarter of fiscal 2017. Early adoption is permitted and allows the Company to apply the
amendment prospectively or retrospectively. The adoption of this guidance is not expected to have a
material impact on the Company’s consolidated financial statements.
In February 2015, FASB issued ASU No. 2015-02, (Topic 810): Amendments to the Consolidation
Analysis. ASU No. 2015-02 provides amendments to respond to stakeholders’ concerns about the
current accounting for consolidation of certain legal entities. Stakeholders expressed concerns that
GAAP might require a reporting entity to consolidate another legal entity in situations in which the
reporting entity’s contractual rights do not give it the ability to act primarily on its own behalf, the
reporting entity does not hold a majority of the legal entity’s voting rights, or the reporting entity is
not exposed to a majority of the legal entity’s economic benefits or obligations. ASU No. 2015-02 is

NETSOL TECHNOLOGIES, INC. AND SUBSIDIARIES
Notes to Consolidated Financial Statements
June 30, 2015 and 2014
F-19
effective for annual periods, and interim periods within those annual periods, beginning after
December 15, 2015. The adoption of this guidance is not expected to have a material impact on the
Company’s results of operations, financial position or disclosures.
In April 2015, FASB issued ASU No. 2015-03, (Subtopic 835-30): Simplifying the Presentation of
Debt Issuance Costs. ASU No. 2015-03 provides guidance that will require debt issuance costs
related to a recognized debt liability to be presented in the balance sheet as a direct deduction from the
carrying amount of that debt liability. ASU No. 2015-03 affects disclosures related to debt issuance
costs but does not affect existing recognition and measurement guidance for these items. ASU No.
2015-03 is effective for annual periods, and interim periods within those annual periods, beginning
after December 15, 2015. The adoption of this guidance is not expected to have a material impact on
the Company’s results of operations, financial position or disclosures.
In April 2015, FASB issued ASU No. 2015-05, (Subtopic 350-40): Customer’s Accounting for Fees Paid in a
Cloud Computing Arrangements. ASU No. 2015-05 provides guidance on a customer’s accounting for fees
paid in a cloud computing arrangement, which includes software as a service, platform as a service,
infrastructure as a service, and other similar hosting arrangements. ASU No. 2015-05 is effective for annual
periods, and interim periods within those annual periods, beginning after December 15, 2015. The adoption of
this guidance is not expected to have a material impact on the Company’s results of operations, financial
position or disclosures.
No other recently issued accounting pronouncements are expected to have a material impact on the Company’s
consolidated financial statements.
NOTE 3 – EARNINGS PER SHARE
Basic earnings per share are computed based on the weighted average number of shares of common
stock outstanding during the period. Diluted earnings per share is computed based on the weighted
average number of shares of common stock plus the effect of dilutive potential common shares
outstanding during the period using the treasury stock method. Dilutive potential common shares
include outstanding stock options, warrants, and stock awards. All options and warrants were
excluded from the diluted loss per share calculation due to their anti-dilution effect.
As of June 30, 2015 and 2014, the following potential dilutive shares were excluded from the shares
used to calculate diluted earnings per share as their inclusion would be anti-dilutive.
For the Years
Ended June 30,
2015 2014
Stock Options 708,133 257,462
Warrants 163,124 163,124
871,257 420,586
NETSOL TECHNOLOGIES, INC. AND SUBSIDIARIES
Notes to Consolidated Financial Statements
June 30, 2015 and 2014
F-20
NOTE 4 – RELATED PARTY TRANSACTIONS
NetSol-Innovation
In November 2004, the Company entered into a joint venture agreement with the Innovation Group
called NetSol-Innovation. NetSol-Innovation provides support services to the Innovation Group.
During the years ended June 30, 2015 and 2014, NetSol Innovation provided services of $6,043,617
and $4,970,794, respectively. Accounts receivable at June 30, 2015 and 2014 were $3,226,733 and
$2,232,610, respectively.
Investec Asset Finance
In October 2011, NTE entered into an agreement with Investec Asset Finance to acquire VLS. NTE
and VLS provide support services to Investec. During the year ended June 30, 2015 and 2014, NTE
and VLS provided maintenance and services of $1,652,077 and $715,567, respectively. Accounts
receivable at June 30, 2015 and 2014 were $265,166 and $183,890, respectively.
NOTE 5 – MAJOR CUSTOMERS
The Company is a strategic business partner for Daimler Financial Services (which consists of a group
of many companies in different countries), which accounts for approximately 12.89% and 17.42% of
revenue, and The Innovation Group accounts for approximately 11.84% and 13.66% of revenue for
the fiscal years ended June 30, 2015 and 2014, respectively. Accounts receivable at June 30, 2015 for
these companies were $446,754 and $3,226,733, respectively. Accounts receivable at June 30, 2014
for these companies were $1,900,270, and $2,232,610, respectively.
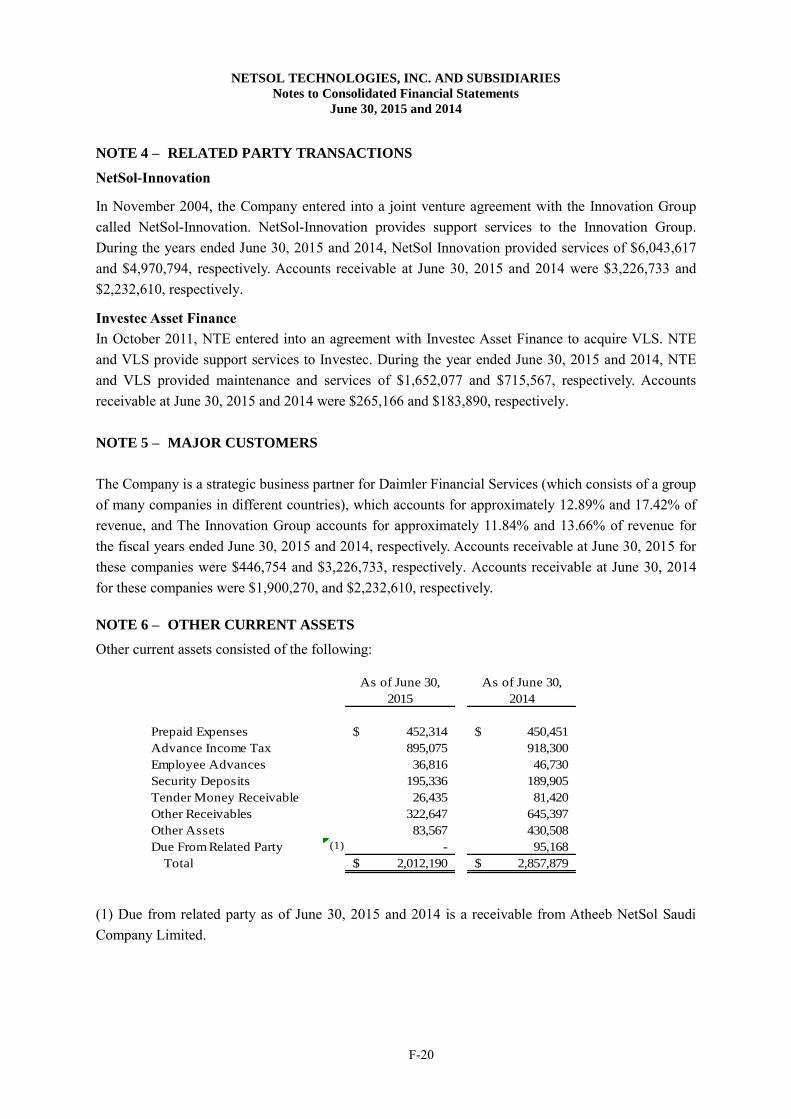
NOTE 6 – OTHER CURRENT ASSETS
Other current assets consisted of the following:
As of June 30, As of June 30,
2015 2014
Prepaid Expenses 452,314$ 450,451$
Advance Income Tax 895,075 918,300
Employee Advances 36,816 46,730
Security Deposits 195,336 189,905
Tender Money Receivable 26,435 81,420
Other Receivables 322,647 645,397
Other Assets 83,567 430,508
Due From Related Party (1) - 95,168
Total 2,012,190$ 2,857,879$
(1) Due from related party as of June 30, 2015 and 2014 is a receivable from Atheeb NetSol Saudi
Company Limited.

NETSOL TECHNOLOGIES, INC. AND SUBSIDIARIES
Notes to Consolidated Financial Statements
June 30, 2015 and 2014
F-21
NOTE 7 – PROPERTY AND EQUIPMENT
Property and equipment consisted of the following:
As of June 30, As of June 30,
2015 2014
Office Furniture and Equipment 3,104,375$ 2,628,814$
Computer Equipment 25,911,422 27,215,091
Assets Under Capital Leases 1,887,767 1,861,445
Building 8,743,130 6,259,290
Land 2,451,577 3,351,316
Capital Work In Progress 392,243 2,812,181
Autos 943,873 999,277
Improvements 204,779 533,102
Subtotal 43,639,166 45,660,516
Accumulated Depreciation (18,519,532) (15,939,388)
Property and Equipment, Net 25,119,634$ 29,721,128$
For the years ended June 30, 2015 and 2014, depreciation expense totaled $5,671,155 and $5,035,922,
respectively. Of these amounts, $3,888,122 and $3,276,222 are reflected as part of cost of revenues
for the years ended June 30, 2015 and 2014, respectively.
The Company’s capital work in progress consists of ongoing enhancements to its facilities and
infrastructure as necessary to meet the Company’s expected long-term growth needs. Accumulated
capitalized interest was $nil and $664,614 as of June 30, 2015 and 2014, respectively.
Following is a summary of fixed assets held under capital leases as of June 30, 2015 and 2014,
respectively:
As of June 30, As of June 30,
2015 2014
Computers and Other Equipment 590,625$ 731,354$
Furniture and Fixtures 414,023 280,184
Vehicles 883,119 849,907
Total 1,887,767 1,861,445
Less: Accumulated Depreciation - Net (577,215) (469,336)
1,310,552$ 1,392,109$

NETSOL TECHNOLOGIES, INC. AND SUBSIDIARIES
Notes to Consolidated Financial Statements
June 30, 2015 and 2014
F-22
NOTE 8 – INTANGIBLE ASSETS
Intangible assets consisted of the following:
Product Licenses Customer Lists Technology Total
Intangible assets - June 30, 2013 - cost 44,837,558$ 6,052,378$ 242,702$ 51,132,638$
Additions 3,385,151 - - 3,385,151
Deletion (591,216) (591,216)
Effect of translation adjustment 1,000,875 - - 1,000,875
Accumulated amortization (20,050,310) (5,940,633) (133,487) (26,124,430)
Net balance - June 30, 2014 28,582,058$ 111,745$ 109,215$ 28,803,018$
Intangible Assets - June 30, 2014 - Cost 48,632,368$ 6,052,377$ 242,702$ 54,927,447$
Additions - - - -
Effect of Translation Adjustment (2,325,008) - - (2,325,008)
Accumulated Amortization (23,491,893) (6,052,377) (242,702) (29,786,972)
Net Balance - June 30, 2015 22,815,467$ -$ -$ 22,815,467$
(A) Product Licenses
Product licenses include internally-developed original license issues, renewals, enhancements,
copyrights, trademarks, and trade names. Product licenses are amortized on a straight-line basis over
their respective lives, and the unamortized amount of $22,815,467 will be amortized over the next
8.75 years. Amortization expense for the years ended June 30, 2015 and 2014 was $4,448,735 and
$3,568,366, respectively.
The Company determined to discontinue marketing three products during the fiscal year ended June
30, 2015 and fully amortized the products as of June 30, 2015. The amount of amortization related to
these three products was $1,184,959 and is recorded under cost of revenues as depreciation and
amortization expense in the accompanying consolidated statements of operations.
(B) Customer Lists
Customer lists were being amortized on a straight-line basis over five years, which approximates the
anticipated rate of attrition. Amortization expense for the years ended June 30, 2015 and 2014 was
$113,243 and $75,578, respectively.
(C) Technology
Technology assets were being amortized on a straight-line basis over five years, which approximates
the anticipated rate of attrition. Amortization expense for the years ended June 30, 2015 and 2014 was
$110,681 and $50,870, respectively.
(D) Future Amortization
Estimated amortization expense of intangible assets over the next five years is as follows:

NETSOL TECHNOLOGIES, INC. AND SUBSIDIARIES
Notes to Consolidated Financial Statements
June 30, 2015 and 2014
F-23
Year ended:
June 30, 2016 2,804,844$
June 30, 2017 2,804,844
June 30, 2018 2,804,844
June 30, 2019 2,804,844
June 30, 2020 2,804,844
Thereafter 8,791,247
22,815,467$
NOTE 9 – GOODWILL
Goodwill represents the excess of the aggregate purchase price over the fair value of the net assets
acquired in prior period businesses combinations. Goodwill was comprised of the following amounts:
As of June 30, As of June 30,
2015 2014
NetSol PK 1,166,610$ 1,166,610$
NTE 3,471,814 3,471,814
VLS 214,044 214,044
NTA 4,664,100 4,664,100
Total 9,516,568$ 9,516,568$
The Company tests for goodwill impairment at each reporting unit. There was no goodwill
impairment for the year ended June 30, 2015. The Company recorded $136,762 as goodwill
impairment for the year ended June 30, 2014.
NOTE 10 – INVESTMENT UNDER EQUITY METHOD
On April 10, 2009, the Company entered into an agreement to form a joint venture with the Atheeb
Trading Company, a member of the Atheeb Group (“Atheeb”). The joint venture entity Atheeb NetSol
Saudi Company Ltd. (“Atheeb NetSol”) is a company organized under the laws of the Kingdom of
Saudi Arabia. The venture was formed with an initial capital contribution of $268,000 by the
Company and $266,930 by Atheeb with a profit sharing ratio of 50.1:49.9, respectively. The final
formation of the company was completed on March 7, 2010. The Company had no control over the
operational and financial matters of Atheeb NetSol; therefore, it was considered as an associated
company and accounted for under the equity method. Due to change in foreign laws and losses the
Company has withdrawn from the joint venture. As a result, the net value of the investment in the
accompanying financial statements as of June 30, 2015 & 2014 was $Nil.
NOTE 11 – ACCOUNTS PAYABLE AND ACCRUED EXPENSES
Accounts payable and accrued expenses consisted of the following:

NETSOL TECHNOLOGIES, INC. AND SUBSIDIARIES
Notes to Consolidated Financial Statements
June 30, 2015 and 2014
F-24
As of June 30, As of June 30,
2015 2014
Accounts Payable 1,514,841$ 1,642,325$
Accrued Liabilities 3,978,435 2,956,686
Accrued Payroll 8,974 44,185
Accrued Payroll Taxes 282,572 261,261
Interest Payable 41,556 61,555
Taxes Payable 22,957 165,649
Other Payable 103,226 103,226
Total 5,952,561$ 5,234,887$
NOTE 12 – DEBTS
Notes and leases payable consisted of the following:
Current Long-Term
Name Total Maturities Maturities
D&O Insurance (1) 79,872$ 79,872$ -$
Habib Bank Line of Credit (2) - - -
Bank Overdraft Facility (3) - - -
HSBC Loan (4) 447,161 322,349 124,812
Term Finance Facility (5) - - -
Loan Payable Bank (6) 2,892,961 2,892,961 -
Loan From Related Party (7) 129,979 129,979 -
3,549,973 3,425,161 124,812
Subsidiary Capital Leases (8) 833,872 471,192 362,680
4,383,845$ 3,896,353$ 487,492$
Current Long-Term
Name Total Maturities Maturities
D&O Insurance (1) 54,547$ 54,547$ -$
Habib Bank Line of Credit (2) 2,438,844 2,438,844 -
Bank Overdraft Facility (3) - - -
HSBC Loan (4) 835,899 346,138 489,761
Term Finance Facility (5) 632,527 253,011 379,516
Loan Payable Bank (6) 2,024,087 2,024,087 -
Loan From Related Party (7) 322,600.00 194,740.00 127,860.00
6,308,504 5,311,367 997,137
Subsidiary Capital Leases (8) 1,014,834 479,891 534,943
7,323,338$ 5,791,258$ 1,532,080$
As of June 30, 2015
As of June 30, 2014
(1) The Company finances Directors’ and Officers’ (“D&O”) liability insurance as well as Errors and
Omissions (“E&O”) liability insurance, for which the total balances are renewed on an annual basis
NETSOL TECHNOLOGIES, INC. AND SUBSIDIARIES
Notes to Consolidated Financial Statements
June 30, 2015 and 2014
F-25
and as such are recorded in current maturities. The interest rate on the insurance financing was 0.49%
and 0.55% as of June 30, 2015 and 2014, respectively.
(2) In April 2008, the Company entered into an agreement with Habib American Bank to secure a line
of credit to be collateralized by certificates of deposit held at the bank. The interest rate on this line of
credit is variable and was 1.5% as of June 30, 2015 and 2014, respectively. In June 2012, the
Company’s subsidiary, NTA, entered into an agreement with Habib American Bank to secure a line of
credit up to $500,000 to be collateralized by certificates of deposit of the same value held at the bank.
The interest rate on this line of credit is variable and was 1.9% as of June 30, 2015 and 2014,
respectively. Combined interest expense for the years ended June 30, 2015 and 2014 was $8,658 and
$35,764, respectively.
(3) During the year ended June 30, 2008, the Company’s subsidiary, NTE entered into an overdraft
facility with HSBC Bank plc whereby the bank would cover any overdrafts up to £300,000, or
approximately $471,550. The annual interest rate was 4.75% as of June 30, 2015 and 2014,
respectively.
This overdraft facility requires that the aggregate amount of invoiced trade debtors (net of provisions
for bad and doubtful debts and excluding intra-group debtors) of NTE, not exceeding 90 days old, will
not be less than an amount equal to 200% of the facility. As of June 30, 2015, NTE was in
compliance with this covenant.
(4) In October 2011, the Company’s subsidiary, NTE, entered into a loan agreement with HSBC Bank
to finance the acquisition of 51% of a controlling interest in Virtual Leasing Services Limited. HSBC
Bank guaranteed the loan up to a limit of £1,000,000, or approximately $1,571,833 for a period of 5
years with monthly payments of £18,420, or approximately $28,953. The interest rate was 4% which
is 3.5% above the bank sterling base rate. The loan is securitized against debenture comprising of
fixed and floating charges over all the assets and undertakings of NTE including all present and future
freehold and leasehold property, book and other debts, chattels, goodwill and uncalled capital, both
present and future. Interest expense for the years ended June 30, 2015 and 2014 was $47,255 and
$70,667, respectively.
This facility requires that NTE’s adjusted tangible net worth would not be less than £600,000. For this
purpose, adjusted tangible net worth means shareholders’ funds less intangible assets plus non-
redeemable preference shares. In addition, NTE’s cash debt service coverage would not fall below
150% of the aggregate debt service cost. As of June 30, 2015, NTE was in compliance with this
covenant.
(5) The Company’s subsidiary, NetSol PK, entered into two different term finance facilities from
Askari Bank to finance the construction of a new building. The total aggregate amount of these
facilities is Rs. 112,500,000, or approximately $1,084,860 (secured by the first charge of Rs. 580
million or approximately $5.59 million over the land, building and equipment of NetSol PK). The
interest rate was 9.79% and 12.39% as of June 30, 2015 and 2014, respectively, which is 2.75% above
the six-month Karachi Inter Bank Offering Rate. During the year ended June 30, 2015, NetSol PK
paid off the complete liability against this financing.

NETSOL TECHNOLOGIES, INC. AND SUBSIDIARIES
Notes to Consolidated Financial Statements
June 30, 2015 and 2014
F-26
(6) The Company’s subsidiary, NetSol PK, has an export refinance facility with Askari Bank Limited,
secured by NetSol PK’s assets. This is a revolving loan that matures every six months. Total facility
amount is Rs. 300,000,000 or $2,892,961. The interest rate for the loans was 7.5% and 9.4% at June
30, 2015 and 2014, respectively. Interest expense for the year ended June 30, 2015 and 2014 was
$146,264 and $169,795, respectively.
Both term and export refinance facilities from Askari Bank Limited amounting to Rupees 300 million
($2.89 million) require NetSol PK to maintain a long term debt equity ratio of 60:40 and the current
ratio of 1:1. As of June 30, 2015, NetSol PK was in compliance with this covenant.
(7) In October 2013, the Company’s subsidiary, NTE, entered into a loan agreement with Investec, a
related party, to finance VLS. The loan amount was £100,000, or approximately $157,183, for a
period of 1 year with monthly payments of £8,676, or approximately $13,637. The interest rate was
4.1%. As of June 30, 2015, NTE has paid the loan in full.
In March 2014, the Company’s subsidiary, VLS, entered into a loan agreement with Investec. The
loan amount was £150,000, or approximately $235,775, for a period of two years with annual
payments of £75,000, or approximately $117,887. The interest rate was 3.13%. As of June 30, 2015,
VLS has used this facility up to $129,979 including interest due, and was shown as a current maturity.
The following table represents future payments of loans described in the above sub notes 1 to 7
As of June 30,
2015
Loan Payments
Due FYE 6/30/16 3,425,161$
Due FYE 6/30/17 124,812
Total Loan Payments 3,549,973
Less: Current portion (3,425,161)
Non-Current portion 124,812$
(8) The Company leases various fixed assets under capital lease arrangements expiring in various
years through 2018. The assets and liabilities under capital leases are recorded at the lower of the
present value of the minimum lease payments or the fair value of the asset. The assets are depreciated
over the lesser of their related lease terms or their estimated useful lives and are secured by the assets
themselves. Depreciation of assets under capital leases is included in depreciation expense for the
years ended June 30, 2015 and 2014.

NETSOL TECHNOLOGIES, INC. AND SUBSIDIARIES
Notes to Consolidated Financial Statements
June 30, 2015 and 2014
F-27
Following is the aggregate minimum future lease payments under capital leases for the year ended
June 30, 2015:
Amount
Minimum Lease Payments
Due FYE 6/30/16 531,827$
Due FYE 6/30/17 307,563
Due FYE 6/30/18 76,621
Total Minimum Lease Payments 916,011
Interest Expense relating to future periods (82,139)
Present Value of minimum lease payments 833,872
Less: Current portion (471,192)
Non-Current portion 362,680$
NOTE 13 – INCOME TAXES
The Company is incorporated in the State of Nevada and registered to do business in the State of
California. The following is a breakdown of income before the provision for income taxes:
Consolidated pre-tax income (loss) consists of the following:
2015 2014
US operations $ (3,621,392) $ (3,478,331)
Foreign operations (1,927,426) (10,279,861)
$ (5,548,818) $ (13,758,192)
Years Ended June 30,
The components of the provision for income taxes are as follows:
2015 2014
Current:
Federal $ - $ -
State and Local - -
Foreign 413,498 338,282
Deferred:
Federal - -
State and Local - -
Foreign - -
Provision for income taxes $ 413,498 $ 338,282
Years Ended June 30,

NETSOL TECHNOLOGIES, INC. AND SUBSIDIARIES
Notes to Consolidated Financial Statements
June 30, 2015 and 2014
F-28
A reconciliation of taxes computed at the statutory federal income tax rate to income tax expense
(benefit) is as follows:
2015 2014
Income tax (benefit) provision at statutory rate (1,886,598)$ 34.0% (4,677,785)$ 34.0%
State income (benefit) taxes, net of federal tax benefit (323,496) 5.8% (67,583) 0.5%
Foreign earnings taxed at different rates 2,364,070 -42.6% 2,223,746 -16.2%
Change in valuation allowance for deferred tax assets 371,798 -6.7% 2,584,235 -18.8%
Share of net (income) loss in equity method investee - 0.0% 217,266 -1.6%
Other (112,276) 2.02% 58,403 -0.4%
Provision for income taxes 413,498$ -7.5% 338,282$ -2.5%
Years Ended June 30,
Deferred income tax assets and liabilities as of June 30, 2015 and 2014 consist of tax effects of
temporary differences related to the following:
2015 2014
Net operating loss carry forwards $ 14,066,927 $ 13,947,156
Other 468,733 216,706
Net deferred tax assets 14,535,660 14,163,862
Valuation allowance for deferred tax assets (14,535,660) (14,163,862)
Net deferred tax assets $ - $ -
Years Ended June 30,
The Company has established a full valuation allowance as management believes it is more likely
than not that these assets will not be realized in the future. The valuation allowance increased by
$371,798 for the year ended June 30, 2015 mainly due to adjusting the Company's net operating loss
carry forwards for the current year operating loss.
At June 30, 2015, federal and state net operating loss carry forwards in the United States of America
were $36,386,741 and $6,414,294, respectively. Federal net operating loss carry forwards begin to
expire in 2020, while state net operating loss carry forwards are expiring each year. Due to both
historical and recent changes in the capitalization structure of the Company, the utilization of net
operating losses may be limited pursuant to section 382 of the Internal Revenue Code. Net operating
losses related to foreign entities were $4,657,426 at June 30, 2015.
As of June 30, 2015, the Company does not have any unrecognized tax benefits related to various
federal and state income tax matters. The Company will recognize accrued interest and penalties
related to unrecognized tax benefits in income tax expense.
The Company is subject to U.S. federal income tax, as well as various state and foreign jurisdictions.
The Company is currently open to audit under the statute of limitations by the federal and state
NETSOL TECHNOLOGIES, INC. AND SUBSIDIARIES
Notes to Consolidated Financial Statements
June 30, 2015 and 2014
F-29
jurisdictions for the years ending June 30, 2012 through 2014. The Company does not anticipate any
material amount of unrecognized tax benefits within the next 12 months.
The cumulative amount of undistributed earnings of foreign subsidiaries that the Company intends to
permanently invest and upon which no deferred US income taxes have been provided is $28,046,265
as of June 30, 2015. The additional US income tax on unremitted foreign earnings, if repatriated,
would be offset in part by foreign tax credits. The extent of this offset would depend on many factors,
including the method of distribution, and specific earnings distributed. The Company determined that
it is not practicable to determine unrecognized deferred tax liability associated with the unremitted
earnings attributable to the foreign subsidiaries.
NOTE 14 – STOCKHOLDERS’ EQUITY
During the years ended June 30, 2015 and 2014, the Company issued 152,500 and 65,000 restricted
shares of common stock, respectively, for services rendered by officers of the Company. These shares
were valued at the fair market value of $699,000 and $663,350, respectively, and recorded as
compensation expense in the accompanying consolidated financial statements.
During the years ended June 30, 2015 and 2014, the Company issued 41,726 and 5,173 restricted
shares of common stock, for services rendered by the independent members of the Board of Directors
as part of their board compensation. These shares were valued at the fair market value of $173,633
and $55,249, and recorded as compensation expense in the accompanying consolidated financial
statements.
During the years ended June 30, 2015 and 2014, the Company issued 170,275 and 9,000 restricted
shares of common stock, respectively, to employees pursuant to the terms of their employment
agreements. These shares were valued at the fair market value of $603,075 and $81,394, respectively,
and recorded as compensation expense in the accompanying consolidated financial statements.
During the years ended June 30, 2014, the Company issued 2,400 restricted shares of common stock
for services performed by unrelated consultants. These shares were valued at the fair market value of
$17,424, respectively, and recorded as general and administrative costs in the accompanying
consolidated financial statements.
During the year ended June 30, 2014, the Company issued 27,000 shares of its common stock for the
settlement of a payable to a related party valued at $210,060.
During the year ended June 30, 2015, the Company received $2,359,530 pursuant to a stock purchase
agreement for the purchase of 743,107 restricted shares of common stock at price ranging from $2.85
to $4.46 per share.
During the year ended June 30, 2015, the Company received $191,400 pursuant to a stock option
agreement for the exercise of 49,329 restricted shares of common stock at price of $3.88 per share.

NETSOL TECHNOLOGIES, INC. AND SUBSIDIARIES
Notes to Consolidated Financial Statements
June 30, 2015 and 2014
F-30
During the year ended June 30, 2015, the Company determined that certain subscription receivables
related to stock issuances in previous years were deemed uncollectible and reduced the subscription
receivable account $982,181 with a corresponding entry to additional-paid-in-capital.
During the year ended June 30, 2015, the Company determined that certain subscription receivables
related to the exercise of stock options were deemed uncollectible and reduced the subscription
receivable account by $158,635 with a corresponding entry to compensation expense.
NETSOL TECHNOLOGIES, INC. AND SUBSIDIARIES
Notes to Consolidated Financial Statements
June 30, 2015 and 2014
F-31
NOTE 15 – STOCK BASED COMPENSATION
The Company maintains several Incentive and Non-Statutory Stock Option Plans (“Plans”) for its
employees and consultants. Options granted under these Plans to an employee of the Company
become exercisable over a period of no longer than ten (10) years and no less than twenty percent
(20%) of the shares are exercisable annually. Options are not exercisable, in whole or in part, prior to
one (1) year from the date of grant unless the board of directors specifically determines otherwise, as
provided.
Two types of options may be granted under these Plans: (1) Incentive Stock Options (also known as
Qualified Stock Options) which may only be issued to employees of the Company and whereby the
exercise price of the option is not less than the fair market value of the common stock on the date it
was reserved for issuance under the Plan; and (2) Non-statutory Stock Options which may be issued
to either employees or consultants of the Company and whereby the exercise price of the option is less
than the fair market value of the common stock on the date it was reserved for issuance under the
plan. Grants of options may be made to employees and consultants without regard to any performance
measures. All options issued pursuant to the Plan are nontransferable and subject to forfeiture.
In May 2015, the shareholders approved the 2015 Equity Incentive Plan (the “2015 Plan”) which
provides for the grant of equity-based awards, including options, stock appreciation rights, restricted
stock awards or performance share awards or any other right or interest relating to shares or cash, to
eligible participants. The aggregate number of shares reserved and available for award under the 2015
Plan was 1,250,000. The 2015 Plan contemplates the issuance of common stock upon exercise of
options or other awards granted to eligible persons under the 2015 Plan. Shares issued under the 2015
Plan may be both authorized and unissued shares or previously issued shares acquired by the
Company. Upon termination or expiration of an unexercised option, stock appreciation right or other
stock-based award under the 2015 Plan, in whole or in part, the number of shares of common stock
subject to such award again becomes available for grant under the 2015 Plan. Any shares of restricted
stock forfeited as described below will become available for grant. The maximum number of shares
that may be granted to any one participant in any calendar year may not exceed 50,000 shares. All
options issued pursuant to the Plan are nontransferable and subject to forfeiture.
Options granted under the 2015 Plan are not generally transferable and must be exercised within 10
years, subject to earlier termination upon termination of the option holder's employment, but in no
event later than the expiration of the option's term. The exercise price of each option may not be less
than the fair market value of a share of the Company’s common stock on the date of grant (except in
connection with the assumption or substitution for another option in a manner qualifying under
Section 424(a) of the Internal Revenue Code of 1986, as amended. Incentive stock options granted to
any participant who owns 10% or more of the Company’s outstanding common stock (a “Ten Percent
NETSOL TECHNOLOGIES, INC. AND SUBSIDIARIES
Notes to Consolidated Financial Statements
June 30, 2015 and 2014
F-32
Shareholder”) must have an exercise price equal to or exceeding 110% of the fair market value of a
share of our common stock on the date of the grant and must not be exercisable for longer than five
years. Options become vested and exercisable at such times or upon such events and subject to such
terms, conditions, performance criteria or restrictions as specified by the Committee. The maximum
term of any option granted under the 2015 Plan is ten years, provided that an incentive stock option
granted to a Ten Percent Shareholder must have a term not exceeding five years.
Under the 2015 Plan, a participant may also be awarded a "performance award," which means that the
participant may receive cash, stock or other awards contingent upon achieving performance goals
established by the Committee. The Committee may also make "deferred share" awards, which entitle
the participant to receive the Company’s stock in the future for services performed between the date
of the award and the date the participant may receive the stock. The vesting of deferred share awards
may be based on performance criteria and/or continued service with the Company. A participant who
is granted a "stock appreciation right" under the Plan has the right to receive all or a percentage of the
fair market value of a share of stock on the date of exercise of the stock appreciation right minus the
grant price of the stock appreciation right determined by the Committee (but in no event less than the
fair market value of the stock on the date of grant). Finally, the Committee may make "restricted
stock" awards under the 2015 Plan, which are subject to such terms and conditions as the Committee
determines and as are set forth in the award agreement related to the restricted stock. As of June 30,
2015, no shares were issued under this plan to non-officer employees.
A summary of option and warrant activity for the years ended June 30, 2015 and 2014 is presented
below:
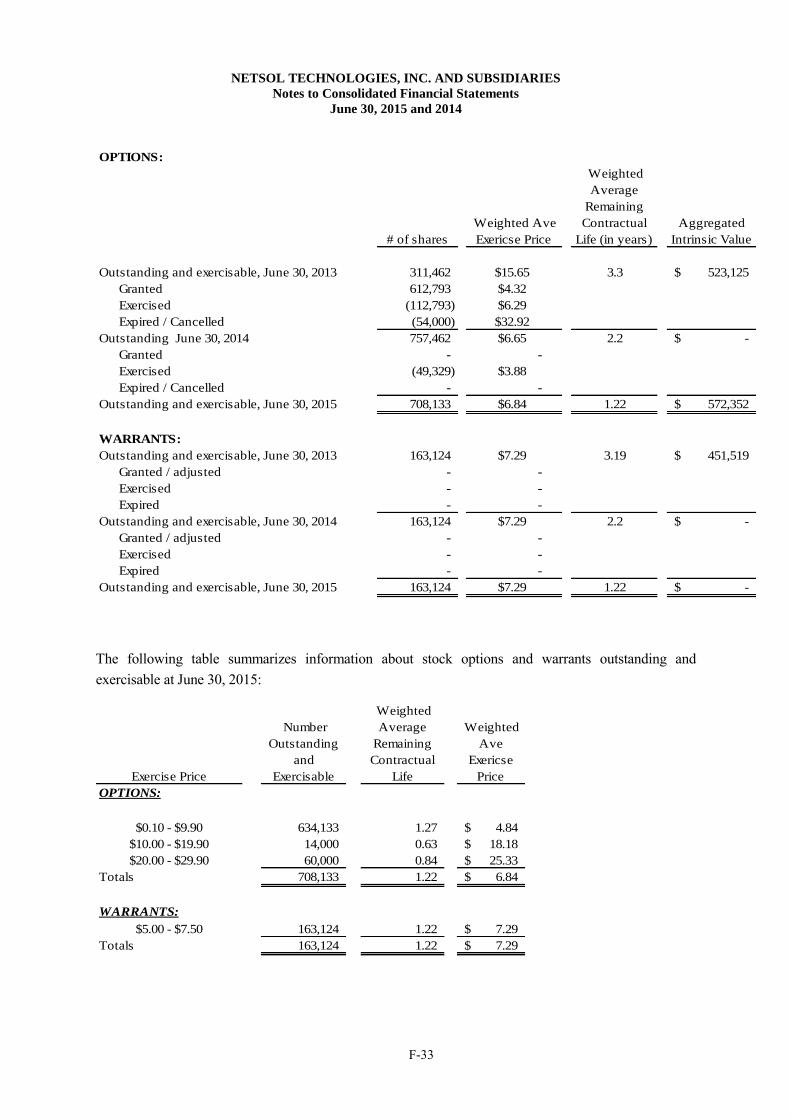
NETSOL TECHNOLOGIES, INC. AND SUBSIDIARIES
Notes to Consolidated Financial Statements
June 30, 2015 and 2014
F-33
OPTIONS:
# of shares
Weighted Ave
Exericse Price
Weighted
Average
Remaining
Contractual
Life (in years)
Aggregated
Intrinsic Value
Outstanding and exercisable, June 30, 2013 311,462 $15.65 3.3 523,125$
Granted 612,793 $4.32
Exercised (112,793) $6.29
Expired / Cancelled (54,000) $32.92
Outstanding June 30, 2014 757,462 $6.65 2.2 -$
Granted - -
Exercised (49,329) $3.88
Expired / Cancelled - -
Outstanding and exercisable, June 30, 2015 708,133 $6.84 1.22 572,352$
WARRANTS:
Outstanding and exercisable, June 30, 2013 163,124 $7.29 3.19 451,519$
Granted / adjusted - -
Exercised - -
Expired - -
Outstanding and exercisable, June 30, 2014 163,124 $7.29 2.2 -$
Granted / adjusted - -
Exercised - -
Expired - -
Outstanding and exercisable, June 30, 2015 163,124 $7.29 1.22 -$
The following table summarizes information about stock options and warrants outstanding and
exercisable at June 30, 2015:
Exercise Price
Number
Outstanding
and
Exercisable
Weighted
Average
Remaining
Contractual
Life
Weighted
Ave
Exericse
Price
OPTIONS:
$0.10 - $9.90 634,133 1.27 4.84$
$10.00 - $19.90 14,000 0.63 18.18$
$20.00 - $29.90 60,000 0.84 25.33$
Totals 708,133 1.22 6.84$
WARRANTS:
$5.00 - $7.50 163,124 1.22 7.29$
Totals 163,124 1.22 7.29$

NETSOL TECHNOLOGIES, INC. AND SUBSIDIARIES
Notes to Consolidated Financial Statements
June 30, 2015 and 2014
F-34
The assumptions used in calculating the fair value of options granted using the Black-Scholes option-
pricing model for options granted during the years ended June 30, 2015 and 2014 are as follows:
June 30, 2015 June 30, 2014
Risk-free interest rate - 0.05% - 0.47%
Expected life - 1 month - 10 years
Expected volatility - 17.5% - 57.88%
Expected dividend - 0%
The weighted average grant-date fair value for the options granted during the year ended June 30,
2014, was $1.32.
The Company recorded compensation expense of $622,490 and $189,937 for the years ended June 30,
2015 and 2014, respectively.
The following table summarizes stock grants awarded as compensation:
# of shares
Weighted
Average Grant
Date Fair Value
($)
Unvested, June 30, 2013 - -
Granted 337,899 $5.78
Vested (105,899) $10.00
Unvested, June 30, 2014 232,000 $3.88
Granted 113,275 $3.26
Vested (338,608) $3.60
Unvested, June 30, 2015 6,667 $6.00
For the years ended June 30, 2015 and 2014, the Company recorded compensation expense of
$1,475,707 and $1,059,186, respectively. The compensation expense related to the unvested stock
grants as of June 30, 2015 was $40,000 which will be recognized over the weighted average period of
1 year.
NOTE 16 – COMMITMENTS AND CONTINGENCIES
(A) Non-cancellable operating leases
The Company’s headquarters is located in Calabasas California with approximately 7,210
rentable square feet for $22,456 per month. The term of the lease is for five years and five
months and expires August 31, 2017. A $23,821 security deposit is included in other current
assets in the accompanying consolidated financial statements.
NETSOL TECHNOLOGIES, INC. AND SUBSIDIARIES
Notes to Consolidated Financial Statements
June 30, 2015 and 2014
F-35
The Australia lease is a two-year lease that expires in March 2016 with a monthly rent of
approximately $8,437.
The Beijing lease is a three-year lease that expires in January 2017 with a monthly rent of
approximately $13,725.
The Bangkok lease is a three years lease expiring in November 2016 with monthly rent of
approximately $8,887.
The NetSol Europe facilities, located in Horsham, United Kingdom, are leased until June 23,
2021 with an annual rent of approximately $110,022.
VLS facilities, located in Chester, United Kingdom, are leased until July 2016 with an annual
rent of approximately $33,401.
NTA facilities are located in Alameda, California with a monthly rent of $8,381. The Alameda
lease expired in November 2014, which has been renewed through December 2017.
The NetSol Karachi office lease expires in November 2019 and currently is rented at the rate
of approximately $7,714 per month.
Upon expiration of the leases, the Company does not anticipate any difficulty in obtaining renewals or
alternative space. Rent expense amounted to $1,524,677 and $1,617,598 for the years ended June 30,
2015 and 2014, respectively.
The total annual lease commitment for the next five years is as follows:
FYE 6/30/16 971,890$
FYE 6/30/17 751,488
FYE 6/30/18 394,212
FYE 6/30/19 202,593
FYE 6/30/20 148,593
(B) Litigation
As previously disclosed, on July 25, 2014, purported class action lawsuits were filed in the U.S.
District Court for the Central District of California against the Company and three of its current or
former officers and/or directors, which have been consolidated under the caption Rand-Heart of New
York, Inc. v. NetSol Technologies, Inc., et al., Case No. 2:14-cv-05787 PA (SHx). Plaintiffs
subsequently filed a consolidated complaint, which asserted claims under Sections 10(b) and 20(a) of
the Securities Exchange Act of 1934 premised on allegedly false and misleading statements regarding
the Company’s next generation product, NFS Ascent, and whether it was truly available on a global
basis when stated. After several successful motions by the Company, the Court granted the plaintiff a
final opportunity to amend the complaint on a narrowed basis. The amended complaint was filed
which contained a much narrowed class period from October 2013 to November 8, 2013, eliminated
all but one of the individual defendants from the suit, and limited the scope of the alleged claims. The
Company has filed an answer to this final amended complaint.
The Company continues to believe the amended allegations are meritless and intends to vigorously
defend all claims asserted. The Company has engaged counsel and has liability insurance. Given the
early stage of the litigation, however, at this time the Company is unable to form a professional
judgment that an unfavorable outcome is either probable or remote, and it is not possible to assess

NETSOL TECHNOLOGIES, INC. AND SUBSIDIARIES
Notes to Consolidated Financial Statements
June 30, 2015 and 2014
F-36
whether or not the outcome of these proceedings will or will not have a material adverse effect on the
Company.
NOTE 17 – SEGMENT INFORMATION AND GEOGRAPHIC AREAS
The Company has identified three global regions or segments for its products and services; North
America, Europe, and Asia-Pacific. The reportable segments are business units located in different
global regions. Each business unit provides similar products and services; license fees for leasing and
asset-based software, related maintenance fees, and implementation and IT consulting services.
Separate management of each segment is required because each business unit is subject to operational
issues and strategies unique to their particular regional location. We account for intercompany sales
and expenses as if the sales or expenses were to third parties and eliminate them in consolidation.
The following table presents a summary of identifiable assets as of June 30, 2015 and 2014:
As of June 30, As of June 30,
2015 2014
Identifiable assets:
Corporate headquarters 4,896,334$ 5,150,823$
North America 7,162,846 7,406,631
Europe 6,631,945 6,169,265
Asia - Pacific 70,271,209 76,176,555
Consolidated 88,962,334$ 94,903,274$
The following table presents a summary of operating information for the years ended June 30:

NETSOL TECHNOLOGIES, INC. AND SUBSIDIARIES
Notes to Consolidated Financial Statements
June 30, 2015 and 2014
F-37
2015 2014
Revenues from unaffiliated customers:
North America 5,535,183$ 4,729,908$
Europe 5,707,127 5,813,744
Asia - Pacific 32,110,574 20,154,790
43,352,884 30,698,442
Revenue from affiliated customers
Europe 1,652,077 715,567
Asia - Pacific 6,043,617 4,970,794
7,695,694 5,686,361
Consolidated 51,048,578$ 36,384,803$
Intercompany revenue
Europe 302,812$ 490,888$
Asia - Pacific 4,620,426 3,680,292
Eliminated 4,923,238$ 4,171,180$
Net income (loss) after taxes and before non-controlling interest:
Corporate headquarters (4,306,400)$ (4,372,278)$
North America 685,008 893,947
Europe (767,103) (2,078,631)
Asia - Pacific (860,677) (8,539,512)
Discontinued operation - 1,158,752
Consolidated (5,249,172)$ (12,937,722)$
Depreciation and amortization:
Corporate headquarters 16,148$ 47,932$
North America 165,240 100,875
Europe 665,826 854,163
Asia - Pacific 9,496,600 7,727,766
Consolidated 10,343,814$ 8,730,736$
Interest expense:
Corporate headquarters 13,783$ 34,461$
North America 1,588 6,916
Europe 52,926 164,569
Asia - Pacific 98,665 49,731
Consolidated 166,962$ 255,677$
Income tax expense:
Europe 1,244$ 7,298$
Asia - Pacific 412,254 330,984
Consolidated 413,498$ 338,282$
The following table presents a summary of capital expenditures for the years ended June 30:
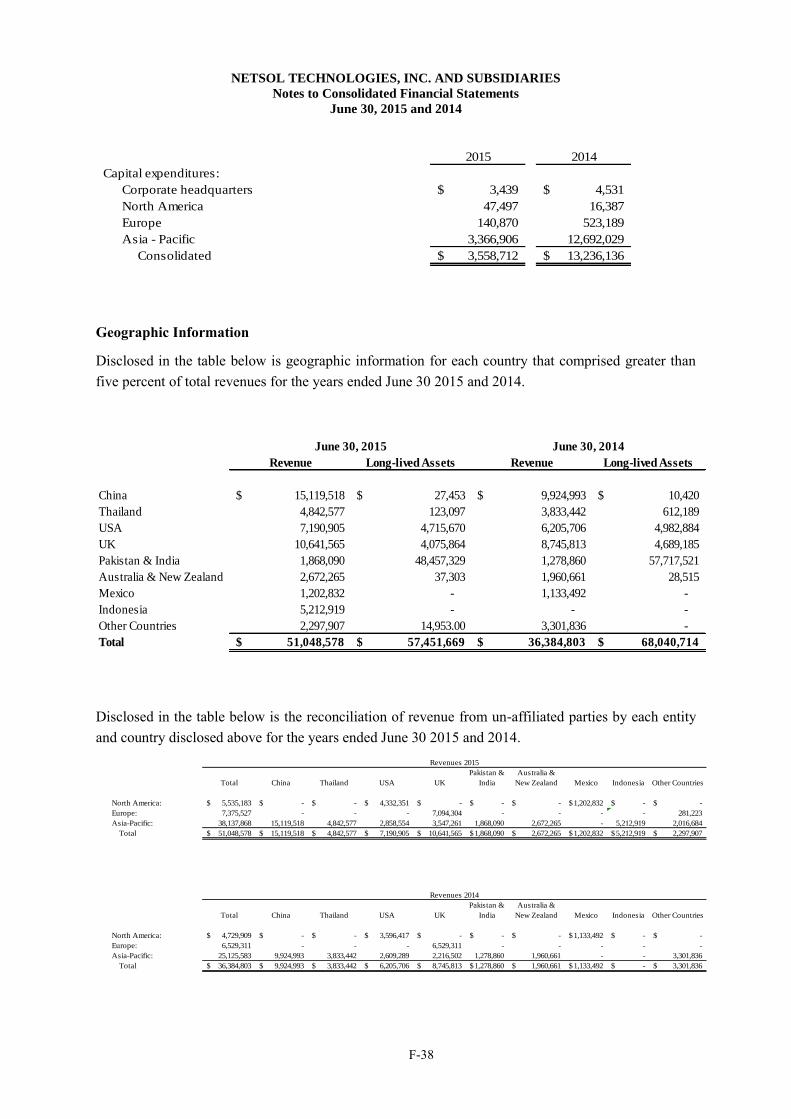
NETSOL TECHNOLOGIES, INC. AND SUBSIDIARIES
Notes to Consolidated Financial Statements
June 30, 2015 and 2014
F-38
2015 2014
Capital expenditures:
Corporate headquarters 3,439$ 4,531$
North America 47,497 16,387
Europe 140,870 523,189
Asia - Pacific 3,366,906 12,692,029
Consolidated 3,558,712$ 13,236,136$
Geographic Information
Disclosed in the table below is geographic information for each country that comprised greater than
five percent of total revenues for the years ended June 30 2015 and 2014.
Revenue Long-lived Assets Revenue Long-lived Assets
China 15,119,518$ 27,453$ 9,924,993$ 10,420$
Thailand 4,842,577 123,097 3,833,442 612,189
USA 7,190,905 4,715,670 6,205,706 4,982,884
UK 10,641,565 4,075,864 8,745,813 4,689,185
Pakistan & India 1,868,090 48,457,329 1,278,860 57,717,521
Australia & New Zealand 2,672,265 37,303 1,960,661 28,515
Mexico 1,202,832 - 1,133,492 -
Indonesia 5,212,919 - - -
Other Countries 2,297,907 14,953.00 3,301,836 -
Total 51,048,578$ 57,451,669$ 36,384,803$ 68,040,714$
June 30, 2015 June 30, 2014
Disclosed in the table below is the reconciliation of revenue from un-affiliated parties by each entity
and country disclosed above for the years ended June 30 2015 and 2014.
Revenues 2015
Total China Thailand USA UK
Pakistan &
India
Australia &
New Zealand Mexico Indonesia Other Countries
North America: 5,535,183$ -$ -$ 4,332,351$ -$ -$ -$ 1,202,832$ -$ -$
Europe: 7,375,527 - - - 7,094,304 - - - - 281,223
Asia-Pacific: 38,137,868 15,119,518 4,842,577 2,858,554 3,547,261 1,868,090 2,672,265 - 5,212,919 2,016,684
Total 51,048,578$ 15,119,518$ 4,842,577$ 7,190,905$ 10,641,565$ 1,868,090$ 2,672,265$ 1,202,832$ 5,212,919$ 2,297,907$
Revenues 2014
Total China Thailand USA UK
Pakistan &
India
Australia &
New Zealand Mexico Indonesia Other Countries
North America: 4,729,909$ -$ -$ 3,596,417$ -$ -$ -$ 1,133,492$ -$ -$
Europe: 6,529,311 - - - 6,529,311 - - - - -
Asia-Pacific: 25,125,583 9,924,993 3,833,442 2,609,289 2,216,502 1,278,860 1,960,661 - - 3,301,836
Total 36,384,803$ 9,924,993$ 3,833,442$ 6,205,706$ 8,745,813$ 1,278,860$ 1,960,661$ 1,133,492$ -$ 3,301,836$
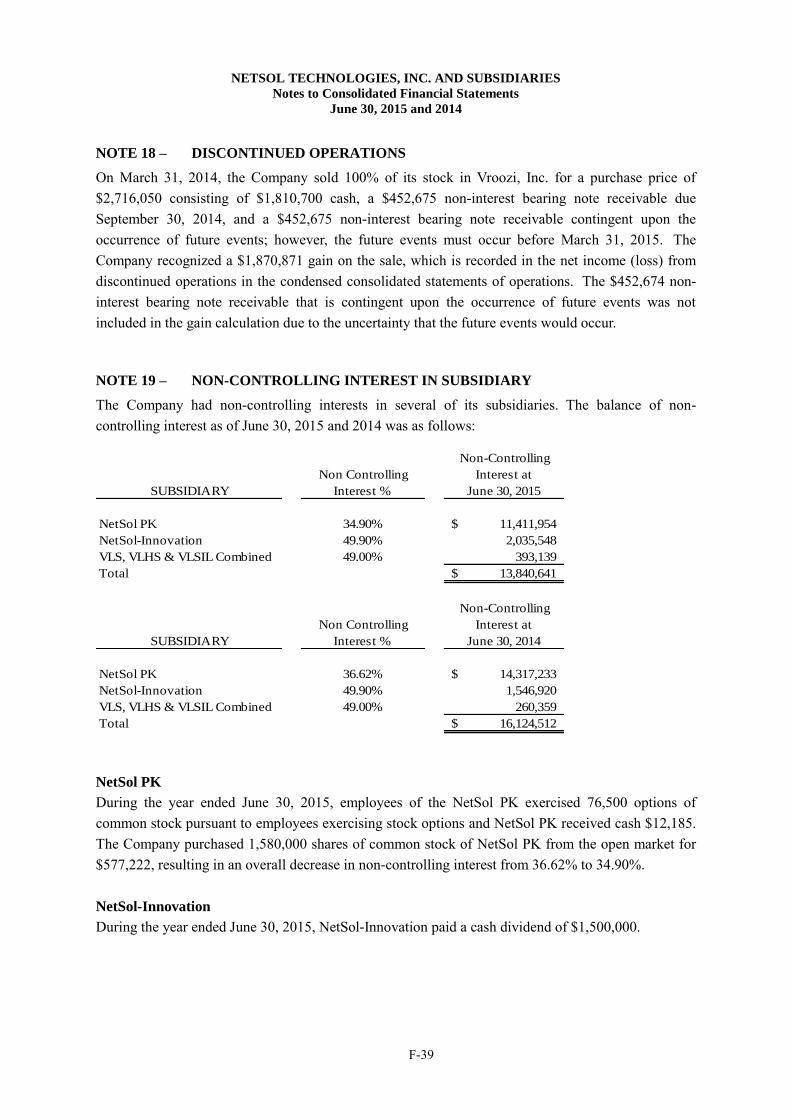
NETSOL TECHNOLOGIES, INC. AND SUBSIDIARIES
Notes to Consolidated Financial Statements
June 30, 2015 and 2014
F-39
NOTE 18 – DISCONTINUED OPERATIONS
On March 31, 2014, the Company sold 100% of its stock in Vroozi, Inc. for a purchase price of
$2,716,050 consisting of $1,810,700 cash, a $452,675 non-interest bearing note receivable due
September 30, 2014, and a $452,675 non-interest bearing note receivable contingent upon the
occurrence of future events; however, the future events must occur before March 31, 2015. The
Company recognized a $1,870,871 gain on the sale, which is recorded in the net income (loss) from
discontinued operations in the condensed consolidated statements of operations. The $452,674 non-
interest bearing note receivable that is contingent upon the occurrence of future events was not
included in the gain calculation due to the uncertainty that the future events would occur.
NOTE 19 – NON-CONTROLLING INTEREST IN SUBSIDIARY
The Company had non-controlling interests in several of its subsidiaries. The balance of non-
controlling interest as of June 30, 2015 and 2014 was as follows:
SUBSIDIARY
Non Controlling
Interest %
Non-Controlling
Interest at
June 30, 2015
NetSol PK 34.90% 11,411,954$
NetSol-Innovation 49.90% 2,035,548
VLS, VLHS & VLSIL Combined 49.00% 393,139
Total 13,840,641$
SUBSIDIARY
Non Controlling
Interest %
Non-Controlling
Interest at
June 30, 2014
NetSol PK 36.62% 14,317,233$
NetSol-Innovation 49.90% 1,546,920
VLS, VLHS & VLSIL Combined 49.00% 260,359
Total 16,124,512$
NetSol PK
During the year ended June 30, 2015, employees of the NetSol PK exercised 76,500 options of
common stock pursuant to employees exercising stock options and NetSol PK received cash $12,185.
The Company purchased 1,580,000 shares of common stock of NetSol PK from the open market for
$577,222, resulting in an overall decrease in non-controlling interest from 36.62% to 34.90%.
NetSol-Innovation
During the year ended June 30, 2015, NetSol-Innovation paid a cash dividend of $1,500,000.
Related Documents


