Scalable Monitoring InterMapper™ Live Network Maps NetFlow Analyzer InterMapper Flows collects and reports on NetFlow and sFlow data. Access to total Flows data allows you to drill down for highly granular analysis due to full session data retention. Reports detail top talkers, hosts, protocols and sessions. InterMapper Flows is excellent at helping you detect and analyze patterns in network traffic. It tells you who is using bandwidth and what the protocol is. It helps you see when an intervention can prevent downtime. Consult top-level and sub-maps from remote locations. Diagnose network problems that have generated alerts. Dispatch and track the work of field staff. InterMapper RemoteAccess makes it easy to scale up from monitoring a single building LAN to a multi-locational WAN. InterMapper RemoteAccess™ works through firewalls and across VPNs. A single port connects to your InterMapper server. Network devices are color coded to provide at-a-glance status information. Red means a device is down.Yellow and orange mean that performance is degrading. Green signals that performance meets set thresholds. Description and Status Information Device name, IP address, sysLocation, and sysContact, response time, packet loss rate, uptime and availability. SQL Database: Data for reporting on historical trends for a particular device is stored and viewable via a set of packaged Crystal Reports® or your own SQL queries. InterMapper displays dynamic data, allowing you to see the status of all network connections and devices without ever having to refresh your browser. Tightly integrated with InterMapper, InterMapperFlows™ puts you one-click away from bandwidth hogs. Right-clicking on any mapped device or depicted network connection opens status windows that detail real time SNMP and other synthetic transactions. Moving black lines appear when preset traffic thresholds are reached, showing the heavy traffic areas and blockages on the network. Device-Specific Diagnostics & Performance Trend Reports Multiple custom probes allow users to collect information and set thresholds for hundreds of data points. Users can set alerts against the thresholds. Sounds, email messages, SMS, pages, SNMP traps to selected receivers, WinPopup messages, or syslog notifications issue early warnings on underperforming devices. Setting alerts warns you when services are deteriorating, enabling resolution before a critical state is reached. Flexible Alerting and Notifications Traffic Data Transmit and receive statistics, utilization rates, device names, link types, descriptions, status, IP and MAC addresses. Performance Measurement Temperatures, CPU and memory utilization, transactions per second, etc.

Welcome message from author
This document is posted to help you gain knowledge. Please leave a comment to let me know what you think about it! Share it to your friends and learn new things together.
Transcript
Scalable MonitoringInterMapper™ Live Network MapsNetFlow Analyzer
InterMapper Flows collects and reports on NetFlow and sFlow data. Access to total Flows data allows you to
drill down for highly granular analysis due to full session data retention. Reports detail top talkers, hosts, protocols and sessions.
InterMapper Flows is excellent at helping you detect and analyze patterns in network traffic. It tells you who is using bandwidth and what the protocol is. It helps you see when an intervention can prevent downtime.
Consult top-level and sub-maps from remote locations. Diagnose network problems that have generated alerts. Dispatch and track the work of field staff.
InterMapper RemoteAccess makes it easy to scale up from monitoring a single building LAN to a multi-locational WAN.
InterMapper RemoteAccess™ works through firewalls and across VPNs. A single port connects to your InterMapper server.
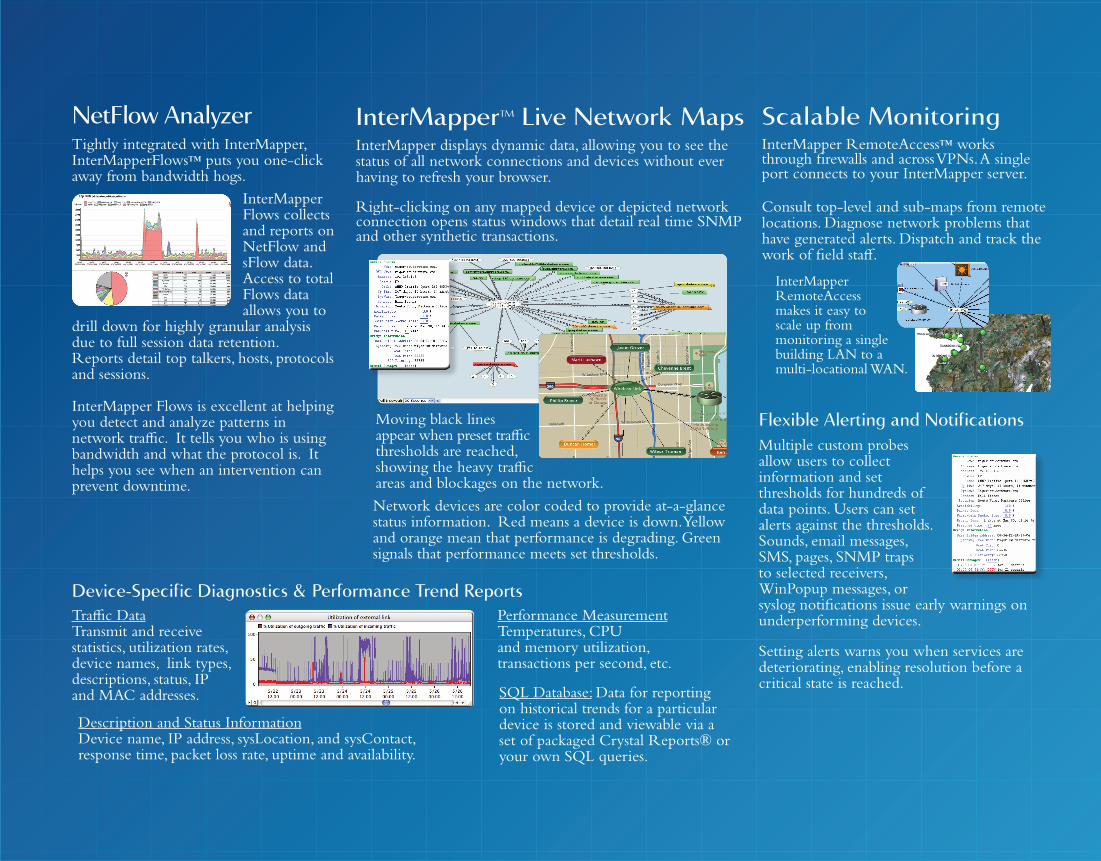
Network devices are color coded to provide at-a-glance status information. Red means a device is down. Yellow and orange mean that performance is degrading. Green signals that performance meets set thresholds.
Description and Status InformationDevice name, IP address, sysLocation, and sysContact, response time, packet loss rate, uptime and availability.
SQL Database: Data for reporting on historical trends for a particular device is stored and viewable via a set of packaged Crystal Reports® or your own SQL queries.
InterMapper displays dynamic data, allowing you to see the status of all network connections and devices without ever having to refresh your browser.
Tightly integrated with InterMapper, InterMapperFlows™ puts you one-click away from bandwidth hogs.
Right-clicking on any mapped device or depicted network connection opens status windows that detail real time SNMP and other synthetic transactions.
Moving black lines appear when preset traffic thresholds are reached, showing the heavy traffic areas and blockages on the network.
Device-Specific Diagnostics & Performance Trend Reports
Multiple custom probes allow users to collect information and set thresholds for hundreds of data points. Users can set alerts against the thresholds. Sounds, email messages, SMS, pages, SNMP traps to selected receivers, WinPopup messages, or syslog notifications issue early warnings on underperforming devices.
Setting alerts warns you when services are deteriorating, enabling resolution before a critical state is reached.
Flexible Alerting and Notifications
Traffic DataTransmit and receive statistics, utilization rates, device names, link types, descriptions, status, IP and MAC addresses.
Performance MeasurementTemperatures, CPU and memory utilization, transactions per second, etc.
Network Monitoringby Dartware
Live Network MonitoringNetFlow AnalysisDiagnostics and Performance Trend ReportingSQL Database and Data ReportingFlexible Alerting and NotificationsScalable, Distributed MonitoringData Import and Export
Secure Access
Dartware, LLC is a privately held software development firm focused on proactive network management solutions that help maximize uptime.
Dartware, LLC66-7 Benning StreetWest Lebanon, NH 03784 USA www.InterMapper.com
Toll Free: 877-276-6903Tel: 603-643-9600Fax: 603-643-2289 Email: [email protected]
Dartware was founded — and its InterMapper products developed — by IT managers. The group's intimate understanding of network management continues to differentiate Dartware's technology.
InterMapper has been licensed to thousands of organizations around the world including financial, educational, healthcare, manufacturing, retail, and government organizations.
Related Documents