www.wuerth-phoenix.com/neteye Würth Phoenix S.r.l. www.neteye-blog.it NetEye Release Notes 2015 - Version 3.5 This document provides an overview of the new features and enhancements released on the WÜRTHPHOENIX NetEye version 3.5. Higher Performance, Better Reliability and More Usability The newly released NetEye version 3.5 represents an important milestone for the development of the solution. In addition to responding to customer needs, NetEye continues to align itself to the new requirements of the growing monitoring complexity generated by the introduction of cloud environments, web services and virtualizations. The new release optimizes NetEye’s performance, scalability and reliability, and extends the range of features as well as the sphere of action for the monitoring strategy. The version is released with an updated documentation for all the new features with the aim of achieving an even better quality. An overview of the major new enhancements will be provided in the following pages.

Welcome message from author
This document is posted to help you gain knowledge. Please leave a comment to let me know what you think about it! Share it to your friends and learn new things together.
Transcript
www.wuerth-phoenix.com/neteye Würth Phoenix S.r.l. www.neteye-blog.it
NetEye Release Notes 2015 - Version 3.5
This document provides an overview of the new features and enhancements released on the WÜRTHPHOENIX NetEye version 3.5.
Higher Performance, Better Reliability and More Usability
The newly released NetEye version 3.5 represents an important milestone for the development of the solution. In addition to responding to customer needs, NetEye continues to align itself to the new requirements of the growing monitoring complexity generated by the introduction of cloud environments, web services and virtualizations. The new release optimizes NetEye’s performance, scalability and reliability, and extends the range of features as well as the sphere of action for the monitoring strategy. The version is released with an updated documentation for all the new features with the aim of achieving an even better quality.
An overview of the major new enhancements will be provided in the following pages.

www.wuerth-phoenix.com/neteye Würth Phoenix S.r.l. www.neteye-blog.it
New simple and intuitive user interface Designed with a new concept of usage, the user interface has been simplified and homologate through the various modules of NetEye. The layout allows to perform more actions on the panels, to access to structured data and provides a more intuitive view for all the main NetEye modules:
ConfigTool
EventConsole
SMS Tool
Action Launchpad
NetEye Reporting
Make sense of a mountain of logs: The new LogManager It was not so simple to analyze the millions of data stored in the SyslogView module of the previous NetEye’s version. To make sense of the information through graphics and more intuitive views it has been substituted by the new LogManager by integrating Logstash, Elasticsearch and Kibana.
www.wuerth-phoenix.com/neteye Würth Phoenix S.r.l. www.neteye-blog.it
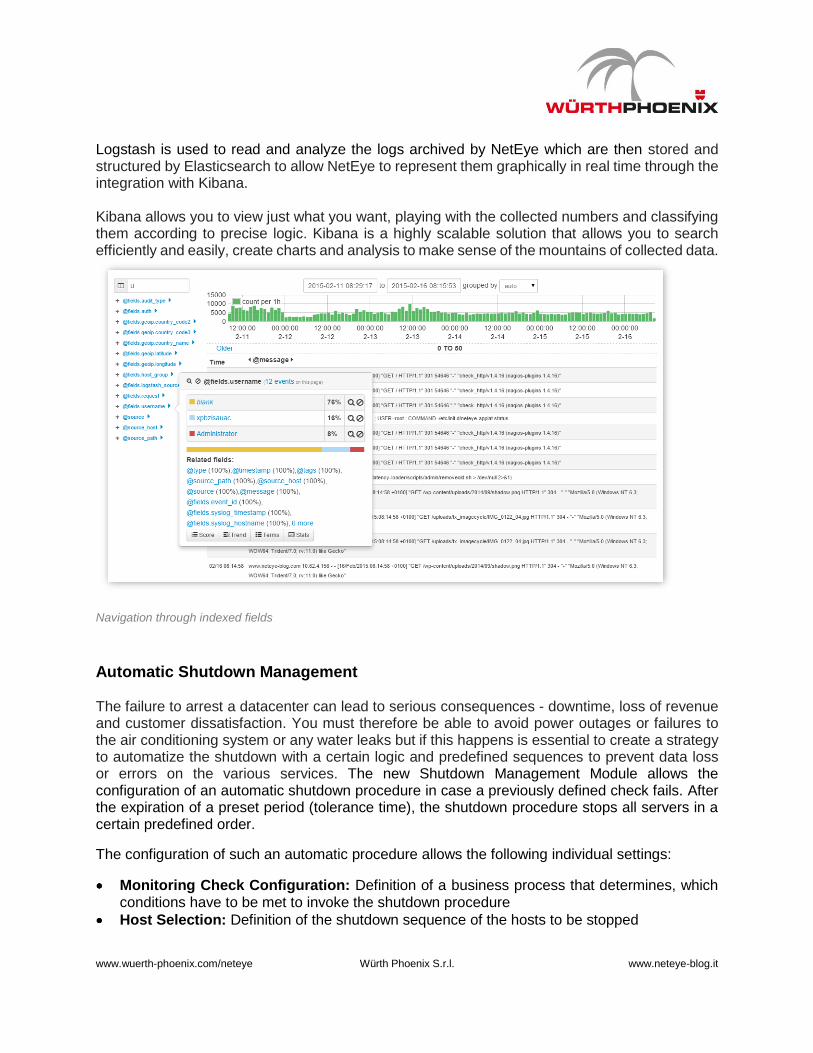
Logstash is used to read and analyze the logs archived by NetEye which are then stored and structured by Elasticsearch to allow NetEye to represent them graphically in real time through the integration with Kibana. Kibana allows you to view just what you want, playing with the collected numbers and classifying them according to precise logic. Kibana is a highly scalable solution that allows you to search efficiently and easily, create charts and analysis to make sense of the mountains of collected data.
Navigation through indexed fields
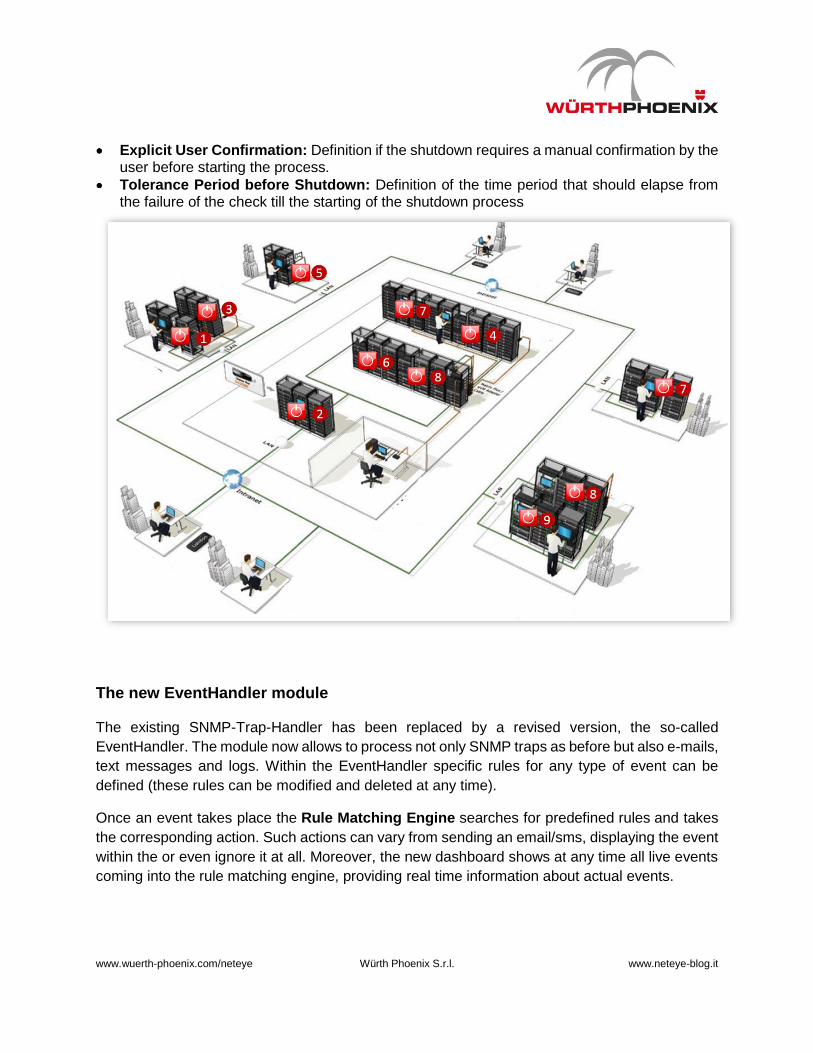
Automatic Shutdown Management The failure to arrest a datacenter can lead to serious consequences - downtime, loss of revenue and customer dissatisfaction. You must therefore be able to avoid power outages or failures to the air conditioning system or any water leaks but if this happens is essential to create a strategy to automatize the shutdown with a certain logic and predefined sequences to prevent data loss or errors on the various services. The new Shutdown Management Module allows the configuration of an automatic shutdown procedure in case a previously defined check fails. After the expiration of a preset period (tolerance time), the shutdown procedure stops all servers in a certain predefined order.
The configuration of such an automatic procedure allows the following individual settings:
Monitoring Check Configuration: Definition of a business process that determines, which conditions have to be met to invoke the shutdown procedure
Host Selection: Definition of the shutdown sequence of the hosts to be stopped
www.wuerth-phoenix.com/neteye Würth Phoenix S.r.l. www.neteye-blog.it
Explicit User Confirmation: Definition if the shutdown requires a manual confirmation by the user before starting the process.
Tolerance Period before Shutdown: Definition of the time period that should elapse from the failure of the check till the starting of the shutdown process
The new EventHandler module The existing SNMP-Trap-Handler has been replaced by a revised version, the so-called
EventHandler. The module now allows to process not only SNMP traps as before but also e-mails,
text messages and logs. Within the EventHandler specific rules for any type of event can be
defined (these rules can be modified and deleted at any time).
Once an event takes place the Rule Matching Engine searches for predefined rules and takes
the corresponding action. Such actions can vary from sending an email/sms, displaying the event
within the or even ignore it at all. Moreover, the new dashboard shows at any time all live events
coming into the rule matching engine, providing real time information about actual events.

www.wuerth-phoenix.com/neteye Würth Phoenix S.r.l. www.neteye-blog.it
Higher reliability with the latest updates of the integrated Open Source modules The various NetEye integrated modules have been upgraded the latest available version ensuring improved reliability and a wider range of features.
NeDi 1.4
GLPI 0.84
OCS Inventory 2.1
Cacti – Capacity Management 0.8
Thruk 1.84
NagVis 1.8
NagMap 1.6
DokuWiki 1.5
Webmin ServerAdministration 1.730
NFSen - Network Analysis 1.3
www.wuerth-phoenix.com/neteye Würth Phoenix S.r.l. www.neteye-blog.it
Easy life for the IT administrators: Optimization of the configuration process The monitoring configuration process for NetEye has been significantly simplified, by providing faster time and greater ease of use for the system administrators.
New Wizards
Monarch comes up with a new wizard structure, which facilitates the configuration of NeDi
Imports, GLPI Imports and NagMap Services.
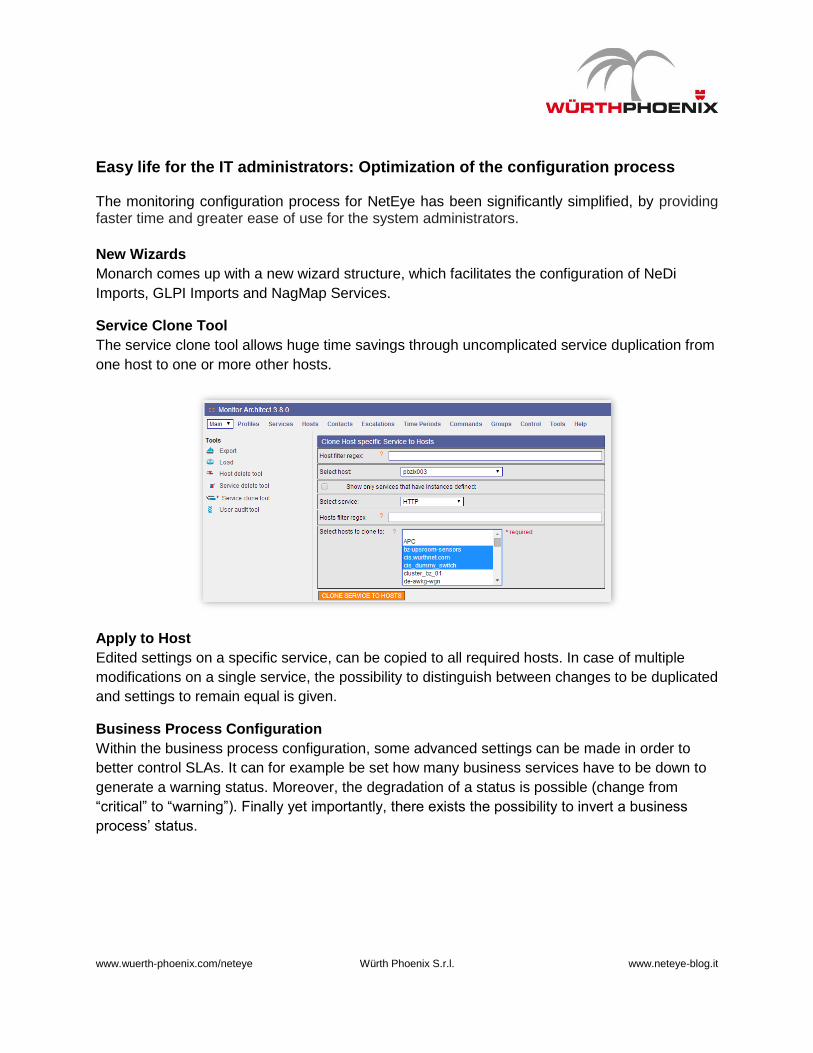
Service Clone Tool
The service clone tool allows huge time savings through uncomplicated service duplication from
one host to one or more other hosts.
Apply to Host
Edited settings on a specific service, can be copied to all required hosts. In case of multiple
modifications on a single service, the possibility to distinguish between changes to be duplicated
and settings to remain equal is given.
Business Process Configuration
Within the business process configuration, some advanced settings can be made in order to
better control SLAs. It can for example be set how many business services have to be down to
generate a warning status. Moreover, the degradation of a status is possible (change from
“critical” to “warning”). Finally yet importantly, there exists the possibility to invert a business
process’ status.
www.wuerth-phoenix.com/neteye Würth Phoenix S.r.l. www.neteye-blog.it
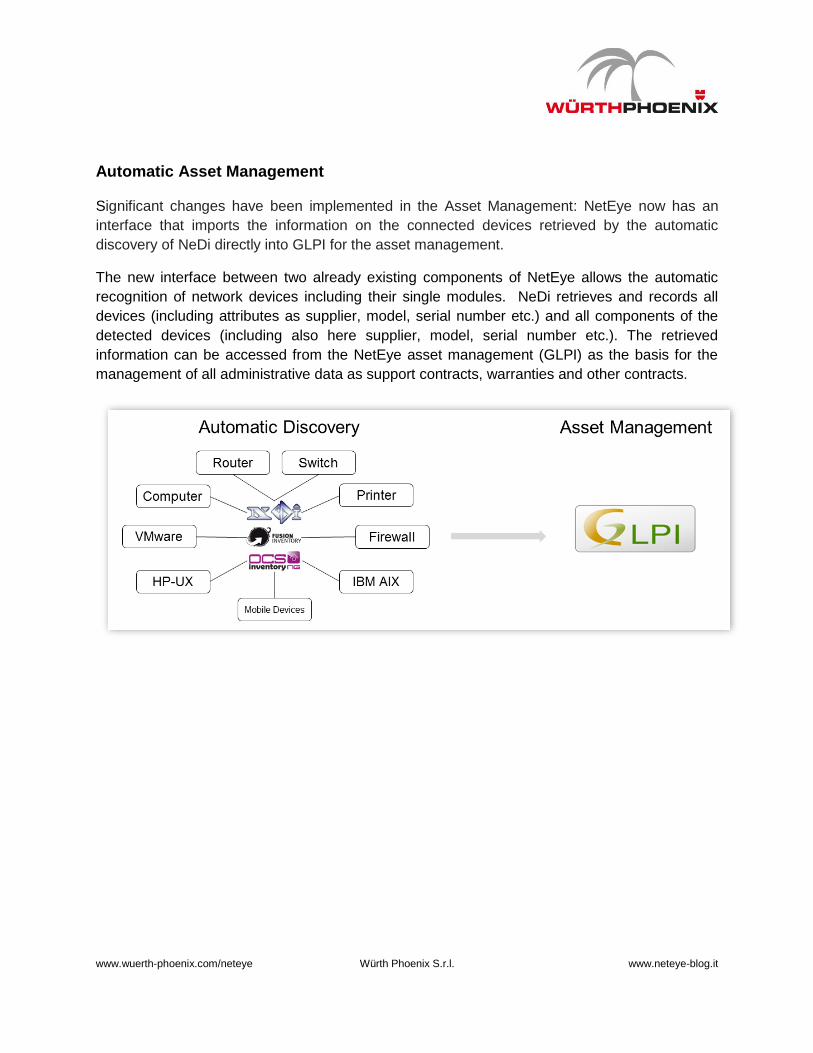
Automatic Asset Management Significant changes have been implemented in the Asset Management: NetEye now has an
interface that imports the information on the connected devices retrieved by the automatic
discovery of NeDi directly into GLPI for the asset management.
The new interface between two already existing components of NetEye allows the automatic
recognition of network devices including their single modules. NeDi retrieves and records all
devices (including attributes as supplier, model, serial number etc.) and all components of the
detected devices (including also here supplier, model, serial number etc.). The retrieved
information can be accessed from the NetEye asset management (GLPI) as the basis for the
management of all administrative data as support contracts, warranties and other contracts.

www.wuerth-phoenix.com/neteye Würth Phoenix S.r.l. www.neteye-blog.it
Easy and detailed SLA Reporting The new look and feel of the user interface of the NetEye Reporting tool and several new
features provide higher usability and extended functionalities for detailed reporting on SLA
monitoring.
Individual Report Creation: The report creation can be done directly on the user interface,
simply selecting the desired host, service, time period and SLA level.
Outage Logs Displaying: This feature provides the possibility to display critical outages,
showing when and for which period the service was unreachable or down.
New User Management: Created reports can be shared with other users (providing them just
reading permissions). Moreover, reports can be easily cloned to provide the possibility to modify
existing reports without losing the original version.
www.wuerth-phoenix.com/neteye Würth Phoenix S.r.l. www.neteye-blog.it
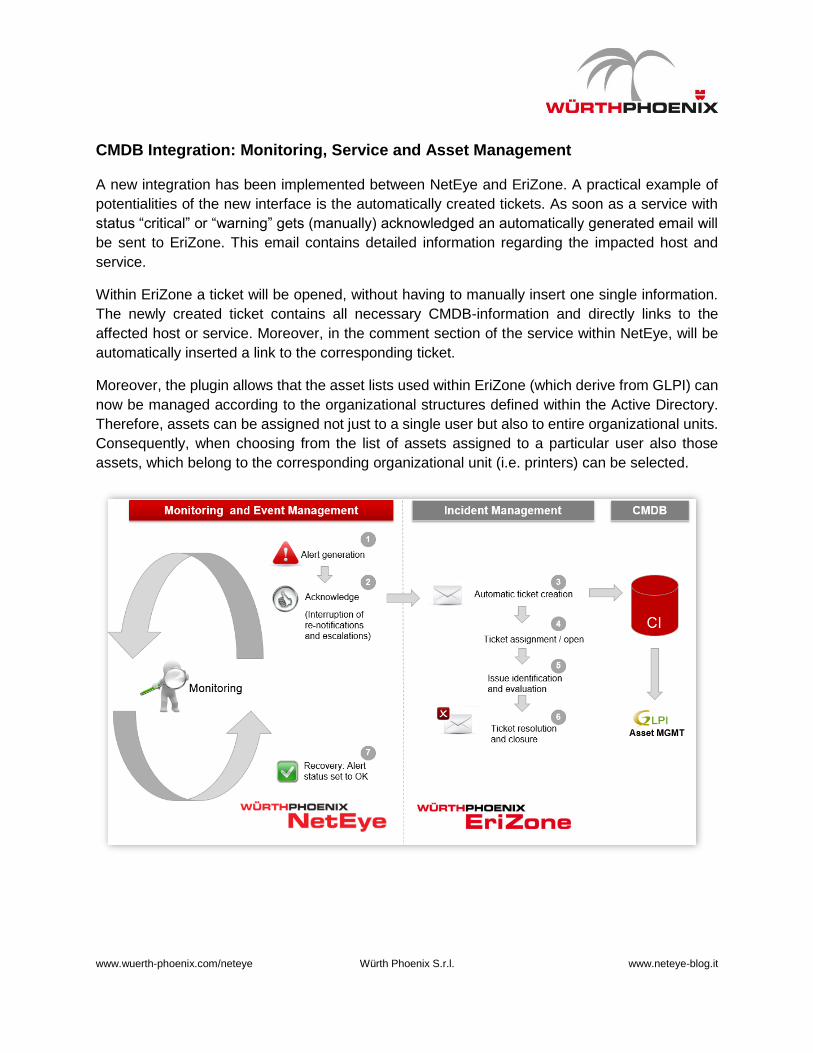
CMDB Integration: Monitoring, Service and Asset Management A new integration has been implemented between NetEye and EriZone. A practical example of
potentialities of the new interface is the automatically created tickets. As soon as a service with
status “critical” or “warning” gets (manually) acknowledged an automatically generated email will
be sent to EriZone. This email contains detailed information regarding the impacted host and
service.
Within EriZone a ticket will be opened, without having to manually insert one single information.
The newly created ticket contains all necessary CMDB-information and directly links to the
affected host or service. Moreover, in the comment section of the service within NetEye, will be
automatically inserted a link to the corresponding ticket.
Moreover, the plugin allows that the asset lists used within EriZone (which derive from GLPI) can
now be managed according to the organizational structures defined within the Active Directory.
Therefore, assets can be assigned not just to a single user but also to entire organizational units.
Consequently, when choosing from the list of assets assigned to a particular user also those
assets, which belong to the corresponding organizational unit (i.e. printers) can be selected.
www.wuerth-phoenix.com/neteye Würth Phoenix S.r.l. www.neteye-blog.it
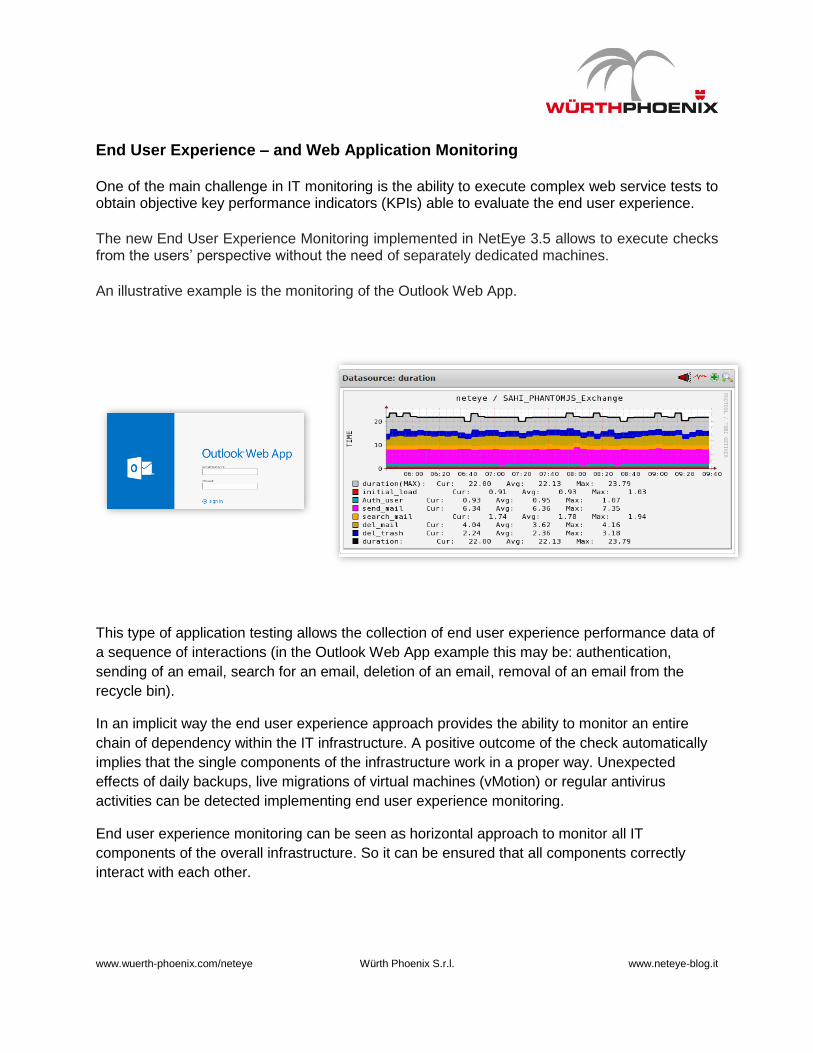
End User Experience – and Web Application Monitoring
One of the main challenge in IT monitoring is the ability to execute complex web service tests to obtain objective key performance indicators (KPIs) able to evaluate the end user experience.
The new End User Experience Monitoring implemented in NetEye 3.5 allows to execute checks from the users’ perspective without the need of separately dedicated machines.
An illustrative example is the monitoring of the Outlook Web App.
This type of application testing allows the collection of end user experience performance data of
a sequence of interactions (in the Outlook Web App example this may be: authentication,
sending of an email, search for an email, deletion of an email, removal of an email from the
recycle bin).
In an implicit way the end user experience approach provides the ability to monitor an entire
chain of dependency within the IT infrastructure. A positive outcome of the check automatically
implies that the single components of the infrastructure work in a proper way. Unexpected
effects of daily backups, live migrations of virtual machines (vMotion) or regular antivirus
activities can be detected implementing end user experience monitoring.
End user experience monitoring can be seen as horizontal approach to monitor all IT
components of the overall infrastructure. So it can be ensured that all components correctly
interact with each other.

www.wuerth-phoenix.com/neteye Würth Phoenix S.r.l. www.neteye-blog.it
On the other hand, classical monitoring through active checks on single IT components (CIs)
can be seen as vertical approach. The root cause of eventual interferences can be quickly
identified.
Business Service Monitoring
The two monitoring approaches can be combined in the Business Service Monitoring. Different
SLAs for diverse business critical services can be checked. The appropriate combination of the
two approaches depends of the SLA which has to be monitored. SLAs can be defined for the
single IT component as well as for the entire process (end-user experience performance SLA).
www.wuerth-phoenix.com/neteye Würth Phoenix S.r.l. www.neteye-blog.it
NetEye Add-ons Real User Experience in NetEye
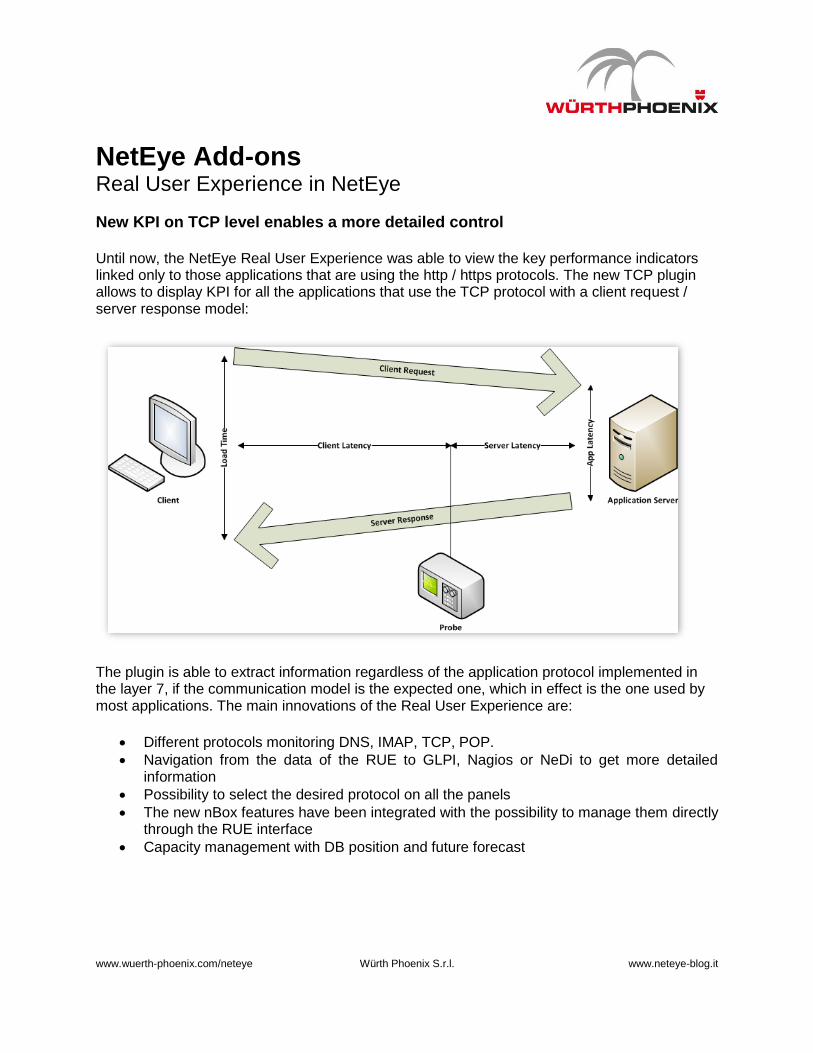
New KPI on TCP level enables a more detailed control
Until now, the NetEye Real User Experience was able to view the key performance indicators linked only to those applications that are using the http / https protocols. The new TCP plugin allows to display KPI for all the applications that use the TCP protocol with a client request / server response model:
The plugin is able to extract information regardless of the application protocol implemented in the layer 7, if the communication model is the expected one, which in effect is the one used by most applications. The main innovations of the Real User Experience are:
Different protocols monitoring DNS, IMAP, TCP, POP.
Navigation from the data of the RUE to GLPI, Nagios or NeDi to get more detailed information
Possibility to select the desired protocol on all the panels
The new nBox features have been integrated with the possibility to manage them directly through the RUE interface
Capacity management with DB position and future forecast

www.wuerth-phoenix.com/neteye Würth Phoenix S.r.l. www.neteye-blog.it
The innovative FrontEnd
New dashboard for an immediate and more intuitive overview
The right-click allows to navigate to other panels or to specific actions.
All the columns can be manually resized
The column position can be rearranged
It is possible to hide or show desired columns
Column order saving
Data export in CSV format for more detailed analysis
Related Documents