Nested Groundwater Monitoring Wells SV MW1 d SV MW2 SV‐MW1 and SV‐MW2 Initial Results of Drilling & Data Collection Project completed under California Department of Water Resources Local Groundwater Assistance Grant

Welcome message from author
This document is posted to help you gain knowledge. Please leave a comment to let me know what you think about it! Share it to your friends and learn new things together.
Transcript
Nested Groundwater Monitoring Wells SV MW1 d SV MW2SV‐MW1 and SV‐MW2
Initial Results of Drilling & Data Collectiong
Project completed underj pCalifornia Department of Water Resources Local
Groundwater Assistance Grant
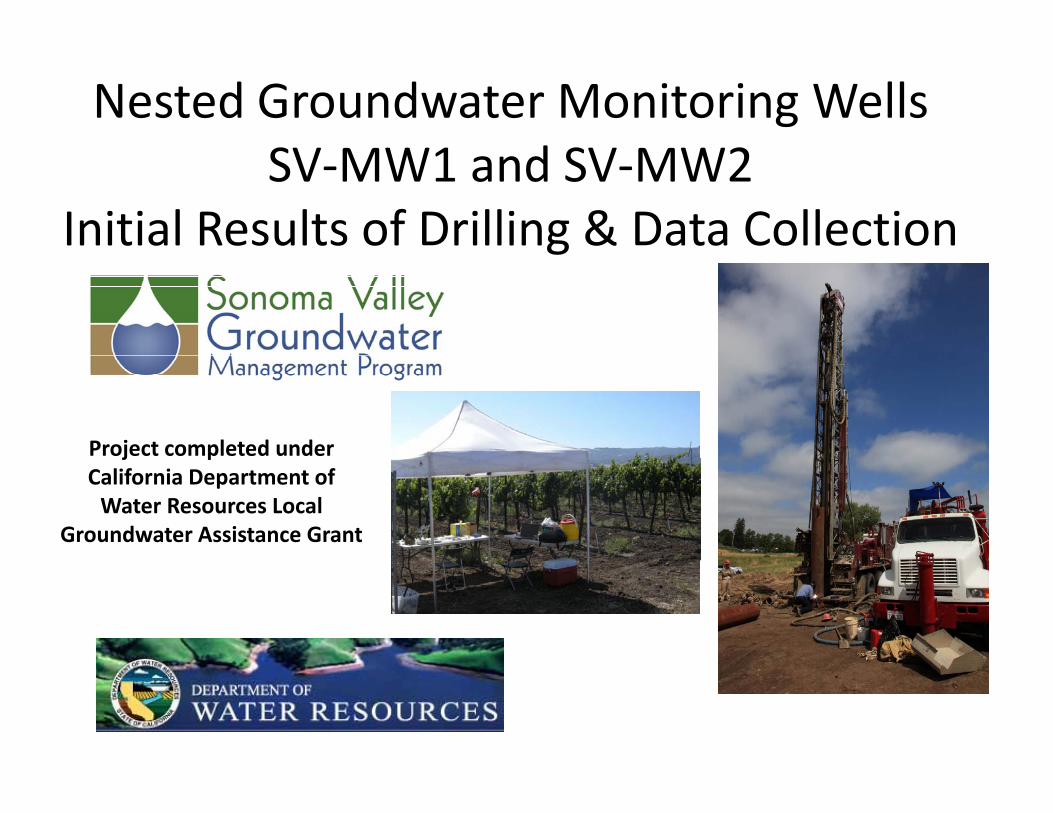
Location of Nested Groundwater Monitoring Wells
• At margins of groundwater‐level pumping depression and region of elevated salinity concentrations
• SV‐MW1 located along 8th St East just north of wastewater treatment plantg j p• SV‐MW2 located along Watmaugh Rd within 400 feet of Sonoma Creek

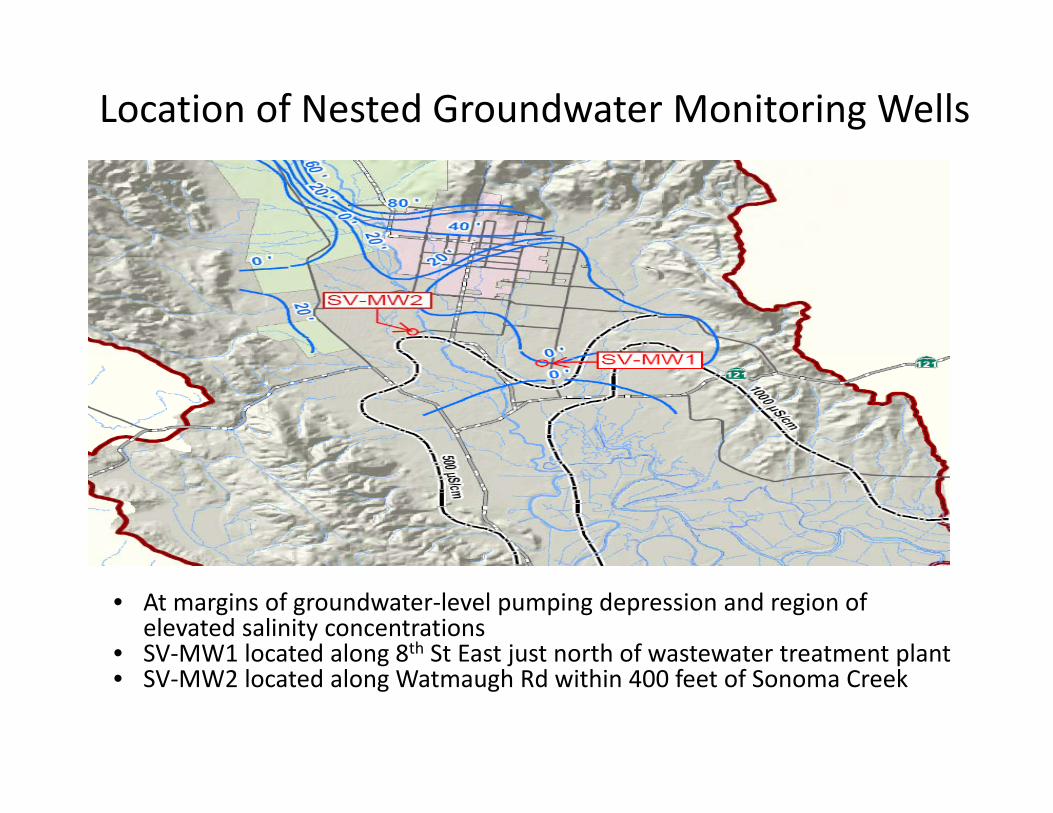
Geologic Findings• Permeable Sand and Gravel dominates shallow aquifer
(less than 100 feet deep).
• Lots of Clay and relatively thin Sand/Gravel zones y y /beneath 100 feet.
• Sand and Gravel aquifer zones and Clay aquitard zones correlate reasonably well between two locations and ymay be continuous.
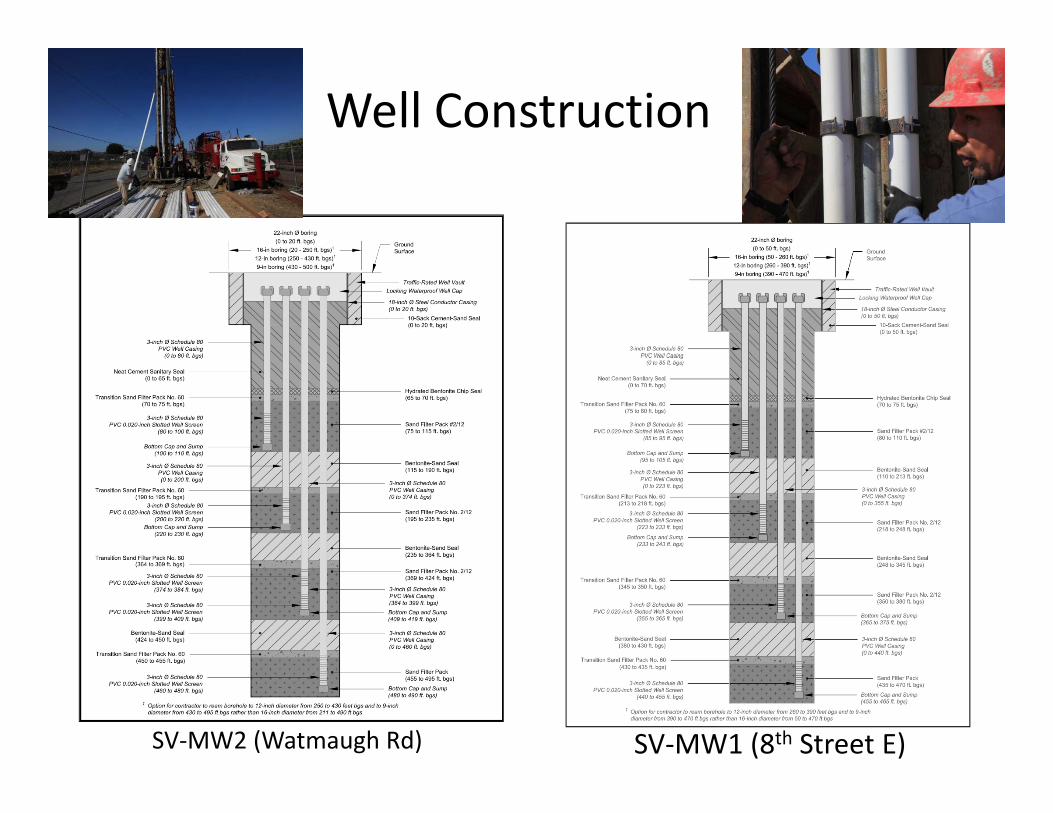
Well Construction
SV‐MW1 (8th Street E)SV‐MW2 (Watmaugh Rd)

4
5
20253035
ea Level)
Sonoma Valley Wells (SV‐MW1) Hydrograph
•Overall downward vertical gradient (except between 233
Shallower two zones are relatively stable through monitoring period
8th Street East
2
3
10‐505
101520
y Ra
infall (in
ches)
vation
(feet M
ean Sand 365 foot zones at times)
•Pumping influences appear most prominent in 365 foot zone and minor in 95 and 365 f t
0
1
‐35‐30‐25‐20‐15‐10
10/31/11 11/10/11 11/20/11 11/30/11 12/10/11 12/20/11 12/30/11 1/9/12
Daily
Water Level Elev
Deeper two zones display recovery over first 3 weeks of Nov. followed by general stability
foot zones
10/31/11 11/10/11 11/20/11 11/30/11 12/10/11 12/20/11 12/30/11 1/9/12
Precipitation SV‐MW1‐95 SV‐MW1‐233 SV‐MW1‐365 SV‐MW1‐455
535)
Sonoma Valley Wells (SV‐MW2) HydrographWatmaugh Rd
3
4
51015202530
(inches)
eet M
ean Sea Level
Shallower two zones are relatively stable through monitoring period
•Overall downward vertical gradient
•Greater separation between groundwater levels in
1
2
25‐20‐15‐10‐505
Daily Rainfall
Level Elevation
(fe
Deeper two zones display moderate recovery throughout monitoring period
shallower and deeper zones
•409 foot zone will also be instumented
S f t b b i
0‐35‐30‐25
10/31/11 11/10/11 11/20/11 11/30/11 12/10/11 12/20/11 12/30/11 1/9/12
Water
Precipitation SV‐MW2‐52 SV‐MW2‐100 SV‐MW2‐220 SV‐MW2‐480
•Surface water probe being installed nearby in Sonoma Creek to assess surface water & groundwater interaction
55
60
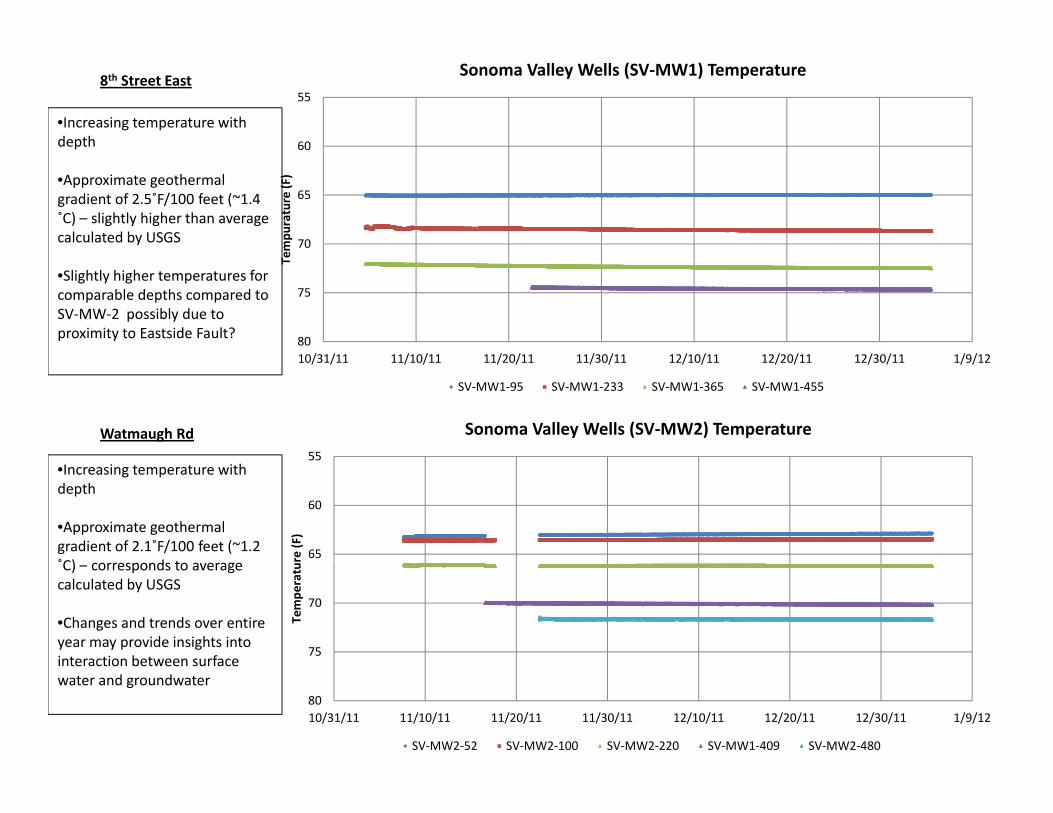
Sonoma Valley Wells (SV‐MW1) Temperature
•Increasing temperature with depth
8th Street East
65
70
empu
rature (F)•Approximate geothermal
gradient of 2.5˚F/100 feet (~1.4 ˚C) – slightly higher than average calculated by USGS
75
8010/31/11 11/10/11 11/20/11 11/30/11 12/10/11 12/20/11 12/30/11 1/9/12
Te•Slightly higher temperatures for comparable depths compared to SV‐MW‐2 possibly due to proximity to Eastside Fault?
10/31/11 11/10/11 11/20/11 11/30/11 12/10/11 12/20/11 12/30/11 1/9/12
SV‐MW1‐95 SV‐MW1‐233 SV‐MW1‐365 SV‐MW1‐455
55
Sonoma Valley Wells (SV‐MW2) TemperatureWatmaugh Rd55
60
65re (F)
•Increasing temperature with depth
•Approximate geothermal gradient of 2.1˚F/100 feet (~1.2 ˚C) d
70
75
Tempe
ratur˚C) – corresponds to average
calculated by USGS
•Changes and trends over entire year may provide insights into interaction between surface
8010/31/11 11/10/11 11/20/11 11/30/11 12/10/11 12/20/11 12/30/11 1/9/12
SV‐MW2‐52 SV‐MW2‐100 SV‐MW2‐220 SV‐MW1‐409 SV‐MW2‐480
interaction between surface water and groundwater

0.8
0.9
1
Sonoma Valley Wells (SV‐MW1) Electrical Conductivity
•EC slightly higher in deeper zone compared with shallow
8th Street East
0.4
0.5
0.6
0.7
ductivity (m
S/cm
)zone
•Concentrations consistent with findings from USGS study for this area
0
0.1
0.2
0.3
10/31/11 11/10/11 11/20/11 11/30/11 12/10/11 12/20/11 12/30/11 1/9/12
Cond
•Absence of short‐term fluctuations
10/31/11 11/10/11 11/20/11 11/30/11 12/10/11 12/20/11 12/30/11 1/9/12
SV‐MW1‐95 SV‐MW1‐455
1
Sonoma Valley Wells (SV‐MW2) Electrical ConductivityWatmaugh Rd
0.6
0.7
0.8
0.9
1
mS/cm
)
•EC highest in shallowest zone (potential influence from surface water?)
•Concentrations consistent with
0.2
0.3
0.4
0.5
Cond
uctivity (mfindings from USGS study for this
area
•Absence of short‐term fuluctuations
0
0.1
10/31/11 11/10/11 11/20/11 11/30/11 12/10/11 12/20/11 12/30/11 1/9/12
SV‐MW2‐52 SV‐MW2‐100 SV‐MW2‐480
Next Steps
• Submit Final Report to DWR.p
• Continue data collection and evaluation.
• Instrument and collect data from surface water in Sonoma Creek to assess surface water & groundwater interaction.
• Evaluate water quality samples collected from wells and assess potential need for additional well developmentassess potential need for additional well development.
• Incorporate detailed lithologic data into HydrostratigraphicFramework update.
• Incorporate data into update of Groundwater Flow Model.
Related Documents