PLAINVIEW NKTR-214: Pegging the Value at Zero October 2018 Nektar Therapeutics

Welcome message from author
This document is posted to help you gain knowledge. Please leave a comment to let me know what you think about it! Share it to your friends and learn new things together.
Transcript
PLAINVIEW
NKTR-214: Pegging the Value at ZeroOctober 2018
Nektar Therapeutics

PLAINVIEW
Legal Disclaimer
As of the date of this presentation, Plainview LLC, other research contributors, and others with whom we have shared our research (the “Authors”) have short positions in and may own option interests on the stock of the Company covered herein (Nektar Therapeutics) and stand to realize gains in the event that the price of the stock declines. Following publication, the Authors may transact in the securities of the Company. The Authors have obtained all information herein from sources they believe to be accurate and reliable. However, such information is presented “as is”, without warranty of any kind –whether express or implied – and without any representation as to the results obtained from its use. All expressions of opinion are subject to change without notice, and the Authors do not undertake to update this report or any information contained herein. This is not a recommendation to buy or sell any security.
1
PLAINVIEW
Table of Contents❑ Executive Summary
❑ Nektar Therapeutics & NKTR-214 Overview
❑ NKTR-214 Does Not Work• IL-2 works, NKTR-214 does not• Impact on lymphocytes misses efficacy bar by wide margin• NKTR-214 does very little for a very long time• NKTR-214 does not actually block Treg proliferation• TIL CD8+ claims are brazenly misleading• Bull thesis & clinical results are identical to epacadostat• ASCO 2018 response rates will not improve
❑ Concluding Thoughts
❑ Appendices
2

PLAINVIEW
Executive Summary (1/4)• IL-2 monotherapy has historically achieved a 15-29% ORR, while NKTR-214
monotherapy posted a 0% ORR (0/28) in the EXCEL trial. NKTR-214 does not work because its therapeutic effect (change in lymphocytes) is too weak. Past studies show that a 200-300% increase in lymphocytes is required for IL-2 to achieve a clinical response. In the PIVOT trial, NKTR-214 induced a 33-50% increase in lymphocytes, missing the efficacy bar by a mile
• NKTR-214’s limited impact is easy to explain: at its clinical dose, NKTR-214 yields 7-20% of the pharmacologically active drug exposure (AUC) of a standard IL-2 cycle, with Nektar’s most recent data putting it at the bottom end of that range (7-11%). NKTR-214 is even weaker than its AUC suggests because the AUC is principally driven by duration: NKTR-214 does very little for a very long time. NKTR-214 only reaches a peak active concentration of 2% of standard IL-2, and its PEG polymers hinder its ability to bind to the target receptor. NKTR-214 does not work for the same reason cooking a steak by heating it 4° F for 1,000 minutes instead of 400° F for 10 minutes doesn’t work
3

PLAINVIEW
Executive Summary (2/4)• NKTR-214 does not actually prevent proliferation of regulatory T cells
(Tregs), as evidenced by the 18-25x increases in peripheral Tregs post-NKTR-214 in Nektar’s ASCO 2017 investor presentation. This is because Tregsreach maximum proliferation at a tiny fraction (<1%) of the IL-2 exposure that it takes to induce measurable change in CD8+. Nektar claims that NKTR-214 has 85% specificity to IL2Rβγ; NKTR-214 would need 99%+ specificity in order to actually thwart Treg proliferation
• Nektar has masked NKTR-214’s lack of efficacy by touting an average 30-fold change in TIL CD8+ driven by a single outlier patient (n=10) who purportedly showed an extreme increase in CD8+, yet saw no clinical benefit. 3/9 of Nektar’s initial tumor biopsies showed a decline in TIL CD8+ following treatment with NKTR-214. TIL CD8+ counts can be affected by a myriad of confounding tumor-specific variables; given NKTR-214’s weak overall profile, it is highly unlikely that NKTR-214 actually has meaningful effect on TIL CD8+
4

PLAINVIEW
Executive Summary (3/4)• NKTR-214’s PIVOT ORRs are indistinguishable from epacadostat, which later
failed in the Phase 3 ECHO-301 trial. Phase 2 ORRs in oncology are virtually always higher due to enrolling healthier patient populations and relying on investigator assessments instead of blinded central review. Epacadostat + pembrolizumab posted a 55% Phase 2 ORR in 1L melanoma and a high PD-L1- response rate, followed by a 34% Phase 3 ORR in 1L melanoma (ASCO 2018)
• At ASCO 2018, Nektar implied that the decline in RCC/melanoma ORRs was due to immature data. This is not true– Nektar later published swimmer plots showing that the handful of melanoma/RCC non-responders remaining in Nektar’s PIVOT-02 trial as of ASCO 2018 had been on therapy for a median of 5 months and were already far past median time-to-response. Any future changes in response rates will be inconsequential
5

PLAINVIEW
Executive Summary (4/4)
• Nektar’s recent data opacity is unprecedented: in contrast to disclosing ORR for 95% (36/38) of dosed patients at SITC 2017, Nektar only disclosed the ORR for 31% (87/283) of dosed patients at ASCO 2018. During its Q2 2018 call, Nektar stealthily guided investors to expect data for only 10 additional patients at SITC 2018. The “data is immature” excuse is bogus: immature data is regularly shared via swimmer/spider plots and all 283 patients will be >6M from first dose by SITC 2018. First rule of biotechnology investing: if a company avoids sharing available clinical data with investors, that data is always bad
6
PLAINVIEW
Nektar Therapeutics Overview
• $11bn market capitalization
• Stock has tripled since mid-2017 based on high expectations for NKTR-214.
• We estimate NKTR-214 accounts for 85-90% of the current enterprise value
7

PLAINVIEW
NKTR-214 Overview
• NKTR-214 is a pegylated version of recombinant interleukin-2 (“IL-2”, “aldesleukin”, “Proleukin”), a naturally-occurring cytokine
• IL-2 was approved for treatment of metastatic melanoma and renal cell carcinoma in the 1990s• It is thought to work by stimulating proliferation of lymphocytes
• These lymphocytes, particularly CD8+ T cells, then attack tumor cells
• IL-2 is dosed in cycles. A patient receives a cycle of up to 14 doses of IL-2 over five days, rests for nine days, and then receives another cycle of up to 14 doses of IL-2. This is typically followed by a period of rest and evaluation, after which the patient may receive additional cycles of IL-2. For the purposes of comparing the PK/PD of IL-2 with NKTR-214 in this presentation, we are comparing only one standard five-day cycle of IL-2 with a single Q3W dose of NKTR-214
8

PLAINVIEW
NKTR-214 Overview (Cont’d)
• NKTR-214 is pegylated with six attached polyethylene glycol (PEG) molecules. For NKTR-214, pegylation achieves two goals:• blocks IL-2 from binding to the IL2Rαβγ receptor, preventing an increase in CD4+CD25+
Treg cells, which are thought to suppress the immune response
• increases half-life significantly (IL-2 has a short half-life)
• The PEG molecules also obscure target drug activity. NKTR-214 gradually sheds its PEG polymers through hydrolysis, and is inactive until it has shed at least 4 of the 6 attached PEG molecules:
9
PLAINVIEW
Point #1: IL-2 Works, NKTR-214 Does Not
• High-dose IL-2 monotherapy has been shown to work, with an objective response rate (“ORR”) of 15-29% in metastatic melanoma and renal cell carcinoma
• NKTR-214 completely whiffed as monotherapy (0% ORR)
• Pegylating IL-2 has been tried before, and appeared to detract from efficacy
• Clinical trials have shown that IL-2 does not appear to add any benefit when combined with other drugs. This includes a 2005 trial where IL-2 was combined with the checkpoint inhibitor Yervoy and investigators concluded that there were no synergies
• The thesis that NKTR-214 will succeed where IL-2 failed (combination therapy) after previously failing where IL-2 succeeded (monotherapy) is completely irrational
10IL-2 Works, NKTR-214 Does Not

PLAINVIEW
“Next-Generation” IL-2
• IL-2 produces a 15-29% ORR in metastatic melanoma and renal cell carcinoma (RCC) patients when dosed at or around the current prescribing label dose
• NKTR-214 yielded a 0% (0/28) ORR in its EXCEL trial
11IL-2 Works, NKTR-214 Does Not
IL-2 vs. NKTR-214
N Dose PR CR ORR
IL-2 Monotherapy - RCC
Fyfe et al 1995 255 0.037 to 0.044 mg/kg 8% 7% 15%
Klapper et al 1998 259 0.044 mg/kg 12% 9% 20%
Rosenberg et al 1994 149 0.044 mg/kg 13% 7% 20%
McDermott et al 2010 120 0.037 mg/kg 23% 6% 29%
Yang et al 2011 155 0.044 mg/kg 14% 7% 21%
McDermott et al 2005 95 0.037 mg/kg 15% 8% 23%
IL-2 Monotherapy - Melanoma
Rosenberg et al 1994 134 0.044 mg/kg 10% 7% 17%
Atkins et al 1999 270 0.037 to 0.044 mg/kg 10% 6% 16%
Law et al 1995 - Meta-analysis 1,291 Varied 10% 6% 16%
NKTR-214 Monotherapy
RCC 15 0.003 to 0.012 mg/kg 0% 0% 0%
Metastatic Melanoma 7 0.003 to 0.009 mg/kg 0% 0% 0%
Bladder Cancer 1 0.003 mg/kg 0% 0% 0%
Colorectal Cancer 1 0.006 mg/kg 0% 0% 0%
Breast Cancer 2 0.006 mg/kg 0% 0% 0%
Leiomyosarcoma 1 0.006 mg/kg 0% 0% 0%
Chondrosarcoma 1 0.006 mg/kg 0% 0% 0%

PLAINVIEW
Pegylated IL-2 Clinical Results• Pegylated IL-2 (PEG-IL-2) is not a new or novel idea–the first paper on pegylated IL-
2 was published in 1987 with human data published in 1991• PEG-IL-2 was eventually abandoned in the mid-1990s; a trial (Yang et al 1995)
comparing PEG-IL-2 maintenance therapy following IL-2 administration vs. IL-2 monotherapy found that PEG-IL-2 response rates were lower in RCC & melanoma:
The response rates (partial response and complete response) for patients with RCC and melanoma were 19% and 15%, respectively, for IL-2 alone and 17% and 11%, respectively, for the IL-2 and PEG-IL-2 combination.
• Baseline performance status (ECOG) was meaningfully skewed in favor of the PEG-IL-2 therapy group, reinforcing that PEG-IL-2 is a poor idea. Higher (worse) baseline ECOG status is correlated with lower response rates & shorter survival.
Baseline PS (ECOG) Arm A (IL-2) Arm B (IL-2 + PEG-IL-2)
0 68.3% 85.9%
1 23.3% 14.1%
2 8.3% 0.0%
12IL-2 Works, NKTR-214 Does Not
PLAINVIEW
“Turning Cold Tumors Hot” with IL-2 Has Already Failed
• The phrase “turning cold tumors hot” may be new, but the idea of combining IL-2 with checkpoint inhibitors is not
• A Phase 1/2 study (Maker et al 2005) tested whether or not combining high-dose IL-2 with the CTLA-4 antibody Yervoy (then owned by Medarex and known as MDX-010) could produce any synergistic effects in metastatic melanoma patients
• Maker et al concluded that there were no synergies after comparing the trial results (22% ORR) with prior Yervoy response rates in melanoma patients (21% ORR in Phan et al 2003 and 13% ORR in Attia et al 2005) and with prior IL-2 response rates in melanoma (17% in Rosenberg et al 1998 and 16% in Atkins et al 1993). The idea of “turning cold tumors hot” with IL-2 was abandoned
13IL-2 Works, NKTR-214 Does Not

PLAINVIEW
IL-2 Combination Therapy Results • For combination therapy in oncology, 2+2=3, not 2+2=5
• No oncology drug has ever completely failed as a monotherapy and gone on to hit statistical significance as part of a combination therapy. Many drugs that clearly work as monotherapy have later failed to show significant benefit as part of a combination therapy
• This is particularly true for IL-2. IL-2 indisputably works, but showed no benefit in any of its three randomized controlled combination trials:
• We find it highly unlikely that NKTR-214 (a pegylated version of IL-2) will succeed where IL-2 failed after failing where IL-2 succeeded
14IL-2 Works, NKTR-214 Does Not
IL-2 Combination Therapy Trial Results
Treatment Arms N Median OS (months)
Trial Indication Arm A Arm B Arm A Arm B Arm A Arm B p-value
Hauschild et al 2001 Melanoma Dacarbazine + IFN-a Dacarbazine + IFN-a + IL-2 144 137 11.0 11.0 0.52
Keilholz et al 2005 MelanomaDacarbazine + Cisplatin
+ IFN-a
Dacarbazine + Cisplatin +
IFN-a + IL-2180 183 9.0 9.0 0.31
Procopio et al 2013 RCC Sorafenib Sorafenib + IL-2 62 66 33.0 38.0 0.67

PLAINVIEW
Point #2: Impact on Lymphocytes Misses Efficacy Bar by Wide Margin
• IL-2 requires a 200-300% increase in lymphocytes in order to induce a response. Based on PIVOT trial data, NKTR-214 induces an average 33-50% increase in lymphocytes, missing the bar for efficacy by a wide margin and explaining why the response rate to NKTR-214 monotherapy was 0%
15Impact on Lymphocytes Misses Efficacy Bar by Wide Margin

PLAINVIEW
NKTR-214 Is Much Weaker than IL-2• Peak and sustained changes in lymphocytes induced by NKTR-214 are far lower than
the changes reported for high-dose IL-2 (see below). We note that zero patients in Ahmadzadeh & Rosenberg 2006 (right graph) responded-- as we will show in the next two slides, IL-2 responses require even higher peak & sustained lymphocyte levels
Impact on Lymphocytes Misses Efficacy Bar by Wide Margin 16
Source: Nektar ASCO 2017 Presentation
In the PIVOT trial, NKTR-214 + nivolumab increased peripheral lymphocytes by about 50% at peak and 33% at three weeks,
compared to 233% at peak and 100% at three weeks for IL-2
Source: Ahmadzadeh & Rosenberg 2006
NKTR-214 IL-2(720K IU/kg, median 9 doses)
Lym
ph
ocy
tes
(ALC
K/μ
L)

PLAINVIEW
300% Peak Lymphocyte Increase Required for Response
• Phan et al 2001 evaluated the change in lymphocytes for 374 melanoma patients treated with high-dose IL-2. Phan found that the difference in peak lymphocyte counts between responders and non-responders was highly significant (p=0.0026). Peak lymphocyte counts for both groups were much higher than peak counts for NKTR-214 patients:
Impact on Lymphocytes Misses Efficacy Bar by Wide Margin 17
0%
50%
100%
150%
200%
250%
300%
350%
IL-2 Responders IL-2 Non-Responders NKTR-214 (PIVOT)
Peak Change in Lymphocytes: IL-2 vs. NKTR-214
Lymphocytes (mean, k cells/uL)
Baseline Peak Increase
IL-2 Responders 1.5 5.9 305%
IL-2 Non-Responders 1.4 4.9 262%
NKTR-214 (PIVOT) 1.5 2.3 50%

PLAINVIEW
200% Sustained Lymphocyte Increase Required for Response
• Using a different dosing scheme for IL-2, Lissoni et al 1994 found that responders saw an average 217% increase in lymphocytes after three weeks of treatment, compared to Nektar’s reported ~33% increase at three weeks:
Impact on Lymphocytes Misses Efficacy Bar by Wide Margin 18
0%
50%
100%
150%
200%
250%
IL-2: Complete/PartialResponse
IL-2: Stable Disease IL-2: Progression NKTR-214 (PIVOT)
Avg
. C
ha
nge
in
Lym
ph
ocy
tes
fro
m B
ase
lin
e (%
)
Change in Lymphocytes @ 3 Weeks: IL-2 vs. NKTR-214
Lymphocytes Avg. Increase in Lymphocytes @ 3 Weeks
Baseline CR/PR Stable Disease Progression Overall
IL-21,2 1.19 2.57 1.00 0.43 1.16
Change from baseline (%) 217% 84% 36% 98%
NKTR-214 (PIVOT)2 1.50 NA NA NA 0.50
Change from baseline (%) NA NA NA 33%
Notes:
1 IL-2 administered as 6mm IU 5x per week for six weeks (standard IL-2 is 600K IU/kg 3x/day
for up to 14 doses per cycle)
2 Lymphocytes measured as k cells/uL

PLAINVIEW
Point #3: NKTR-214 Does Very Little for a Very Long Time
• At the clinical dose (0.006 mg/kg), NKTR-214’s pharmacokinetic profile yields only 7-20% of the total AUC of a standard IL-2 cycle, with Nektar’s most recent data indicating that AUC is in the low end of that range (7-11%). This is caused by NKTR-214’s low maximum tolerated dose and PEG polymers interfering with its activity
• The low cumulative effect is much weaker than it appears. NKTR-214 does very little for a very long time– its peak active concentration is 2% of the peak concentration of a single dose of IL-2. This will never work for the same reason why heating a steak by 4° F for 1,000 minutes instead of 400° F for 10 minutes doesn’t work – it never generates enough effect to overwhelm and kill the malignant cells
• NKTR-214 pegylation completely blocks drug activity for 76% of its AUC in humans and continues to interfere with the ability of NKTR-214 to bind with the target receptor even during the drug’s active state. Nektar’s preclinical data showed that at equivalent AUC, active NKTR-214 produced 73% lower target receptor binding vs. IL-2
19NKTR-214 Does Very Little for a Very Long Time

PLAINVIEW
NKTR-214-RC (All Conjugates) & NKTR-214-AC (Active State)
• When discussing NKTR-214, Nektar uses NKTR-214-RC to refer to all conjugates of the drug and NKTR-214-AC to refer to its active conjugates:
• The number refers to the number of PEG polymers attached to IL-2 at a particular state. (4-6)-PEG-IL2 refers to three different states of NKTR-214 where IL-2 is bound to 4, 5, and 6 PEG molecules. NKTR-214 is NKTR-214-AC (active conjugate) while in the 2-PEG-IL2, 1-PEG-IL2, and IL-2 states (2 PEGs, 1 PEGs, and 0 PEGs, respectively).
• We will use Nektar’s shorthand in this presentation
20NKTR-214 Does Very Little for a Very Long Time

PLAINVIEW
IL-2 is dosed at 0.037 mg/kg every 8 hours for up to 14 doses per cycle, which comes out to 14*0.037 = 0.518 mg/kg per patient per cycle
NKTR-214 is administered at 0.006 mg/kg once every 3 weeks–slightly longer than the time between initiating IL-2 cycles (2 weeks)
Relative Dosing: IL-2 Vs. NKTR-214• NKTR-214 and IL-2 are not administered at equivalent doses in practice.
IL-2 is dosed at 0.518/0.006 = 86.3x NKTR-214:
21NKTR-214 Does Very Little for a Very Long Time
Source: Proleukin prescribing label Source: SITC 2017 Presentation
Proleukin/aldesleukin is recombinant IL-2 IL-2 is dosed at 0.037 mg/kg every 8 hours for up to 14 doses per cycle, which comes out to 14*0.037 = 0.518 mg/kg per patient per cycle
NKTR-214 is administered at 0.006 mg/kg once every 3 weeks–slightly longer than the time between initiating IL-2 cycles (2 weeks)

PLAINVIEW
NKTR-214-AC AUC Is 7-20% of IL-2 AUC• Based on the results of a study analyzing the PK/PD profile of IL-2 in humans (Konrad
et al 1990, see Appendix for step-by-step calculations), the AUC for a standard cycle of IL-2 (14 doses of 600,000 IU/kg over a five-day period) ranges from:
73.6 to 108.1 ng*hr/mL * weight (kg)
• We calculated the AUC for NKTR-214-AC at the clinical dose (0.006 mg/kg) based on data from the Phase 1/2 EXCEL trial provided by Nektar (Hurwitz et al 2017 and Bentebibel et al 2017). Comparing these results with Konrad et al 1990, we find that NKTR-214-AC AUC is 7-20% of IL-2. Results below, data & calculations presented in Appendix.
Bentebibel et al 2017 Hurwitz et al 2017
NKTR-214-AC AUC 7.8 ng*h/mL per kg 15.0 ng*h/mL per kg
IL-2 AUC @ 73.6 ng*hr/mL*kg 73.6 ng*hr/mL per kg 73.6 ng*hr/mL per kg
IL-2 AUC @ 108.1 ng*hr/mL*kg 108.1 ng*hr/mL per kg 108.1 ng*hr/mL per kg
NKTR-214-AC AUC / IL-2 AUC 7.2% to 10.5% 13.8% to 20.4%
22NKTR-214 Does Very Little for a Very Long Time

PLAINVIEW
NKTR-214-AC Cmax & AUCHurwitz et al 2017 also shows that NKTR-214 is only active (NKTR-214-AC) for 24% of the time it is present in humans and NKTR-214-AC only reaches 15% of peak concentration of total NKTR-214 (NKTR-214-RC)
0.5 mg 0.75 mg
NKTR-214-RC Cmax 130 ng/mL 200 ng/mL
NKTR-214-AC Cmax 20 ng/mL 30 ng/mL
NKTR-214-RC AUC 5,000 ng*h/mL
8,000 ng*h/mL
NKTR-214-AC AUC 1,200 ng*h/mL
1,950 ng*h/mL
(AC Cmax)/(RC Cmax) 15.3% 15.0%
(AC AUC)/(RC AUC) 24.0% 24.4%
Source: ASCO GU 2017 Poster (Hurwitz et al)
23NKTR-214 Does Very Little for a Very Long Time
PLAINVIEW
NKTR-214-AC Cmax is 2.4% of IL-2 Cmax
• NKTR-214-AC peak concentration (Cmax) is consistent at ~15% of initial NKTR-214-RC dose based on both Hurwitz et al 2017 and Bentebibel et al 2017
• NKTR-214 is dosed at 0.006 mg/kg while IL-2 is dosed at 0.037 mg/kg for each dose, meaning that the peak NKTR-214-RC concentration is 0.006/0.037 = 16.2% of each IL-2 dose:
• Peak NKTR-214-AC concentration is therefore:
15% * 16% = 2.4% of IL-2 peak concentration
24NKTR-214 Does Very Little for a Very Long Time

PLAINVIEW
Visual Pharmacokinetic Comparison: NKTR-214 Vs. IL-2
0%
10%
20%
30%
40%
50%
60%
70%
80%
90%
100%
0 24 48 72 96 120 144 168
Dru
g C
on
cen
trat
ion
(% o
f IL
-2 C
ma
x)
Time (Hours)
Clinical Dose PK Comparison: IL-2 vs. NKTR-214
IL-2 Total Active + Inactive NKTR-214 (% of IL-2 Dose) Total Active NKTR-214 (% of IL-2 Dose)
Peak concentration of active NKTR-214 (NKTR-214-AC) is 2% of peak concentration of IL-2 and AUC is 7-20% of IL-2 due principally to NKTR-214’s long half-life
Peak concentration of total NKTR-214 concentration is 16% of IL-2
A standard cycle of IL-2 is dosed once every 8 hours for up to 14 times over five days (hence 14 peaks) followed by nine days of rest compared to NKTR-214, which is dosed once every three weeks
25NKTR-214 Does Very Little for a Very Long Time
• We can visualize the comparison based on available pharmacokinetic data:

PLAINVIEW
Pegylation Interferes With NKTR-214-AC Target Receptor Binding
• The actual effect is even weaker than the prior slide implies because pegylation continues to interfere with NKTR-214’s ability to bind with the target receptor (IL2Rβγ) even during NKTR-214’s active state (2-PEG-IL2 and 1-PEG-IL2)
• In Charych et al 2017, Nektar quantified this interference in by comparing receptor occupancy time for NKTR-214-AC vs. IL-2 assuming equivalent AUC and found pegylationreduced target receptor binding by 73.2% even during the active state:
NKTR-214 Does Very Little for a Very Long Time 26
The target receptor thought to drive expansion of NK/CD8+ T cells is IL2Rβγ. As this table shows, at an equivalent AUC, NKTR-214-AC only produces 695.8/2,598.7 = 26.8% of the IL2Rβγ receptor binding of IL-2

PLAINVIEW
Visualizing the Therapeutic Effect• Applying Nektar’s preclinical IL2Rβγ receptor-binding findings and ignoring other
variables, the therapeutic effect (target receptor binding) at any single point in time attributable to NKTR-214 would be <1% of the maximum amount for standard IL-2, making NKTR-214 even weaker than the direct AUC comparison would suggest:
27NKTR-214 Does Very Little for a Very Long Time

PLAINVIEW
Bringing It All Together
• At the clinical dose, the AUC of NKTR-214-AC is 7-20% of a standard cycle of IL-2 based on data provided in a February 2017 Nektar poster and a subsequent November 2017 Nektar poster, with the latest data indicating it is at the bottom of that range (7-11%)
• NKTR-214’s PEG polymers interfere with NKTR-214’s ability to bind with the target receptor during both its inactive state and active state. Based on Nektar’s preclinical data, IL-2 binds with the target receptor (IL2Rβγ) 3.7x as much as NKTR-214-AC given the same AUC: applying this to NKTR-214’s human data would mean that NKTR-214 actually occupies the target receptor for only 2-5% of the time compared to a standard cycle of IL-2
• End result is that NKTR-214 does very little, as evidenced by the disappointing change in peripheral lymphocytes
NKTR-214 Does Very Little for a Very Long Time 28

PLAINVIEW
Why Doesn’t Nektar Increase The Dose?• Short answer: Nektar tried and failed
• Pegylation backfired: the safety bar is raised significantly for NKTR-214 compared to IL-2 because of NKTR-214’s long half-life. With IL-2, dosing can be stopped prematurely if adverse events are observed. With NKTR-214, the entire dose is front-loaded and it can not be reversed or eliminated once administered. If NKTR-214 causes serious adverse events, nothing can be done to reduce the drug’s effect in a patient
• Nektar tried 0.012 mg/kg in one patient, who saw adverse events symptomatic of vascular leak (syncope and hypotension), a known adverse event linked to IL-2 that can lead to death
• 0.009 mg/kg also showed dose-limiting toxicities in patients
• 0.006 mg/kg proved to be the maximum tolerated dose
29NKTR-214 Does Very Little for a Very Long Time
PLAINVIEW
Point #4: NKTR-214 Doesn’t Actually Block Treg Proliferation
• Blocking IL-2 from binding to IL2Rαβγ in order to prevent Treg proliferation is an all-or-nothing game because as Roche showed, it takes more than 100x as much IL-2 exposure to induce any CD8+ expansion than it does to reach maximum impact on Tregs. This means that in order to reduce Tregproliferation while simultaneously expanding CD8+, an IL-2 derivative must be >99% specific to IL2Rβγ
• With a reported 85% specificity to IL2Rβγ, NKTR-214 is not specific enough to actually prevent IL-2 Treg expansion. NKTR-214 has similar effect on Tregproliferation as IL-2, as evidenced by the 18x peripheral increase in Tregsseen in the PIVOT trial as reported in Nektar’s ASCO 2017 presentation
30NKTR-214 Doesn’t Actually Block Treg Proliferation

PLAINVIEW
Blocking Tregs is an All-or-Nothing Game• In Klein et al 2017, Roche used a STAT5 phosphorylation assay to evaluate the amount
of IL-2 (and Roche’s IL-2 derivatives, CEA-IL2v and CEA-IL2wt) required to trigger increases in different types of lymphocytes, including Tregs, CD4+, and CD8+ cells.
• Roche found that Tregs reach maximum proliferation after being exposed to <1% of the IL-2 required to induce any proliferation of CD8+ cells. This means that in order to affect Treg expansion at all, an IL-2-based drug must show >99% specificity to IL2Rβγ:
NKTR-214 Doesn’t Actually Block Treg Proliferation 31
It takes <.01 nM of IL-2 (aldesleukin) to induce maximum proliferation of Treg cells, while it takes ~1 nM to see a meaningful increase in CD8+ T cells

PLAINVIEW
NKTR-214 Is Not Specific Enough to Prevent Treg Proliferation
• As Roche showed, an IL-2-derived drug must be >99% specific to IL2Rβγ in order to actually have reduce Treg proliferation while still impacting CD8+
• Based on Nektar’s publication Charych et al 2017, NKTR-214 binds to IL2Rβγ 5.9x as much as it binds to IL2Rαβγ, and it is 118.2/(695.8+118.2) = 85% specific to IL2Rβγ, meaning that, based on the Roche findings detailed on the prior slide, at a dose necessary to expand CD8+, it does not reduce Tregproliferation:
NKTR-214 Doesn’t Actually Block Treg Proliferation 32
PLAINVIEW
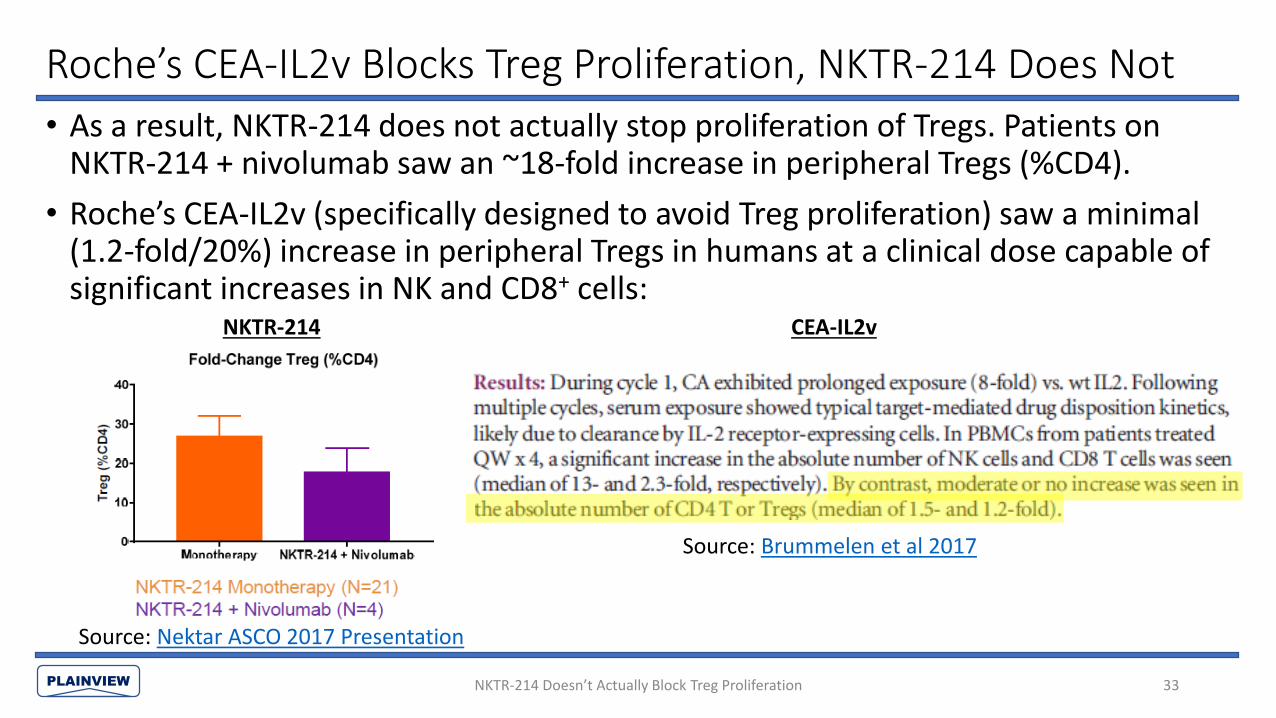
• As a result, NKTR-214 does not actually stop proliferation of Tregs. Patients on NKTR-214 + nivolumab saw an ~18-fold increase in peripheral Tregs (%CD4).
• Roche’s CEA-IL2v (specifically designed to avoid Treg proliferation) saw a minimal (1.2-fold/20%) increase in peripheral Tregs in humans at a clinical dose capable of significant increases in NK and CD8+ cells:
Source: Brummelen et al 2017
Source: Nektar ASCO 2017 Presentation
Roche’s CEA-IL2v Blocks Treg Proliferation, NKTR-214 Does Not
NKTR-214 Doesn’t Actually Block Treg Proliferation 33
NKTR-214 CEA-IL2v

PLAINVIEW
Roche’s IL-2 Variants Dominate NKTR-214• We believe that even if NKTR-214 did work, it would be dominated by Roche’s IL-2
variants, FAP-IL2v and CEA-IL2v
• Roche’s drugs are much more elegant versions of NKTR-214: with NKTR-214, Nektar is temporarily blocking the α receptor with PEG polymers in order to prevent binding with IL2Rαβγ. Roche completely abolished the receptor, and as a result FAP-IL2v and CEA-IL2v have much higher specificities to IL2Rβγ than NKTR-214
• Roche also bound its IL-2 variants with antibodies designed to bind to cancer cell proteins (CEA = cergutuzumab and FAP = fibroblast activation protein α). As a result, FAP/CEA-IL2v produce targeted tumor responses with IL-2 rather than systemic responses. This improves the safety profile and allows for Roche’s IL-2 variants to be dosed even higher than standard IL-2 and far higher than NKTR-214 (20 mg MTD for FAP-IL2v). See Appendix for further discussion of NKTR-214 vs. Roche’s IL-2 variants
NKTR-214 Doesn’t Actually Block Treg Proliferation 34

PLAINVIEW
Point #5: TIL CD8+ Claims are Brazenly Misleading
• Nektar’s initial SITC 2016 data revealed that 3/9 patients saw a decline in tumor-infiltrating lymphocyte (“TIL”) CD8+ following treatment with NKTR-214
• Nektar’s oft-touted 30x increase in TIL CD8+ relies on an average (n=10) that is skewed by a single patient who purportedly recorded an extreme increase in TIL CD8+ and saw no clinical benefit. The majority of other disclosed patients saw minimal change in TIL CD8+
• Intratumoral CD8+ measures are heterogeneous and can be tainted by tumor-specific factors that do not reflect overall change in CD8+. A much cleaner measure of NKTR-214’s effect on CD8+ proliferation would have been change in peripheral CD8+, which Nektar conspicuously avoided disclosing
• The disappointing overall change in total peripheral lymphocytes makes it highly unlikely that NKTR-214 actually has a meaningful effect on TIL CD8+
35TIL CD8+ Claims are Brazenly Misleading
PLAINVIEW
3/9 of Initial Tumor Biopsies Showed Declines in TIL CD8+
“Tumor biopsies were conducted in 9 patients, and 6 of those patients’ tumors revealed an up to 10-fold increase from baseline in CD8+ T cells and NK cells in the tumor microenvironment.”
Source: SITC 2016 Summary
• 6/9 increases means that 3/9 patients saw declines• No subsequent public disclosure of what percent of patients saw an
increase/decrease in TIL CD8+ following treatment with NKTR-214• Patients who saw decline in TIL CD8+ were all excluded from subsequent patient-
stratified graphs
36TIL CD8+ Claims are Brazenly Misleading
PLAINVIEW
CD8+ Data Presentation Creates Biased Appearance of Efficacy
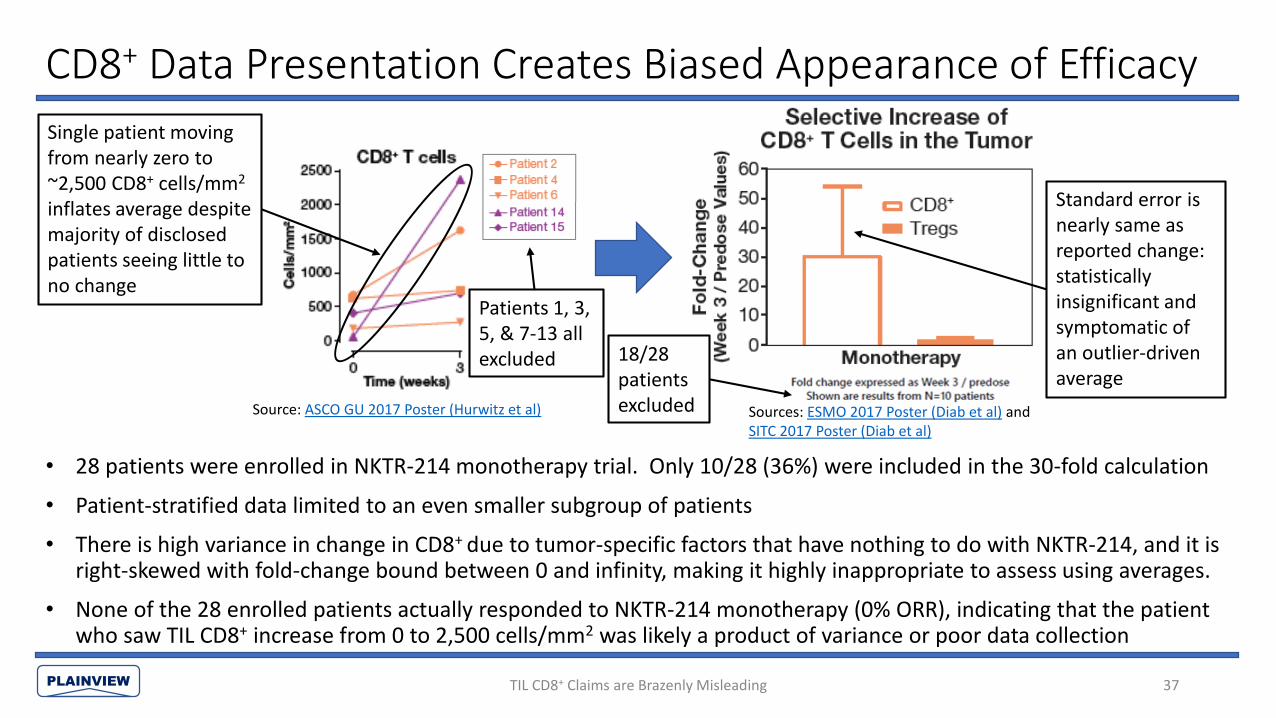
• 28 patients were enrolled in NKTR-214 monotherapy trial. Only 10/28 (36%) were included in the 30-fold calculation
• Patient-stratified data limited to an even smaller subgroup of patients
• There is high variance in change in CD8+ due to tumor-specific factors that have nothing to do with NKTR-214, and it is right-skewed with fold-change bound between 0 and infinity, making it highly inappropriate to assess using averages.
• None of the 28 enrolled patients actually responded to NKTR-214 monotherapy (0% ORR), indicating that the patient who saw TIL CD8+ increase from 0 to 2,500 cells/mm2 was likely a product of variance or poor data collection
37
Source: ASCO GU 2017 Poster (Hurwitz et al) Sources: ESMO 2017 Poster (Diab et al) and SITC 2017 Poster (Diab et al)
TIL CD8+ Claims are Brazenly Misleading
Single patient moving from nearly zero to ~2,500 CD8+ cells/mm2
inflates average despite majority of disclosed patients seeing little to no change
Standard error is nearly same as reported change: statistically insignificant and symptomatic of an outlier-driven average
Patients 1, 3, 5, & 7-13 all excluded 18/28
patients excluded
PLAINVIEW
What Happened to the Average-Skewing Patient?
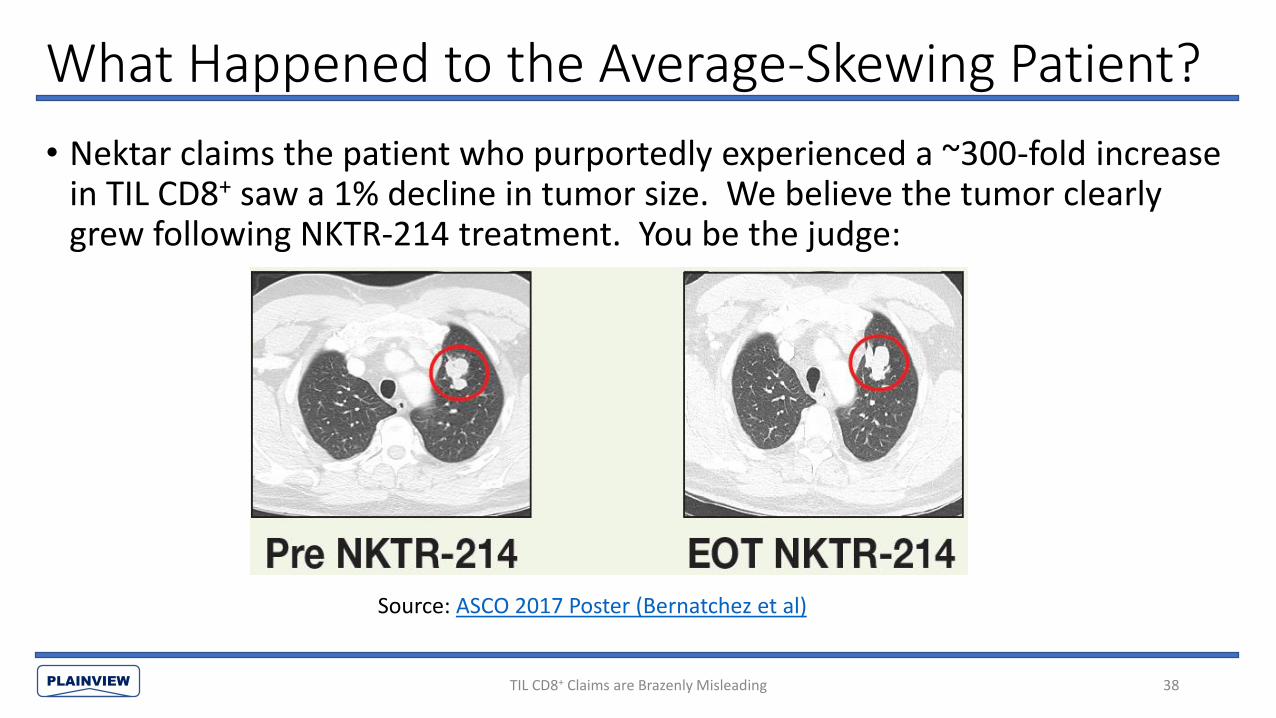
• Nektar claims the patient who purportedly experienced a ~300-fold increase in TIL CD8+ saw a 1% decline in tumor size. We believe the tumor clearly grew following NKTR-214 treatment. You be the judge:
Source: ASCO 2017 Poster (Bernatchez et al)
38TIL CD8+ Claims are Brazenly Misleading
PLAINVIEW
Test for TIL CD8+ is Imprecise
• TIL CD8+ counts per mm2 are determined using immunohistochemistry staining (IHC)
• IHC requires a lab assistant to stain a tumor sample, and then look at each cell within the sample and manually count how many CD8+ T cells, CD4+ T cells, etc. he/she sees. The lab assistant is typically not counting for the entire sample but for a sample within the sample and then extrapolating that for the entire sample.
• Predictably, this can lead to wild variation between readings
• Taking a step back, given that NKTR-214 drives a 33-50% increase in peripheral lymphocytes, it seems highly unlikely that it also drives a multi-fold increase in TIL CD8+
TIL CD8+ Claims are Brazenly Misleading 39

PLAINVIEW
Average Fold-Change is Misleading and Inappropriate
• Fold-change in CD8+ cells is heavily right-skewed with a lower bound of 0 and no upper bound:
• CD8+ cell counts are highly variable (Obeid et al 2017) and avg. change in CD8+ is easily distorted by low initial CD8+ count (small denominator)
Probability Distribution of Fold-Change in TIL CD8+
0-fold (-100%)
∞
40TIL CD8+ Claims are Brazenly Misleading

PLAINVIEW
Average Fold-Change is Misleading and Inappropriate
• Even if the samples were completely random, the average would be expected to imply an increase. Example:• N=2
• Patient 1: CD8+ moved from 100 cells/mm2 to 1 cells/mm2: 0.01x fold change
• Patient 2: CD8+ moved from 1 cell/mm2 to 100 cells/mm2: 100x fold change
• The results are random, but the average fold-change in CD8+ is: (100+.01)/2 ~ 50-fold increase
• We believe this is what happened with Nektar’s data
41TIL CD8+ Claims are Brazenly Misleading

PLAINVIEW
ASCO 2018 Data Also Outlier-Driven• At ASCO 2018, Nektar again presented average data (instead of median or patient-
stratified data) on change in CD8+ in NKTR-214/nivolumab combination therapy patients. Again, the average was outlier-driven and was significantly lower than the prior monotherapy data despite 1) segregating patients by response and 2) the fact that PD-1 inhibitor monotherapy has been proven to increase TIL CD8+ by itself
42TIL CD8+ Claims are Brazenly Misleading
Log scale makes it seem as though TIL CD8+ change in CR/PR is significant when in reality it is not: the standard error is nearly the same value as the reported increase in CD8+ (~10-fold). At ~1.2x standard error, the change is again statistically insignificant by a wide margin.
Nektar’s SITC 2017 O20 abstract reveals that this reported change, like the one before it, is outlier-driven with one patient recording a 450-fold increase in TIL CD8+:
“In tumor tissue, there was an up to 450‐fold increase in tumor‐infiltrating CD8+ T cells from baseline…”

PLAINVIEW
PD-1 Inhibitors Independently Drive Increase in TIL CD8+
• NKTR-214’s lack of significant effect on TIL CD8+ in combination with nivolumab among responders is especially damning because Tumeh et al 2014 has already shown that PD-1 inhibitors independently lead to significant increases in TIL CD8+ among responders (see graph)
43TIL CD8+ Claims are Brazenly Misleading
PLAINVIEW
NKTR-214’s Peripheral CD8+ Counts Nowhere to Be Found
• There are inherent problems with relying on TIL CD8+:• Samples can be highly heterogeneous even among samples taken from the same tumor in
the same patient
• Collecting tumor samples can be challenging/impossible for some patients
• TIL CD8+ counts are affected by many factors that have nothing to do with how well the drug works
• A far better measure of NKTR-214’s potency is change in peripheral CD8+. Peripheral CD8+ is more homogenous, not tainted by other factors, and easy to collect from all patients. Nektar has collected this data but chose not to publish it: we know this because Nektar took blood samples from enrolled patients, conducted flow cytometry on those samples, and provided selected (and irrelevant) CD8+ subgroup data. We show in the Appendix that, based on comparative analysis of animal trials and a human trial for a competing IL-2 derivative, NKTR-214’s impact on peripheral CD8+ was likely minimal in humans
TIL CD8+ Claims are Brazenly Misleading 44
PLAINVIEW
Limited Change in Ki67+CD8+ vs. PD-1 Inhibitor Monotherapy
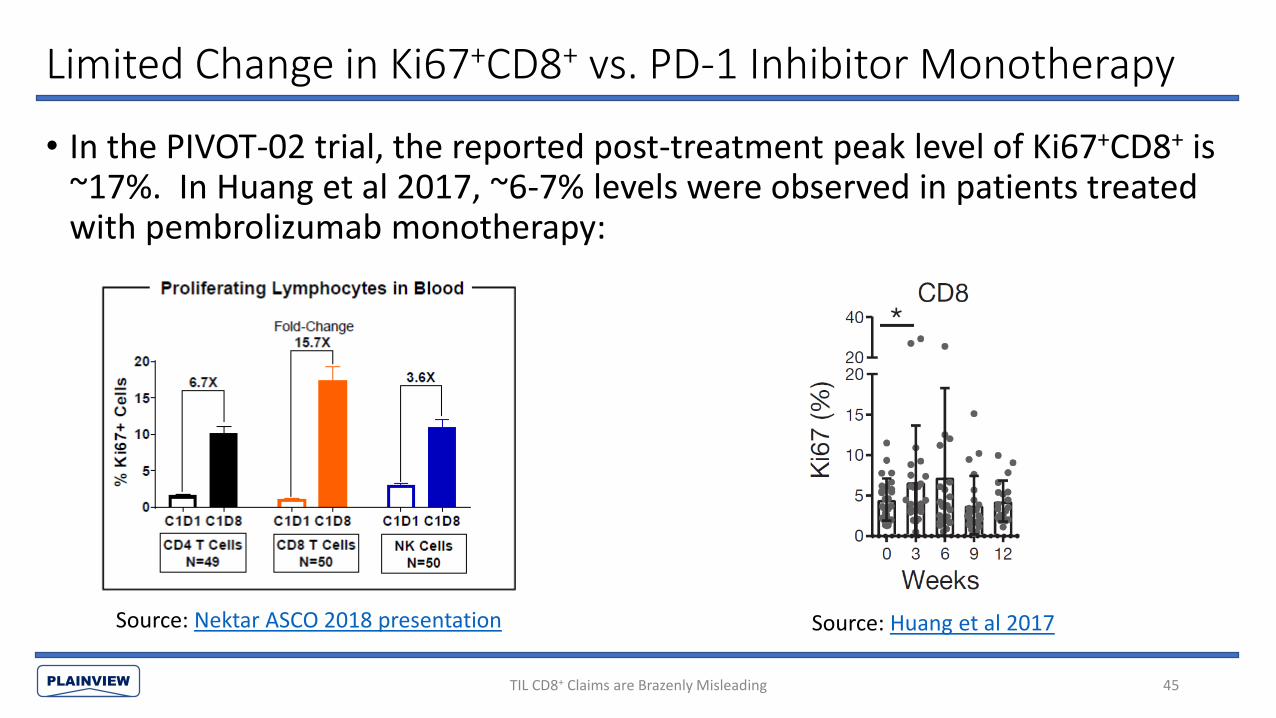
• In the PIVOT-02 trial, the reported post-treatment peak level of Ki67+CD8+ is ~17%. In Huang et al 2017, ~6-7% levels were observed in patients treated with pembrolizumab monotherapy:
TIL CD8+ Claims are Brazenly Misleading 45
Source: Nektar ASCO 2018 presentation Source: Huang et al 2017

PLAINVIEW
Change in % Ki67+ Does Not Translate to CD8+ Increase
• Nektar uses its change in Ki67+CD8+ T cells as a proxy for the actual change in CD8+ T cells. At a high level, it makes sense– one would instinctively think that if the percent of proliferating cells increases, this must also mean that the number of cells is increasing. However, this is wrong– a Roche study showed that change in Ki67+CD8+ T cells is not an accurate proxy for change in CD8+ T cells.
TIL CD8+ Claims are Brazenly Misleading 46
At 0.4 nM, Ki67+CD8+ T cells rise to ~30% (left graph) but total CD8+ T cells are virtually unchanged. Comparing this with Nektar’s reported 17% Ki67+ CD8+, we find it unlikely that Nektar saw a significant change in CD8+ T cells– explaining why Nektar chose to only provide this second-derivative biomarker rather than the actual peripheral CD8+ cell count
PLAINVIEW
Change in % Ki67+ Does Not Translate to CD8+ Increase
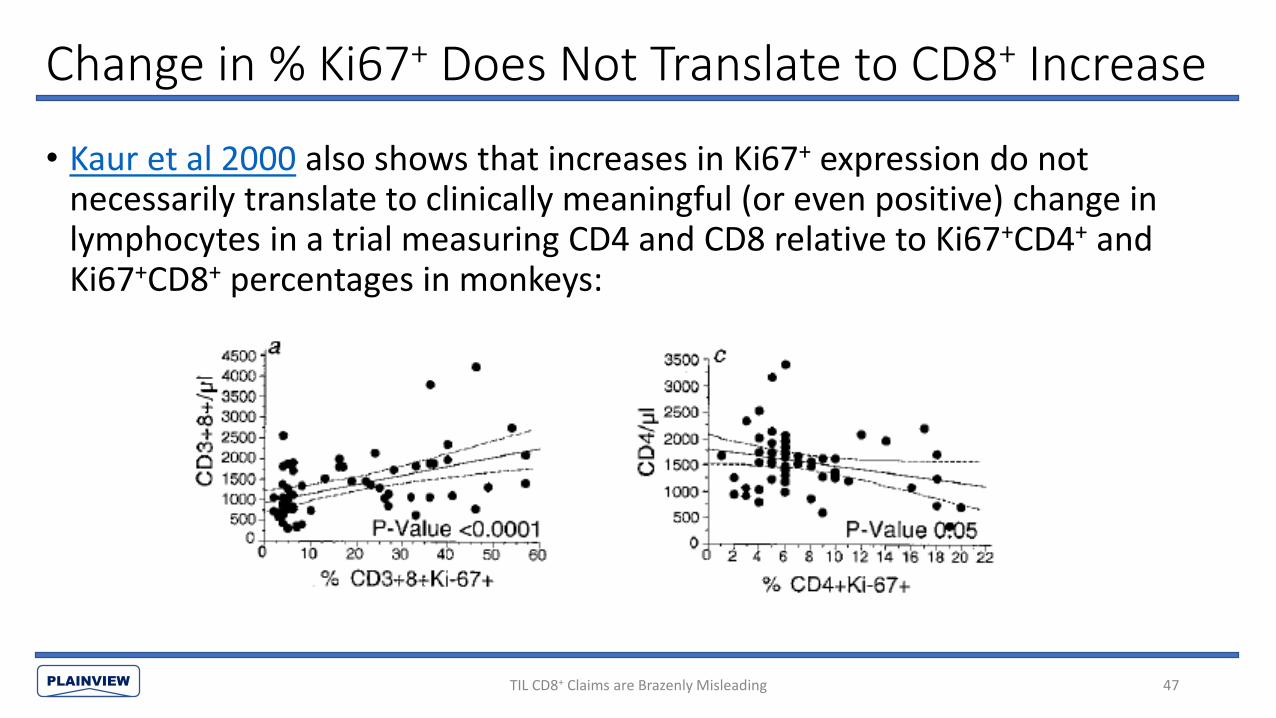
• Kaur et al 2000 also shows that increases in Ki67+ expression do not necessarily translate to clinically meaningful (or even positive) change in lymphocytes in a trial measuring CD4 and CD8 relative to Ki67+CD4+ and Ki67+CD8+ percentages in monkeys:
TIL CD8+ Claims are Brazenly Misleading 47

PLAINVIEW
Point #6: Bull Thesis & Clinical Results are Identical to Epacadostat
• Nektar has rallied heavily based on Phase 1/2 ORRs that compared well with precedent Phase 3 data for anti-PD-1 monotherapy and seemingly impressive response rates in PD-L1- patients when combined with a PD-1 inhibitor
• History rhymes: Incyte’s epacadostat, which also failed as a monotherapy, was valued at as much as $15bn based on the exact same analysis, and subsequently failed to show any benefit in the Phase 3 ECHO-301/KEYNOTE-252 trial
• Response rates are nearly always higher in Phase 2 vs. Phase 3 trials due to healthier patient populations and using local investigator tumor assessments instead of blinded central review; for instance, the 1L melanoma ORR for epacadostat + pembrolizumab declined from 55% in Phase 2 to 34% in Phase 3
• NKTR-214’s Phase 2 ORRs are indistinguishable when compared with the Phase 2 ORRs of recently-debunked IDO inhibitors, even when stratified by PD-L1 status
48Bull Thesis & Clinical Results are Identical to Epacadostat
PLAINVIEW
Epacadostat Does Nothing
49
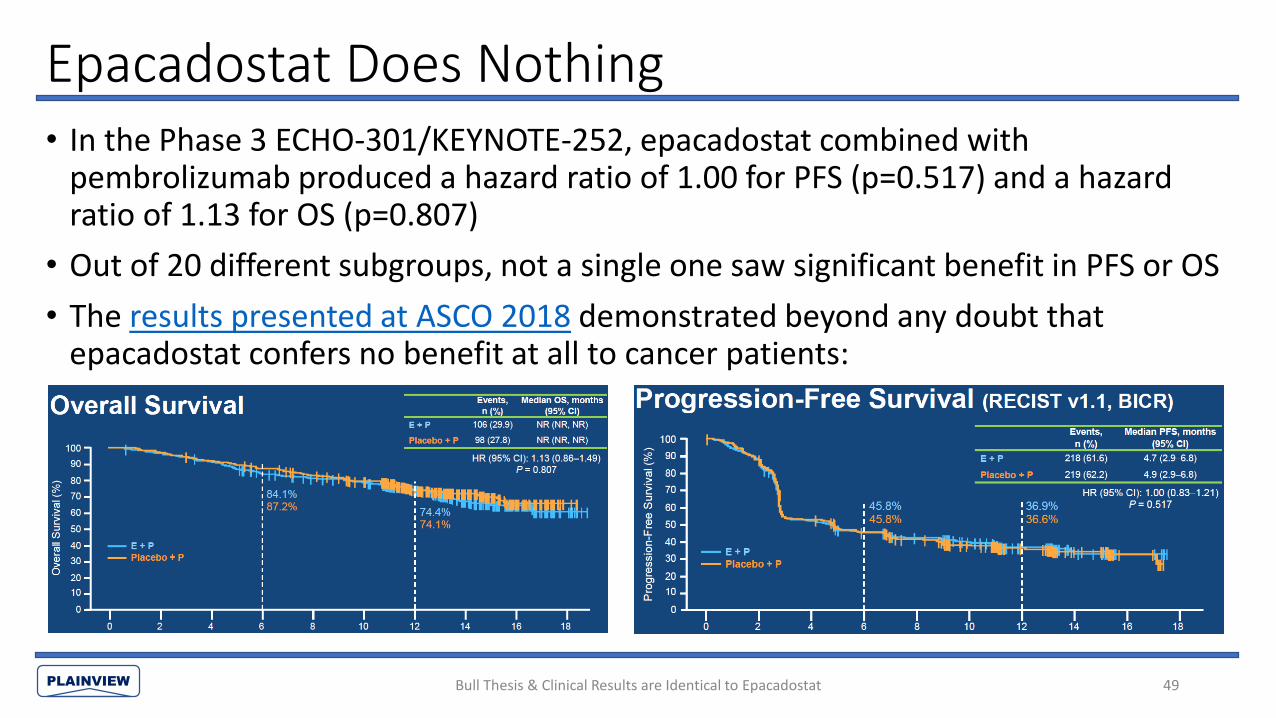
• In the Phase 3 ECHO-301/KEYNOTE-252, epacadostat combined with pembrolizumab produced a hazard ratio of 1.00 for PFS (p=0.517) and a hazard ratio of 1.13 for OS (p=0.807)
• Out of 20 different subgroups, not a single one saw significant benefit in PFS or OS
• The results presented at ASCO 2018 demonstrated beyond any doubt that epacadostat confers no benefit at all to cancer patients:
Bull Thesis & Clinical Results are Identical to Epacadostat

PLAINVIEW
Epacadostat Posted High PD-L1- ORRs in RCC
• Like NKTR-214 + nivolumab, epacadostat + pembrolizumab (E+P) also showed high response rates in some PD-L1- groups, which fueled speculation that combination therapy was synergistic
• For instance, at ASCO 2017, Incyte reported 1L-2L RCC response rates that were higher in the PD-L1- group than in the PD-L1+ group:
50
Epacadostat + Pembrolizumab ORR in 1L-2L RCC by PD-1 Status
PD-L1+ 50% (1/2)
PD-L1- 60% (3/5)
Overall 47% (9/19)
Source: Incyte ASCO 2017 Poster
Bull Thesis & Clinical Results are Identical to Epacadostat

PLAINVIEW
…And Similarly “Impressive” PD-L1- Results in Melanoma
• Epacadostat + nivolumab also showed high response rates for both PD-L1+
(75% ORR) and PD-L1- (56% ORR) patients in melanoma:
Bull Thesis & Clinical Results are Identical to Epacadostat 51

PLAINVIEW
Epa + Nivo Outperformed NKTR-214 + Nivo in Melanoma
• Epacadostat + nivolumab outperformed NKTR-214 + nivolumab in both PD-L1+ patients and PD-L1- patients:
52
1L Metastatic Melanoma – PD-L1- 1L Metastatic Melanoma – PD-L1+
N Trial ORR DCR N Trial ORR DCR
NKTR-214 + Nivolumab
12 PIVOT(ASCO 2018)
42% NA 13 PIVOT(ASCO 2018)
62% NA
Epacadostat + Nivolumab
16 ECHO-204(ASCO 2018)
56% 69% 12 ECHO-204(ASCO 2018)
75% 92%
Sources: Incyte ASCO 2018 Poster (Daud et al) & Nektar ASCO 2018 Abstract
Bull Thesis & Clinical Results are Identical to Epacadostat

PLAINVIEW
NKTR-214’s RCC Data on Par with Failed Epacadostat
• As of ASCO 2018, Nektar reported that NKTR-214 + nivolumab had achieved a Stage 1 + Stage 2 ORR of 46% (12/26) in 1L RCC
• At ASCO 2017, Incyte reported that epacadostat + pembrolizumab achieved a response rate of 47% (9/19) in 1L-2L RCC patients
53Bull Thesis & Clinical Results are Identical to Epacadostat

PLAINVIEW
Comparing Phase 2 with Phase 3 Burned Incyte Investors
• Like the bull thesis for NKTR-214, the bull thesis for epacadostat relied on comparing response rates between the Phase 2 epacadostat combination therapy results with Phase 3 results for anti-PD-1 monotherapies. Incyte encouraged this, and even made the comparisons for investors:
Bull Thesis & Clinical Results are Identical to Epacadostat 54
Source: Incyte ASCO 2017 Presentation

PLAINVIEW
Phase 2 Results Never Translate to Phase 3• The problem with comparing Phase 2 results with Phase 3 results is that ORRs for
oncology drugs are nearly always higher in Phase 2 trials than in Phase 3 trials• Baseline characteristics are nearly always worse in Phase 3 vs. Phase 2 because 1) Phase 3
trials have larger patient populations and 2) cherry-picking doesn’t help in controlled trials• Tumor measurements are subject to inter- and intra-observer variability (see Erasmus et al
2003, Oxnard et al 2011, and numerous other studies), and are influenced by local investigator bias in Phase 2 trials– investigators want to tell patients they are getting better. In Phase 3, ORR is typically determined using blinded independent central review, who have no interactions with patients
• Zhang et al 2017 compiled 28 trials with 17,466 patients, and on average, the investigator-assessed ORR was 25% higher (median 17% higher) than the blinded independent central review ORR (meaning that an investigator-assessed ORR of 40% would translate to a independent central review ORR of 30%)
• Zia et al 2005 compared 43 Phase 3 trials with 49 Phase 2 trials using identical treatments, and found that the ORR in Phase 3 trials was lower than preceding Phase 2 in 81% of cases with a mean difference of 12.9% (meaning that a Phase 2 ORR of 40% would translate to a Phase 3 ORR of 27.1%)
Bull Thesis & Clinical Results are Identical to Epacadostat 55
PLAINVIEW
Epacadostat: 55% Phase 2 ORR → 34% Phase 3 ORR
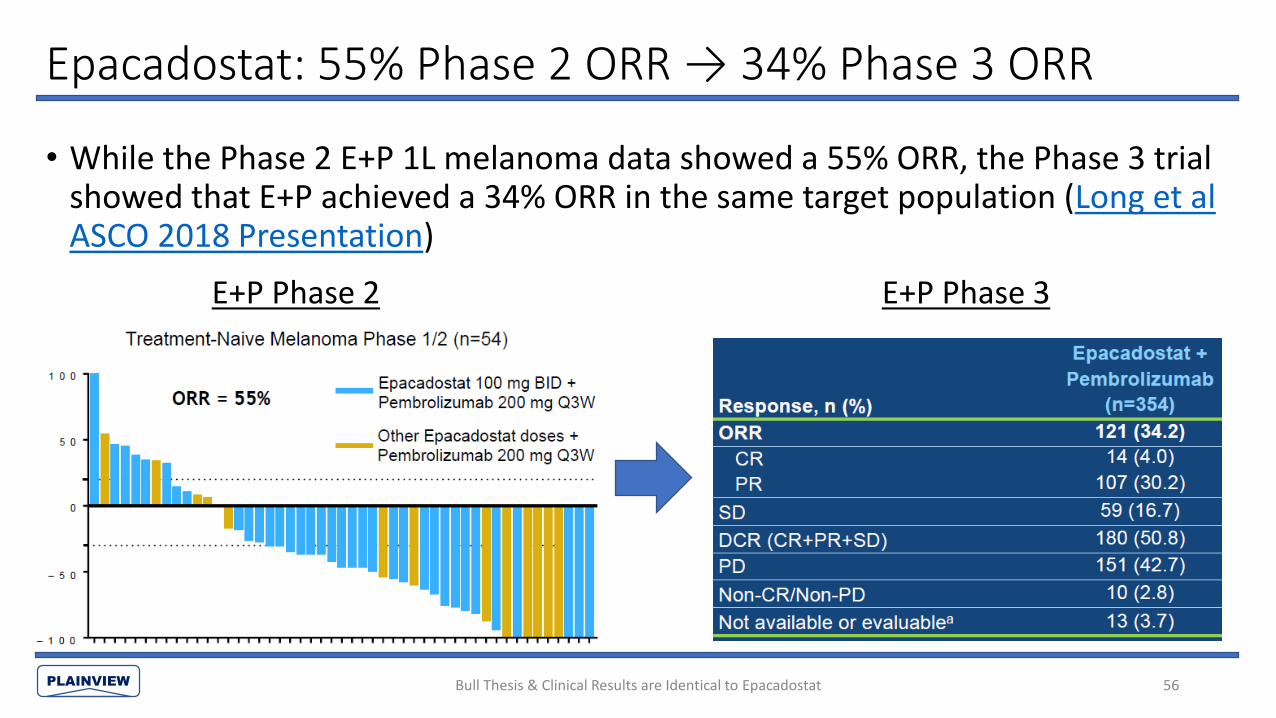
• While the Phase 2 E+P 1L melanoma data showed a 55% ORR, the Phase 3 trial showed that E+P achieved a 34% ORR in the same target population (Long et al ASCO 2018 Presentation)
Bull Thesis & Clinical Results are Identical to Epacadostat 56
E+P Phase 2 E+P Phase 3

PLAINVIEW
Phase 2 Results Should Be Compared with Other Phase 2 Results
• Like Incyte before it, Nektar is pushing the narrative that NKTR-214 must work because the ORR of NKTR-214 + nivolumab in the uncontrolled Phase 2 PIVOT-02 trial is higher than the ORR of nivolumab monotherapy in its Phase 3 trial
• Given that Phase 3 ORRs are typically lower than Phase 2 ORRs, a far more appropriate cross-trial comparison would be between Phase 2 results rather than Phase 2 ORR vs. Phase 3 ORR
Bull Thesis & Clinical Results are Identical to Epacadostat 57

PLAINVIEW
• When we make Phase 2 to Phase 2 comparisons between NKTR-214 and recently-debunked IDO inhibitors, NKTR-214’s results become completely indistinguishable:
No Difference Between NKTR-214 & IDO Inhibitors
Bull Thesis & Clinical Results are Identical to Epacadostat 58
NA NA NANA NA NA0%
10%
20%
30%
40%
50%
60%
70%
80%
90%
1L Melanoma 1L RCC 1L MelanomaPD-L1+
1L Melanoma PD-L1-
1L RCCPD-L1+
1L RCCPD-L1-
OR
R
Comparing Phase 2 Results: NKTR-214 on Par with Failed IDO Inhibitors
NKTR-214 + Nivolumab
Epacadostat + Pembrolizumab
Epacadostat + Nivolumab
Indoximod + Pembrolizumab

PLAINVIEW
No Difference Between NKTR-214 & IDO Inhibitors: Table & Sources
Notes & Sources:
1 NKTR-214 + nivolumab ORRs based on ASCO 2018 abstract & ASCO 2018 presentation
2 “All Patients” includes patients from dose escalation who were not included in Stage 1
3 Epacadostat + nivolumab ORRs based on ASCO 2018 abstract
4 Epacadostat + pembrolizumab melanoma ORRs from ESMO 2017, RCC ORRs from ASCO 2017
5 Epacadostat + pembrolizumab RCC data was 1L-2L while NKTR-214 + nivolumab data was all 1L
6 Indoximod + pembrolizumab ORRs based on ASCO 2018 poster
7 28/70 indoximod + pembrolizumab melanoma patients were 2L+ vs 1L for all NKTR-214 + nivolumab patients
Bull Thesis & Clinical Results are Identical to Epacadostat 59
Combination Therapy Results in Melanoma & RCC
NKTR-214 + Nivolumab1 IDO Inhibitor + PD-1 Antibody
Stage 1 + Stage 2 All Patients2 Epa + Nivo3 Epa + Pem4 Indoximod + Pem6
All Patients
1L Melanoma 50% (14/28) 47% (15/32) 65% (26/40) 55% (29/53) 56% (39/70)7
1L RCC 46% (12/26) 52% (15/29) NA 47% (9/19)5 NA
PD-L1+
1L Melanoma NA 62% (8/13) 75% (9/12) 52% (17/33) 77% (17/22)7
1L RCC NA 57% (4/7) NA 50% (1/2)5 NA
PD-L1-
1L Melanoma NA 42% (5/12) 56% (9/16) 14% (1/7) 42% (8/19)7
1L RCC NA 54% (7/13) NA 60% (3/5)5 NA

PLAINVIEW
Point #7: ASCO 2018 Response Rates Will Not Improve
• Nektar’s stock plunged 42% following ASCO 2018, where Nektar: • Only disclosed ORRs for 31% (87/283) of patients enrolled; a sharp contrast to the
95% (36/38) ORR disclosure at SITC 2017• Reported a large decline in ORR in Stage 2 melanoma/RCC patients compared to the
prior dose escalation/Stage 1 data
• Nektar’s excuse that the data can not be shared because some of the patients are not mature enough is bogus– that is what patient-stratified spider/swimmer plots are for
• We believe the melanoma & RCC ORRs will not improve materially in the future. A patient-stratified chart in Nektar’s June 6 2018 Jefferies presentation revealed that there are only a handful of RCC/melanoma non-responders still enrolled in PIVOT-02 as of ASCO 2018, and they were all already well-past median time-to-response
60ASCO 2018 Response Rates Will Not Improve

PLAINVIEW
Vast Majority of Patient Response Data Not Reported
• The PIVOT trial had 162 safety-evaluable patients as of February 7, 2018 and 283 safety-evaluable patients as of May 7, 2018, the vast majority of which should have been efficacy-evaluable by the May 29, 2018 ASCO 2018 data cut-off
• Nektar has opted to exclude 69% of those patients from its publicly disclosed ORRs
ASCO 2018 Response Rates Will Not Improve 61
SITC 2017
• Patients dosed (safety-evaluable): 38
• Patients included in ORRs: 95% (36/38)
ASCO 2018
• Patients dosed as of May 7, 2018: 283
• Patients included in ORRs: 31% (87/283)

PLAINVIEW
What Data Is Being Withheld from Shareholders?
• Virtually no patient data at all was provided for seven out of tenPhase 2 cohorts (Melanoma 2/3L, RCC 2/3L, NSCLC 1L, NSCLC 2L, NSCLC 2L I-O R/R, UC 2/3L, & TNBC 1/2L). One of the abstracts listed stale (Feb 7, 2018) response rates for nine total patients from the 1L TNBC and 1L-2L NSCLC
ASCO 2018 Response Rates Will Not Improve 62
Source: Nektar ASCO 2018 Oral Presentation
PLAINVIEW
Pay No Attention to That Data Behind The Curtain
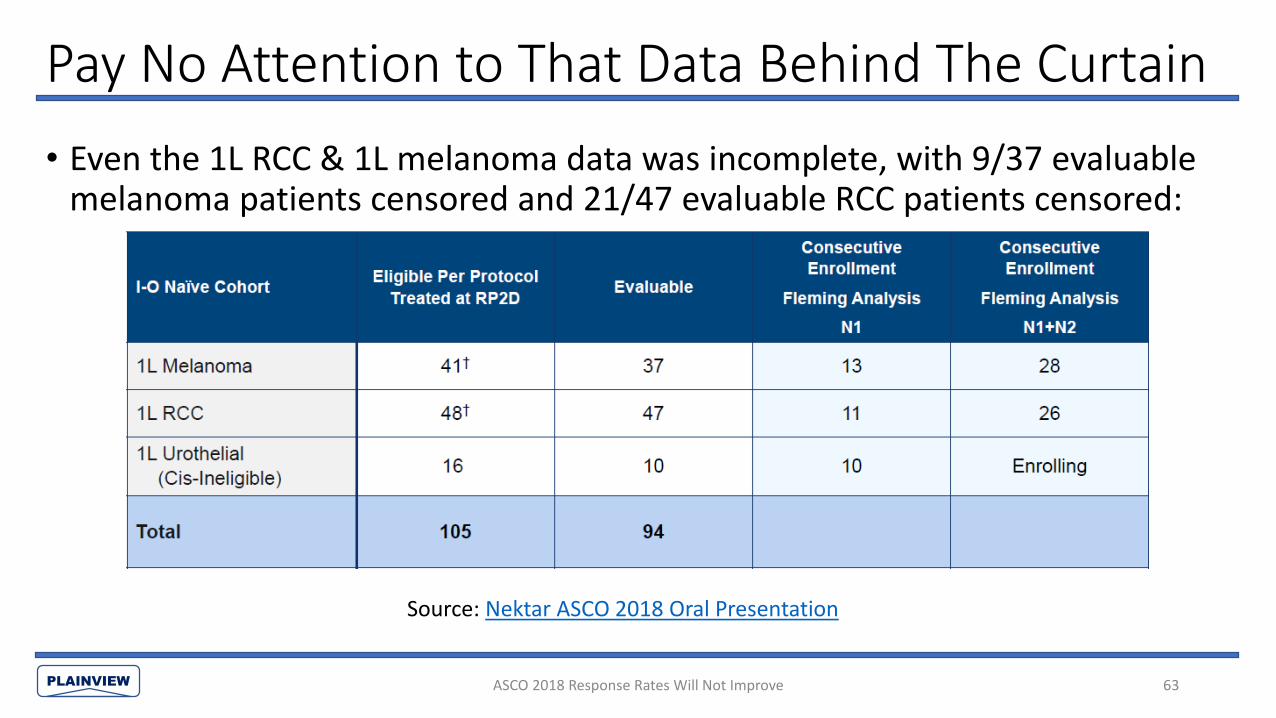
• Even the 1L RCC & 1L melanoma data was incomplete, with 9/37 evaluable melanoma patients censored and 21/47 evaluable RCC patients censored:
ASCO 2018 Response Rates Will Not Improve 63
Source: Nektar ASCO 2018 Oral Presentation

PLAINVIEW
Breakdown of Public NKTR-214/Nivolumab Data
ASCO 2018 Response Rates Will Not Improve 64
NKTR-214 + Nivolumab Combination Therapy Response Rate Disclosures
SITC 2017 ASCO 2018 Overall4
Dose Escalation Dose Escalation Stage 1 Stage 23 Stage 1 + Stage 2 Uncategorized
1L Melanoma1 64% (7/11) 64% (7/11) 85% (11/13) 20% (3/15) 50% (14/28) NA 47% (15/32)
1L RCC2 46% (6/13) 71% (10/14) 64% (7/11) 33% (5/15) 46% (12/26) NA 52% (15/29)
2L RCC 14% (1/7) NA NA NA NA NA 14% (1/7)
1L-2L NSCLC 60% (3/5) 60% (3/5) NA NA NA 0% (0/1) 50% (3/6)
Urothelial NA NA 60% (6/10) NA 60% (6/10) NA 60% (6/10)
TNBC NA NA NA NA NA 33% (1/3) 33% (1/3)
Total ORRs Disclosed 36 31 34 30 64 4 87
Total Patients Dosed 38 NA NA NA NA NA 283
Notes:
1 7 patients from melanoma dose escalation moved to Stage 1
2 11 patients from RCC dose escalation included in Stage 1
3 Stage 2 excluding Stage 1 data
4 We can determine which dose escalation responders were moved to Stage 1 based on Nektar's ASCO disclosure & the
swimmer plots in its Jefferies presentation (7 melanoma patients (6/7 ORR) and 11 RCC patients (7/11 ORR))
PLAINVIEW
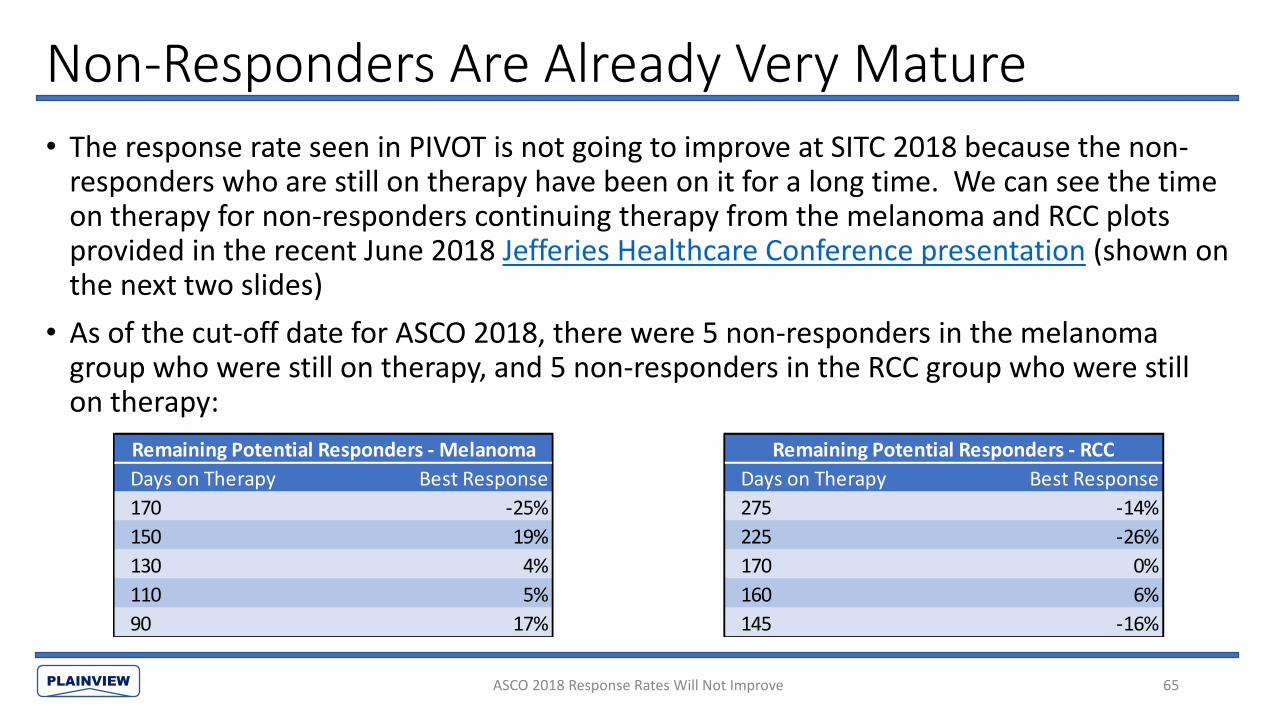
Non-Responders Are Already Very Mature
• The response rate seen in PIVOT is not going to improve at SITC 2018 because the non-responders who are still on therapy have been on it for a long time. We can see the time on therapy for non-responders continuing therapy from the melanoma and RCC plots provided in the recent June 2018 Jefferies Healthcare Conference presentation (shown on the next two slides)
• As of the cut-off date for ASCO 2018, there were 5 non-responders in the melanoma group who were still on therapy, and 5 non-responders in the RCC group who were still on therapy:
65ASCO 2018 Response Rates Will Not Improve
Remaining Potential Responders - Melanoma
Days on Therapy Best Response
170 -25%
150 19%
130 4%
110 5%
90 17%
Remaining Potential Responders - RCC
Days on Therapy Best Response
275 -14%
225 -26%
170 0%
160 6%
145 -16%

PLAINVIEW
Melanoma Non-Responders Unlikely to Convert
66
There are only 5 non-responders still enrolled
• The five remaining melanoma non-responders are unlikely to convert because 1) most have seen progressive best responses (tumor growth) and 2) most responses to IL-2 and PD-1 inhibitors come within the first two scans Source: Nektar 2018 Jefferies Healthcare Conference Presentation
ASCO 2018 Response Rates Will Not Improve
Remaining Potential Responders - Melanoma
Days on Therapy Best Response
170 -25%
150 19%
130 4%
110 5%
90 17%
PLAINVIEW
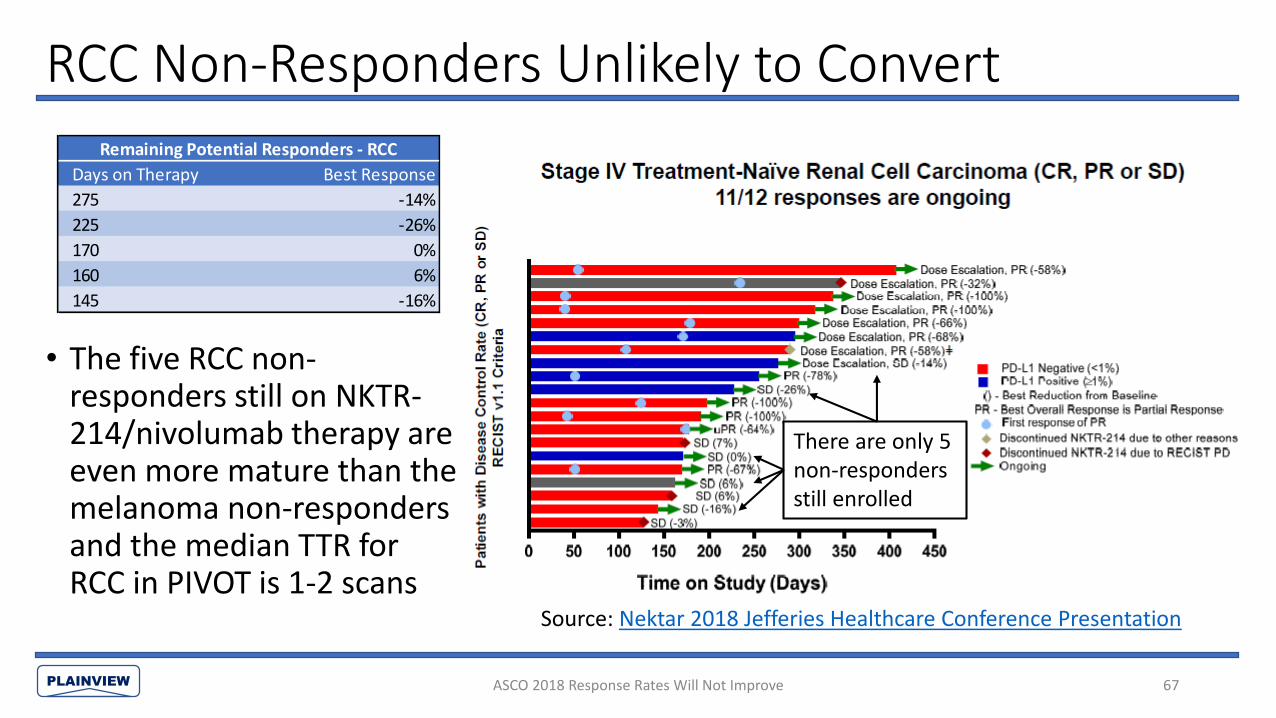
RCC Non-Responders Unlikely to Convert
• The five RCC non-responders still on NKTR-214/nivolumab therapy are even more mature than the melanoma non-responders and the median TTR for RCC in PIVOT is 1-2 scans
67
Source: Nektar 2018 Jefferies Healthcare Conference Presentation
ASCO 2018 Response Rates Will Not Improve
There are only 5 non-responders still enrolled
Remaining Potential Responders - RCC
Days on Therapy Best Response
275 -14%
225 -26%
170 0%
160 6%
145 -16%

PLAINVIEW
PIVOT-02 Responses Come Rapidly or Don’t Come At All
• Median time-to-response was 1.7-2.8 months for nearly all of the melanoma and RCC treatment groups in the PIVOT trial:
68ASCO 2018 Response Rates Will Not Improve
Time on Therapy Time-to-Response % of Responses Seen By:
NKTR-214 + Nivolumab Trial & Group N Source (median, in months) (median, in months) ORR 60 Days (1st Scan) 120 Days (2nd Scan)
1L Melanoma PIVOT 11 SITC 2017 4.7 1.7 63.6% 85.7% 100.0%
1L Melanoma PIVOT Stage 1 13 ASCO 2018 NA 1.7 84.6% 72.7% 100.0%
1L Melanoma PIVOT Stage 2 15 ASCO 2018 NA 2.8 20.0% 33.3% 100.0%
1L Melanoma PIVOT Stage 1 & 2 28 ASCO 2018 4.6 2.0 50.0% 64.3% 100.0%
1L RCC PIVOT 13 SITC 2017 3.7 1.9 46.0% 66.7% 100.0%
1L RCC PIVOT Stage 1 11 ASCO 2018 NA 3.7 63.6% 42.9% 57.1%
1L RCC PIVOT Stage 2 15 ASCO 2018 NA 1.7 33.3% 60.0% 80.0%
1L RCC PIVOT Stage 1 & 2 26 ASCO 2018 5.6 2.8 46.2% 50.0% 66.7%
PLAINVIEW
IL-2 Responses Come Rapidly or Don’t Come at All
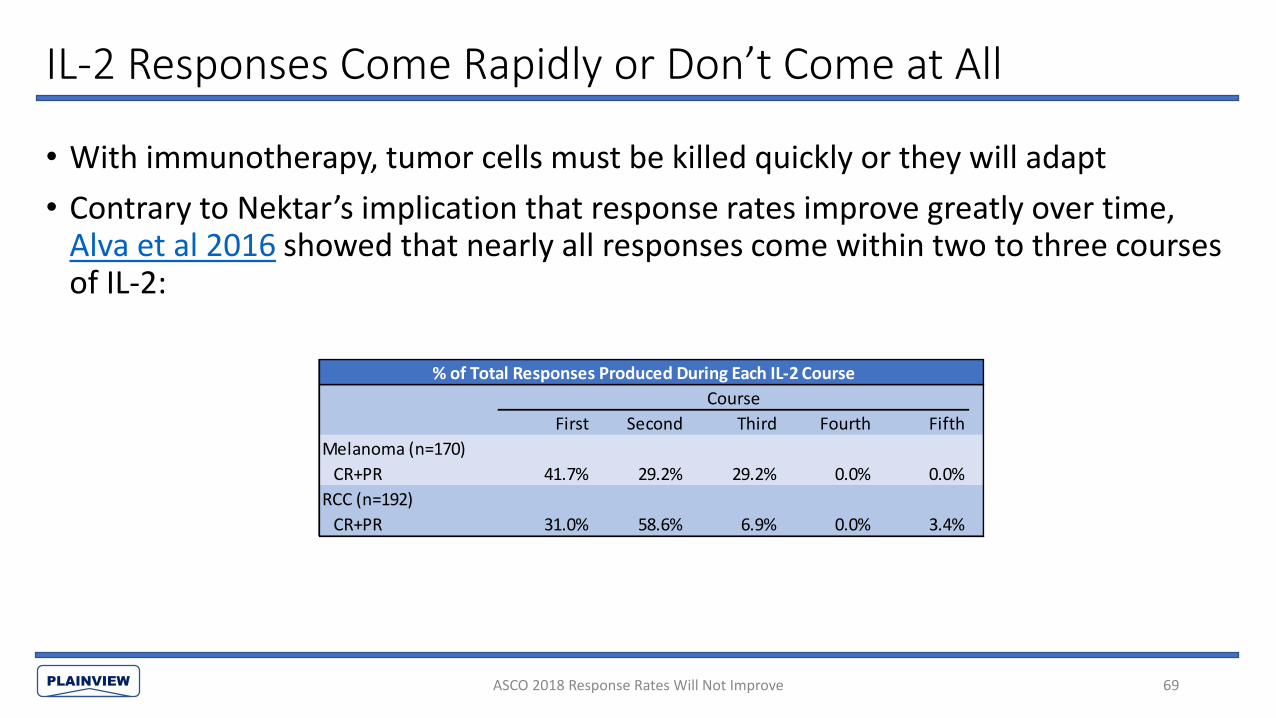
• With immunotherapy, tumor cells must be killed quickly or they will adapt
• Contrary to Nektar’s implication that response rates improve greatly over time, Alva et al 2016 showed that nearly all responses come within two to three courses of IL-2:
69ASCO 2018 Response Rates Will Not Improve
% of Total Responses Produced During Each IL-2 Course
Course
First Second Third Fourth Fifth
Melanoma (n=170)
CR+PR 41.7% 29.2% 29.2% 0.0% 0.0%
RCC (n=192)
CR+PR 31.0% 58.6% 6.9% 0.0% 3.4%
PLAINVIEW
What’s Next? SITC 2018 Preview
• Nektar has attempted to stem the bleed from ASCO 2018 by telling investors that the NKTR-214/nivolumab combination takes time to work
• However, the remaining handful of patients have already been on therapy for an extended period and historical IL-2 data and PIVOT-02 trial data point to the opposite conclusion: if it didn’t work early, it is never going to work
• Additional data will prove that the ASCO 2018 data is just as bad as investors thought. At most, we think Nektar will see 1-2 patients in the melanoma and RCC groups convert to responders– which only supports the conclusion that NKTR-214 is the next epacadostat
• Nektar will have to face the music on the 196/283 patients it has yet to update investors on– the “immature data” excuse card has expired and continued silence would be deafening
70ASCO 2018 Response Rates Will Not Improve
PLAINVIEW
Concluding Thoughts: How Nektar Made IL-2 Ineffective
• The safety bar for NKTR-214 is significantly higher compared to IL-2 because NKTR-214 requires an irreversible frontloaded dosing with a long half-life as opposed to 14 bolus doses that can be stopped at any time. Due to IL-2’s known history of causing vascular leak and the adverse events seen in Nektar’s EXCEL trial, this drastically reduced the maximum dose for NKTR-214, crippling its therapeutic effect
• Active AUC was slashed by 80-93% compared with standard cycle of IL-2, and peak active concentration was cut by 98% due to both the lower dose and pegylation obstructing drug activity. The therapeutic impact is further diminished due to continued interference from PEG polymers during NKTR-214’s 2-PEG-IL2 and 1-PEG-IL2 states
• End result is a drug that does very little and missed the IL-2 efficacy benchmark (change in peripheral lymphocytes) by a wide margin
• IL-2 has demonstrated a 15-29% response rate, but still failed to show any benefit in combination with other drugs and demonstrated no synergies paired with checkpoint inhibitor Yervoy. NKTR-214 posted a 0% response rate as a monotherapy, and, like all the failed monotherapies before it, we believe it has zero chance of clinical success as part of any combination therapy
71

PLAINVIEW
Appendix 1: AUC Calculations
72

PLAINVIEW
Hurwitz (Feb. 2017) NKTR-214-AC AUC
• Hurwitz et al (published at ASCO GU 2017) provided the AUC for NKTR-214-RC (total) and NKTR-214-AC (active) by dose (AUCs on y-axis and doses on x-axis)
• NKTR-214 is dosed at 0.006 mg/kg, so a dose of 0.5 mg translates to 0.5/0.006 = 83.3 kg patient and a dose of 0.75 mg translates to 0.75/0.006 = 125 kg patient
• The relationship between dose and AUC is linear, and we can estimate the active AUC per kg (patient weight); see table below. It is approximately 15.0 ng*hr/mL per kg (14-20% of IL-2 AUC)
Appendix 73
0.5 mg 0.75 mg
NKTR-214-AC AUC (ng*h/mL) 1,200 1,950
Patient Weight (total dose/(dose per kg) 83.3 kg 125 kg
NKTR-214-AC AUC/weight (ng*hr/mL per kg) 14.4 15.6
Source: ASCO GU 2017 Poster (Hurwitz et al)

PLAINVIEW
Bentebibel (Nov. 2017) NKTR-214 AUC• We can approximate NKTR-214-AC AUC based on the PK
graph using Riemann sums (see red rectangles in graph), where the AUC (in ng*hr/mL) is calculated as:
• Average(initial concentration, final concentration) * time
• Approximating the median weight at 100 kg, AUC is 775/100 = 7.8 ng*hr/mL per kg (7-11% of IL-2 AUC)
SITC 2017 Poster (Bentebibel et al)
ng*hr/mL per kg
NKTR-214-AC AUC 7.8
IL-2 AUC 73.6 – 108.1
NKTR-214-AC AUC / IL-2 AUC 7.2 – 10.5%
74Appendix
Day: 0 1 2 3 4 5 6 7 8 Total
Conc (ng/mL): 0 1 9 10 8 2 NA NA 0.2 NA
AUC Calculation:(ng*hr/mL)
NA (1+0)/2* 24 = 12
(9+1)/2* 24 = 120
(10+9)/2*24 = 228
(10+8)/2*24 = 216
(8+2)/2* 24 = 120
NA NA (2+0.2)/2*24*3 = 79
775

PLAINVIEW
Sanity Check: Comparing PK Graphs Shows 50% Decline
• Comparing the PK graphs from the respective posters (Hurwitz & Bentebibel) confirms that the AUC declined by ~50% with the addition of six new patients. While the graphs may look similar, note the log scale: nearly every Y-value in the Nov. 2017 Bentebibel PK graph is ~50% lower than the respective value in the Feb. 2017 Hurwitz graph. We place more weight on the more current and higher-n Bentebibel AUC
Appendix 75
Source: SITC 2017 Poster (Bentebibel et al)Source: ASCO GU 2017 Poster (Hurwitz et al)
Peak NKTR-214-AC concentration is 20 ng/mL in Hurwitz compared to 10 ng/mL in Bentebibel
Bentebibel 2017Hurwitz 2017

PLAINVIEW
Konrad 1990 IL-2 AUC Calculation #1
• On page 3 of Konrad et al 1990, the authors provided the normalized AUC for patients receiving IL-2 based on curve-fitting a two-compartment decay model across 52 patients given IL-2:• AUC for a patient receiving a 1,000,000 IU/m2 dose of IL-2 is 14,500
(IU*min/mL)/dose
• Using the average human body surface area of 1.7 m2, we can convert this to ng*hr/mL per kg for a standard treatment of IL-2 based on information provided by the IL-2 prescribing label and basic math in order to make a direct comparison with NKTR-214
76Appendix

PLAINVIEW
Konrad 1990 IL-2 AUC Calculation #1 (Cont’d)• IL-2 is dosed at 600,000 IU/kg up to 14 times per cycle, making the dose:14 * 600,000 IU/kg * weight (kg) = 8.4mn (IU) * weight (kg)• We can substitute this in for the (1.7 m2 * 1mn IU/ m2) = 1.7mn IU dose:14,500 min*IU/mL / 60 (min/hr) * (8.4mn (IU) * weight (kg))/(1.7mn IU) = 1,194 (IU*hr/mL) * weight (kg)• The label for IL-2 shows that 600,000 IU of IL-2 to 0.037 mg of IL-2. IL-2 can be
converted to ng as follows:600,000 IU = 0.037 mg = 37,000 ng600,000 IU = 37,000 ng => 1 IU = 37,000/600,000 ng = 0.0617 ng• Substituting it back in:1,194 IU*hr/mL * 0.0617 ng/IU *weight (kg)= 73.6 ng*hr/mL per kg (AUC of IL-2 per kg @ prescribing label dose)
77Appendix

PLAINVIEW
Konrad 1990 IL-2 AUC Calculation #2We can also use the formula and inputs from pp. 2-3 of Konrad 1990 to calculate the AUC. Konrad curve-fitted the data for 52 patients using the two-compartment decay model:
Qt = Ae-k(a)t + Be-k(b)t
Where:
Qt is the amount remaining after period t (Q0 = dose/(plasma volume))
A is the concentration of the fast compartment (86.6% of initial concentration)
B is the concentration of the slow compartment (13.4% of initial concentration)
k(a) is the decay constant for the fast compartment (ln(2)/12.9 min)
k(b) is the decay constant for the slow compartment (ln(2)/85 min)
t is the time between Q0 and Qt
78Appendix

PLAINVIEW
Konrad 1990 IL-2 AUC Calculation #2 (Cont’d)
• Calculating AUC by minute and using the body surface area of 1.7 m2 and plasma volume of 2,600 mL cited by Konrad, we get a total AUC of 21,282 IU*min/mL for a 1,000,000 IU/ m2 dose of IL-2
• Using the same steps as in Konrad AUC Calculation #1, we can convert this to ng*hr/mL per kg for IL-2 in order to compare it with NKTR-214
• We get an AUC of 108.1 ng*hr/mL per kg (AUC of IL-2 per kg @ prescribing label dose)
79Appendix

PLAINVIEW
Appendix 2: Further AUC Discussion
80

PLAINVIEW
But Nektar Says AUC of NKTR-214 is 500x AUC of IL-2
• Nektar’s 500x AUC claim is based on a mouse model that yielded wildly unreliable data. The data has the following problems (more details & sources on next slide):• 60% of the IL-2 AUC data used for comparison was simply “estimated”• The reported concentrations of NKTR-214-AC (a subgroup of NKTR-214) exceeded the
concentrations of total NKTR-214 at 3/8 data points, and by up to 650%. This is impossible– a part can never be greater than the whole
• NKTR-214 concentrations remain at peak levels after 3 days, which defies the concept of half-lives and is contradicted by human data
• The 500x calculation assumes equal doses when IL-2 is dosed significantly higher in humans (86.3x) due to NKTR-214 having a much-lower maximum tolerated clinical dose
• The relative half-life of NKTR-214 in mice vs. humans is completely different from the relative half-life of IL-2 in mice vs. humans because of unequal differences in clearance rates for PEG polymers and IL-2– meaning that even if Nektar’s data had been reliable, the AUC relationship between NKTR-214 & IL-2 in mice does not translate to humans at all
• In calculating the PK/PD profiles of NKTR-214 vs. IL-2, we relied on the human data provided by Nektar and Konrad et al 1990, respectively, which we believe provides a far more accurate depiction in humans than Nektar’s mouse model
Appendix 81

PLAINVIEW
Why Nektar’s Claimed 500x AUC in Mice Is Completely Unreliable
Source: Charych et al 2016
82Appendix
NKTR-214 refers to all active & inactive conjugates of NKTR-214 (6-PEG-IL-2, 5-PEG-IL-2…1-PEG-IL-2, & IL-2). For 3/8 data points in this graph (days 2, 4, and 5), this chart indicates that the concentration of active conjugates exceeds the total concentration of active + inactive conjugates by as much as 650% (day 4) – this is impossible. The blue line (active conjugates) is a subgroup of the black line (total conjugates) – a part can not be greater than the whole, and certainly not by 650%. See lower left graph (NKTR-214 human PK data) for how the relationship between active and should look.
The imaginary IL-2 peak concentrations decline ~50% in each subsequent dose (note log10 scale) for unexplained reasons while NKTR-214 concentrations see similarly unexplained increases as far as 5 days after the initial dose. It is impossible for both the NKTR-214 and IL-2 graphs to be true– if the ability of IL-2 to infiltrate tumors declined markedly following repeated exposure, then the same would be true for sustained exposure to NKTR-214. Further, the late increases in NKTR-214 concentrations defy the concept of “half-life” and are contradicted by all subsequent NKTR-214 data in humans (see below)
Notice that 60% of the IL-2 data (days 2-5) is dotted lines–this represents data that was estimated, not measured.
This graph assumes the same dose of IL-2 and NKTR-214 when IL-2 is dosed significantly higher in humans (86.3x) than NKTR-214 due to NKTR-214 having a much-lower maximum tolerated dose. Additionally, the relative half-life of NKTR-214 in mice vs. humans is completely different from the relative half-life of IL-2 in mice vs. humans– making this graph irrelevant to any discussion of NKTR-214 vs. IL-2 AUC in humans
Mouse Data for Nektar’s 500x AUC Claim
Actual Human PK Data for NKTR-214
Note that: 1) NKTR-214-AC never surpasses NKTR-214-RC, 2) peak concentration of NKTR-214-AC is only ~10-15% as opposed to ~60%, 3) NKTR-214 concentrations steadily decline rather than stabilizing at peak for extended period
Source: SITC 2017 Poster (Bentebibel et al)

PLAINVIEW
Subsequent Mouse Data Supports Our AUC Calculation
• The same lead author who published the 500x AUC in 2016 later published a table (Charych et al 2017) contradicting the prior conclusion and showing that the AUC of NKTR-214-AC is 27x AUC of IL-2 for identical doses in mice:
Appendix 83
Notes:
1 AUClast is a measure of the total theoretical exposure a patient would be expected to receive for a given dose of drug
2 NKTR-214-RC refers to all species of NKTR-214, active and inactive
3 NKTR-214-AC refers exclusively to AUC of active conjugate of NKTR-214
4 By dividing NKTR-214-AC by NKTR-214-RC, we find that the drug is active for only 12% of its life and is inert 88% of the time

PLAINVIEW
Subsequent Mouse Data Supports Our AUC Calculation
• But they are not administered at the same dose in the clinic—IL-2 is dosed at 86.3x the dose of NKTR-214 (0.037 mg/kg * 14 = 0.518 mg/kg for a five-day course vs. 0.006 mg/kg Q3W for NKTR-214). Just correcting for the differences in dose, the AUC for NKTR-214-AC would be:
37.8/1.38 * 0.006/0.518 = 31.7% of the AUC for IL-2
• This is higher than our 7-20% AUC calculations for humans, but in the same ballpark
• The differences can be attributed to different relative clearance rates of the drugs between mice and humans, and we also believe that the Charych et al 2017 AUCs are distorted in favor of NKTR-214—Cmax has a dramatic effect on AUC and should be nearly identical for the two drugs when administered at the same dose instead of nearly double for NKTR-214 compared to IL-2 (6.6 ug/mL vs 11.6 ug/mL, see Cmax line of table shown on prior slide). This is because the volume of distribution can not be less than plasma volume for either drug
Appendix 84

PLAINVIEW
AUC Sanity Check• We can quickly estimate the difference in AUC by looking at the difference in dosing and
half-life.
• We know from Hurwitz et al 2017 that:• NKTR-214 is inert for 76% of the AUC in humans; NKTR-214-AC is 24% of total AUC• NKTR-214 half-life is ~20 hours (consistent with Charych et al preclinical data)
• We know from Konrad 1990 that:• IL-2 half-life is two-compartment model, with 12.9 min half-life in the first compartment (87% of initial
concentration) and 85 minutes half-life in the second compartment (13% of initial concentration)
• We know that IL-2 is dosed at 86.3x NKTR-214’s MTD
• Napkin math yields 15% AUC for NKTR-214-AC vs. IL-2:
NKTR-214-AC AUC / IL-2 AUC = (86.3*1/0.24)/((12.9*0.87+85*0.13)/(20*60))
= 15.0%
• This is not exact due to approximation of half-lives but confirms that the AUC ratio calculated based on clinical data is in the correct range
Appendix 85

PLAINVIEW
Appendix 3: Cross-Trial Comparison of CD8+ Impact
86
PLAINVIEW
NKTR-214 is Much Weaker than Competing IL-2 Derivatives
• Roche’s IL-2 variants CEA-IL2v and FAP-IL2v have a similar intended mechanism of action to NKTR-214 invoked through a simpler and more elegant method: IL2Rα binding is completely abolished rather than temporarily blocked, preventing Roche’s drugs from binding with the IL2Rαβγ receptor but allowing them to bind with the IL2Rβγ receptor
• Additionally, CEA-IL2v and FAP-IL2v are attached to antibodies with high affinity to CEA and FAP; targets found in cancerous cells and therefore allow the therapy to be targeted to the tumors rather than systemic, enhancing safety and increasing the maximum tolerated dose
• Comparing murine data for CEA-IL2v with NKTR-214 suggests that NKTR-214 yields a minimal increase in peripheral CD8+ in humans– far below the multi-fold increase required to yield effect
Appendix 87

PLAINVIEW
Animal Studies Confirm NKTR-214 is Weak• Roche and Nektar both published study results for their respective drugs
showing changes in peripheral CD8+ in mice
• The AACR poster McNamara et al 2017 showed approximately 140% increase in peripheral CD8+ following NKTR-214 (~250 cells/uL in control group vs. ~600 cells/uL in NKTR-214 group) at a dose of 0.8 mg/kg (133.3x the clinical dose of 0.006 mg/kg)
• Roche’s CEA-IL2v data showed a 2,233% increase in peripheral CD8+ (~300 cells/uL in control group vs. ~7,000 cells/uL in CEA-IL2v group) at a dose of 1 mg/kg ((2.7-13.3x dose for 80 kg adult, MTD not yet established)
• The magnitude of difference in impact between the two drugs (140% vs. 2,233%) despite the fact that NKTR-214 was dosed at a significantly higher level relative to the human dose than CEA-IL2v (133.3x human dose vs. 2.7-13.3x human dose) further confirms that NKTR-214 is weak
Appendix 88

PLAINVIEW
Animal Studies Confirm NKTR-214 is WeakNKTR-214
Appendix 89
NKTR-214: Total CD8+ T cells increased by 140% in mice at a dose of 0.8 mg/kg (133.3x human dose)
CEA-IL2v: Total CD8+ T cells increased by ~2,233% in mice at a dose of 1.0 mg/kg (2.7-13.3x dose for 80 kg adult, MTD not yet established)
Note that Nektar multiplied its values by ten by using cells/10 uL as opposed to Roche’s cells/uL, hence the difference in units
Source: McNamara et al AACR 2017 Poster Source: Klein et al 2017
CEA-IL2v

PLAINVIEW
Data Comparison Suggests NKTR-214 Has Minimal Impact on CD8+
• Roche has also published human data for CEA-IL2v. CEA-IL2v produced a 144% increase in median peripheral CD8+ counts in humans dosed at 30 mg (n=11, 340 CD8+ cells/uL pre-treatment and 831 CD8+ cells/uL post-treatment). This was at ~37.5% of the murine dose (assuming 80 kg weight) and the relative peripheral CD8+ increase (144%) was approximately 6% of the increase seen in mice. A subsequent Roche abstract confirmed a median 2.3-fold increase (130%) in peripheral CD8+ in humans
• Applying this relationship to NKTR-214’s murine data and adjusting for the fact that NKTR-214 was dosed at 133.3x human dose in mice while CEA-IL2v was dosed at ~2-14x human dose, we get a negligible increase in peripheral CD8+ in humans, thus solving the mystery of why Nektar did not disclose change in peripheral CD8+
Appendix 90
Related Documents


