1 This is the author's Post-print version (final draft post-refereeing as accepted for publication by the journal). The definitive, peer-reviewed and edited version of this article is published as: Feng Z., Boyle P., van Ham M. & Raab G (2013) Neighbourhood ethnic mix and the formation of mixed-ethnic unions in Britain: a longitudinal analysis Geografiska Annaler: Series B, Human Geography 95(4), 307-321. http://dx.doi.org/10.1111/geob.12027 Neighbourhood ethnic mix and the formation of mixed-ethnic unions in Britain: a longitudinal analysis Zhiqiang Feng (Corresponding author) Longitudinal Studies Centre – Scotland (LSCS) & School of Geography & Geosciences, University of St Andrews, St Andrews KY16 9AL, UK, Email: [email protected] Paul Boyle Longitudinal Studies Centre – Scotland (LSCS) & School of Geography & Geosciences, University of St Andrews, St Andrews KY16 9AL, UK, Email: [email protected] Maarten van Ham OTB Research Institute for the Built Environment, Delft University of Technology, P.O. Box 5030, 2600 GA Delft, The Netherlands, Email: [email protected] & University of St Andrews Gillian M Raab Longitudinal Studies Centre – Scotland (LSCS) & School of Geography & Geosciences, University of St Andrews, St Andrews KY16 9AL, UK, Email: [email protected] ABSTRACT. Although developed societies are becoming increasingly ethnically diverse, relatively little research has been conducted on geographies of mixed-ethnic unions (married or cohabiting). There is some recent evidence from the US that mixed-ethnic couples are more likely to be found in mixed-ethnic neighbourhoods, but this research is based on cross-sectional data. Therefore it is not possible to determine whether mixed-ethnic couples are more likely to form in mixed-ethnic neighbourhoods or whether they are more likely to move there. Our longitudinal analysis allows us to tease out the relative importance of these two processes, furthering our understanding of the formation of mixed-ethnic unions. Using data from the ONS Longitudinal Study (LS) we examine neighbourhood effects on the formation of mixed-ethnic unions in England and Wales. We find that mixed ethnic unions are more likely to form in neighbourhoods with low concentrations of co-ethnic population. The results from this study lend support to the contact theory that geographical proximity to other ethnic groups enhances mutual understanding between people from different ethnic groups and could lead to the development of intimate partnerships. Keywords: mixed-ethnic unions, neighbourhood, ethnic mix, longitudinal analysis, Britain

Welcome message from author
This document is posted to help you gain knowledge. Please leave a comment to let me know what you think about it! Share it to your friends and learn new things together.
Transcript
1
This is the author's Post-print version (final draft post-refereeing as accepted for
publication by the journal). The definitive, peer-reviewed and edited version of this article
is published as: Feng Z., Boyle P., van Ham M. & Raab G (2013) Neighbourhood ethnic
mix and the formation of mixed-ethnic unions in Britain: a longitudinal analysis
Geografiska Annaler: Series B, Human Geography 95(4), 307-321.
http://dx.doi.org/10.1111/geob.12027
Neighbourhood ethnic mix and the formation of mixed-ethnic unions in
Britain: a longitudinal analysis
Zhiqiang Feng (Corresponding author) Longitudinal Studies Centre – Scotland (LSCS) & School of Geography & Geosciences,
University of St Andrews, St Andrews KY16 9AL, UK, Email: [email protected]
Paul Boyle Longitudinal Studies Centre – Scotland (LSCS) & School of Geography & Geosciences,
University of St Andrews, St Andrews KY16 9AL, UK, Email: [email protected]
Maarten van Ham OTB Research Institute for the Built Environment, Delft University of Technology, P.O. Box
5030, 2600 GA Delft, The Netherlands, Email: [email protected] & University of St
Andrews
Gillian M Raab Longitudinal Studies Centre – Scotland (LSCS) & School of Geography & Geosciences,
University of St Andrews, St Andrews KY16 9AL, UK, Email: [email protected]
ABSTRACT. Although developed societies are becoming increasingly ethnically diverse,
relatively little research has been conducted on geographies of mixed-ethnic unions (married or
cohabiting). There is some recent evidence from the US that mixed-ethnic couples are more
likely to be found in mixed-ethnic neighbourhoods, but this research is based on cross-sectional
data. Therefore it is not possible to determine whether mixed-ethnic couples are more likely to
form in mixed-ethnic neighbourhoods or whether they are more likely to move there. Our
longitudinal analysis allows us to tease out the relative importance of these two processes,
furthering our understanding of the formation of mixed-ethnic unions. Using data from the ONS
Longitudinal Study (LS) we examine neighbourhood effects on the formation of mixed-ethnic
unions in England and Wales. We find that mixed ethnic unions are more likely to form in
neighbourhoods with low concentrations of co-ethnic population. The results from this study
lend support to the contact theory that geographical proximity to other ethnic groups enhances
mutual understanding between people from different ethnic groups and could lead to the
development of intimate partnerships.
Keywords: mixed-ethnic unions, neighbourhood, ethnic mix, longitudinal analysis, Britain
2
Introduction
Over the past few decades, the number of mixed-ethnic unions has increased substantially,
although from a very small base (Coleman 2004). The 1 per cent census sample from the Office
for National Statistics (ONS) Longitudinal Study (LS) reveals that the total number of mixed-
ethnic unions reached 5,139 in 2001 in England and Wales, a 46 per cent increase from 1991
(Feng et al. 2010).
Research on mixed-ethnic unions in the UK is relatively limited. Most existing studies
focus on primary patterns and trends in the growth of mixed-ethnic unions using data from, for
example, the Census or the Labour Force Surveys (LFS) (e.g. Coleman 1985; Ballard 1996;
Berrington 1996; Dale and Holdsworth 1997; Coleman 2004; Muttarak 2004; DMAG 2005;
Johnston et al. 2006; Voas 2009). The General Household Survey (GHS) has also been used to
investigate the extent to which people from ethnic minorities in form mixed-ethnic unions
(Muttarak and Heath 2010).
Whether or not people form a mixed-ethnic union does not depend only on individual
preferences with respect to socio-demographic characteristics, or the willingness among
members of different groups to interact, but also on the opportunities to interact; the opportunity
structure of available partners (Blau 1977; Blau et al. 1982; Houston et al. 2005; Niedomysl et
al. 2010). Inter-ethnic relations cannot occur unless opportunities for interactions exist. People
spend most of their lives in neighbourhoods, schools, workplaces and leisure places, all of which
form local marriage markets. Although the use of internet dating site is increasing its effect is
still relatively limited (Dutton et al. 2010). The opportunity for inter-ethnic relationships may
therefore be influenced by the attributes of local marriage markets, such as the size of the
minority group, the availability of potential partners in the minority group, the availability of
potential partners in the majority group, and the social and spatial proximity between minority
and majority groups (Rosenfeld 2002).
In this study we examine the extent to which the ethnic mix of their neighbourhood settings
influences whether people form mixed-ethnic partnerships. Intuitively, we might expect that
living in a mixed-ethnic neighbourhood may increase the likelihood of such couple formation,
although the literature review suggests that living in neighbourhoods with a low concentration of
their own ethnic group is associated with a higher likelihood of out-partnering (Ellis et al. 2006).
Particularly, we explore the likelihood that singles from minority ethnic groups choose a White
partner in different geographical contexts, and we also explore the likelihood of White singles
choosing a non-White partner in different geographical contexts. Our study contributes to
theoretical debates regarding two competing hypotheses, contact theory and the social conflict
hypothesis, which predict different outcomes regarding the effects of interaction between people
from different ethnic groups. This article also contributes to discussions on the role of
neighbourhoods in the integration of ethnic minorities in wider society.
It is important to note that we use the term ethnicity instead of race in this article. Ethnic
groups, or ethnicity, are more commonly used in the British academic literature to focus on the
cultural instead of the biological differences between groups (Coleman and Salt 1996; Stillwell
and van Ham 2010). We use data from the Office for National Statistics Longitudinal Study
(ONS-LS) which allows us to establish whether living in a mixed-ethnic neighbourhood makes it
more likely for people to form a mixed-ethnic union. This longitudinal data is based on the UK
Census which includes information on self-reported ethnicity.
3
Theoretical background
The choice of partners is the result of preferences with respect to partner attributes and the
opportunity structure of potential partners. By and large, people favour partners who resemble
themselves in demographic, social, economic and cultural characteristics – so called marital
homogamy. Assimilationist theories (Gordon 1964) suggest that immigrants usually show
different cultural and socio-economic characteristics from members of the host society and that
these can hamper interactions between immigrants and the host group. The process of
assimilation starts with acculturation, proceeds through structural assimilation and is regarded as
completed when the ethnicity of immigrants is no longer salient to them or to members of the
host society. According to this perspective, the more “assimilated” members of minority groups
will be more likely to out-partner with members from majority groups. The observation that
second and later generation ethnic minorities experience higher rates of mixed-ethnic unions, and
the observation that many mixed-ethnic unions involve ethnic minorities with higher levels of
education or qualifications appear to support such theories (Hwang et al. 1997; Muttarak and
Heath 2010).
The classical assimilation perspective was largely based upon observations of European-
origin immigrants in the US in the nineteenth century. The theory has been criticized for its
neglect of ethnic diversity in assimilation patterns in modern times. Segmented assimilation
theory posits that different groups experience either traditional assimilation and upward mobility,
downward mobility by unsuccessfully competing in the mainstream economy, or upward
economic mobility while keeping their own cultural identity (Portes and Zhou 1993; Portes and
Rumbaut 2001). Economic assimilation, and socio-spatial assimilation do not always translate
into cultural identity assimilation. In Britain, on average, the Black population shows
convergence with the host population, although Blacks are more likely than Whites to have a
working-class background and live in the inner city. Among South Asian populations in Britain,
Indians have enjoyed better economic success while Pakistani and Bangladeshi people have been
economically marginalized. However, most South Asians have kept their own cultural identity
and shown low levels of out-partnering with Whites (Coleman 2004; Peach 2005).
Blau and colleagues (Blau 1977; Blau et al. 1982) assert that inter-group relations depend
not only on preferences among members of different groups to interact, but also on the
opportunities to do so. Although assimilation or integration may enhance the willingness to
interact, inter-ethnic relations cannot occur unless opportunities for interactions exist. People
spend most of their lives in local and functional places such as neighbourhoods, schools,
workplaces and leisure places. The opportunity for inter-ethnic relationships is therefore
determined by the attributes of local marriage markets such as the size of the minority group, the
availability of potential partners in the minority group, the availability of potential partners in the
majority group, and the social and spatial proximity between minority and majority groups.
Studies have shown that the importance of neighbourhoods or local areas has diminished as a
meeting place of potential partners (Bozon and Heran 1989; Houston et al. 2005). However, in
our study we deem the place not only as a place for relationship development but more widely as
a place of breeding familiarity.
Spatial proximity therefore plays an important role in promoting the probability of inter-
marriage between ethnic groups (Bossard 1932; Blau 1977; Morgan 1981; Cready and Saenz
4
1997). Geographical theories have emphasised the interrelationship between the social and the
spatial (Delaney 2002). Places are not simply passive containers reflective of social relations but
are influential in constituting and reinforcing social relations (Delaney 2002). Critical
geographers have argued that social structure in the host society operates against the inclusion of
disadvantaged minorities. Racialization of place could produce circumstances whereby people of
certain ethnic group(s) might be excluded from the social process (Delaney 2002; Ellis et al.
2006; Price 2010). On the one hand, ethnic residential segregation reduces opportunities to meet
people from different ethnic groups (Peach 1974, 1980). The concentration of a minority group
within a neighbourhood also tends to re-enforce the sense of belonging to the group and thus
potentially weakens the propensity for exogamy. On the other hand, proximity breeds familiarity,
recognition of commonality which potentially leads to the eventual breakdown of ethnicity as a
barrier for social interaction (Delaney 2002). As a result, it is expected that the formation of
mixed-ethnic partnerships will be affected by these contextual factors (Lievens 1998). Studying
the geography of mixed-ethnic unions will shed light on our understanding of processes which
influence the integration of ethnic minorities in wider society. Existing literature on segregation
focus mainly on the neighbourhood level, while in fact households are more segregated. In
addition ethnic mix at the household level cannot be ignored in segregation research because its
effects can be substantial (Ellis et al 2012). This study focusses particularly on the role of the
neighbourhood context in the formation of mixed-ethnic unions.
While geographers have analysed the importance of spatial proximity to development of
inter-ethnic relationships, contact theory hypothesise that contact between ethnic groups is
influential in promoting familiarity and may help to breakdown prejudice (Ihlanfeldt and Scafidi
2002). Ellison and Powers (1994) found that inter-ethnic contact, especially if it occurs early in
life, increases the likelihood that African Americans and Whites will have close inter-ethnic
friendships as adults. Sigelman et al. (1996) confirmed these results in a study in Detroit,
showing that early inter-ethnic contact in schools was particularly correlated with more cross
ethnic contact as adults. Emerson et al. (2002) also support the role of early interracial contact,
relating it to more racially diverse social and friendship circles later in life, including a raised
likelihood of attendance at multiracial religious congregations and interracial marriages.
According to social conflict theory, contact between different ethnic groups may also lead
to hostility and discrimination (Wessel 2009; Forrest and Dunn 2011; Matejskova and Leitner
2011). Matejskova and Leitner (2011) in their study on Russian immigrants in eastern Berlin
found that contact between local natives and Russian immigrants only re-enforced pre-existing
stereotypes, prejudices and conflicts. Forrest and Dunn (2011) show that although people in
more diverse places favour multiculturalism, older and less educated people are more likely to
oppose immigration when confronted with others. Tolsma et al. (2007) found that proximity of
ethnic out-group members in the municipality reduces opposition to exogamy. At the
neighbourhood level the same effect only appears for the more educated while proximity of
ethnic out-groups increases opposition to ethnic intermarriage for less educated. Matejskova and
Leitner (2011) argue that geographers have paid little attention to the contact hypothesis or social
conflict theory literature. We intend to fill this gap by investigating whether spatial proximity to
people outside one’s own group is associated with the likelihood of forming a mixed ethnic
union. The contact hypothesis and social conflict theory predict different outcomes and our study
can provide evidence on which theory is supported in understanding inter-ethnic relationship
formation in the British context.
5
More recently, Holloway et al. (2005) investigated the factors which increased the
likelihood of mixed-ethnicity households living in predominantly White neighbourhoods in the
US. They found that mixed-ethnic households were more likely to live in mixed neighbourhoods
than single ethnic households. However, because this research was based on cross-sectional data
it is impossible to identify whether mixed-ethnic couples were more likely to form in mixed-
ethnic neighbourhoods, or whether selective mobility occurred as these couples sought out mixed
residential neighbourhoods. To explore these issues in detail requires longitudinal data.
Data and methods
The Office for National Statistics Longitudinal Study (ONS-LS) is a nationally representative
1per cent sample of the English and Welsh population based on 4 birthdates, providing a sample
of about 500,000 people. The data includes information from the 1971, 1981, 1991 and 2001
Censuses as well as vital events registrations of births, deaths, immigrations, embarkations and
re-entries. However, registrations of marriage or divorce are not linked. An LS member who
married sometime between 1991 and 2001, and then divorced before 2001 would be omitted in
the analysis. The study was designed as a continuous, multi-cohort study with samples drawn
from successive censuses using the same selection criteria. Data are also collected for people in
the same household as members of ONS-LS, but the records for these individuals are not linked
through time. Apart from the individual-level micro data, the ONS-LS includes a number of
variables from the censuses which describe the characteristics of the small areas in which each
sample member lived. As the individual data is geocoded, it is possible to attach extra small area
variables, such as the ethnic composition variables developed in this study, to individual ONS-
LS members (Hattersley and Creeser 1995).
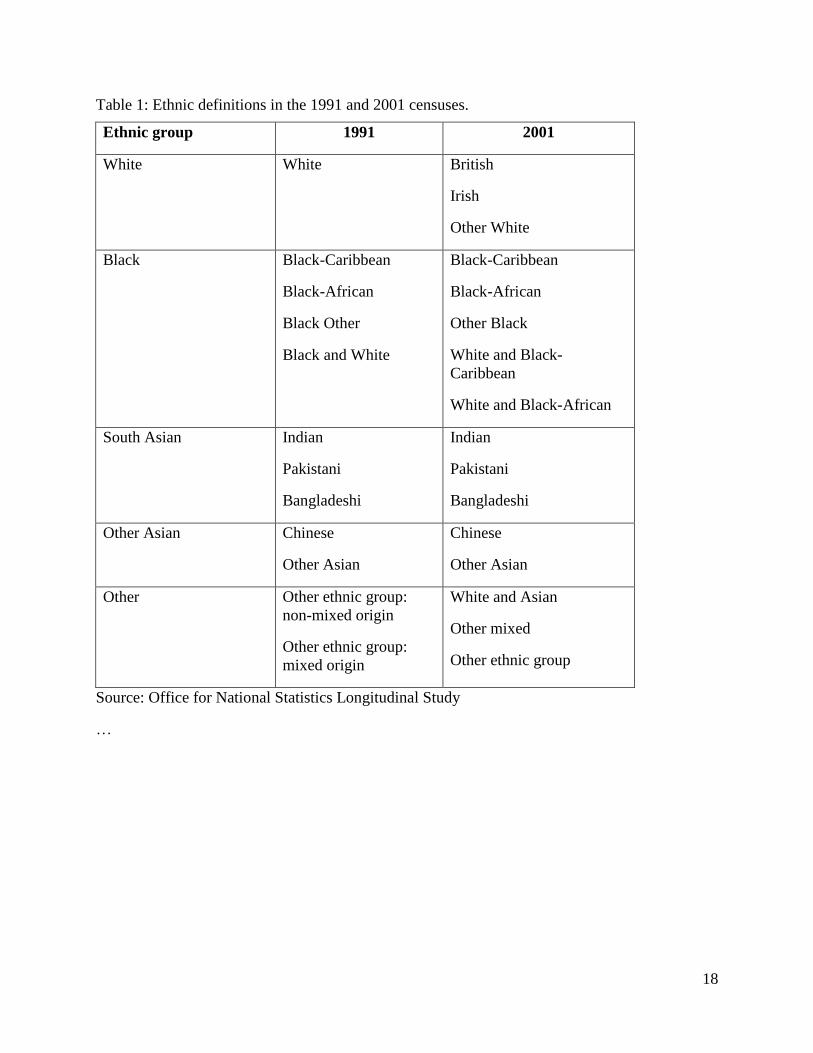
We used data from the 1991 and 2001 Censuses, because questions on ethnicity were first
introduced in 1991. However, the ethnicity questions in the 1991 and 2001 Censuses were
different. Both the question wording and range of ethnic categories used changed in 2001. For
example, unlike in the 1991 census respondents were allowed to report themselves as being Irish
or as having a Mixed ethnic origin. Following previous studies (Platt et al. 2005; Bradford 2006)
we identified five broad ethnic groups: White, Black, South Asian, Other Asian, and Other
(Table 1) which were comparable between 1991 and 2001. However, in our analyses we
excluded Other which is a small, heterogeneous group.
[INSERT TABLE 1 ABOUT HERE]
Between 1991 and 2001 a small proportion of people changed the way they reported their
ethnicity. This was most common among the mixed-ethnic and Black groups. In this study, we
used the 2001 variable to establish the ethnicity for each LS member as this was the latest
category a member reported using the more detailed question available in 2001. We excluded LS
members with imputed ethnicity as this has been shown to be unreliable (Platt et al. 2005).
Opposite-sex couples who were either married or cohabiting and who were from different
ethnic groups were defined as being in mixed-ethnic unions (see also Berrington 1996; Liang and
Ito 1999; Wong 1999; Model and Fisher 2002; Coleman 2004). We included cohabiting couples
as their number has grown dramatically over the last few decades, making them an important
6
element of mixed-ethnic unions. In addition, since mixed-ethnic unions are small in number,
including cohabiting couples boosts the sample size and improves the statistical power of our
models.
Previous studies suggest that the ethnic mix of people’s residential context influences the
probability of forming mixed-ethnic partnerships. However, the scale at which people’s
residential contexts should be measured is debateable (van Ham and Feijten 2008; van Ham and
Manley 2010). With regard to union formation, people meet potential partners, for example, at
school, in the workplace and at leisure places and these can stretch from the direct surroundings
of the home to the neighbourhood, to whole cities and larger regions. Together, these meeting
places form the local marriage market area. In this study, marriage markets were measured at
two spatial levels: local government districts and wards. Local government districts have average
populations of around 120,000 (regional marriage market area) while wards have populations of
around 6,000 (neighbourhoods or local marriage market area). We calculated the ethnic mix of
the population at both spatial scales: ethnic marriage market areas (districts) and neighbourhoods
(wards) in England and Wales. This concentration measure is ethnic group specific, based on the
proportion of that group in an area. Thus for South Asian people, the concentration was based on
the proportion of the South Asian population in districts and wards. For Whites, the measure is
based on the proportion of the White population.
Apart from focusing on district and ward-level measurements of ethnic concentration, we
also used a combination of the two spatial scales. Someone might live in an ethnically
homogeneous ward, but within an ethnically diverse district, or the other way around. To
examine the combined effect of district and ward level ethnic concentrations, we therefore
included in the model the interaction term of co-ethnic concentration at both district and ward
levels.
We used both descriptive methods and multivariate models to investigate the formation of
mixed-ethnic unions that involved a minority and a White partner. We estimated the likelihood
of out-partnering for singles in 1991 using multinomial logit regression. The dependent variable
was the partnership status in 2001: in co-ethnic unions (0), in mixed-ethnic unions (1), and
remaining single (2). These models produced two sets of coefficients, separately predicting the
propensity of forming a mixed-ethnic union in comparison to forming a co-ethnic union and
predicting the propensity of remaining single compared to being in a co-ethnic union. We only
present details of the coefficients for the part of which compares mixed-ethnic unions between a
minority and a White partner with co-ethnic unions. The predicted percentages of mixed ethnic
unions according to ward and district ethnic concentration use both parts of the model. We did
not analyse mixed-minority unions as they are very rare.
Formation of mixed-ethnic unions
Sample descriptions
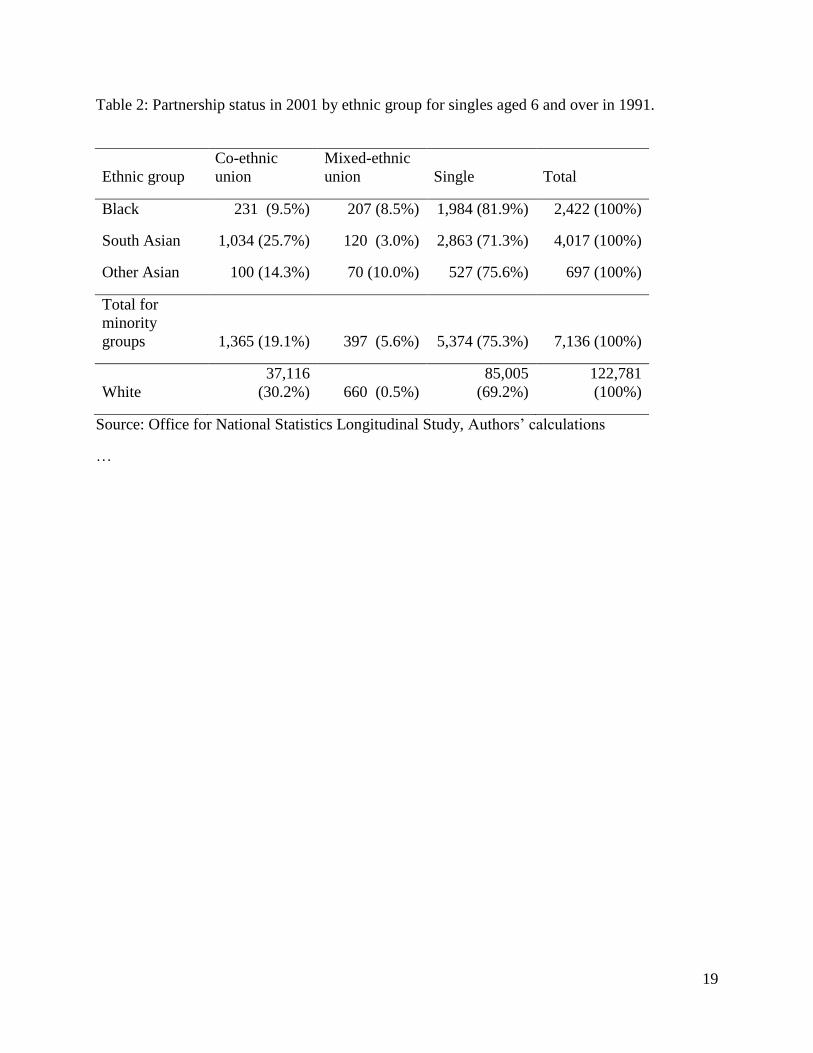
The sample used to model the probability of forming a mixed-ethnic union includes single
people who were aged 6 and over in 1991 and who were also recorded in the 2001 Census (by
then aged 16 and over). The sample comprises a total of 129,917 people: 2,422 Blacks, 4,017
South Asians, 697 Other Asians, and 122,781 Whites (Table 2). By 2001, about 25 per cent of
the 1991 singles from three minority groups ended up living with a partner from either the same
7
ethnic group or the White group. Single South Asians were the most likely to form a partnership,
with almost one third of them having formed a partnership by 2001. In contrast, Black singles
were the least likely to enter a partnership with only 18 per cent being married or cohabiting in
2001. Of all those who lived with a partner in 2001, 48 per cent of Blacks, 11 per cent of South
Asians, and 42 per cent of Other Asians had chosen a White partner. The proportions are much
higher than the overall 2001 prevalence rate of mixed-ethnic unions for ethnic minorities,
demonstrating that those who formed a partnership between 1991 and 2001 were more likely to
partner with someone from the majority group than those who formed a partnership earlier (Feng
et al. 2010). For White LS members 31 per cent of the 1991 singles entered a partnership by
2001. Only 1.7 per cent of the partnerships involving a White individual were mixed-ethnic
unions with a non-White individual.
[INSERT TABLE 2 ABOUT HERE]
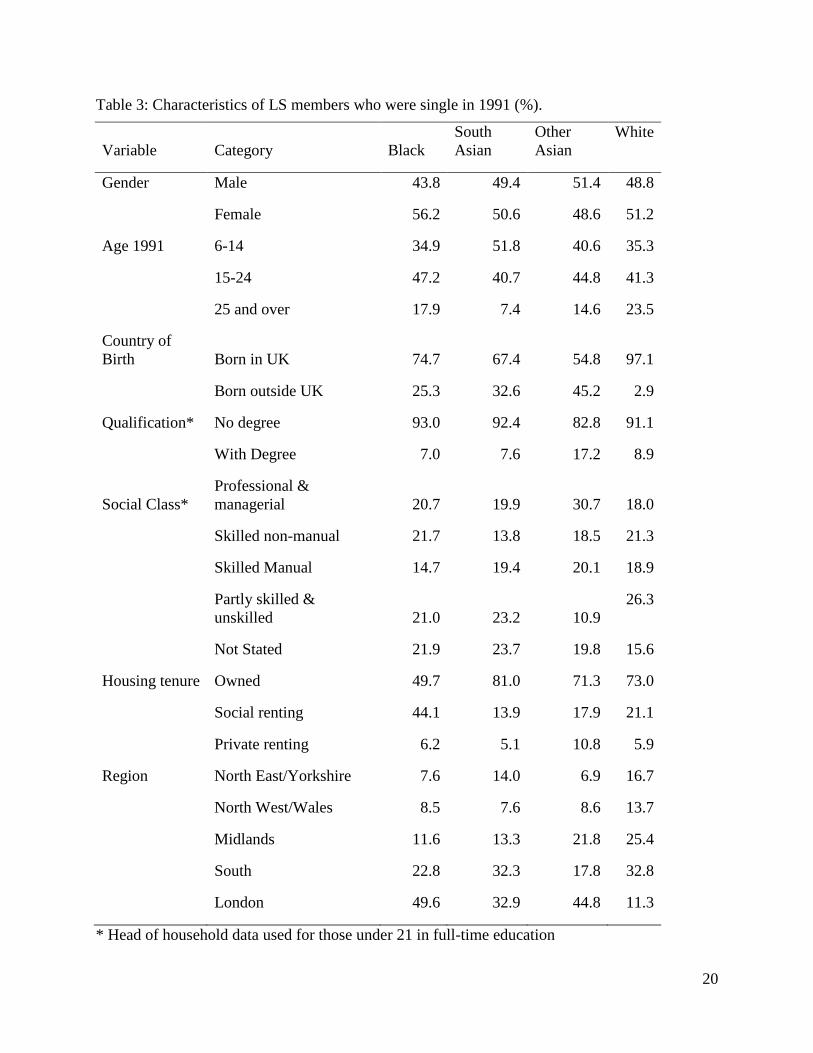
The multivariate models include several individual level control variables which are
expected to be related to the likelihood of out-partnering: gender, age, country of birth,
qualifications, social class, housing tenure, and region. The selection of these variables was
based on a literature review (Berrington 1996; Voas 2009). Age is an important factor in
affecting partner choice. Young people tend to be more open minded in their choice of partners.
However, people gain greater maturity and possible greater exposure to different ethnic
populations when growing older (Lievens 1998; Muttarak and Heath 2010). So it is not clear
whether the likelihood of out-partnering increases with age. We grouped age in 1991 into three
groups: 6–14 years old, 15–24 years old and 25 and over years old. Country of birth was
classified into either born in the UK or outside the UK. According to the assimilationist
perspective, people who are second and later generation immigrants will be more proficient at
the local language and have more exposure to the host culture. In contrast, people born outside
the UK are expected to have lower tendencies in forming mixed ethnic unions as their shorter
period of exposure to the host culture will cause them to be less integrated into it than their
counterparts born in the host country.
Educational qualification has been found to have a positive effect on mixed ethnic unions
(Lieberson and Waters 1988; Kalmijn 1998). It is argued that higher education weakens
traditional attachment to the ethnic group and being at a higher education institution makes
encounters with people from outside one’s own group more likely (Muttarak and Heath 2010).
We grouped educational qualifications into dichotomous categories: no degree and with degree.
We expected people with degrees to have higher probabilities of out-partnering for all ethnic
groups, except for Black people as shown in previous British studies (Berrington 1996).
Social class is also an important determinant of partner choice (Kalmijn 1998). Higher
socio-economic positions represent success in socioeconomic assimilation. Out-partnering varies
by social position with, for example, South Asians in higher social classes more likely involved
in partnerships with White people (Berrington 1996). We chose Registrar’s Social Class and
used five categories: professional & managerial occupations, skilled non-manual, skilled manual,
partly skilled & unskilled, and not stated. The unstated category covers people who were
unemployed, economically inactive, or who did not report occupations and therefore did not
have social class assigned. In general we expected people with higher social backgrounds to have
8
a higher propensity of out-partnering especially for South Asian and White groups. For LS
members who were under 21 and in full-time education, the social class and educational
qualifications of the head of household were used as proxies.
Housing tenure reflects living arrangement and possibly the financial situation of the
family. We would expect people who lived in owner occupied houses to be more integrated
within the host society and therefore were more likely to form mixed ethnic unions. We also
included region in the model to account for regional variations in the history of immigration
settlement and increasingly spatial widening marriage fields (Niedomysl et al. 2010). Summary
statistics for these control variables are given by ethnic group in Table 3.
[INSERT TABLE 3 ABOUT HERE]
Modelling results
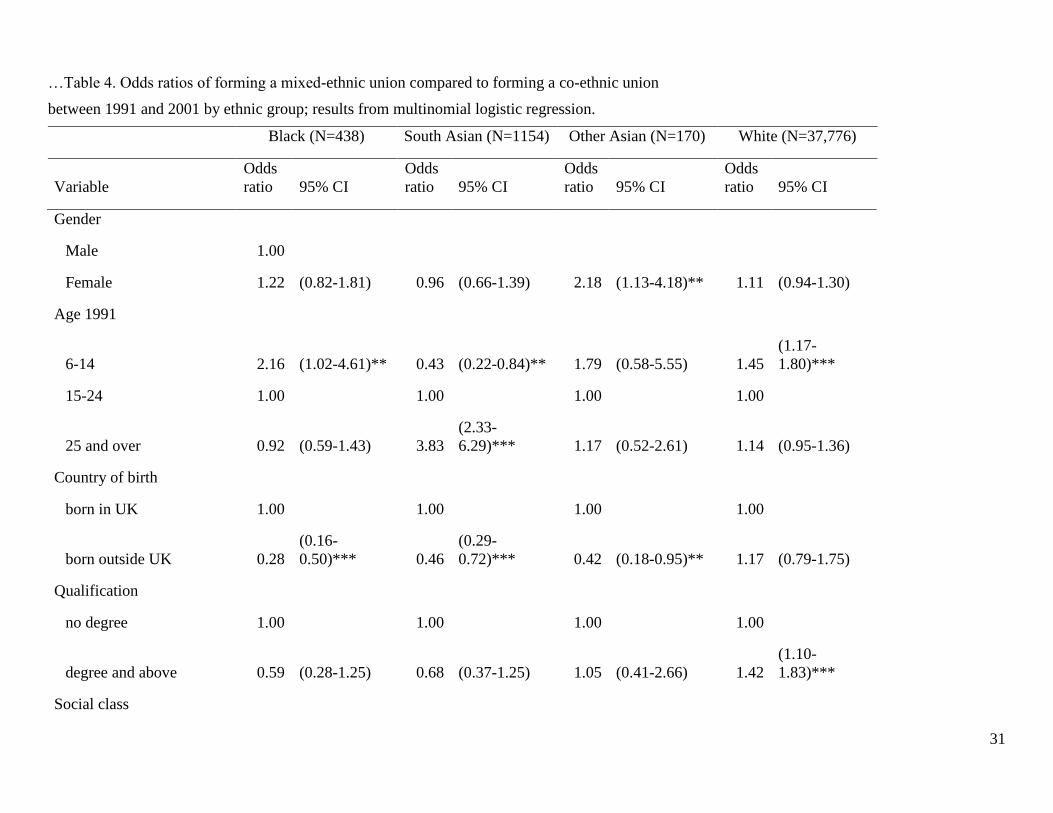
Table 4 presents the results of four multinomial logistic regression models, one for each ethnic
group. For each of the non-White ethnic groups we model the probability that a single person in
1991 forms a mixed-ethnic union with a White person or remains single by 2001, compared to
those who form a union with someone from the same ethnic group. For the White group we
model the probability that a single person in 1991 forms a mixed-ethnic union with a non-White
person or remains single by 2001. Note, again, that for brevity we only present the model
parameters for the mixed-ethnic category. For each ethnic group, we fitted regressions including
the interaction term between district level and ward level co-ethnic concentration.
[INSERT TABLE 4 ABOUT HERE]
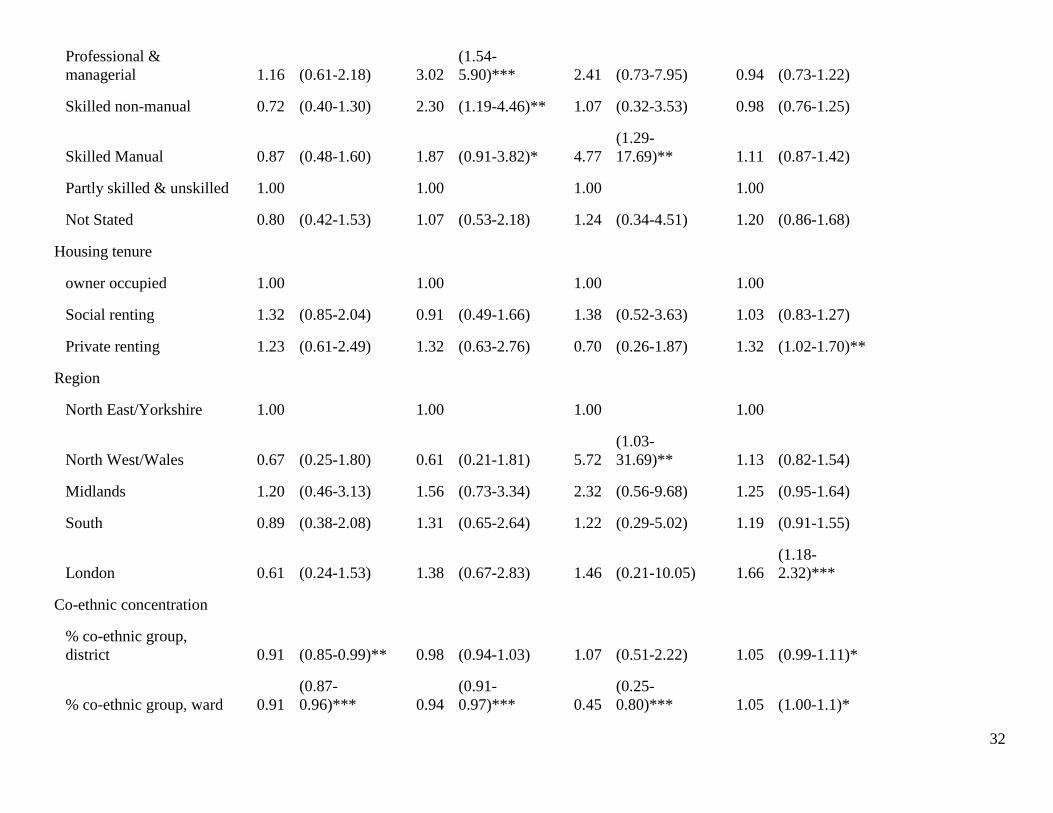
As expected, those born outside the UK were less likely to live with a White partner by
2001 compared to those born in the UK, for all three ethnic minority groups. For Blacks, the
model shows higher rates of out-partnering at younger ages but no significant effect at older
ages. No significant effects on out-partnering were found by gender, social class, qualifications
or housing tenure for Blacks. For South Asians, the odds of out-partnering increase with age and
social class. Since age in the model refers to age in 1991 rather than age at the formation of
marriage or cohabitation, its effect here should be better considered as a cohort effect. For Other
Asians, women were more likely than men to choose a White partner, a pattern which differs
from the Black or South Asians, where we found no gender differences. Other Asians in skilled
manual occupations were more likely to partner with a White person than those in other
occupations, although note that there was a relatively small number in this group. Housing tenure
and qualifications were not found to have an effect on the probability of out-partnering for South
Asians and Other Asians. The odds of forming a mixed ethnic union are relatively little affected
by region.
For White people, the odds ratios of forming a partnership with a non-White partner were
highest for those in the youngest age group (6–14 in 1991), for those with a degree or higher
qualifications, and for those in private renting. Living in London also elevated the likelihood of
out-partnering with non-White people.
9
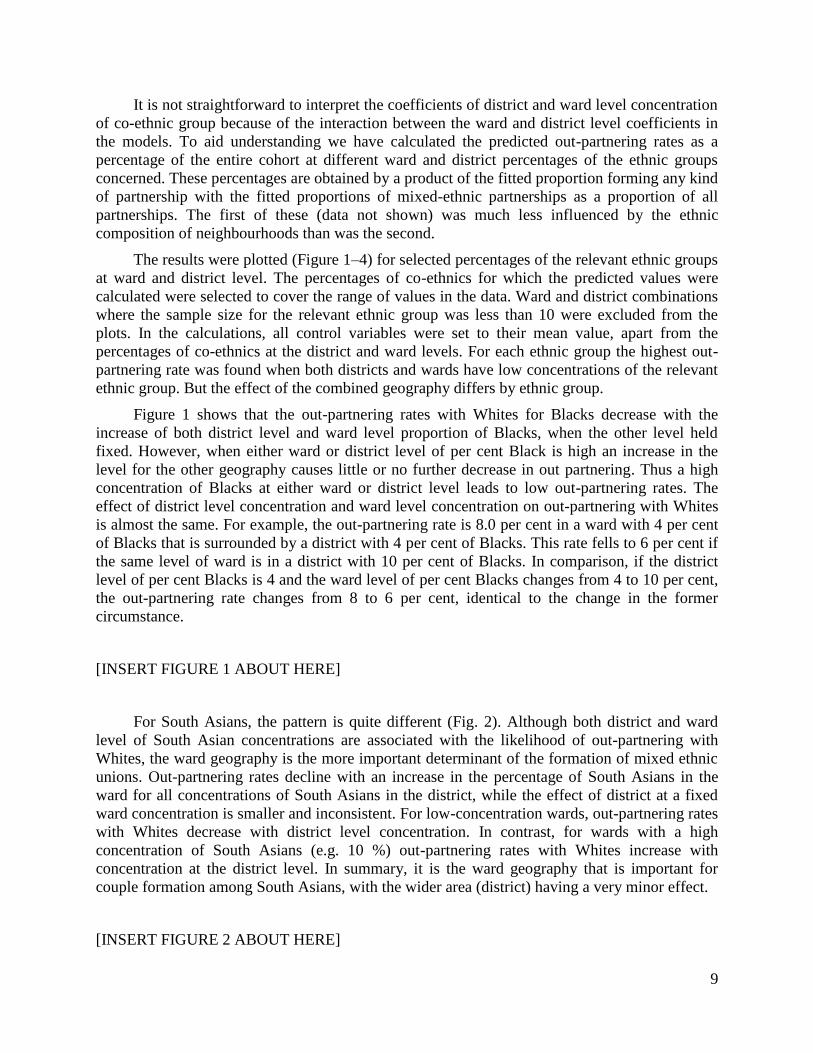
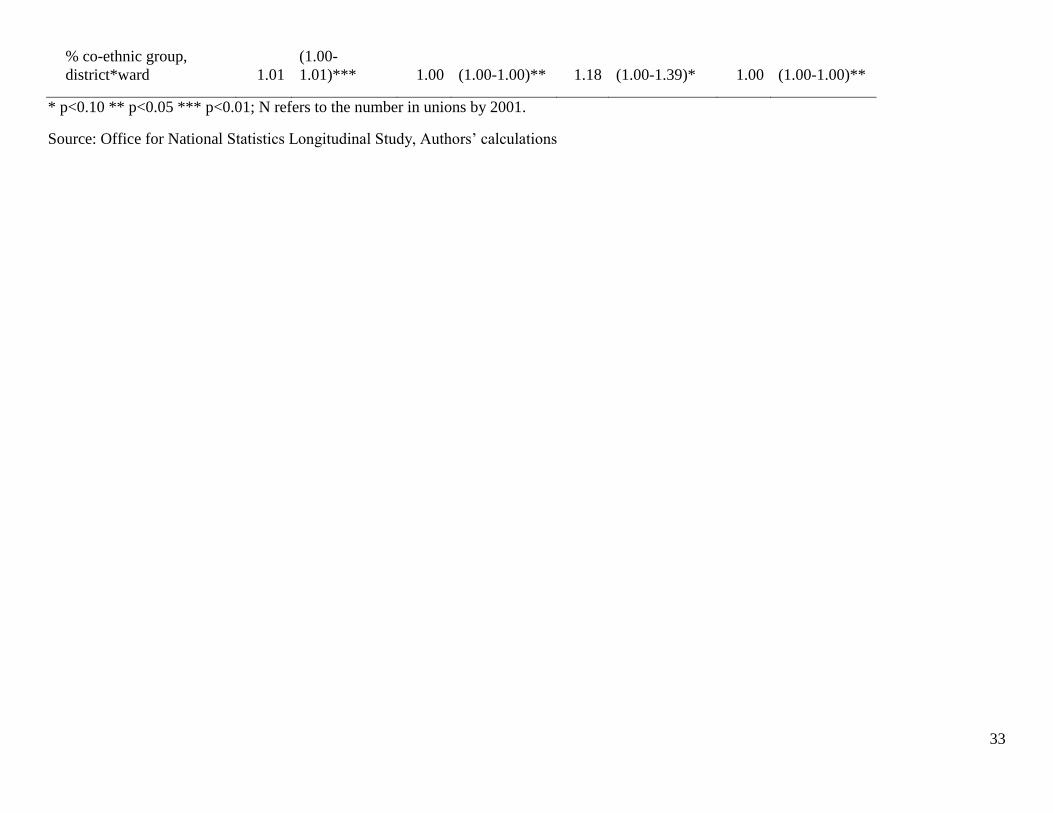
It is not straightforward to interpret the coefficients of district and ward level concentration
of co-ethnic group because of the interaction between the ward and district level coefficients in
the models. To aid understanding we have calculated the predicted out-partnering rates as a
percentage of the entire cohort at different ward and district percentages of the ethnic groups
concerned. These percentages are obtained by a product of the fitted proportion forming any kind
of partnership with the fitted proportions of mixed-ethnic partnerships as a proportion of all
partnerships. The first of these (data not shown) was much less influenced by the ethnic
composition of neighbourhoods than was the second.
The results were plotted (Figure 1–4) for selected percentages of the relevant ethnic groups
at ward and district level. The percentages of co-ethnics for which the predicted values were
calculated were selected to cover the range of values in the data. Ward and district combinations
where the sample size for the relevant ethnic group was less than 10 were excluded from the
plots. In the calculations, all control variables were set to their mean value, apart from the
percentages of co-ethnics at the district and ward levels. For each ethnic group the highest out-
partnering rate was found when both districts and wards have low concentrations of the relevant
ethnic group. But the effect of the combined geography differs by ethnic group.
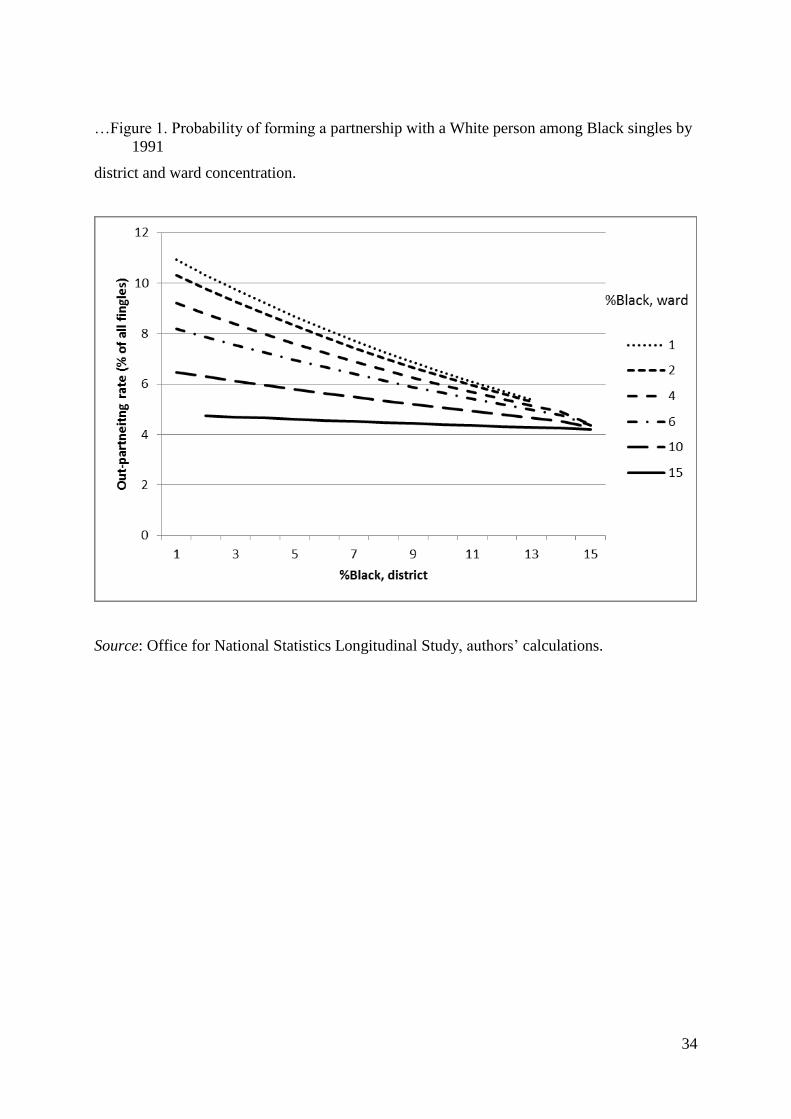
Figure 1 shows that the out-partnering rates with Whites for Blacks decrease with the
increase of both district level and ward level proportion of Blacks, when the other level held
fixed. However, when either ward or district level of per cent Black is high an increase in the
level for the other geography causes little or no further decrease in out partnering. Thus a high
concentration of Blacks at either ward or district level leads to low out-partnering rates. The
effect of district level concentration and ward level concentration on out-partnering with Whites
is almost the same. For example, the out-partnering rate is 8.0 per cent in a ward with 4 per cent
of Blacks that is surrounded by a district with 4 per cent of Blacks. This rate fells to 6 per cent if
the same level of ward is in a district with 10 per cent of Blacks. In comparison, if the district
level of per cent Blacks is 4 and the ward level of per cent Blacks changes from 4 to 10 per cent,
the out-partnering rate changes from 8 to 6 per cent, identical to the change in the former
circumstance.
[INSERT FIGURE 1 ABOUT HERE]
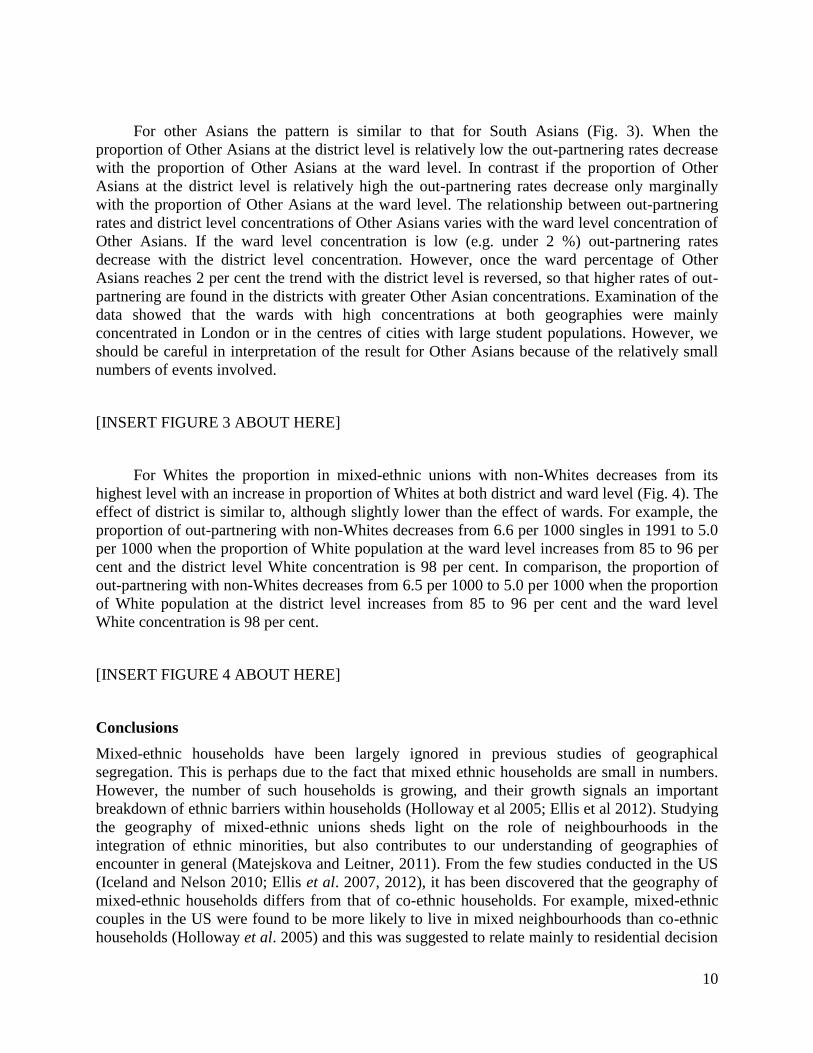
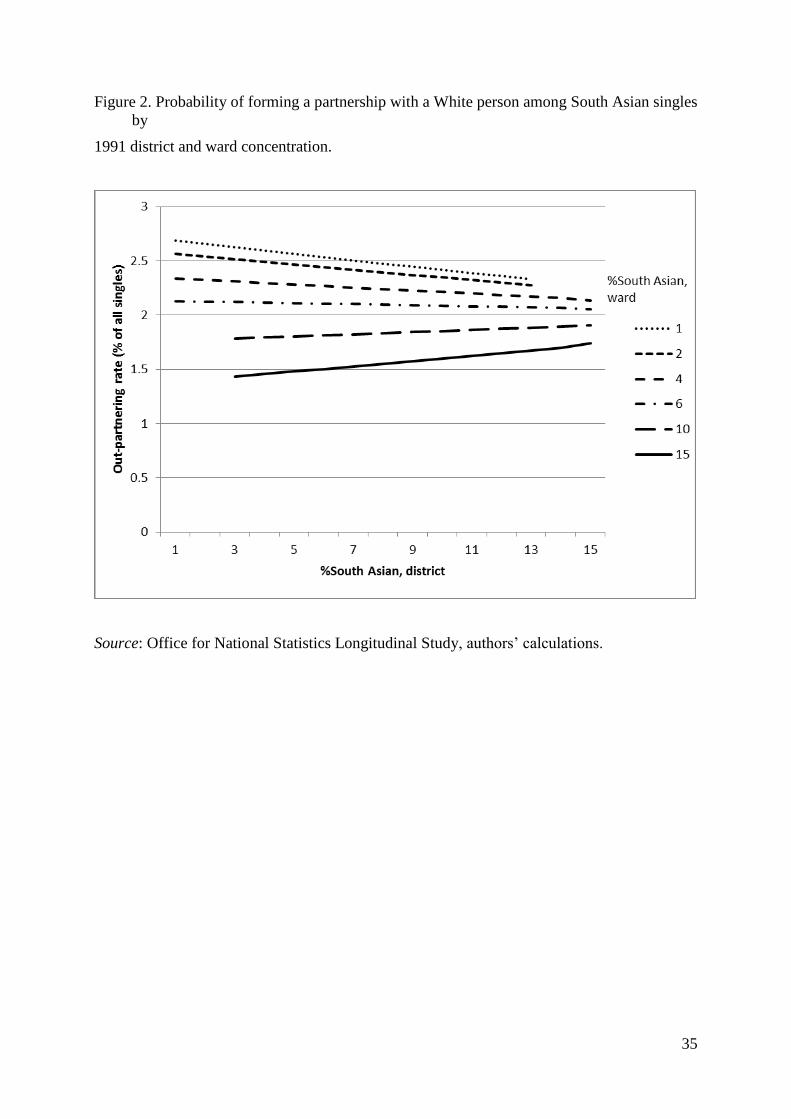
For South Asians, the pattern is quite different (Fig. 2). Although both district and ward
level of South Asian concentrations are associated with the likelihood of out-partnering with
Whites, the ward geography is the more important determinant of the formation of mixed ethnic
unions. Out-partnering rates decline with an increase in the percentage of South Asians in the
ward for all concentrations of South Asians in the district, while the effect of district at a fixed
ward concentration is smaller and inconsistent. For low-concentration wards, out-partnering rates
with Whites decrease with district level concentration. In contrast, for wards with a high
concentration of South Asians (e.g. 10 %) out-partnering rates with Whites increase with
concentration at the district level. In summary, it is the ward geography that is important for
couple formation among South Asians, with the wider area (district) having a very minor effect.
[INSERT FIGURE 2 ABOUT HERE]
10
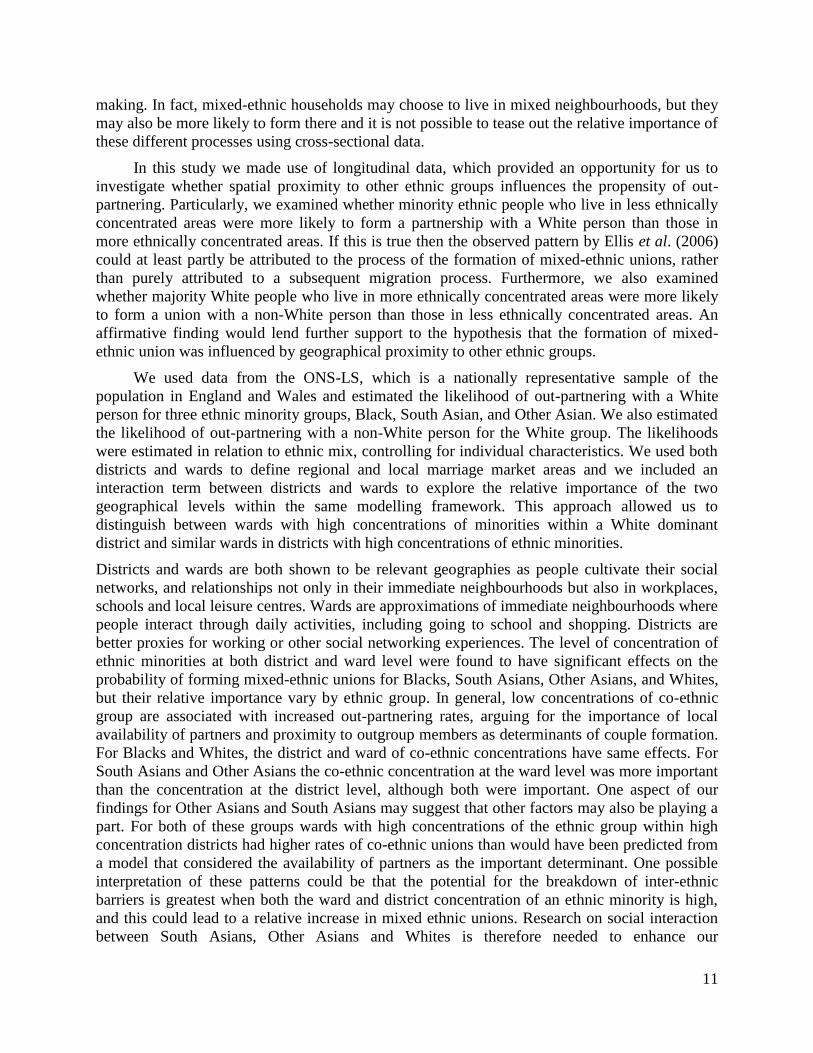
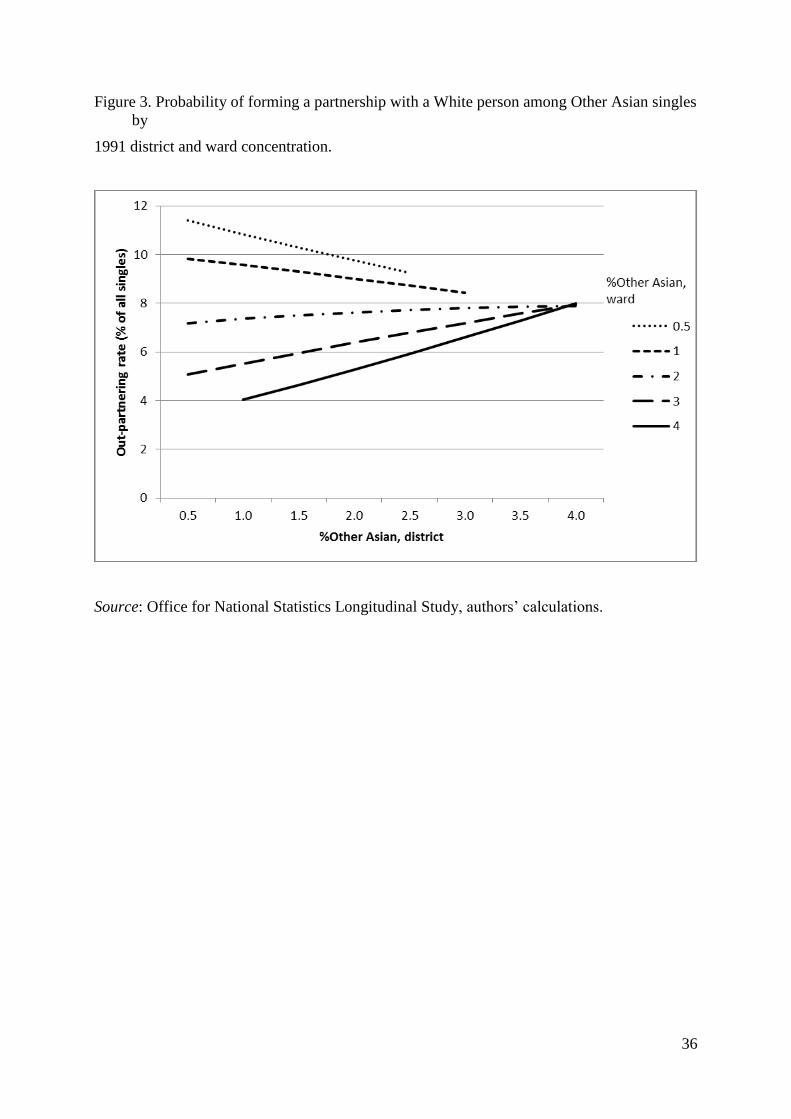
For other Asians the pattern is similar to that for South Asians (Fig. 3). When the
proportion of Other Asians at the district level is relatively low the out-partnering rates decrease
with the proportion of Other Asians at the ward level. In contrast if the proportion of Other
Asians at the district level is relatively high the out-partnering rates decrease only marginally
with the proportion of Other Asians at the ward level. The relationship between out-partnering
rates and district level concentrations of Other Asians varies with the ward level concentration of
Other Asians. If the ward level concentration is low (e.g. under 2 %) out-partnering rates
decrease with the district level concentration. However, once the ward percentage of Other
Asians reaches 2 per cent the trend with the district level is reversed, so that higher rates of out-
partnering are found in the districts with greater Other Asian concentrations. Examination of the
data showed that the wards with high concentrations at both geographies were mainly
concentrated in London or in the centres of cities with large student populations. However, we
should be careful in interpretation of the result for Other Asians because of the relatively small
numbers of events involved.
[INSERT FIGURE 3 ABOUT HERE]
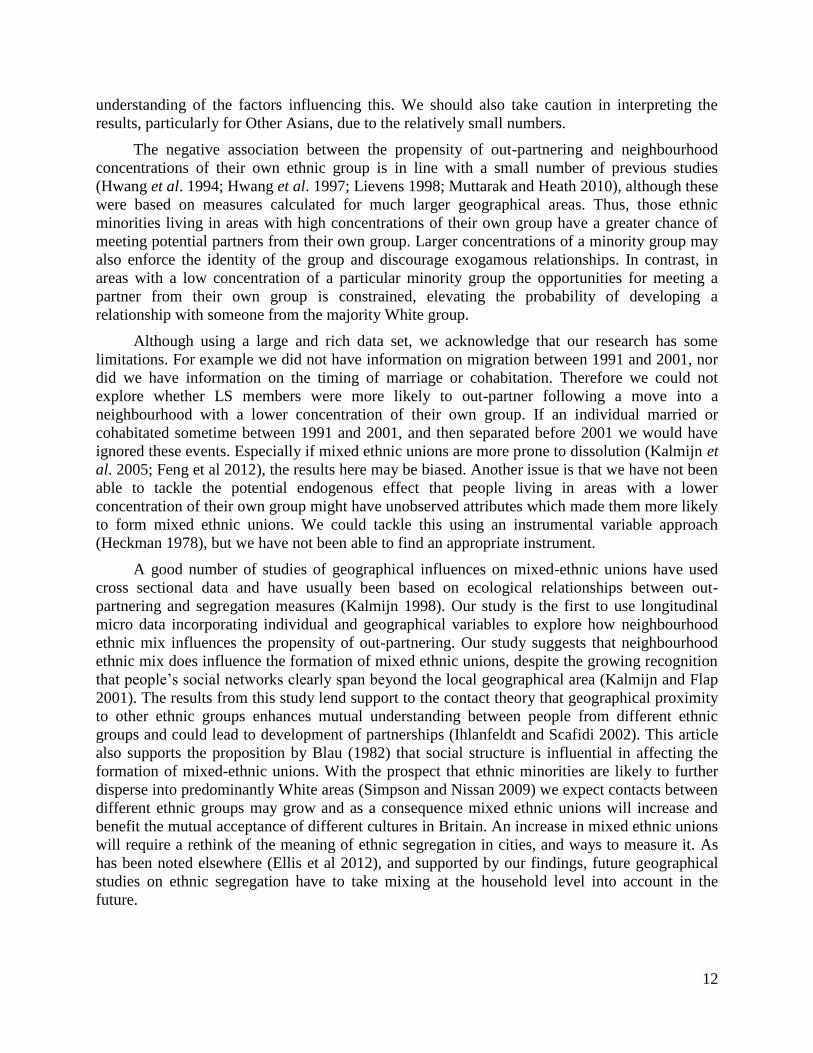
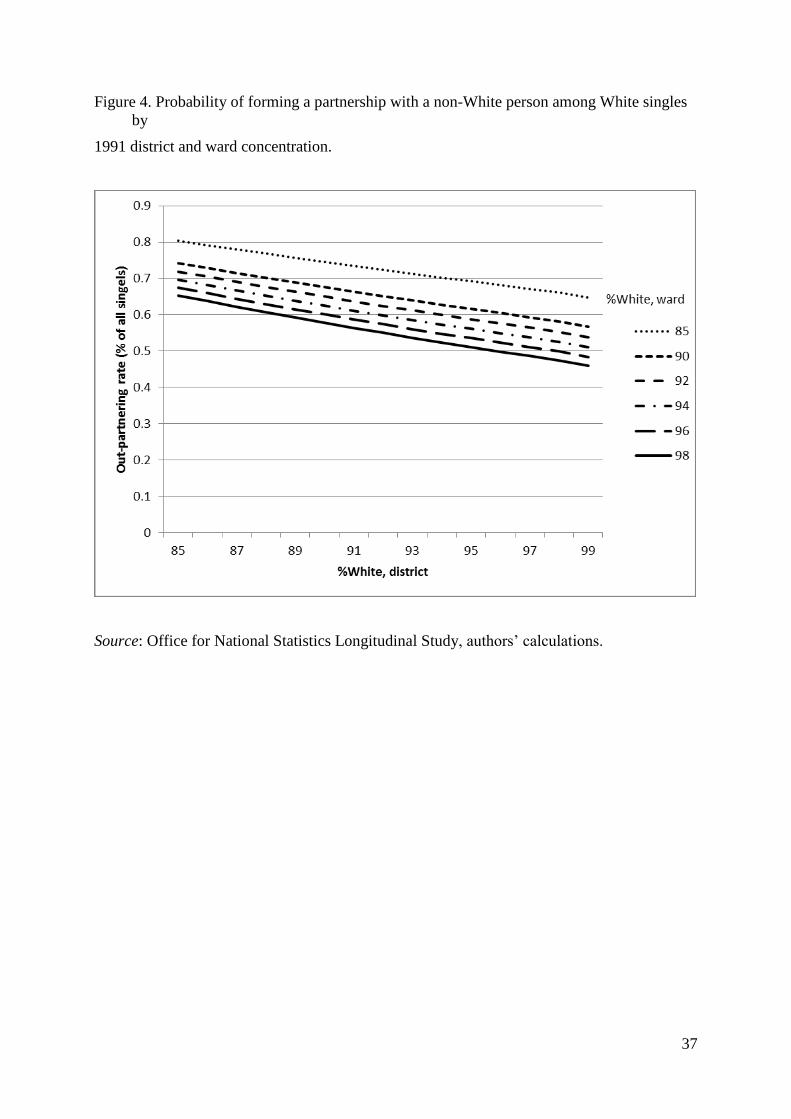
For Whites the proportion in mixed-ethnic unions with non-Whites decreases from its
highest level with an increase in proportion of Whites at both district and ward level (Fig. 4). The
effect of district is similar to, although slightly lower than the effect of wards. For example, the
proportion of out-partnering with non-Whites decreases from 6.6 per 1000 singles in 1991 to 5.0
per 1000 when the proportion of White population at the ward level increases from 85 to 96 per
cent and the district level White concentration is 98 per cent. In comparison, the proportion of
out-partnering with non-Whites decreases from 6.5 per 1000 to 5.0 per 1000 when the proportion
of White population at the district level increases from 85 to 96 per cent and the ward level
White concentration is 98 per cent.
[INSERT FIGURE 4 ABOUT HERE]
Conclusions
Mixed-ethnic households have been largely ignored in previous studies of geographical
segregation. This is perhaps due to the fact that mixed ethnic households are small in numbers.
However, the number of such households is growing, and their growth signals an important
breakdown of ethnic barriers within households (Holloway et al 2005; Ellis et al 2012). Studying
the geography of mixed-ethnic unions sheds light on the role of neighbourhoods in the
integration of ethnic minorities, but also contributes to our understanding of geographies of
encounter in general (Matejskova and Leitner, 2011). From the few studies conducted in the US
(Iceland and Nelson 2010; Ellis et al. 2007, 2012), it has been discovered that the geography of
mixed-ethnic households differs from that of co-ethnic households. For example, mixed-ethnic
couples in the US were found to be more likely to live in mixed neighbourhoods than co-ethnic
households (Holloway et al. 2005) and this was suggested to relate mainly to residential decision
11
making. In fact, mixed-ethnic households may choose to live in mixed neighbourhoods, but they
may also be more likely to form there and it is not possible to tease out the relative importance of
these different processes using cross-sectional data.
In this study we made use of longitudinal data, which provided an opportunity for us to
investigate whether spatial proximity to other ethnic groups influences the propensity of out-
partnering. Particularly, we examined whether minority ethnic people who live in less ethnically
concentrated areas were more likely to form a partnership with a White person than those in
more ethnically concentrated areas. If this is true then the observed pattern by Ellis et al. (2006)
could at least partly be attributed to the process of the formation of mixed-ethnic unions, rather
than purely attributed to a subsequent migration process. Furthermore, we also examined
whether majority White people who live in more ethnically concentrated areas were more likely
to form a union with a non-White person than those in less ethnically concentrated areas. An
affirmative finding would lend further support to the hypothesis that the formation of mixed-
ethnic union was influenced by geographical proximity to other ethnic groups.
We used data from the ONS-LS, which is a nationally representative sample of the
population in England and Wales and estimated the likelihood of out-partnering with a White
person for three ethnic minority groups, Black, South Asian, and Other Asian. We also estimated
the likelihood of out-partnering with a non-White person for the White group. The likelihoods
were estimated in relation to ethnic mix, controlling for individual characteristics. We used both
districts and wards to define regional and local marriage market areas and we included an
interaction term between districts and wards to explore the relative importance of the two
geographical levels within the same modelling framework. This approach allowed us to
distinguish between wards with high concentrations of minorities within a White dominant
district and similar wards in districts with high concentrations of ethnic minorities.
Districts and wards are both shown to be relevant geographies as people cultivate their social
networks, and relationships not only in their immediate neighbourhoods but also in workplaces,
schools and local leisure centres. Wards are approximations of immediate neighbourhoods where
people interact through daily activities, including going to school and shopping. Districts are
better proxies for working or other social networking experiences. The level of concentration of
ethnic minorities at both district and ward level were found to have significant effects on the
probability of forming mixed-ethnic unions for Blacks, South Asians, Other Asians, and Whites,
but their relative importance vary by ethnic group. In general, low concentrations of co-ethnic
group are associated with increased out-partnering rates, arguing for the importance of local
availability of partners and proximity to outgroup members as determinants of couple formation.
For Blacks and Whites, the district and ward of co-ethnic concentrations have same effects. For
South Asians and Other Asians the co-ethnic concentration at the ward level was more important
than the concentration at the district level, although both were important. One aspect of our
findings for Other Asians and South Asians may suggest that other factors may also be playing a
part. For both of these groups wards with high concentrations of the ethnic group within high
concentration districts had higher rates of co-ethnic unions than would have been predicted from
a model that considered the availability of partners as the important determinant. One possible
interpretation of these patterns could be that the potential for the breakdown of inter-ethnic
barriers is greatest when both the ward and district concentration of an ethnic minority is high,
and this could lead to a relative increase in mixed ethnic unions. Research on social interaction
between South Asians, Other Asians and Whites is therefore needed to enhance our
12
understanding of the factors influencing this. We should also take caution in interpreting the
results, particularly for Other Asians, due to the relatively small numbers.
The negative association between the propensity of out-partnering and neighbourhood
concentrations of their own ethnic group is in line with a small number of previous studies
(Hwang et al. 1994; Hwang et al. 1997; Lievens 1998; Muttarak and Heath 2010), although these
were based on measures calculated for much larger geographical areas. Thus, those ethnic
minorities living in areas with high concentrations of their own group have a greater chance of
meeting potential partners from their own group. Larger concentrations of a minority group may
also enforce the identity of the group and discourage exogamous relationships. In contrast, in
areas with a low concentration of a particular minority group the opportunities for meeting a
partner from their own group is constrained, elevating the probability of developing a
relationship with someone from the majority White group.
Although using a large and rich data set, we acknowledge that our research has some
limitations. For example we did not have information on migration between 1991 and 2001, nor
did we have information on the timing of marriage or cohabitation. Therefore we could not
explore whether LS members were more likely to out-partner following a move into a
neighbourhood with a lower concentration of their own group. If an individual married or
cohabitated sometime between 1991 and 2001, and then separated before 2001 we would have
ignored these events. Especially if mixed ethnic unions are more prone to dissolution (Kalmijn et
al. 2005; Feng et al 2012), the results here may be biased. Another issue is that we have not been
able to tackle the potential endogenous effect that people living in areas with a lower
concentration of their own group might have unobserved attributes which made them more likely
to form mixed ethnic unions. We could tackle this using an instrumental variable approach
(Heckman 1978), but we have not been able to find an appropriate instrument.
A good number of studies of geographical influences on mixed-ethnic unions have used
cross sectional data and have usually been based on ecological relationships between out-
partnering and segregation measures (Kalmijn 1998). Our study is the first to use longitudinal
micro data incorporating individual and geographical variables to explore how neighbourhood
ethnic mix influences the propensity of out-partnering. Our study suggests that neighbourhood
ethnic mix does influence the formation of mixed ethnic unions, despite the growing recognition
that people’s social networks clearly span beyond the local geographical area (Kalmijn and Flap
2001). The results from this study lend support to the contact theory that geographical proximity
to other ethnic groups enhances mutual understanding between people from different ethnic
groups and could lead to development of partnerships (Ihlanfeldt and Scafidi 2002). This article
also supports the proposition by Blau (1982) that social structure is influential in affecting the
formation of mixed-ethnic unions. With the prospect that ethnic minorities are likely to further
disperse into predominantly White areas (Simpson and Nissan 2009) we expect contacts between
different ethnic groups may grow and as a consequence mixed ethnic unions will increase and
benefit the mutual acceptance of different cultures in Britain. An increase in mixed ethnic unions
will require a rethink of the meaning of ethnic segregation in cities, and ways to measure it. As
has been noted elsewhere (Ellis et al 2012), and supported by our findings, future geographical
studies on ethnic segregation have to take mixing at the household level into account in the
future.
13
Acknowledgements
This research is funded by the ESRC under the Understanding Population Trends and Processes
(UPTAP) programme (Award Ref: RES-163-25-0045). The permission of the Office for
National Statistics to use the Longitudinal Study is gratefully acknowledged, as is the help
provided by support officers of the Centre for Longitudinal Study Information & User Support
(CeLSIUS). CeLSIUS is supported by the ESRC Census of Population Programme (Award Ref:
RES-348-25-0004). The data from ONS is Crown copyright and reproduced with the permission
of the controller of HMSO and Queen's Printer for Scotland. This work uses research datasets
which may not exactly reproduce National Statistics aggregates. We also would like to thank
reviewers and the editors of Geografiska Annaler: Series B, Human Geography for their
important inputs to this article. The authors alone are responsible for the interpretation of the
results.
References
BALLARD, R. (1996): ‘Negotiating race and ethnicity: exploring the implications of the 1991
census’, Patterns of Prejudice 30 (3): 3–33.
BERRINGTON, A. (1996): ‘Marriage patterns and inter-ethnic unions’, in COLEMAN, D. and
SALT, J. (eds): Ethnicity in the 1991 Census, vol. 1: Demographic Characteristics of the
Ethnic Minority Populations. HMSO, London, pp. 178–212.
BLAU, P. M. (1977): Inequality and Heterogeneity: A Primitive Theory of Social Structure. Free
Press, New York.
BLAU, P. M., BLUM, T. C. and SCHWARTZ, J. E. (1982): ‘Heterogeneity and intermarriage’,
American Sociological Review 47 (1): 45–62.
BOSSARD, J. H. (1932): ‘Residential propinquity as a factor in marriage selection’, American
Journal of Sociology 38 (2): 219–224.
BOZON, M. and HERAN, F. (1989): ‘Finding a spouse: a survey of how French couples meet’,
Population: An English Selection 44 (1): 91–121.
BRADFORD, B. (2006): ‘Who are the “Mixed” ethnic group?’, Office for National Statistics,
London, May.
COLEMAN, D. (1985): ‘Ethnic intermarriage in Great Britain’, Population Trends 40: 4–10.
COLEMAN, D. (2004): ‘Partner choice and the growth of ethnic minority populations’,
Bevolking en Gezin 33 (2): 7–34.
COLEMAN, D. and SALT, J. (1996): ‘The ethnic group question in the 1991 census: a new
landmark in British social statistics’, in COLEMAN, D. and SALT, J. (eds): Ethnicity in
the 1991 Census, vol. 1: Demographic Characteristics of the Ethnic Minority Populations.
HMSO, London, pp. 1–32.
CREADY, C. M. and SAENZ, R. (1997): ‘The nonmetro/metro context of racial/ethnic
outmarriage: some differences between African Americans and Mexican Americans’,
Rural Sociology 62 (3): 335–362.
14
DALE, A and HOLDSWORTH, C. . (1997): ‘Issues in the analysis of ethnicity in the 1991
British Census: evidence from microdata’, Ethnic and Racial Studies 20 (1): 160–181
DMAG (2005): ‘Inter-ethnic unions’. DMAG Update, Census update 2005/12, Data
Management and Analysis Group, Greater London Authority, London, November.
DELANEY, D. (2002): ‘The space that race makes’, Professional Geographer 54 (1): 6–14.
DUTTON, W. H., HELSPER, E. J., WHITTY, M. T., BUCKWALTER, J. G, and LEE, E.
(2010): Mate selection in the networked society: the role of the Internet in reconfiguring
marriages in Australia, the United Kingdom and United States. Working paper, Oxford
Internet Institute, University of Oxford, 10 November.
ELLIS, M., WRIGHT, R. and PARKS, V. (2006): ‘The immigrant household and spatial
assimilation: partnership, nativity, and neighborhood location’, Urban Geography 27 (1):
1–19.
ELLIS, M., HOLLOWAY, S. R., WRIGHT, R. and East, M. (2007): ‘The effects of mixed-race
households on residential segregation’, Urban Geography 28 (6): 554–577.
ELLIS, M., HOLLOWAY, S. R, WRIGHT, R. and FOWLER, C. S. (2012): ‘Agents of change:
mixed-race households and the dynamics of neighborhood segregation in the United
States’, Annals of the Association of American Geographers 102 (3): 549–570.
ELLISON, C. G. and POWERS, D. A. (1994): ‘The contact hypothesis and racial attitudes
among black Americans’, Social Science Quarterly 75 (2): 385–400.
EMERSON, M. O., KIMBRO, R. T. and YANCEY, G. (2002): ‘Contact theory extended: the
effects of prior racial contact on current social ties’, Social Science Quarterly 83 (3): 745–
761.
FENG, Z., BOYLE, P., VAN HAM, M. and RAAB, G. (2010): ‘Neighbourhood ethnic mix and
the formation of mixed-ethnic unions in Britain’, in STILLWELL, J. and VAN HAM, M.
(eds): Ethnicity and Integration. Understanding Population Trends and Processes 3,
Springer, Heidelberg, pp. 83–103.
FENG, Z., BOYLE, P., VAN HAM, M. and RAAB, G. (2012): ‘Are mixed ethnic unions more
likely to dissolve than co-ethnic unions? New evidence from Britain’, European Journal of
Population, 28(3): 159-176
FORREST, J. and DUNN, K. (2011): ‘Attitudes to diversity: new perspectives on the ethnic
geography of Brisbane, Australia’, Australian Geographer 42 (4): 435–453.
GORDON, M. M. (1964): Assimilation in American Life: The Role of Race, Religion, and
National Origins. Oxford University Press, New York.
HATTERSLEY, L. and CREESER, R. (1995): The longitudinal study, 1971-1991: history,
organisation and quality of data. Office of Population Censuses and Surveys, Series LS 7,
HMSO, London.
HECKMAN, J. J. (1978): ‘Dummy endogenous variables in a simultaneous equation system’,
Econometrica 46 (4): 931–959.
.
15
HOLLOWAY, S. R., ELLIS, M., WRIGHT, R. and HUDSON, M. (2005): ‘Partnering “out” and
fitting in: residential segregation and the neighbourhood contexts of mixed-race
households’, Population, Space and Place 11 (4): 299–324.
HOUSTON, S., WRIGHT, R., ELLIS, M., HOLLOWAY, S. and HUDSON, M. (2005): ‘Places
of possibility: where mixed-race partners meet?’, Progress in Human Geography 29 (6):
700–717.
HWANG, S.-S., SAENZ, R. and AGUIRRE, B. E. (1994): ‘Structural and individual
determinants of outmarriage among Chinese-, Filipino-, and Japanese-Americans in
California’, Sociological Inquiry 64 (4): 396–414.
HWANG, S.-S., SAENZ, R. and AGUIRRE, B. E. (1997): ‘Structural and assimilationist
explanations of Asian American intermarriage’, Journal of Marriage and the Family 59
(3): 758–772.
ICELAND, J. and NELSON, K. A. (2010): ‘The residential segregation of mixed-nativity
married couples’, Demography 47 (4): 869–893.
IHLANFELDT, K. R. and SCAFIDI, B. P. (2002): ‘The neighbourhood contact hypothesis:
evidence from the Multicity Study of Urban Inequality’, Urban Studies 39 (4): 619–641.
JOHNSTON, R., POULSEN, M. and FORREST, J. (2006): ‘Ethnic residential segregation and
assimilation in British towns and cities: a comparison of those claiming single and dual
ethnic identities’, Migration Letters 3 (1): 11–30.
KALMIJN, M. (1998): ‘Intermarriage and homogamy: causes, patterns, trends’, Annual Review
of Sociology 24: 395–421.
KALMIJN, M. and FLAP, H. (2001): ‘Assortative meeting and mating: unintended
consequences of organized settings for partner choices’, Social Forces 79 (4): 1289–1312.
KALMIJN, M., DE GRAAF, P. M. and JANSSEN, P. G. (2005): ‘Intermarriage and the risk of
divorce in the Netherlands: the effects of differences in religion and in nationality, 1974–
94’, Population Studies 59 (1): 71–85.
LIANG, Z. and ITO, N. (1999): ‘Intermarriage of Asian Americans in the New York City
region: contemporary patterns and future prospects’, International Migration Review 33
(4): 876–900.
LIEVENS, J. (1998): ‘Interethnic marriage: bringing in the context through multilevel
modelling’, European Journal of Population/Revue européenne de Démographie 14 (2):
117–155.
LIEBERSON, S. and WATERS, M. C. (1988): From Many Strands: Ethnic and Racial Groups
in Contemporary America. Russell Sage Foundation, New York.
MATEJSKOVA, T. and LEITNER, H. (2011): ‘Urban encounters with difference: the contact
hypothesis and immigrant integration projects in eastern Berlin’, Social and Cultural
Geography 12 (7): 717–741.
MODEL, S. and FISHER, G. (2002): ‘Unions between blacks and whites: England and the US
compared’, Ethnic and Racial Studies 25 (5): 728–754.
16
MORGAN, B. S. (1981): ‘A contribution to the debate on homogamy, propinquity, and
segregation’, Journal of Marriage and the Family 43 (4): 909–921.
MUTTARAK, R. (2004): ‘Marital assimilation: interethnic marriage in Britain’, paper prepared
for 12th Biennial Conference of the Australian Population Association, 15–17 September
2004, Canberra, ACT.
MUTTARAK, R. and HEATH, A. (2010): ‘Who intermarries in Britain? Explaining ethnic
diversity in intermarriage patterns’, British Journal of Sociology 61 (2): 275–305.
NIEDOMYSL, T., ÖSTH, J. and VAN HAM, M. (2010): ‘Globalisation of marriage fields: the
Swedish case’, Journal of Ethnic and Migration Studies 36 (7): 1119–1138.
PEACH, C. (1974): ‘Ethnic segregation in Sydney and intermarriage patterns’, Australian
Geographical Studies 12 (2): 219–229.
PEACH, C. (1980): ‘Ethnic segregation and intermarriage’, Annals of the Association of
American Geographers 70 (3): 371–381.
PEACH, C. (2005): ‘Social integration and social mobility: spatial segregation and intermarriage
of the Caribbean population in Britain’, in LOURY, G. C., MODOOD, T. and TELES, S.
M. (eds): Ethnicity, Social Mobility and Public Policy: Comparing the US and UK.
Cambridge University Press, Cambridge, pp. 178–203.
PLATT, L., SIMPSON, L. and AKINWALE, B. (2005): ‘Stability and change in ethnic groups
in England and Wales’, Population Trends 121: 35–46.
PORTES, A. and ZHOU, M. (1993): ‘The new second generation: segmented assimilation and
its variants’, Annals of the American Academy of Political and Social Sciences 530: 74–96.
PORTES, A. and RUMBAUT, R. G. (2001): Legacies: The Story of the Immigrant Second
Generation. University of California Press, Berkeley, CA.
PRICE, P. L. (2010): ‘At the crossroads: critical race theory and critical geographies of race’,
Progress in Human Geography 34 (2): 147–174.
QIAN, Z. and LICHTER, D. T. (2007): ‘Social boundaries and marital assimilation: interpreting
trends in racial and ethnic intermarriage’, American Sociological Review 72 (1): 68–94.
ROSENFELD, M. J. (2002): ‘Measures of assimilation in the marriage market: Mexican
Americans 1970–1990’, Journal of Marriage and Family 64 (1): 152–162.
SIGELMAN, L., BLEDSOE, T., WELCH, S. and COMBS, M. W. (1996): ‘Making contact?
Black-white social interaction in an urban setting’, American Journal Sociology 101 (5):
1306–1332.
SIMPSON, L. and FINNEY, N. (2009): ‘Spatial patterns of internal migration: evidence for
ethnic groups in Britain’, Population, Space and Place 15 (1): 37–56.
STILLWELL, J. and VAN HAM, M. (2010): ‘Ethnicity and integration’, in STILLWELL, J. and
VAN HAM, M. (eds): Ethnicity and Integration. Understanding Population Trends and
Processes 3, Springer, Heidelberg, pp. 1–25.
TOLSMA, J., LUBBERS, M. and COENDERS, M (2008): ‘Ethnic competition and opposition
to ethnic intermarriage in the Netherlands: a multi-level approach’, European Sociological
Review 24 (2): 215–230.
17
VAN HAM, M. and FEIJTEN, P. M. (2008): ‘Who wants to leave the neighbourhood? The effect
of being different from the neighbourhood population on wishes to move’, Environment
and Planning A 40 (5): 1151–1170.
VAN HAM, M. and MANLEY, D. (2010): ‘The effect of neighbourhood housing tenure mix on
labour market outcomes: a longitudinal investigation of neighbourhood effects’, Journal of
Economic Geography 10 (2): 257–282.
VOAS, D. (2009): ‘The maintenance e and transformation of ethnicity: evidence on mixed
partnerships in Britain’, Journal of Ethnic and Migration Studies 33 (9): 1497–1513.
WESSEL, T. (2009): ‘Does diversity in urban space enhance intergroup contact and tolerance?’
Geografiska Annaler: Series B, Human Geography 91 (1): 5–17.
WONG, D. W. S. (1999): ‘A geographical analysis of multiethnic households in the United
States’, International Journal of Population Geography 5 (1): 31–48.
18
Table 1: Ethnic definitions in the 1991 and 2001 censuses.
Ethnic group 1991 2001
White White British
Irish
Other White
Black Black-Caribbean
Black-African
Black Other
Black and White
Black-Caribbean
Black-African
Other Black
White and Black-
Caribbean
White and Black-African
South Asian Indian
Pakistani
Bangladeshi
Indian
Pakistani
Bangladeshi
Other Asian Chinese
Other Asian
Chinese
Other Asian
Other Other ethnic group:
non-mixed origin
Other ethnic group:
mixed origin
White and Asian
Other mixed
Other ethnic group
Source: Office for National Statistics Longitudinal Study
…
19
Table 2: Partnership status in 2001 by ethnic group for singles aged 6 and over in 1991.
Ethnic group
Co-ethnic
union
Mixed-ethnic
union Single Total
Black 231 (9.5%) 207 (8.5%) 1,984 (81.9%) 2,422 (100%)
South Asian 1,034 (25.7%) 120 (3.0%) 2,863 (71.3%) 4,017 (100%)
Other Asian 100 (14.3%) 70 (10.0%) 527 (75.6%) 697 (100%)
Total for
minority
groups 1,365 (19.1%) 397 (5.6%) 5,374 (75.3%) 7,136 (100%)
White
37,116
(30.2%) 660 (0.5%)
85,005
(69.2%)
122,781
(100%)
Source: Office for National Statistics Longitudinal Study, Authors’ calculations
…
20
Table 3: Characteristics of LS members who were single in 1991 (%).
Variable Category Black
South
Asian
Other
Asian
White
Gender Male 43.8 49.4 51.4 48.8
Female 56.2 50.6 48.6 51.2
Age 1991 6-14 34.9 51.8 40.6 35.3
15-24 47.2 40.7 44.8 41.3
25 and over 17.9 7.4 14.6 23.5
Country of
Birth Born in UK 74.7 67.4 54.8 97.1
Born outside UK 25.3 32.6 45.2 2.9
Qualification* No degree 93.0 92.4 82.8 91.1
With Degree 7.0 7.6 17.2 8.9
Social Class*
Professional &
managerial 20.7 19.9 30.7 18.0
Skilled non-manual 21.7 13.8 18.5 21.3
Skilled Manual 14.7 19.4 20.1 18.9
Partly skilled &
unskilled 21.0 23.2 10.9
26.3
Not Stated 21.9 23.7 19.8 15.6
Housing tenure Owned 49.7 81.0 71.3 73.0
Social renting 44.1 13.9 17.9 21.1
Private renting 6.2 5.1 10.8 5.9
Region North East/Yorkshire 7.6 14.0 6.9 16.7
North West/Wales 8.5 7.6 8.6 13.7
Midlands 11.6 13.3 21.8 25.4
South 22.8 32.3 17.8 32.8
London 49.6 32.9 44.8 11.3
* Head of household data used for those under 21 in full-time education

21
Source: Office for National Statistics Longitudinal Study, Authors’ calculations
31
…Table 4. Odds ratios of forming a mixed-ethnic union compared to forming a co-ethnic union
between 1991 and 2001 by ethnic group; results from multinomial logistic regression.
Black (N=438) South Asian (N=1154) Other Asian (N=170) White (N=37,776)
Variable
Odds
ratio 95% CI
Odds
ratio 95% CI
Odds
ratio 95% CI
Odds
ratio 95% CI
Gender
Male 1.00
Female 1.22 (0.82-1.81) 0.96 (0.66-1.39) 2.18 (1.13-4.18)** 1.11 (0.94-1.30)
Age 1991
6-14 2.16 (1.02-4.61)** 0.43 (0.22-0.84)** 1.79 (0.58-5.55) 1.45
(1.17-
1.80)***
15-24 1.00
1.00
1.00
1.00
25 and over 0.92 (0.59-1.43) 3.83
(2.33-
6.29)*** 1.17 (0.52-2.61) 1.14 (0.95-1.36)
Country of birth
born in UK 1.00
1.00
1.00
1.00
born outside UK 0.28
(0.16-
0.50)*** 0.46
(0.29-
0.72)*** 0.42 (0.18-0.95)** 1.17 (0.79-1.75)
Qualification
no degree 1.00
1.00
1.00
1.00
degree and above 0.59 (0.28-1.25) 0.68 (0.37-1.25) 1.05 (0.41-2.66) 1.42
(1.10-
1.83)***
Social class
32
Professional &
managerial 1.16 (0.61-2.18) 3.02
(1.54-
5.90)*** 2.41 (0.73-7.95) 0.94 (0.73-1.22)
Skilled non-manual 0.72 (0.40-1.30) 2.30 (1.19-4.46)** 1.07 (0.32-3.53) 0.98 (0.76-1.25)
Skilled Manual 0.87 (0.48-1.60) 1.87 (0.91-3.82)* 4.77
(1.29-
17.69)** 1.11 (0.87-1.42)
Partly skilled & unskilled 1.00
1.00
1.00
1.00
Not Stated 0.80 (0.42-1.53) 1.07 (0.53-2.18) 1.24 (0.34-4.51) 1.20 (0.86-1.68)
Housing tenure
owner occupied 1.00
1.00
1.00
1.00
Social renting 1.32 (0.85-2.04) 0.91 (0.49-1.66) 1.38 (0.52-3.63) 1.03 (0.83-1.27)
Private renting 1.23 (0.61-2.49) 1.32 (0.63-2.76) 0.70 (0.26-1.87) 1.32 (1.02-1.70)**
Region
North East/Yorkshire 1.00
1.00
1.00
1.00
North West/Wales 0.67 (0.25-1.80) 0.61 (0.21-1.81) 5.72
(1.03-
31.69)** 1.13 (0.82-1.54)
Midlands 1.20 (0.46-3.13) 1.56 (0.73-3.34) 2.32 (0.56-9.68) 1.25 (0.95-1.64)
South 0.89 (0.38-2.08) 1.31 (0.65-2.64) 1.22 (0.29-5.02) 1.19 (0.91-1.55)
London 0.61 (0.24-1.53) 1.38 (0.67-2.83) 1.46 (0.21-10.05) 1.66
(1.18-
2.32)***
Co-ethnic concentration
% co-ethnic group,
district 0.91 (0.85-0.99)** 0.98 (0.94-1.03) 1.07 (0.51-2.22) 1.05 (0.99-1.11)*
% co-ethnic group, ward 0.91
(0.87-
0.96)*** 0.94
(0.91-
0.97)*** 0.45
(0.25-
0.80)*** 1.05 (1.00-1.1)*
33
% co-ethnic group,
district*ward 1.01
(1.00-
1.01)*** 1.00 (1.00-1.00)** 1.18 (1.00-1.39)* 1.00 (1.00-1.00)**
* p<0.10 ** p<0.05 *** p<0.01; N refers to the number in unions by 2001.
Source: Office for National Statistics Longitudinal Study, Authors’ calculations
34
…Figure 1. Probability of forming a partnership with a White person among Black singles by
1991
district and ward concentration.
Source: Office for National Statistics Longitudinal Study, authors’ calculations.
35
Figure 2. Probability of forming a partnership with a White person among South Asian singles
by
1991 district and ward concentration.
Source: Office for National Statistics Longitudinal Study, authors’ calculations.
36
Figure 3. Probability of forming a partnership with a White person among Other Asian singles
by
1991 district and ward concentration.
Source: Office for National Statistics Longitudinal Study, authors’ calculations.
37
Figure 4. Probability of forming a partnership with a non-White person among White singles
by
1991 district and ward concentration.
Source: Office for National Statistics Longitudinal Study, authors’ calculations.
Related Documents