Negotiating with Labor under Financial Distress * Efraim Benmelech Harvard University and NBER Nittai K. Bergman MIT Sloan and NBER Ricardo Enriquez Harvard University * We thank Larry Katz, Jeremy Stein and seminar participants at Harvard University for useful comments. All errors are our own. Efraim Benmelech, Department of Economics, Harvard University, Littauer Center, Cambridge, MA 02138. E-mail: effi [email protected]. Nittai Bergman, Sloan School of Management, MIT, 50 Memorial Drive, Cambridge, MA 02142. E-mail: [email protected]. Ricardo Enriquez, Department of Economics, Harvard University, Littauer Center, Cambridge, MA 02138. E-mail: [email protected].

Welcome message from author
This document is posted to help you gain knowledge. Please leave a comment to let me know what you think about it! Share it to your friends and learn new things together.
Transcript
Negotiating with Labor under Financial Distress∗
Efraim BenmelechHarvard University and NBER
Nittai K. BergmanMIT Sloan and NBER
Ricardo EnriquezHarvard University
∗ We thank Larry Katz, Jeremy Stein and seminar participants at Harvard University for useful comments. All errors
are our own.
Efraim Benmelech, Department of Economics, Harvard University, Littauer Center, Cambridge, MA 02138. E-mail:
effi [email protected]. Nittai Bergman, Sloan School of Management, MIT, 50 Memorial Drive, Cambridge,
MA 02142. E-mail: [email protected]. Ricardo Enriquez, Department of Economics, Harvard University, Littauer
Center, Cambridge, MA 02138. E-mail: [email protected].

Negotiating with Labor under Financial Distress
Abstract
We analyze how firms renegotiate labor contracts by strategically using pension underfunding to
extract concessions from labor. While anecdotal evidence suggests that firms tend to renegotiate
down wages in times of financial distress, there is no empirical evidence that documents such
renegotiation and its determinants. This paper attempts to fill this gap. Using a uniques data set
of airlines that includes detailed information on wages, benefits and pension plans we document
an empirical link between airline financial distress, pension underfunding and wage concessions.
We show that airlines in financial distress obtain wage concession from employees whose pension
plans are underfunded. We exploit, as part of our identification strategy, the fact pension plans
in the U.S are partially insured by the Pension Benefit Guaranty Corporation (PBGC). While
most defined benefits pensions in the U.S. are insured by the PBGC, this coverage is limited. The
maximum annual guarantee is determined by the employee age and was $47,659 for a 65 year-old
worker in 2006. We show that since highly-paid employees with promised pensions that exceed the
PBGC limit stand to lose more if their pension is dumped they make large concessions during labor
bargaining.

I. Introduction
We analyze how firms renegotiate labor contracts by strategically using pension underfunding to
extract concessions from labor. While anecdotal evidence suggests that firms tend to renegotiate
down wages in times of financial distress, there is no empirical evidence that documents such
renegotiation and its determinants. This paper attempts to fill this gap. Using a uniques data set
of airlines that includes detailed information on wages, benefits and pension plans we document an
empirical link between airline financial distress, pension underfunding and wage concessions.
Previous research on the interaction between financial decisions and labor has documented
that unionized firms maintain low levels of cash and high leverage. However, less is known on
the ability of firms to renegotiate labor contracts and in particular the role that finance plays in
such negotiations. We focus on the threat of ‘pension dumping’: by which firms threaten to strip
employees of their defined benefits pension by dumping underfunded pension plans and reneging
on the promise of retirement payments. Our paper is closely related to Ippolito (1985) who argued
that firms may deliberately underfund their pension plan despite a tax disadvantage in order to
deter their labor unions from holding-up the firms by potentially imposing capital loses on workers
covered by the pensions. We provide direct evidence on the actual mechanism in which airlines use
underfunded pensions and the threat to dump those pensions in order to extract labor concessions
in and out of bankruptcy.
We first show that airlines in financial distress obtain wage concession from employees whose
pension plans are underfunded. Since employees with underfunded pension plans bear a higher
cost when firms default, their outside option in the event of default is reduced. Therefore, in
bargaining, management can employ the threat of ‘pension dumping’ to extract greater concessions
from labor. We then exploit, as part of our identification strategy, the fact pension plans in the U.S
are partially insured by the Pension Benefit Guaranty Corporation (PBGC) – a federal corporation
which protects the pensions of nearly 44 million American workers. While most defined benefits
pensions in the U.S. are insured by the PBGC, this coverage is limited. The maximum annual
guarantee is determined by the employee age and was $47,659 for a 65 year-old worker in 2006. We
conjecture that since highly-paid employees with promised pensions that exceed the PBGC limit
stand to lose more if their pension is dumped they will be more likely to make concessions during
labor bargaining.
1
Our identification strategy thus relies on a triple-difference or DDD specification, with three
levels of differences: (i) financially constrained vs. less-financially constrained airlines, (ii) under-
funded pension plans vs. funded plans, and (iii) wages exceeding vs. those that are below the
PBGC limit. We find that airlines that are financially constrained can negotiate down the wages
of their employees whose pensions are underfunded and are not fully covered by the PBGC guar-
antee. Our results are robust to the inclusion of year, airline, plan and airline-by-year fixed effects
in addition to airline controls.
We find that the DDD estimator is negative and statistically significant and ranges from -7.4%
to -9.5%, implying that airlines that are financially constrained can negotiate down the wages of
their highly-paid employees whose pensions are not fully covered by the PBGC maximum guarantee.
Furthermore, the DDD estimator is -9.4% and -11.9% when the pension plan is underfunded by
at least 10%, and 15%, respectively. In terms of levels (in $ thousands) instead of the percentage
change, financially constrained airlines extract from employees whose average wage exceeds the
PBGC limit when their pension plans are underfunded an amount that is between $11,819 and
$17,435 per year.
Earlier research has documented that unionization rates are correlated with leverage at the in-
dustry level (Bronars and Deere (1991)). Similarly, using firm-level data, Hirsch (1991), Cavanaugh
and Garen (1997) find evidence that leverage is positively correlated correlated with unionization
rates, while Klasa, Maxwell, and Ortiz-Molina (2008) who that firms in more unionized industries
hold less cash. However, while making important contribution the the empirical evidence, the re-
sults reported in these papers may be driven by an omitted variables bias in which industries with
higher unionization rates also have higher debt capacity for different reasons. In a recent paper,
Matsa (2009) uses exogenous variation in state-level labor laws showing that once states adopt leg-
islation that reduces union bargaining power, firms with concentrated labor markets reduce debt
relative to otherwise similar firms in other states. Our paper add to this literature by documenting
actual renegotiations ex-post and identifying the conditions under which firms can successfully use
their financial position to extract surplus from labor.
The rest of the paper is organized as follows. Section I analyzes a simple contract-renegotiation
model based on hart and Moore (1994). Our model generates three intuitive predictions which
are them tested in the data. Section II provides a case study analyzing the wage renegotiation in
Delta Airlines between 2003 and 2006, and the role that the threat of ‘pension dumping’ played in
2
the negotiations between management and Delta’s pilots. Section III provides a description of our
data sources and summary statistics. We detail our identification strategy in Section IV. Sections
V and VI describe the empirical analysis. Section VII concludes.
II. The Model
This section develops a simple model analyzing labor contract renegotiation between a firm’s man-
agement and its employees. The model is based on related work studying financial contract renego-
tiation as in Hart and Moore 1994. Our goal is to analyze the conditions under which management
can successfully renegotiate labor contracts with workers and the payoffs obtained by parties in any
successful renegotiation. Following our empirical strategy, the relative sizes of pension liabilities,
pension funding, and pension guarantees will play a key role in the renegotiation outcome, as these
are key in determining the value of labor’s outside option in negotiation. The model provides three
intuitive predictions : First, in order for management to successfully extract any concessions from
labor, the firm must be doing sufficiently poorly. Second, conditional on management extracting
concessions from workers greater pension underfunding reduces workers post-renegotiation payoff,
but, third, the sensitivity of worker payoffs to underfunding is reduced when government pension
guarantees are larger.
A. Setup
Consider a firm that is run by management representing shareholders and that employs labor to
generate output and hence cash flow. The model is comprised of two periods. In the first period
the firm is assumed to have free cash flow of C1 – representing cash owned by the firm net of all
payments, including wages, already made by the firm. In period 2, the firm will generate cash flow
of C2. To approximate the situation faced by large publicly traded firms in the U.S., all cash flows
are assumed to be non-expropriable.
Prior to period 1, workers and management are assumed to have signed a contract stipulating
that, conditional on continued employment at the firm at period-2, workers will obtain a wage of
W . As our focus is on contract renegotiation, the model does not analyze the ex-ante choice of W
(i.e. prior to period 1) but rather takes it as exogenous.1 For simplicity, we assume that C2 > W ,1The wage, W can be thought of as committed to ex-ante, prior to period 1, when realizations of C1 and C2 are
still uncertain. Then, at period 1 uncertainty is resolved, and parties decide whether to renegotiate the contractbased on the analysis presented in this section. For a similar analysis, as pertains to financial contract renegotiation,
3

so that the firm always has enough funds to pay its wage obligation in period 2.
In addition to their promised wage, workers are owed an amount P in defined pension benefits
in period 2. In period 1, the pension plan is funded by the firm to an amount F , where F can
be either larger or smaller than P . In the latter case, the pension plan is, of course, underfunded.
To capture the fact the firms are required to make mandatory contributions to pensions plans in a
simple manner, we assume that if labor’s pension plan is underfunded in period 1, then in period 2,
after having paid W in wages, the firm must use remaining cash balances to fully fund the pension.
The level of funding at period 2 is then equal to min[C1 + C2 −W + F, P ].
To model the PBGC, we assume that the government guarantees labor’s pension up to an
amount G. Thus, in the event that the pension plan is underfunded and labor does not obtain its
full pension benefits of P , the government will fund the pension plan up to G. We assume that the
pension plan is first funded by the firm’s available cash and only then funded by the government
guarantee. For ease of exposition, we further assume that G ≤ P , so that the pension guarantee
does not cover the full amount owed to labor in pension benefits. Disposing of this assumption
does not change our results at all but increases the number of cases that need to be dealt with.
The timing of events in the model is quite simple. At period 1 management decides whether to
abide by its presigned labor contract or trigger renegotiation with labor.2 If management abides by
the contract and does not trigger renegotiation, the firm reaches period 2 and generates C2 in cash
flow. It then pays out wages W , and funds the pension plan as described above. To the extent that
the pension plan is not fully repaid, the PBGC provides its pension guarantee up to an amount G
as described above. Any remaining cash balances are then dispersed to shareholders.
If management does decides to trigger contract renegotiation, the outcome is based on Nash
bargaining, with management assumed to have bargaining power µ. As in Hart and Moore 1994,
we assume that management has human capital which is crucial for the ongoing success of the
project. Management can therefore threaten to withdraw this human capital, liquidate the firm,
and dump the pension plan in order to extract concessions from labor.3 Thus, in attempting to
see Benmelech and Bergman, 2008.2We assume that management cannot pay out a dividend until the end of period 2. The model’s main results are
qualitatively unchanged without this assumption.3Alternatively, one can assume that negotiation takes the firm of an alternating offer bargaining game, where during
negotiation, firms continuation prospects continuously decline. The Nash bargaining outcome then corresponds tothe subgame perfect equilibrium of the alternating offer game. Thus, when the payoffs to initiating the alternatingoffer game are higher than those of abiding by the contract, triggering negotiation is indeed a credible threat ofmanagement. For an analysis along these lines see Benmelech and Bergman, 2008.
4

renegotiate the labor contract, management is in essence threatening labor with the firm’s demise,
and with it, the inability of the firm to pay wages and pension benefits. Labor’s (off-equilibrium
path) outside option in bargaining will then be determined solely by the available free cash flow and
pension funding at period 1 (C1 and F , respectively) as well as by the size of the PBGC pension
guarantee, G. As an alternate assumption one can assume that the firm can threaten labor that
it will dump the pension plan, but that in doing so, the firm need not necessarily be liquidated.
However, with such an assumption there must be an exogenous cost in terms of period-2 cash flow
of such dumping the pension plan onto the PBGC. This cost could be thought of as a loss of firm
reputation and an increased need in monitoring workers.
B. Contract Renegotiation, Pension Underfunding, and Pension Guarantees
In this section we solve for the equilibrium of the game described above. To do so, we analyze
under what conditions management decides to trigger renegotiation. Consider the following cases:
I. P ≤ C1 + F :
Under this scenario, pension underfunding (P − F ) is smaller than the period-1 cash balances
of the firm. Thus, even if the firm is liquidated, labor obtains its full promised commitment of
P . Management then obtains the difference C1 + F − P . While these two values represent the
respective outside options of the two parties, the surplus from continuing to period 2 is C2. Thus,
conditional on management triggering renegotiation, labor obtains P+(1−µ)C2. Since management
needs to pay labor P +W if it abides by the contract, it will prefer to trigger renegotiation when
(1 − µ)C2 < W . Put differently, if C2 is too high, management prefers to abide by the contract,
since labor obtains a relatively high fraction of the continuation rents. Importantly, in this region
(i.e. when P < C1 + F ) the payoff to labor is independent of changes in the degree of pension
funding, F . If management abides by the contract, labor is paid in full, while if management
renegotiates pension funding is irrelevant since (1) labor’s outside option is to obtain full payment
on its pension and (2) the surplus, C2, is also independent of funding status.
Lemma 1. If P ≤ C1 + F , renegotiation occurs only when (1− µ)C2 < W and labor payoffs are
independent of pension funding F .
5
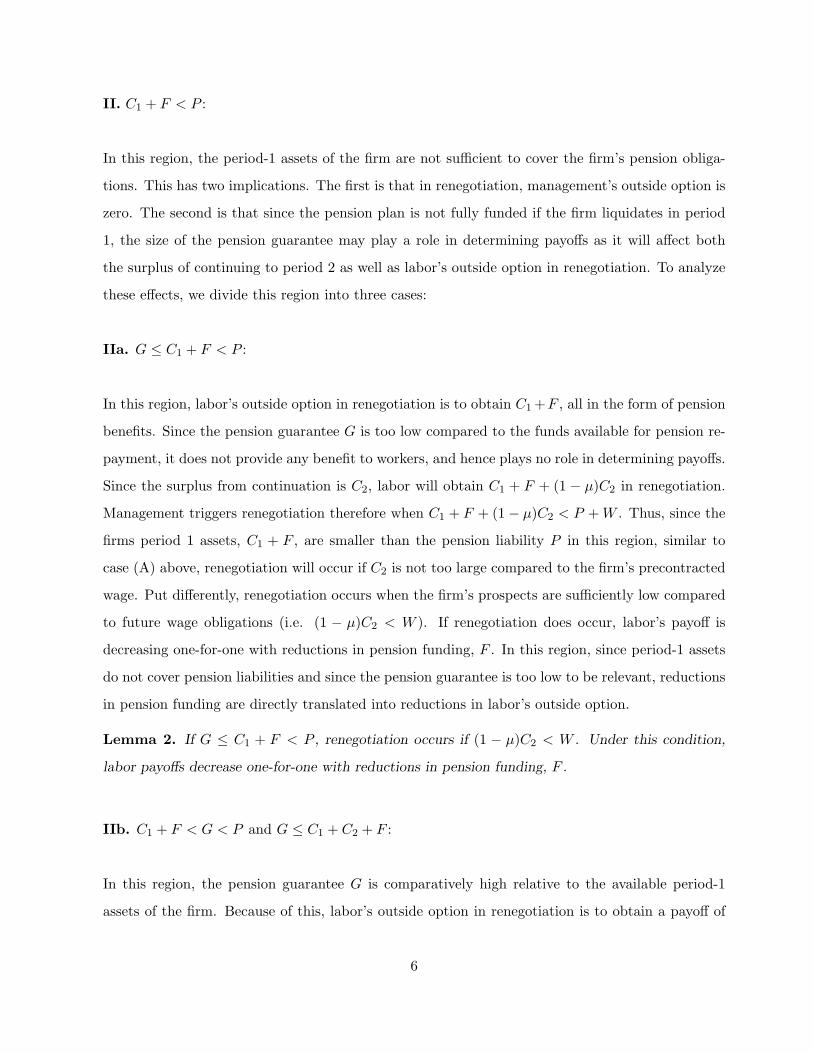
II. C1 + F < P :
In this region, the period-1 assets of the firm are not sufficient to cover the firm’s pension obliga-
tions. This has two implications. The first is that in renegotiation, management’s outside option is
zero. The second is that since the pension plan is not fully funded if the firm liquidates in period
1, the size of the pension guarantee may play a role in determining payoffs as it will affect both
the surplus of continuing to period 2 as well as labor’s outside option in renegotiation. To analyze
these effects, we divide this region into three cases:
IIa. G ≤ C1 + F < P :
In this region, labor’s outside option in renegotiation is to obtain C1 +F , all in the form of pension
benefits. Since the pension guarantee G is too low compared to the funds available for pension re-
payment, it does not provide any benefit to workers, and hence plays no role in determining payoffs.
Since the surplus from continuation is C2, labor will obtain C1 + F + (1 − µ)C2 in renegotiation.
Management triggers renegotiation therefore when C1 + F + (1− µ)C2 < P +W . Thus, since the
firms period 1 assets, C1 + F , are smaller than the pension liability P in this region, similar to
case (A) above, renegotiation will occur if C2 is not too large compared to the firm’s precontracted
wage. Put differently, renegotiation occurs when the firm’s prospects are sufficiently low compared
to future wage obligations (i.e. (1 − µ)C2 < W ). If renegotiation does occur, labor’s payoff is
decreasing one-for-one with reductions in pension funding, F . In this region, since period-1 assets
do not cover pension liabilities and since the pension guarantee is too low to be relevant, reductions
in pension funding are directly translated into reductions in labor’s outside option.
Lemma 2. If G ≤ C1 + F < P , renegotiation occurs if (1 − µ)C2 < W . Under this condition,
labor payoffs decrease one-for-one with reductions in pension funding, F .
IIb. C1 + F < G < P and G ≤ C1 + C2 + F :
In this region, the pension guarantee G is comparatively high relative to the available period-1
assets of the firm. Because of this, labor’s outside option in renegotiation is to obtain a payoff of
6

G: The firm’s period-1 assets do not cover its pension liabilities, implying that the PBGC funds
the difference between G and C1 + F . Further, because of the government intervention, and in
contrast to prior cases, the surplus from continuation to period-2 is now C1 +C2 +F −G. Thus, if
management triggers renegotiation, labor obtains G+ (1−µ)(C1 +C2 +F −G). Management will
decide to trigger renegotiation when G+ (1− µ)(C1 +C2 + F −G) < P +W . As in prior cases, a
sufficient condition for renegotiation to occur is (1− µ)C2 < W – i.e. that the firm’s prospects are
sufficiently poor compared to its obligations to labor.
If renegotiation does occur, reductions in pension funding reduce labor’s payoff, but less than
one-for-one. Indeed, as can easily be seen, a dollar reduction in funding, reduces labor’s ultimate
payoff by only 1 − µ. This is due to the effect of the pension guarantee. Since the guarantee is
sufficiently large, labor’s outside option in renegotiation is fixed at G and protected from declines
in pension funding, F . Still, a decline in F reduces the surplus from continuation to period 2, and
labor bears a fraction (1− µ) of this reduction.
Lemma 3. If C1 + F < G < P and G ≤ C1 +C2 + F , renegotiation occurs when (1− µ)C2 < W .
Under this condition, labor payoffs decrease by (1−µ) for every unit reduction in pension funding, F .
IIc. C1 + F < G < P and G > C1 + C2 + F :
In this region there is no surplus from continuing to period 2. Regardless of whether the firm
liquidates in period 1 or period 2, labor obtains its pension guarantee of G and management obtains
zero. Although continuing to period 2 is socially efficient in that it allows the firm to generate C2
in cash flow and hence reduces the bill that the PGBC needs to pay, neither management nor labor
have any incentive in doing so. This distortion of incentives is, of course, the cost of the PBGC
intervention.
Lemma 4. If C1 + F < G < P and G > C1 + C2 + F , the firm liquidates in period 1 and labor
obtains G.
Combining Lemmas 1 through 3 provides the following three predictions:
Prediction 1. All else equal, the ability of management to extract concessions from labor in
contract renegotiation is decreasing in the strength of a firm’s financial position as proxied by firm
7
current and future cash flows as well as its level of pension funding.
Prediction 2. If a firm’s financial position is sufficiently poor to extract concessions from labor
in renegotiation, all else equal, increases in pension underfunding will reduce labor payoffs.
Prediction 3. The sensitivity of post-renegotiation labor payoffs to pension underfunding will be
greatest amongst pension plans where the PBGC guarantee is relatively small compared to the
pension obligations.
III. Labor Negotiations and Pension Dumping in Delta Airlines:A Case Study
In this section, we briefly describe the negotiations between Delta Air Lines and the approximately
9000 pilots represented by the Air Line Pilots Association (ALPA) that took place from 2003 until
late 2006. We argue that Delta’s ability to obtain large wage concessions from its pilots (and from
its workers in general) was largely due to their highly underfunded defined benefit pension, which
implied that pension termination meant billions of dollars in potential losses for pilots.
A. The Prolonged First Negotiation
In July, 2001, just two months before the September 11 attacks, Delta and ALPA’s pilots signed
an agreement that would make Delta’s pilots the highest paid in the industry. The contract was
signed for five years and included annual wage increases of 4.5% in the years to come. However,
as a result of the deterioration in the industry, in April 2003 Delta asked ALPA for among other
things, a 22% cut in pilots’ hourly wages and the cancellation of the 4.5% annual raises due on
May 2003 and 2004. Delta executives argued that this cut was necessary for the airline to remain
competitive, especially since its two largest competitors, American Airlines and United Airlines,
recently obtained considerable wage concessions from their labor unions.
Delta was in a tough position: having a much stronger balance sheet than its rivals, it was harder
to wring concessions the company says it needs from its workers. Indeed, the pilots considered
Delta’s demand as an insult, especially since at the same time the firm had set aside $45 million in
cash to create a special fund to secure the pensions of 35 managers if the airline should be forced to
declare bankruptcy. Furthermore, the airline planned to spend an additional $20 million to preserve
8

the fund. Meanwhile, the pension funds for the rest of Deltas employees were underfunded by as
much as $4.9 billion.
By December 2003, ALPA was offering a 9% pay cut plus the cancellation of the 4.5% increase
due on May 2004, but this offer was rejected by Delta’s management. Six months passed with little
negotiation, but by June 2004 Delta was already asking for a 30% pay cut and changes in work
rules that would add up to a 45% reduction in pilots’ compensation – a cutback that was valued at
$900 million a year. The pilots responded to this new proposal by increasing their counteroffer offer
to an 18.5% pay cut plus the cancellation of the 2004 wage raises (which added up to a 23% wage
cut), representing up to $705 million a year in cost reductions. In return, ALPA wanted a stake
in the company and board representation. Delta rejected this new proposal too and by the end of
July, increased its pay cut demand to 35%, five percentage points up from the cut they proposed
a couple of weeks earlier. This increased the concessions Delta was asking from its pilots to $1.02
billion a year. Furthermore, in this new proposal, Delta asked the pilots union for new pension plan
changes which, according to Delta’s CEO, were “...designed to achieve viability, preserve accrued
benefits and provide a sustainable pension plan going forward.” He added that: “Delta’s objective
was to maintain its ability to fund the pilotss pension plan.” The CEO also added that Delta was
closely watching the United Airlines bankruptcy case, “because what happens there could have
far-reaching effects throughout our industry.”
One of the main and most valued clauses on the pilots contract with Delta allowed retiring
pilots to get 50% of their vested pension benefits as a lump-sum payment, obtaining the other half
as an annuity. Given the potential termination of the pilots plan, eligible Delta’s pilots started
retiring early in order to secure the lump-sum payment. This practice began causing both financial
and technical problems for the airline, which was concerned that the early retirements would cause
its large aircraft fleet to be grounded for the holiday season. In order to solve this issue, the two
parties reached an agreement in September in which ALPA agreed to solve the staffing problems in
exchange for a pledge to: “leave the pilots retirement plan intact for the next four months, whether
or not it seeks bankruptcy protection.” The pilots were upset by the proposal to freeze the plan
and replace it with a 401(k) plan.
In November 10, 2004, ALPA approved a 32.5% wage cut, changes to work rules that increased
the amount of flying pilots are required to do and a switch to a cheaper retirement plan for younger
pilots. Additionally, the deal doubled the amount of flying Delta could shift to regional units.
9

Finally, the pilots pension plan was to be frozen. In return for the concessions, Delta awarded
the group options for 30 million shares plus future profit sharing and other incentives. Delta also
announced that starting January 2005, it was imposing a 10% wage cut on its nonunion workers.
B. The Second Negotiation
Only four weeks after the $1 billion agreement, Delta’s management asked its pilots for further
concessions. At the same time the airline’s defined benefit pension plans were underfunded by
about $3.3 billion, which required sizeable manadatory contributions in the years to come.
In the following months, Delta unsuccessfully continued to seek additional concessions from its
pilots, resulting in the airline filing for Chapter 11 on September 15, 2005. As soon as it filed for
bankruptcy, Delta announced pay cuts of up to 15% for its nonunion workers and executives and
presented its unionized pilots with a new wage and benefits proposal calling for annual concessions
of approximately $325 million which included a 20% pay cut. Furthermore, Delta was seeking the
bankruptcy court’s permission to stop contributing to its pilots’ pension fund and to stop payments
to retirees. On October 17, 2005 Delta was allowed to stop payments to retirees and to stop the
lump-sum payments to new retirees. Still, Delta was forced to continue making payments to the
pilots’ pension fund. By this time, Delta’s pilots were highly concerned that the carrier could opt
to terminate their defined benefit plan. These concerns led ALPA to agree to re-open negotiations
with Delta. The union was afraid that a bankruptcy-negotiated intervention would result in deeper
concessions and the almost certain termination of their pension plan, similar to what had transpired
in both the United Airlines and the US Airways’ cases. PBGC estimated that Delta’s total pension
obligations were underfunded by $10.6 billion, while Delta’s accountants estimated it to be $6.4
billion. At the end of the year, Delta reported to the PBGC that its defined benefit pension plans
were underfunded by $4.6 billion.
The union rejected Delta’s concessions demand and called pilots to vote on a strike. Delta
then offered the union to lower the pay reduction portion of its concessions proposal from 19.5%
to 19.0%, but at the same time introduced other changes that would actually increase the value of
the concessions to $325.2 million. A few days before, in its SEC filing, Delta said that they: “can’t
predict whether its defined benefit pension plan will continue when it emerges from Chapter 11.”
Delta pilots tried without success to get the company to continue making certain contributions to
the pension plan during the bankruptcy case.
10
In response to Delta’s offer, ALPA offered a 9.0% pay cut and other concessions worth more
than $90 million annually. Since the talks were not advancing as Delta wished, the airline filed a
Section 1113 motion to void the pilots’ contract.ALPA responded by further increasing the threat
of a pilots’ strike. The central issue in these talks was the future of the pilots’ pension plan. During
a hearing at the bankruptcy court, ALPA’s lawyer shouted to Delta’s attorney: “we’ll go out in the
hall and get a deal if the airline would guarantee it would not terminate the pilot’s pension plan.”
Delta’s attorney argued that the company could not make a decision on its pension plans until it
knew the outcome of pending legislation that would have spread its huge pension fund obligations
over 20 years.
In the end, both sides agreed on temporary pay cuts worth around $152 million a year, less
than half of what Delta was looking for, which included a 14% wage cut for pilots. Nevertheless,
the fate of the pension plan remained an issue. ALPA wanted Delta to add to the agreement the
amount the airline had not paid to the pilots’ pension plan since filing for bankruptcy. As the
union’s spokesman said: “They were trying to pocket the money they weren’t contributing to the
defined benefit pension plan. I believe this (agreement) has forced their hand and they’re going to
have to address it with us.” The union’s spokesmen said Delta missed a $145 million in qualified
pension contributions on October 15. At the same time, a Delta’s spokeswomen said: “We will
continue to work together with ALPA and Delta active and retired employees to try to save Delta’s
pension plan”.
On March 2006, Delta asked its pilots for additional concessions worth $305 million a year for
four years, including a 18% pay cut. ALPA’s counteroffer included concessions for $140 million
a year, while asking for a $1 billion note from Delta in case their pension plan was terminated .
For the first time, Delta executives told the pilots that it was likely the firm would terminate their
pension plan.
In June, Delta Pilots ratified a 3.5 year agreement on concessions that implied savings of $280
million a year with a 14% wage cut. Additionally, the new contract paved the way for Delta to
seek termination of the pilots’ pension plan. Delta promised the union a $650 million payment and
a $2.1 billion claim convertible into a yet-to-be-determined stake in the reorganized Delta. The
agreement was to reduce average pilot pay from $151,000 to just under $130,000 a year. Delta’s
CEO said that Delta had no plans to ask its pilots for a third pay cut.
11
C. The Pilots Plan Termination
On the first day of September, 2006, Delta asked the bankruptcy judge to let it terminate the pilots
plan and to transfer its liabilities to the PBGC. The judge ruled on September 6th that Delta could
terminate the plan, allowing it to avoid about $3 billion in payments needed to bring the plan to
full funding. Delta handed in $1.7 billion in assets to PBGC to cover more than $4.7 billion in
benefit liabilities. PBGC estimated that it was going to be liable for $920 million out of the $3
billion underfunding, which would result in a loss of more than $2 billion for the ALPA pilots.
Jim Cochran, a retired Boeing 767 captain, expected bad news when he got the big white
envelope from Delta Air Lines. What he found inside was worse. The retired captain said he
expected his $2,460-a-month pension to shrink by about 70 percent after Delta won bankruptcy
court approval to terminate its pilot pension plan. His benefit had already dropped by more than
$3,000 a year when Delta cut part of the program after entering Chapter 11 a little more than a
year ago. But Cochran saw two things when he opened the envelope. One was a letter from Delta
telling him that as of Oct. 1 his benefit would be zero. The other: coupons to begin paying Delta
$907 a month for his familys health insurance, since he no longer had a pension check from which
to deduct it.
IV. Data and Summary Statistics
This section describes how our sample is constructed and displays summary statistics for the main
variables in our analysis.
A. Sample Construction
We use two main data sources to construct our sample: (1) the Bureau of Transportation Statistics
(BTS) data on individual airlines, and (ii) data on airlines’ pension plans from the Department of
Labor’s form 5500. We also supplement these data with information from Compustat and SDC.
A.1 Calculating Average Wages
Using the Air Carrier Financial Reports (Form 41 Financial Data) from the BTS, we obtain financial
information as well as detailed data on airline employees and their compensation for large U.S.
certified air carriers. In particular, we obtain data on the number of employees, and their wages
12

and benefits by job type. We also obtain average industry data from the BTS on average aircraft
fuel cost for airlines and industry profitability.
We use Schedule P-6 from the BTS’s Form 41 to obtain detailed information on wages for differ-
ent job categories in airlines. Schedule P-6 provides operating expenses for air carriers with annual
operating revenues of at least $20 million. The different job categories for which wage information
is available are: (1) General Management Personnel; (2) Flight Personnel; (3) Maintenance Labor;
(4) Aircraft and Traffic Handling Personnel; and, (5) Other Personnel.4
While the focus of our analysis is on wages, we are also interested in other forms of compensation
such as fringe benefits. We obtain total fringe benefits for each airline From Schedule P-6.5
Next, we use the Air Carrier Employees database from BTS to calculate the number of employees
in each job category for every airline. In particular, we use the Annual Employee Statistics by
Labor Category (Schedule P-10 from BTS’s Form 41) which includes detailed data on the number
of employees per job category for the years 1990 to 2007. There are 15 different categories that
group together employees with closely related jobs. Since the wage data described above divides
employees into only six different job groups, we group the 15 employee categories to match the
wage groups by using BTS’s Employment Categories Descriptions.6
For each of these 6 job categories we divide total wages of the group by the number of employees
in that group to obtain the average wage per employee in each job category. Similarly, we calculate
average benefits in those job categories for which information on benefits is available. As a result, we
have information on wages per employee for the airline as a whole and for each of the following job
groups: (1) Pilots; (2) Flight Attendants; (3) Mechanics & Maintenance; (4) Traffic and Handling;
(5) General Management; and, (6) Other. We also obtain average benefits at the airline level for:
(1) Pilots; and, (2) Flight Attendants. Finally, we calculate the annual percent change in wages
per employee, as well as the dollar change for each group. Similarly, we calculate annual percent4While these data group pilots, copilots, flight engineers and flight attendants in a single category, we supplement
these data wit information from Schedule P-52 which contains operating expenses for each aircraft type for everycarrier. By adding across aircraft types for every airline, we construct an aggregated figure for Pilots’ wages. We thensubtract the Pilots’ wages from the aggregate Flight Personnel’s wages figure from Schedule P-6 and obtain FlightAttendants’ wages.
5This figure for total benefits is the sum of personnel expenses, employee benefits and pensions, and payroll taxes.Unfortunately, unlike wages this data is only available at an aggregate level. Since we are interested in the benefitsreceived by the workers in particular job categories, we use of data from other schedules in BTS’s Form 41 to calculatethe level of benefits given to Pilots and to Flight Attendants which the only two groups for which information isdetailed enough.
6We provide detailed Job groups and categories in Appendix A.
13
and dollar changes in benefits per employee.
A.2 Airline Financial Data
We continue by collecting earnings data from BTS Form 41’s Schedule P-12. We define profitability
as income before discontinued operations and extraordinary items plus depreciation and amorti-
zation divided by total assets. Using balance sheet data from BTS Form 41’s Schedule B-1, we
calculate leverage as total current liabilities plus long-term debt divided by total assets. Finally,
using Compustat data we construct yearly airline market-to-book ratios.7
A.3 Pension Plans Data
We obtain available data on all defined benefit pension plans covering employees of US airlines.
All firms with pension plans for their workers have to file Form 5500 with the IRS for each plan.
Using all fillings of Form 5500 in the years 1992 to 2006, we identify all defined benefit plans that
have 100 or more active participants in the airline industry, and that are sponsored by a single
employer.8 We calculate the level of plan underfunding by subtracting the total assets the plan has
from the current liability of the total benefits due to all plan participants.9 We define a dummy
variable for plan underfunding, which will take a value of 1 if a plan has any level of underfunding,
and 0 otherwise. As we are also interested in analyzing the effect of deep underfunding. We
define underfunding dummies for underfunding levels larger than 10%, 15% and 25% of plan assets.
Appendix A provides further details on the construction of these variables.
We continue by matching each defined benefit pension plan in our sample with a job group or
groups from the BTS data. In most cases, the match is straightforward since the plan includes
the craft in its name (Pilots, Flight Attendants, Mechanics, etc.).10 A second category is one in
which some pension plans are linked to a specific labor union. In these cases, we analyze which
of the airline’s crafts (out of the 6 final job groups we have) are covered by this specific union7We cannot construct market-to-book for airline-year observations in which airlines are not publicly traded firms.8This last filter is important since in multi-employer plans it is not clear which firm actually carries out the labor
negotiations. Although this distinction is theoretically important, in the case of the airlines for which we have BTSand market-to-book data, the great majority of their defined benefit pension plans are single-employer plans.
9There are other measures for the level of assets and for the present value of liabilities a plan has since firms areable to use different accounting methods and actuarial assumptions in their reports. Nevertheless, the measures weuse are common to all firms and are the ones most commonly used by the regulators to measure plan underfunding.
10In this and all the cases described in this paragraph, we check that the number of workers covered by the pensionplan is consistent with the number of workers belonging to the different job groups considered.
14

and we calculate our dependent variables accordingly.11 A third set of plans are specifically for
non-unionized workers, in which case we consider the average wage per employee (and its yearly
% change) for all those job groups that do not have a separate pension plan linked to a union. A
fourth group of plans are “aggregate plans” in the sense that they cover all of the firm’s workers
without craft distinction.12 In these cases, we use the average wage per employee and average
benefits per employee for the firm as a whole (and then calculate their yearly percent change).
Finally, some airlines have only two plans: one for Pilots and the other for the rest of employees.
Thus, a fifth set of plans are specifically for Non-Pilots, in which case we estimate our dependent
variables considering all job groups together with the exception of Pilots.
Matching the BTS and the Form 5500 data, and restricting our sample to plans that have at least
two observations, we end up with 559 plan-year observations corresponding to 14 different firms.13
Out of the 559 plan-year observations, 482 plan-year observations representing 12 airlines have
market-to-book data. This constitutes our sample. The 12 airlines in our sample for which we have
market-to-book data are: Alaska Airlines, American Airlines, Continental Airlines, Delta Airlines,
Federal Express, Hawaiian Airlines, Midwest Airlines, Northwest Airlines, Trans World Airlines,
United Airlines, United Parcel Services and US Airways.14 Finally, we winsorized our dependent
variable at the 0.5th and 99.5th percentiles (0.5% per tail) and also exclude observations with a
value for Market-to-Book or Leverage that are more than four standard deviations away from their
corresponding means. This results in dropping six observations to a sample size of 476 plan-year
observations.
B. Data Characteristics and Summary Statistics
Panel A of Table 2 provides summary statistics on wages and benefits of the airline employees
that are in our sample. Wages and benefits account for a large share of airlines’ expenses. Wages
account on average for 23.4% (median 24.0%) of operating revenues for the airlines in our sample,11For example, if a union covers both Flight Attendants and Mechanics within an airline, the average wage is
calculated as: The sum of wages given to Flight Attendants and to Mechanics over the number of employees thatbelong to the Flight Attendants and to the Mechanics employee groups. We then calculate the annual % change inwages per employee for this ”enlarged” group within the airline.
12Some firms have an aggregate plan on top of their craft plans, while other have only aggregate plans for theirworkers (as it is the case with United Parcel Services and Federal Express).
13There are three small airlines (Astar Air Cargo, Markair Inc. and ABX Air), for which the available data onlyallows us to build a single observation per plan and hence they are excluded from the sample as most of our empiricalspecifications include either firm or plan fixed effects.
14Aloha Airlines and Shuttle Inc are dropped as they do not have market-to-book data.
15
while benefits account for 8.7% on average (median 8.6%). There is a large dispersion in average
wages across different employees groups. While the average wage across all employees is $68,729 a
year, pilots earn on average $120,639, flight attendants mean wage is $33,230, and mechanics earn
an average of $52,232 a year. Average benefits across all employees is $36,248 per year, where pilots
receive $50,355 on average compared to average benefits of $23,112 for flight attendants.15
Panel A of Table 2 also provide summary statistics on the % annual change in average wages
for each employee group which we use as our dependent variables in the regressions analyses. As
Panel A shows the average annual increase in wages per employee in our sample across all employee
types is 3.5% (median 3.2%). The standard deviation of 13.0%, points to the high variability in
annual wage adjustments for most job groups. The mean annual % change in benefits per employee
is 7.3% with a standard deviation of 21.4%. As these figures indicate, benefits are considerably
more volatile than wages.
Panel B of Table 1 provides summary statistics for the explanatory variables used in our re-
gressions. Starting with the underfunding dummy variables, Panel B demonstrates that on average
54.7% of the plan-year observations show some level of underfunding, while 38.5%, 33.6% and 22.4%
of the plans are underfunded by at least 10%, 15% and 25% of the plan’s total assets, respectively.
The mean size (total assets) of an airline in our sample is $9.4 billion, and the average market-to-
book ratio, leverage ratio and profitability are 1.25, 0.59 and 3.08%, respectively.16 About 16.0% of
our plan-year observations are linked to an airline in Chapter-11. We also define a low profitability
dummy that takes the value of 1 for airlines below the 33th percentile of the profitability measure
which is 1.14%. Thus the low profitability dummy takes a value of 1 if annual profitability is
lower than 1.14%, and 0 otherwise (our analysis is robust to other definitions of low profitability).
Finally, 44.7% of the observations have an average wage per employee that is larger than 1.5 times
the maximum annual guaranty offered by the PBGC for that year, and 35.4% earn more than twice
the PBGC maximum guarantee.17
15Employee groups other than Pilots and Flight Attendants also receive benefits, which are reflected on the totalbenefits per employee of the firm as a whole. However, the available data only allows us to breakdown benefits peremployee for Pilots and Flight Attendants as individual job groups.
16Note that these averages are based on plan-year observations and hence the data is weighted by plan-yearobservations per airline.
17The benchmark annual guaranty used on this calculation is for a worker that retires at age 65. See below as wellas Table 2 for a more detailed description of the PBGC maximum guaranty.
16
V. Empirical Strategy
The wage structure of the airline industry and in particular the clear distinction between highly
paid job categories and lower paid airline employees, combined with the financial difficulties and
frequent bankruptcy filing of air carriers make the airline industry an almost ideal setting to test
the relation between financial distress and labor negotiations. Furthermore, most of the legacy
carriers in the U.S. are highly unionized and have traditionally offered defined-benefits pension to
their employees. This enables us to study the strategic use of underfunded defined benefits pension
plans in wage and benefits renegotiation. The rest of this section describes the advantages of the
BTS data in reducing measurement error as well as the identification strategy of our empirical
analysis.
A. Measurement Error
The BTS data provides detailed information on aggregate wages and number of employees in
different job categories which enable us to calculate the average wage in each of these job groups.
These data are a major improvement over the wages data that is available in other data sets.
For example, Compustat data is not always available for total wages as firms can report wages
as a separate item or – as many firm choose to do – lump wages with other expenses as part of
Selling, General and Administration (SG&A). Moreover, even for the firms that actually report
wages separately, the Compustat data is an aggregate of all wages in the firm, while the BTS
data provides intra-firm data that enable us to match wages to group-specific pension plans and to
control for airline and plan fixed-effects.
B. Identification
Our identification strategy is twofold. We first show that airlines are more likely to obtain wage
concessions when the airline is financially constrained (measured by either having low profitability or
being in bankruptcy) and when the pension plan is underfunded. That is, we interact the financial
position of an airline and the funding status of the relevant pension plan to determine whether
employees that are exposed to the risk of losing their pension are more willing to make concessions.
This approach allows us to focus on the plan level and use the variation in underfunding status of
different plans; We can therefore control for either firm or plan fixed effects to identify off of within
airline or within plan variation, exploiting both the cross-sectional dispersion at the plan level as
17

well as the time-series variation in their underfunding status.
Clearly, both airline financial position and plan underfunding are endogenous and likely to be
jointly driven by the airline’s financial distress. However, by using an interaction term we can limit
the number of alternative explanations that may drive our results. For example, an airline level
financial shock cannot solely explain differential wage concessions across different employee groups,
while our mechanism is based on the difference in the underfunding of their corresponding pension
plans.
The second layer of our identification strategy is to exploit the maximum pension guaranty
set exogenously by the PBGC. The Pension Benefit Guaranty Corporation is responsible to pay
monthly benefits to retirees of underfunded terminated pension plans. However, the PBGC guar-
antee is limited. The maximum annual guarantee is a function of age and hence is identical for
employees of the same age regardless of their education, skills or current wages. Table 2 reports
the maximum annual amounts covered by the PBGC for workers retiring in the years 1992 to 2006.
Four different employee ages at the time of retirement are shown: 50, 55, 60 and 65 years. As can
be seen, the maximum amount guaranteed increases over time and with the age of the worker at
time of retirement. The differences can be substantial: a worker that retired in 1992 at age 60
would have had an annual maximum guaranty that represents only 38.5% of that received by a
65-year-old worker that retired in 2006 ($18,348 vs. $47,659 a year). Throughout our sample, the
average maximum guaranty for a retiring 60-year-old worker is $24,224 while that for a 65-year-old
is $37,268.
Figure 1 displays average wages for different employee groups relative to the PBGC maximum
at different retirement ages. Given that the PBGC limit is set by law exogenously, we use the
distance between current wages of different airline’s employee groups and the PBGC maximum
limit to measure the amount these employees stand to lose if the pension plan will be terminated.
Thus, for employees whose earnings exceed the PBGC limit, termination of the pension plan is more
costly and hence the airline can use this to pressure them to make concessions. As an example,
the average wage of a pilot in our sample is about five times the PBGC limit for a 60 years old
retiree, and the average mechanic wage is more than twice the PBGC limit for the same age. In
contrast, the average wages of flight attendants, and traffic and handling workers are higher that
the PBGC limit by only only 40% and 60%, respectively. We exploit the high dispersion between
average wages and the PBGC limit within an airline to identify the bargaining power of the airlines
18

vis-a-vis specific employee groups. This approach is consistent with Brown’s (2008) assertion that
“[t]he maximum insurance benefit is set by law. While more than 90 percent of participants in plans
taken over by the PBGC fall below this benefit limit, in some prominent cases, including those of
some airline pilots, worker lose a substantial fraction of their promised retirement income.”18
Econometrically we identify the effect of pension underfunding on wage concessions using a
triple-difference or DDD specification, as there are three levels of differences: (i) financially con-
strained vs. less-financially constrained airlines, (ii) underfunded pension plans vs. funded plans,
and (iii) wages exceeding vs. those that are below the PBGC limit. This approach is common in
applied microeconomics (see for example Gruber (1994)), and has became more popular recently
in corporate finance applications as well (Rauh (2006)).
VI. Wages and Underfunded Pensions
This section presents the results from regression analysis of wage renegotiation. We begin with a
simple test of the relation between underfunded defined benefits pension plans and wage negotia-
tions by estimating different variants of the following baseline specification:
%∆(wages/employees)a,i,t = β1 × low profitabilitya,i,t + β2 × underfundinga,i,t
+ β12 × (low profitabilitya,i,t × underfundinga,i,t)
+ baγ + ciδ + dtθ + Xa,tλ+ εa,i,t, (1)
where %∆(wages/employees) is the annual percent change in the average per-employee wage of an
employee groups within an airline for that year. Subscripts indicate airline (a), employee group (i),
and year (t), low pofitability is is a dummy variable that equals one if airline cash flow is below the
33rd percentile of operating cash flow,19 underfunding is a dummy variable that equals to one for
underfunded pension plans, ba is a vector of airline fixed-effects, ci is a vector of employee group
fixed-effects, dt is a vector of year fixed-effects, Xa,i,t is a vector of airline controls that includes
size (log book value of assets), leverage ratio, and market-to-book ratio, and εa,i,t is the regression
residual.
We report the results from estimating different variants of regression 1 in the first three columns
of Table 4. Tables throughout the paper report regressions coefficients and standard errors that18Brown (2008) p. 184.19Our results are not sensitive to this definition, we obtain similar results if we define low cash flow as airlines with
non-positive earnings as in Benmelech and Bergman (2009).
19

are clustered at the airline level (in parentheses). Our main coefficient of interest is β12 which
captures the joint effect of financial distress at the airline level and the underfunding of the specific
pension plan of an employee group within the airline on wage concessions made by members of that
employee group. As Table 4 demonstrates, we find that distressed airlines obtain wage concessions
from the employee groups whose pension plans are underfunded. While the coefficients of both
low profitability and underfunding are negative they are not statistically different from zero. Our
results hold after controlling for airline controls, year fixed effects and either airline and plan fixed
effects. It is important to note that we cannot control for both airline and plan fixed-effects at the
same time as employee groups by definition belong to one airline. The estimates of β12 are between
-3.4% and -4.2% suggesting that airlines obtain an average wage concession which is around 4% of
the annual average wage when both cash flow is low and pension plan underfunded.
We conduct similar analysis to measure the effect of the interaction between bankruptcy and
pension underfunding on wage concessions. We define a dummy variable that equals one for airlines
that are in Chapter-11 during a given year.20 We test the relation between bankruptcy, pension
underfunding and wages using the following baseline regression:
%∆(wages/employees)a,i,t = β1 × bankruptcya,i,t + β2 × underfundinga,i,t
+ β12 × (bankruptcya,i,t × underfundinga,i,t)
+ baγ + ciδ + dtθ + Xa,tλ+ εa,i,t, (2)
Where bankruptcya,i,t is a dummy for airline-bankruptcy years and the vector Xa,i,t include prof-
itability as control in addition to size, leverage, and market-to-book. The rest of the variables are
defined as in 2. The results for the bankruptcy regressions are reported in the last three columns of
Table 4. As expected, we find that higher profitability is related to wage increases in two out of the
three specifications. While we find that average wages decline by between 7.2% and 10.6% percent
during bankruptcy years, the interaction between bankruptcy and underfunding is not statistically
significant in any of the three regressions presented in the table.
We augment the analysis of the bankruptcy regressions by splitting our data into two subsam-
ples; before and after the events of September 2001. We do this since most of the bankruptcies in
our data took place post 9/11 and may represent a different regime in which airlines might have
found it easier to terminate defined benefits pension plans in Chapter-11 reorganizations.20None of the airlines in the sample filed for chapter-7.
20

Table 5 presents the results from estimating regression 2 during the 1992-2001 and 2002-2006
separately. As the first three columns of the table show, and consistent with the results in Table 4,
the coefficient on the bankruptcy dummy is significant both economically and statistically during
the 1992-2001 period, implying that airlines obtain wage concessions that are between 11.9% and
24.3% of the previous year’s average wage while in bankruptcy. However, during the 1992-2001
there is no evidence that airlines were able to strategically use the threat of pension plan termi-
nation to obtain concessions from their employees; the coefficient on the interaction term between
the bankruptcy and underfunding dummies is either not statistically significant or positive and
significant.
In contrast, the last three regressions presented in Table 5 show that in the 2002-2006 period,
airlines were able to obtain wage concessions from their employees while in bankruptcy only if their
defined benefits pension plans were underfunded. This is illustrated by the fact that while the
coefficient of the bankruptcy dummy is positive and not statistically significant, the interaction
term is statistically significant and ranges between -8.9% and -23.1%.
A. Employees Benefits and Pension Underfunding
We next turn to analyze the effect of pension underfunding on the ability of airlines to negotiate
down employees benefits. In the BTS data benefits are defined as the sum of personnel expenses,
employee benefits and pensions, and payroll taxes. We run regressions similar to regression 1
with percent change in benefits per employee as our dependent variable and report the results in
Table 6. While the coefficients of the interaction terms between low profitability and underfunding
are indeed negative and similar to the wage regressions results reported in Table 4, they are not
statistically significant. In unreported results, we also repeat the analysis using the interaction
between underfunding and bankruptcy and while the coefficient of the interaction term is negative
it is not statistically significant even when we split the sample to the 1992-2001 and 2002-2006
sub-periods. Our results may point to the fact that unions are reluctant to make concessions on
benefits while they are more willing to renegotiate wages.
21
VII. Wages, Pension Underfunding and the PBGC Maximum Guar-antee
The results thus far suggest that wages are more likely to be negotiated down during periods of
financial distress when defined benefits plans are underfunded. Our evidence is consistent with the
notion that airlines are using the threat of pension dumping to extract wage concessions. However,
it is also possible that the main driver of lower wages is the financial deterioration of the airline
which might reflect both financial and economic distress. According to this alternative view, the
specific mechanism does not have to be the threat pension dumping but rather the overall poor
financial position of the firm. While our results indicate that two conditions are needed – both
financial distress and pension underfunding – to facilitate wage concessions, it is also possible to
argue that empirically our interaction term is capturing a severe version of financial distress and
does not necessarily indicate a causal direction of the threat to dump pensions.
A. Differences-in-Differences-in-Differences: Financially Constrained Airlines
In order to identify the causal effect of pension underfunding we exploit the variation in airlines
employees salaries relative to the PBGC maximum annual guarantee using the following baseline
specification:
%∆(wages/employees)a,i,t = β1 × low profitabilitya,i,t + β2 × underfundinga,i,t + β3 × PBGCa,i,t
+ β12 × (low profitabilitya,i,t × underfundinga,i,t)
+ β13 × low profitabilitya,i,t(×PBGCa,i,t)
+ β23 × (underfundinga,i,t × PBGCa,i,t)
+ β123 × (low profitabilitya,i,t × underfundinga,i,t × PBGCa,i,t)
+ baγ + ciδ + dtθ + Xa,tλ+ εa,i,t, (3)
where %∆(wages/employees) is the annual percent change in the average per-employee wage of
one of the employee groups within an airline for that year. Subscripts indicate airline (a), employee
group (i), and year (t), low pofitability is is a dummy variable that equals to one if the the airline
cash flow is below the 33rd percentile of operating cash flow, underfunding is a dummy variable
that equals to one for underfunded pension plans, PBGC is a dummy variable that equals to one if
the average wage is larger than 1.5 times the PBGC annual maximum guarantee, ba is a vector of
22

airline fixed-effects, ci is a vector of employee group fixed-effects, dt is a vector of year fixed-effects,
Xa,i,t is a vector of airline controls that includes size (log book value of assets), leverage ratio, and
market-to-book ratio, and εa,i,t is the regression residual.
The main coefficient in the DDD specification is β123 which identifies the effect of underfunded
pension plans in financially constrained airlines on employees that are not fully covered by the
PBGC maximum guarantee.
As the first three columns of Table 7 show, the DDD estimator β123 is negative and statistically
significant and ranges from -7.4% to -9.5%, implying that airlines that are financially constrained
can negotiate down the wages of their highly-paid employees whose pensions are not fully covered
by the PBGC maximum guarantee. As before, our results are robust to the inclusion of year and
either airline or plan fixed effects in addition to airline controls. In the last three columns of the
table we refine the definition of the underfunding dummy to capture higher level of underfunding.
The DDD estimator is -9.4% and -11.9% when the pension plan is underfunded by at least 10%,
and 15%, respectively. The estimate is negative yet not statistically significant when when the
underfunding dummy is defined as at least 25% underfunding, probably due to the fewer number
of observations that meet this extreme definition of underfunding.
We supplement our analysis by regressing the actual change in average wages (in $ thousands)
instead of the percentage change. Thus we reestimate regression 3 using $∆(wages/employees)a,i,t
as our dependent variable instead of %∆(wages/employees)a,i,t and report the results in Table 8.
The DDD estimator β123 estimates the average amount (in $ thousands) that financially constrained
airlines extract from employees whose average wage exceeds the PBGC limit when their pension
plans are underfunded. As the first three columns of the table show, airlines can strategically
use underfunded pensions to reduce the average wage of some employees by an amount that is
between $11,819 and $13,955 per year. Furthermore, as the fifth columns of Table 8 indicates, an
underfunding level of at least 15% allows airlines to cut the average wage of highly-paid employees
by $17,435 per year.
While the results thus far indicate that airlines with low cash flow can successfully negotiate
down the wages of highly paid employees when their pensions are underfunded, it is possible that
the effect is driven mostly by bankrupt airlines that operate under Chapter-11 protection (see
Table 5). We study the ability of airlines to extract wage concessions outside of bankruptcy by
23

estimating regression 3 by excluding airlines in Chapter-11 from the analysis.21 This results in a
sample size of 402 plan-year observations representing the same 12 airlines and 45 plans. - The
results are reported in Table 9.The estimates of β123 in Table 9 are between -7.3% and -10.5% and
are similar to the estimates in Table 7, indicating that airlines are able to negotiate down wages
outside of bankruptcy. In fact, as we have documented earlier in Delta’s case study, employees
may be willing to make wage concessions in order to avoid Chapter-11 filing by the airline. While
the DDD estimate is negative in two out of the three the last three columns, it lacks statistical
significant since most of the plans that are highly underfunded are those of bankrupt airlines which
are excluded from the analysis in Table 9. As in Table 8 we also provide estimates (in $ thousands)
of actual wage concessions obtained by non-bankrupt financially distressed airlines in Table 10. We
find that average annual wages are reduced by between $8,929 and $10,910 outside of bankruptcy
when the threat to terminate a pension plan is credible. As before, the coefficient of β123 is positive
but not statistically significant when we use the 25% threshold to classify underfunded pension plan
as the most underfunded plans are those of airlines operating under Chapter-11 protection which
are excluded from the sample.
A.1 Robustness tests
One concern with the identification strategy is that the DDD estimator is just picking-up those
employee groups that account for a larger share of the airline wage expenses and hence have larger
margins to make concessions. Our analysis should not be affected by this concern as we identify
the annual percentage change in wages within an employee group, and in addition such an effect
should be captured by the (Wage > 1.5 ∗ PBGC) control rather than by the triple interaction.
Nevertheless, we consider a modified version of regression 3 for robustness. We add as an additional
covariate to the regression –the ratio of the wage of an employee group to overall wage expenses.
For example, we divide the aggregate wages of pilots and co-pilots by the total wage expenses of the
airline. As Table 11 demonstrates, we find that wage share is positively related to percentage change
in wages in specifications that include plan fixed-effects. Furthermore and more importantly, we
find that the DDD estimator is more statistically significant now across our different specifications,
and that the effect is also slightly stronger economically. Thus, our results are not driven by relative
wage shares.21See Benmelech and Bergman (2009) for a similar approach.
24
As an additional robustness test we control for industry conditions in Table 13 and reestimate
regression 3. We construct three aggregate measures of the airline industry: (i) weighted-average
market-to-book, (ii) average fuel cost, and (iii) industry average profitability. Appendix A provides
details on the construction of these variables. Since our measures of industry performance are based
on pure time-series variation we cannot include both year fixed-effects and industry controls jointly.
As Table 13 demonstrates, the inclusion of industry controls (in lieu of year effects) improves the
precision of the DDD estimates which are now always statistically significant at the 1 percent level.
The point estimates are similar to those documented earlier; underfunding pension plans enable
distressed airlines to extract wage concessions that are between 8.6% and 10.8% of the annual
average wage.
Finally, while we do not control for unionization levels, labor unions are important determinants
of wage increases and collective bargaining negotiations (Lewis (1986)). However, our focus on one
particular industry alleviates the concern about the differential effect of unionization on wage
negotiations within our sample for two main reaons. First, air transportation is among the most
unionized industries – according to Hirsch and Macpherson’s estimates 45.1% of the employees in
the air transportation employees were unionized in 2008 – while many of the studies in this field
utilize cross-industry variation in unionization levels. Second, by studying airlines with defined
benefits pension plans we focus on highly unionized airlines within the airline industry.22 Thus,
our results are unlikely to be driven by omitted unionization levels.
While firm-level measures of unionization are not widely available, cross-sections of firms for
the years 1977 and 1987 were derived from surveys of manufacturing firms (Hirsch (1991)). An
additional cross-section for 1999 has been compiled by Eschuk (2001) from company 10-K which
was recently used in Matsa (2009). We follow Eschuk (2001) and read the 10-Ks of every airline
in our sample.23 Some airline report the actual number of their employee that are unionized while
other airlines just mention whether a large share of their employees are unionized or not. We
report the direct share of the employees that are unionized whenever the information is available
in the airline’s 10-K. Otherwise, we use a dummy variable equals to 1 if the airline reports that a
large number of its employees are unionized. As Table 14 demonstrates, most of the airlines in our
sample – with the exception of Delta airlines and Fedex – are highly unionized. Furthermore, the22For example, JetBlue, the prominent example of non-unionized airline has no defined benefits pension plan and
hence is not included in our sample.23Airline 10-Ks are available in Edgar online starting at 1995.
25

level of unionization is very persistent and stays almost constant over time and hence by controlling
for airline or plan fixed-effects we are fully absorbing any differential effect of unionization.
B. Differences-in-Differences-in-Differences: Airlines in Chapter-11
We now turn to analyze the effect of Chapter-11 on wage negotiations using the DDD approach.
Similar to our previous analysis we estimate different specifications of the following baseline regres-
sion:
%∆(wages/employees)a,i,t = β1 × bankruptcya,i,t + β2 × underfundinga,i,t + β3 × PBGCa,i,t
+ β12 × (bankruptcya,i,t × underfundinga,i,t)
+ β13 × (bankruptcya,i,t × PBGCa,i,t)
+ β23 × (underfundinga,i,t × PBGCa,i,t)
+ β123 × (bankruptcya,i,t × underfundinga,i,t × PBGCa,i,t)
+ baγ + ciδ + dtθ + Xa,tλ+ εa,i,t, (4)
As before, we are interested in the DDD coefficient β123 which measures the joint effect of bankruptcy
and underfunding on the wages of employees that are not fully covered by the PBGC maximum
guarantee. We report the results from estimating regression 4 in Table 15. We find that β123 is neg-
ative and between -7.8% and -16.5% in all specifications, however it is not statistically significant
in models that include plan fixed effects. The reason for the lack of statistical significance in the
plan fixed-effect regression is lack of power. There are 74 plan-year observations that correspond
to airlines that are under Chapter-11 protection, and identifying off of the interaction between
these observations with underfunding status and high wages while controlling for plan fixed-effects
results in lower statistical power. When we control for both year and airline fixed effects the DDD
coefficient is -13.0% and is statistically significant at the 5 percent level. Further, we find that high
levels of underfunding lead to deeper wage concessions in bankruptcy; underfunding of at least 15%
of the plan level is associated with average wages that are 16.5% lower. Likewise, underfunding
of at least 25% leads to a 15.2% decline in annual average wage. Our estimates of β123 in the
specifications that use underfunding levels of at least 15% and 25%, respectively, are more negative
and more statistically significant than those in Table 7 since pension plans of bankrupt airlines are
more underfunded than plans of non-bankrupt financially distressed airlines. As before, we also
use the actual change in average wages (in $ thousands) instead of the percentage change as a
26

dependent variable and report the results in Table 16. The average amount (in $ thousands) that
bankrupt airlines extract from employees whose average wage exceeds the PBGC limit when their
pension plans are underfunded is between $14,419 and $22,732 per year. As in Table 15, the DDD
estimate is statistically significant only in a few specifications but implies large dollar amounts of
concessions per employee.
Finally and as in Table 13, we include three measures of industry conditions in lieu of year fixed
effects in regression 4 and report the results in Table 17. Our results are robust to the inclusion of
industry variables with airline fixed-effects, and β123 ranges between -11.8% and -13.1%.
VIII. Conclusion
In this paper we analyze both theoretically and empirically airlines’ renegotiations of labor con-
tracts. We provide a simple model showing that airlines’ ability to strategically renegotiate wages
decreases in the airline’s financial position and increases in the amount of underfunding of its pension
obligations. Furthermore, the sensitivity of post-renegotiation labor payoffs to pension underfund-
ing is greatest amongst pension plans where the PBGC guarantee is relatively small compared to
the pension obligations. Our empirical results indicate that, consistent with the model, airlines
in poor financial position are able to renegotiate and reduce labor costs of those employees whose
pension plans are underfunded. Furthermore, exploiting the exogenously given PBGC maximum
guarantee we show that airlines extract larger concessions from employees with average salaries
higher than the PBGC limit. Our evidence supports the view that firms use their financial position
to negotiate with labor and use the threat of ‘pension dumping’ strategically to extract concessions
from unionized labor.
27

Appendix A: Variable description and construction
For reference, the following is a list of the variables used in the paper and their sources. A brief
description of how they were constructed is included.
1. Assets (Size): The firm’s Total assets [BTS Schedule B-1 data item 18990] in $million.
(Source: Bureau of Transportation Statistics, Form 41 Financial Data).
2. Bankruptcy dummy : Takes a value of 1 if the firm is bankrupt during a particular year, and
0 otherwise.
3. Benefits per employee: The total amount of benefits given to an employee group in a year over
the total number of employees on that group that year. The variable used in the regressions
refers to the benefits per employee of the particular job category (or categories) that matches
the employee group covered by a certain defined benefit pension plan. A detailed description
of how this variable is constructed is offered in the Sample Construction section. (Source:
Bureau of Transportation Statistics, Form 41 Financial Data).
4. Earnings: The firm’s income before discontinued operations and extraordinary items [BTS
Schedule P-12 data item 91990] + depreciation and amortization [BTS Schedue P-12 data
item 70000]. (Source: Bureau of Transportation Statistics, Form 41 Financial Data).
5. High wage dummy (Wage>1.5*PBGC): Takes a value of 1 if the wage per employee of the
particular job group being analyzed is larger than 1.5 times the maximum PBGC guaranty
for that particular year, and 0 otherwise.
6. Industry average fuel cost (industry control): The average total fuel cost per gallon for the
entire airlines industry in a year, denominated in $dollars. (Source: Bureau of Transportation
Statistics, Airline Fuel Cost and Consumption - U.S. Carriers - Scheduled).
7. Industry market-to-book (industry control): Weighted average (by firm’s assets) of the market-
to-book ratios for the 12 firms for which we have available information. (Source: Compustat).
8. Industry profitability (industry control): The Profitability (as defined in this appendix) of the
airlines industry. It is equal to aggregate Earnings of all airlines [BTS Schedule B-1 data
28

item 18990] over total aggregate assets of all airlines [BTS Schedule B-1 data item 18990].
(Source: Bureau of Transportation Statistics, Form 41 Financial Data).
9. Job groups or categories: The BTS Form 41 Schedule P-10 groups workers in 15 different
categories, while the wage information we have classifies them into 6 categories. The BTS’s
employment categories descriptions are used to match the 15 employee categories with the 6
wage categories. This grouping is as follows: 1) Pilots (Pilots & Co-pilots + Other Flight Per-
sonnel); 2) Flight Attendants (Passenger/General Services & Administration); 3) Mechanics
& Maintenance (Maintenance); 4) Traffic and Handling (Aircraft & Traffic Handling Group
1 + General Aircraft & Traffic Handling + Aircraft Control + Passenger Handling + Cargo
Handling); 5) General Management (General Manager); and, 6) Other (Trainees & Instructor
+ Statistical + Traffic Solicitors + Other + Transport Related).
10. Leverage: The firm’s total current liabilities [BTS Schedule B-1 data item 21990] + long-term
debt [BTS Schedule B-1 data item 22100] all over total assets [BTS Schedule B-1 data item
18990]. (Source: Bureau of Transportation Statistics, Form 41 Financial Data).
11. Low profitability dummy : Takes a value of 1 if profitability is below the 33rd percentile, and
0 otherwise.
12. Market-to-book : The firm’s market value of equity [Compustat Annual Items 24*25] + book
value of assets [Compustat Annual Item 6] minus the book value of equity [Compustat Annual
Item 60] all over book value of assets [Compustat Annual Item 6]. (Source: Compustat).
13. Maximum guaranty (by PBGC): It is the maximum yearly amount the Pension Benefit Guar-
anty Corporation insures in case of a defined benefit pension plan termination. This amount
depends both on the age of the worker at the time of retirement and on the calendar year in
which the worker retires. In the case a worker’s vested pension benefits turn out to be lower
than the PBGC maximum guaranty, the worker receives at most the later amount in case the
plan is terminated. (Source: Pension Benefit Guaranty Corporation).
14. Profitability : Earnings over total assets [BTS Schedule B-1 data item 18990]. (Source: Bureau
of Transportation Statistics, Form 41 Financial Data).
29
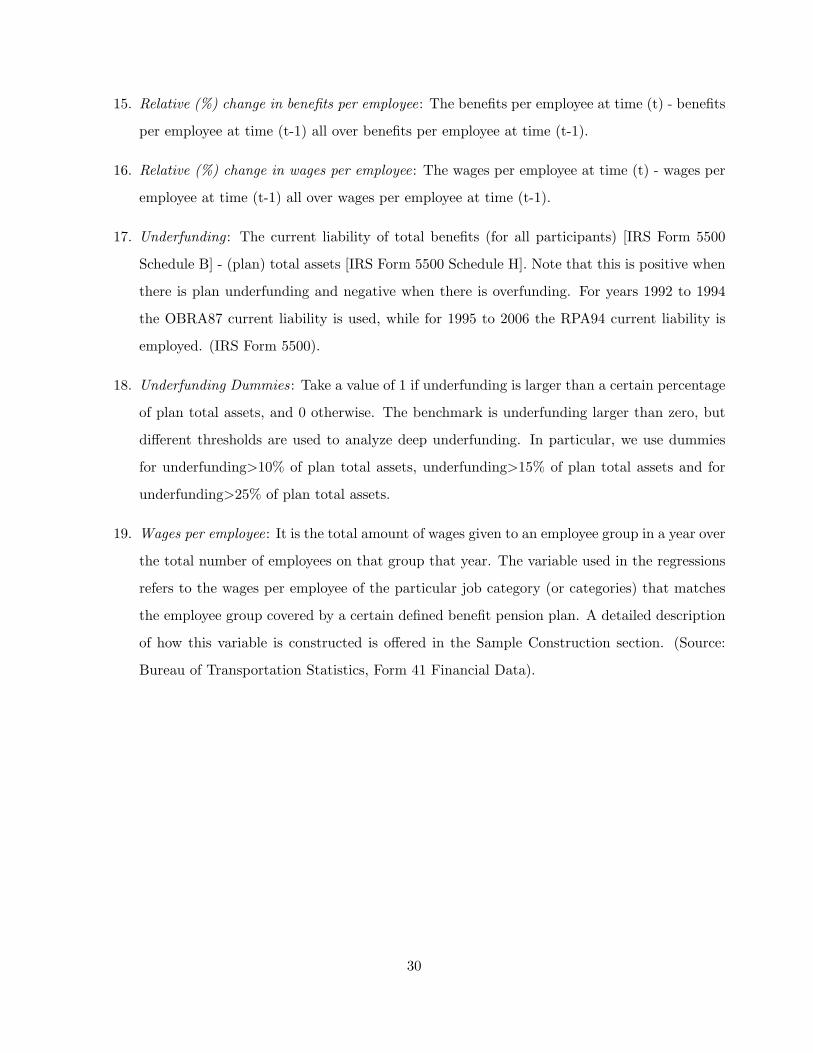
15. Relative (%) change in benefits per employee: The benefits per employee at time (t) - benefits
per employee at time (t-1) all over benefits per employee at time (t-1).
16. Relative (%) change in wages per employee: The wages per employee at time (t) - wages per
employee at time (t-1) all over wages per employee at time (t-1).
17. Underfunding : The current liability of total benefits (for all participants) [IRS Form 5500
Schedule B] - (plan) total assets [IRS Form 5500 Schedule H]. Note that this is positive when
there is plan underfunding and negative when there is overfunding. For years 1992 to 1994
the OBRA87 current liability is used, while for 1995 to 2006 the RPA94 current liability is
employed. (IRS Form 5500).
18. Underfunding Dummies: Take a value of 1 if underfunding is larger than a certain percentage
of plan total assets, and 0 otherwise. The benchmark is underfunding larger than zero, but
different thresholds are used to analyze deep underfunding. In particular, we use dummies
for underfunding>10% of plan total assets, underfunding>15% of plan total assets and for
underfunding>25% of plan total assets.
19. Wages per employee: It is the total amount of wages given to an employee group in a year over
the total number of employees on that group that year. The variable used in the regressions
refers to the wages per employee of the particular job category (or categories) that matches
the employee group covered by a certain defined benefit pension plan. A detailed description
of how this variable is constructed is offered in the Sample Construction section. (Source:
Bureau of Transportation Statistics, Form 41 Financial Data).
30

References
Asquith, Paul, Robert Gertner, and David S. Scharfstein,, “Anatomy of Financial Distress: AnExamination of Junk-Bond Issuers,” Quarterly Journal of Economics (1994), 625-658.
Baldwin, C. Y., “Productivity and labor unions: An application of the theory of self-enforcingcontracts,” Journal of Business (1983) 56 (2), 155185.
Benmelech, Efraim, and Nittai K., Bergman, “Collateral Pricing,” Journal of Financial EconomicsForthcoming (2008a).
Benmelech, Efraim, and Nittai K., Bergman, “Liquidation Values and the Credibility of Finan-cial Contract Renegotiation: Evidence from U.S. Airlines ,” Quarterly Journal of Economics, 123(2008b), 1635-1677.
Bronars, S. G. and D. R. Deere, “The Threat of Unionization, the Use of Debt, and the Preservationof Shareholder Wealth,” Quarterly Journal of Economics, 106 (1), (1991) 23154.
Bronars, S. G. and D. R. Deere, “The Threat of Unionization, the Use of Debt, and the Preservationof Shareholder Wealth,” Quarterly Journal of Economics, 106 (1), (1991) 23154.
Brown, jeffrey R., “Guaranteed Trouble: The Economic Effects of the Pension Benefit GuarantyCorporation,” Journal of Economic Perspectives (2008) 22 (1), 177-198..
Cavanaugh, J. K. and J. Garen, “Asset Specificity, Unionization and the Firms Use of Debt,”Managerial and Decision Economics, (1997) 18 (3), 255-69.
Chevalier J., and D., Scharfstein, “Liquidity Constraints and the Cyclical Behavior of Markups,”American Economic Review 85 (1995), 390-396.
DeAngelo, H. and L. DeAngelo, “Union Negotiations and Corporate Policy: A Study of LaborConcessions in the Domestic Steel Industry During the 1980s,” Journal of Financial Economics(1991) 30 (1), 3-43.
Eschuk, C. A, “Unions and Firm Behavior: Profits, Investment, and Share Prices,” Ph. D. thesis,University of Notre Dame (2001).
Freeman, R. B. “The e!ect of the union wage di!erential on management opposition and unionorganizing success,”. American Economic Review (1986) 76 (2), 92-96.
Gavazza, Alessandro, “Asset Liquidity and Financial Contracts: Evidence from Aircraft Leases,”Working paper, Yale University (2008).
Gruber, Jonathan, “Incidence of Mandated Maternity Benefits,” American Economic Review (1994)84, 622- 641.
Hawthorne, Fran., Pension Dumping: the Reasons, the Wreckage, the Stakes for Wall Street. (2008)Bloomberg Press, New York.
Hirsch, B. T. and D. A. Macpherson, “Union membership and coverage data- base from the currentpopulation survey: Note.,” Industrial and Labor Relations Review (2003) 56 (2), 34954.
Ippolito, Richard, A., “The Economic Function of Underfunded Pension Plans,” Journal of Lawand Economics 28 (1985), 611-651.
Ippolito, Richard, A., The Economics of Pension Insurance. (1989) University of PennsylvaniaPress.
31

Ippolito, Richard, A., Pension Plans and Employee Performance. (1997) The University of ChicagoPress.
Klasa, S., W. F. Maxwell, and H. Ortiz-Molina. “The Strategic Use of Corporate Cash Holdings inCollective Bargaining with Labor Union”, Journal of Financial Economics, forthcoming, (2008).
Lewis, H. G., “Union relative wage effects.” In O. Ashenfelter and R. Layard (Eds.), Handbook ofLabor Economics, Volume 2 of Handbooks in Economics, (1986). pp. 113981. New York: ElsevierScience.
Matsa, David, “Capital Structure as a Strategic Variable: Evidence from Collective Bargaining,”Working paper, Northwestern University (2008).
Perotti, E. C. and K. E. Spier, “Capital structure as a bargaining tool: The role of leverage incontract renegotiation,” American Economic Review, (1993) 83 (5), 113141.
Petersen, Mitchell “Pension Reversions and Workder-Stockholder Wealth Transfers” QuarterlyJournal of Economic, (1992) 107 (3).
Phillips, Gordon, “Increased Debt and Industry Product Market: An Empirical Analysis,” Journalof Financial Economics 37 (1995), 189-238.
Rauh, Joshua D., “Investment and FInancing Constraints: Evidence from the Funding of CorporatePlans,” Journal of Finance 61(1) (2006a), 33-71.
Rauh, Joshua D., “Own Company Stock in Defined Contribution Pension Plans: A TakeoverDefense?,” Journal of Financial Economics 81(2) (2006b), 379-410.
Rauh, Joshua D., “Risk Shifting versus Risk Management: Investment Policy in Corporate PensionPlans,” Review of Financial Studies Forthcoming.
Warner, Jerold B., “Bankruptcy, Absolute Priority, and the Pricing of Risky Debt Claims,” Journalof Financial Economics 4 (1977), 239-276.
32

0
20,000
40,000
60,000
80,000
100,000
120,000
140,000
160,000
1998 1999 2000 2001 2002 2003 2004 2005
Annual Average Wage and the PBGC Max Guarantee
Flight A3endants Aircra; Mechanics and Service Techni@ans Pilots, Co‐Pilots and Flight Engineers Industry Total PBGC 65 Years PBGC 60 Years PBGC 50 Years

Table 1:The Delta Airlines Case Study: Initial Situation and Negotiation Outcomes
for Pilots and for Non-PilotsThis table provides descriptive statistics on wages and pensions of Pilots and Non-Pilots before and after the firms Bankruptcy
(September 15, 2005). Before Bankruptcy: negotiations during 2003, 2004 and 2005 before bankruptcy. After Bankruptcy:
negotiations during 2005 after bankruptcy and on 2006.
Panel A: Wage and Pension Plan Situation
Pilots Non-Pilots
2004 2005 2006 2004 2005 2006
Number of employees 6,786 6,181 5,706 50,772 46,050 39,856
Wages
- Total Wages ($m) $1,421 $961 $726 $2,525 $2,040 $1,705
- Average Wage ($) $209,330 $155,532 $127,268 $49,735 $44,297 $42,778
- PBGC Maximum Guaranty ($) $44,386 $45,614 $47,659 $44,386 $45,614 $47,659
- Wages share of job group 36.0% 32.0% 29.9% 64.0% 68.0% 70.1%
Plan underfunding
- Underfunding ($m) $1,194 $1,858 $2,172 $2,124 $2,728 $2,965
- Underfunding per employee ($) $175,957 $300,530 $380,687 $41,834 $59,239 $74,393
- Underfunding as % of plan assets 40.8% 86.0% 124.6% 47.5% 59.2% 64.6%
- Funding ratio (Assets/Liabilities) 71.0% 53.8% 44.5% 67.8% 62.8% 60.8%
Panel B: Negotiation Outcomes
Pilots Non-Pilots
Before bankruptcy (Jan/03 - Sep/05)
- Average wage cut 32.5% 10.0%
- Pension plan status Frozen As usual (no change)
After bankruptcy (Sep/05 - Dec/06)
- Average wage cut 14.0% 7.5%
- Pension plan status Terminated Frozen
33

Table 2:Summary Statistics
This table provides descriptive statistics for the variables used in the empirical analysis.
Panel A: Wage and Benefit Variables
25th 75th Standard
Mean Percentile Median Percentile Deviation Min Max
(wages/operating revenue) 23.4% 19.7% 24.0% 27.0% 5.7% 10.8% 36.8%
(benefits/operating revenue) 8.7% 7.1% 8.6% 10.3% 2.7% 3.3% 17.5%
(wages/employees)
- Total $68,729 $36,588 $50,455 $100,218 $41,830 $12,877 $209,330
- Pilots $120,639 $101,668 $123,244 $135,762 $27,345 $55,059 $209,330
- Flight Attendants $33,230 $29,203 $33,258 $36,975 $6,874 $16,860 $49,576
- Mechanics and Maintenance $52,232 $36,741 $48,006 $58,667 $23,421 $16,326 $173,504
- Traffic and Handling $38,099 $30,172 $37,501 $42,443 $11,619 $16,830 $116,074
(benefits/employees)
- Total $36,248 $19,000 $29,525 $44,416 $24,061 $3,902 $108,101
- Pilots $50,355 $34,729 $44,268 $65,570 $22,142 $15,224 $108,101
- Flight Attendants $23,112 $20,260 $25,947 $26,471 $4,615 $9,356 $33,320
% change (wages/employees)
- Total 3.5% -2.5% 3.2% 8.3% 13.0% -37.1% 67.3%
- Pilots 3.6% -2.2% 3.9% 8.9% 11.6% -37.1% 36.1%
- Flight Attendants 2.7% -2.7% 2.0% 7.8% 13.1% -48.8% 65.0%
- Mechanics and Maintenance 5.0% -3.9% 4.5% 11.6% 20.5% -53.6% 72.1%
- Traffic and Handling 0.4% -5.5% 0.8% 5.8% 14.1% -59.9% 59.0%
% change (benefits/employees)
- Total 7.3% -3.0% 5.4% 14.2% 21.4% -47.1% 116.3%
- Pilots 8.1% -4.4% 5.4% 16.8% 25.8% -47.1% 116.3%
- Flight Attendants 5.1% -2.7% 2.6% 11.8% 19.4% -47.0% 110.1%
Panel B: Other Variables
25th 75th Standard
Mean Percentile Median Percentile Deviation Min Max
Underfunding dummy 0.547 0.0 1.0 1.0 0.498 0.0 1.0
Underfunding>10% of plan assets 0.385 0.0 0.0 1.0 0.487 0.0 1.0
Underfunding>15% of plan assets 0.336 0.0 0.0 1.0 0.473 0.0 1.0
Underfunding>20% of plan assets 0.270 0.0 0.0 1.0 0.444 0.0 1.0
Underfunding>25% of plan assets 0.224 0.0 0.0 0.0 0.417 0.0 1.0
Size ($m) $9,408 $2,507 $7,410 $16,107 $8,128 $105 $28,177
Market-to-Book 1.252 1.020 1.136 1.251 0.479 0.743 4.084
Leverage 0.594 0.468 0.588 0.675 0.243 0.025 1.395
Profitability 3.08% -0.75% 4.93% 9.16% 9.50% -53.86% 26.14%
Low Profitability dummy 0.336 0.0 0.0 1.0 0.473 0.0 1.0
Bankruptcy dummy 0.161 0.0 0.0 0.0 0.368 0.0 1.0
(Wage>PBGC) dummy 0.805 1.0 1.0 1.0 0.397 0.0 1.0
(Wage>1.5*PBGC) dummy 0.447 0.0 0.0 1.0 0.498 0.0 1.0
(Wage>2*PBGC) dummy 0.354 0.0 0.0 1.0 0.479 0.0 1.0
34

Table 3:Maximum Annual Guarantees Given by PBGC
This table provides the maximum annual amount covered by the Pension Benefit Guaranty Corporation gives at different
ages at the time of retiring.
50 Years 55 Years 60 Years 65 Years
1992 $9,879 $12,702 $18,348 $28,227
1993 $10,238 $13,163 $19,013 $29,250
1994 $10,739 $13,807 $19,943 $30,682
1995 $10,810 $13,899 $20,076 $30,886
1996 $11,097 $14,267 $20,608 $31,705
1997 $11,598 $14,911 $21,539 $33,136
1998 $12,099 $15,556 $22,469 $34,568
1999 $12,815 $16,476 $23,769 $36,614
2000 $13,531 $17,397 $25,128 $38,659
2001 $14,247 $18,317 $26,458 $40,705
2002 $15,034 $19,330 $27,921 $42,955
2003 $15,392 $19,790 $28,585 $43,977
2004 $15,535 $19,974 $28,851 $44,386
2005 $15,965 $20,526 $29,649 $45,614
2006 $16,681 $21,447 $30,978 $47,659
Mean $13,044 $16,771 $24,224 $37,268
35

Table 4:Wages and Underfunding
The dependent variable in all regressions is the relative change in (Wages/Employees). All regressions include an
intercept (not reported). Standard errors are calculated by clustering at the airline level.
Dependent % change in % change in % change in % change in % change in % change in
Variable= wages/ wages/ wages/ wages/ wages/ wages/
Variable= employees employees employees employees employees employees
Ln(Assets) -0.001 0.086 a 0.089 a -0.001 0.050 c 0.059 b
(0.004) (0.022) (0.023) (0.003) (0.024) (0.023)
Leverage 0.043 0.207 b 0.209 b 0.079 0.100 0.109
(0.081) (0.081) (0.082) (0.071) (0.078) (0.078)
Market-to-Book 0.003 -0.005 -0.009 0.013 0.036 0.036
(0.013) (0.024) (0.024) (0.012) (0.027) (0.029)
Profitability 0.153 0.212 c 0.216 c
(0.106) (0.112) (0.116)
Low Profitability -0.027 -0.028 -0.027
(0.029) (0.028) (0.031)
Underfunding -0.001 -0.008 -0.001 -0.004 -0.026 b -0.019
(0.010) (0.011) (0.015) (0.011) (0.011) (0.014)
Low Profitability -0.034 c -0.039 b -0.042 c
×Underfunding (0.018) (0.016) (0.022)
Bankruptcy -0.072 a -0.101 a -0.106 b
(0.019) (0.030) (0.039)
Bankruptcy -0.032 0.010 0.015
×Underfunding (0.032) (0.035) (0.043)
Adjusted R2 0.08 0.11 0.07 0.13 0.13 0.09
Fixed-Effects
Year Yes Yes Yes Yes Yes Yes
Airline No Yes No No Yes No
Plan No No Yes No No Yes
# of airlines 12 12 12 12 12 12
# of plans 46 46 46 46 46 46
Observations 476 476 476 470 470 470
36

Table 5:Wages, Bankruptcy and Underfunding before and after 9/2001
The dependent variable in all regressions is the relative change in (Wages/Employees). All regressions include an
intercept (not reported). Standard errors are calculated by clustering at the airline level.
1992-2001 1992-2001 1992-2001 2002-2006 2002-2006 2002-2006
Dependent % change in % change in % change in % change in % change in % change in
Variable= wages/ wages/ wages/ wages/ wages/ wages/
Variable= employees employees employees employees employees employees
Ln(Assets) 0.000 -0.040 -0.038 0.002 0.082 0.003
(0.005) (0.077) (0.081) (0.010) (0.094) (0.121)
Leverage 0.142 0.120 0.138 -0.029 0.089 0.016
(0.104) (0.088) (0.086) (0.082) (0.189) (0.238)
Market-to-Book 0.029 0.047 0.074 0.001 0.039 0.009
(0.018) (0.046) (0.048) (0.022) (0.060) (0.084)
Profitability -0.024 -0.100 -0.109 0.347 a 0.444 b 0.466 b
(0.102) (0.143) (0.143) (0.090) (0.153) (0.180)
Underfunding -0.011 -0.017 -0.012 0.062 c 0.038 0.030
(0.014) (0.013) (0.019) (0.031) (0.034) (0.044)
Bankruptcy -0.119 a -0.208 a -0.243 a 0.035 0.000 0.123
(0.019) (0.021) (0.025) (0.030) (0.081) (0.073)
Bankruptcy 0.025 0.070 a 0.118 a -0.140 b -0.089 c -0.231 a
×Underfunding (0.025) (0.020) (0.029) (0.046) (0.042) (0.072)
Adjusted R2 0.10 0.12 0.08 0.09 0.06 -0.05
Fixed-Effects
Year Yes Yes Yes Yes Yes Yes
Airline No Yes No No Yes No
Plan No No Yes No No Yes
# of airlines 12 12 12 11 11 11
# of plans 45 45 45 36 36 36
Observations 328 328 328 142 142 142
37
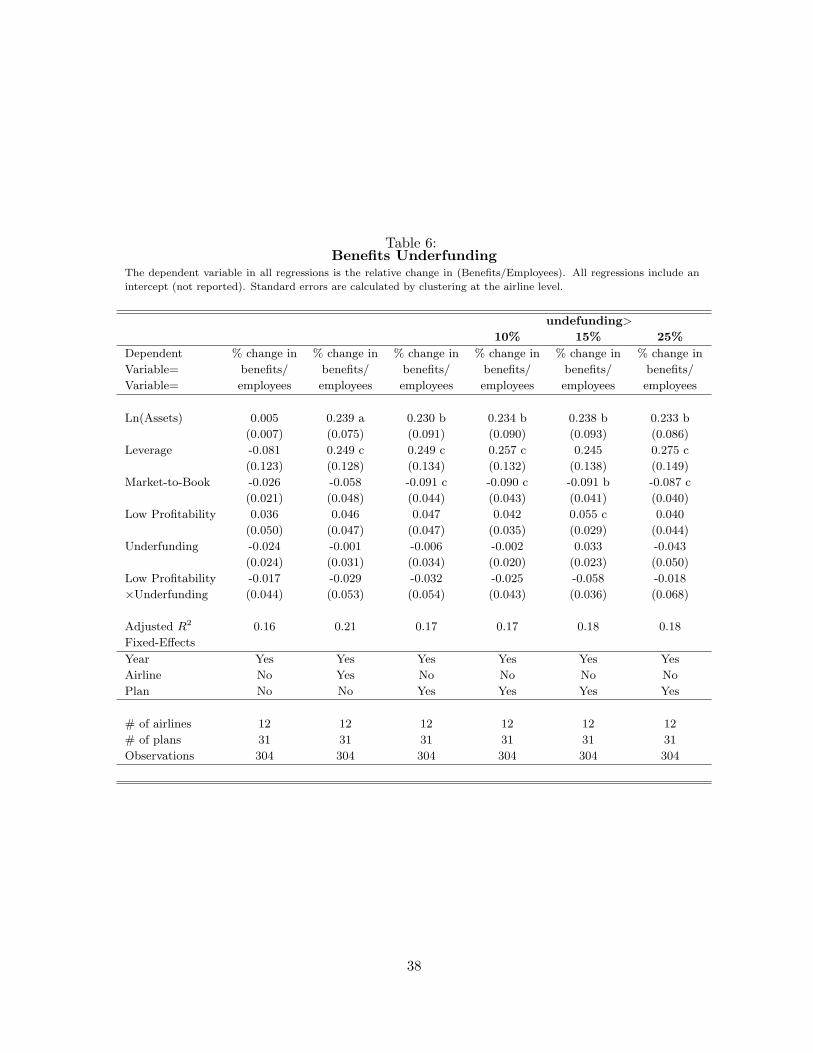
Table 6:Benefits Underfunding
The dependent variable in all regressions is the relative change in (Benefits/Employees). All regressions include an
intercept (not reported). Standard errors are calculated by clustering at the airline level.
undefunding>
10% 15% 25%
Dependent % change in % change in % change in % change in % change in % change in
Variable= benefits/ benefits/ benefits/ benefits/ benefits/ benefits/
Variable= employees employees employees employees employees employees
Ln(Assets) 0.005 0.239 a 0.230 b 0.234 b 0.238 b 0.233 b
(0.007) (0.075) (0.091) (0.090) (0.093) (0.086)
Leverage -0.081 0.249 c 0.249 c 0.257 c 0.245 0.275 c
(0.123) (0.128) (0.134) (0.132) (0.138) (0.149)
Market-to-Book -0.026 -0.058 -0.091 c -0.090 c -0.091 b -0.087 c
(0.021) (0.048) (0.044) (0.043) (0.041) (0.040)
Low Profitability 0.036 0.046 0.047 0.042 0.055 c 0.040
(0.050) (0.047) (0.047) (0.035) (0.029) (0.044)
Underfunding -0.024 -0.001 -0.006 -0.002 0.033 -0.043
(0.024) (0.031) (0.034) (0.020) (0.023) (0.050)
Low Profitability -0.017 -0.029 -0.032 -0.025 -0.058 -0.018
×Underfunding (0.044) (0.053) (0.054) (0.043) (0.036) (0.068)
Adjusted R2 0.16 0.21 0.17 0.17 0.18 0.18
Fixed-Effects
Year Yes Yes Yes Yes Yes Yes
Airline No Yes No No No No
Plan No No Yes Yes Yes Yes
# of airlines 12 12 12 12 12 12
# of plans 31 31 31 31 31 31
Observations 304 304 304 304 304 304
38

Table 7:Wages Underfunding and PBGC Coverage
The dependent variable in all regressions is the relative change in (Wages/Employees). All regressions include an
intercept (not reported). Standard errors are calculated by clustering at the airline level.
undefunding>
10% 15% 25%
Dependent % change in % change in % change in % change in % change in % change in
Variable= wages/ wages/ wages/ wages/ wages/ wages/
Variable= employees employees employees employees employees employees
Ln(Assets) 0.000 0.092 a 0.074 b 0.073 b 0.075 b 0.074 b
(0.004) (0.022) (0.025) (0.030) (0.031) (0.028)
Leverage 0.057 0.218 b 0.209 b 0.205 b 0.205 b 0.218 b
(0.085) (0.081) (0.082) (0.075) (0.071) (0.072)
Market-to-Book 0.004 -0.002 -0.007 -0.005 -0.002 0.000
(0.013) (0.026) (0.030) (0.026) (0.026) (0.027)
Low Profitability -0.044 -0.047 c -0.032 -0.034 -0.037 -0.025
(0.025) (0.026) (0.022) (0.029) (0.034) (0.030)
Underfunding -0.014 -0.028 -0.035 -0.006 0.001 -0.014
(0.017) (0.021) (0.024) (0.020) (0.023) (0.023)
Wage>1.5*PBGC 0.010 0.010 0.133 a 0.145 a 0.147 a 0.158 a
(0.015) (0.012) (0.030) (0.035) (0.038) (0.041)
Low Profitability -0.003 0.001 -0.001 0.002 0.009 -0.023
×Underfunding (0.019) (0.019) (0.017) (0.027) (0.034) (0.033)
(Wage>1.5*PBGC) 0.032 0.045 0.058 b 0.043 0.040 0.019
×Underfunding (0.026) (0.028) (0.024) (0.027) (0.027) (0.036)
Low Profitability 0.042 0.046 0.045 0.034 0.044 0.009
×(Wage>1.5*PBGC) (0.026) (0.026) (0.043) (0.043) (0.042) (0.043)
Low Profitability -0.074 b -0.084 a -0.095 b -0.094 c -0.119 b -0.054
×Underfunding (0.029) (0.026) (0.032) (0.052) (0.048) (0.043)
×(Wage>1.5*PBGC)
Adjusted R2 0.09 0.12 0.14 0.14 0.14 0.14
Fixed-Effects
Year Yes Yes Yes Yes Yes Yes
Airline No Yes No No No No
Plan No No Yes Yes Yes Yes
# of airlines 12 12 12 12 12 12
# of plans 46 46 46 46 46 46
Observations 476 476 476 476 476 476
39
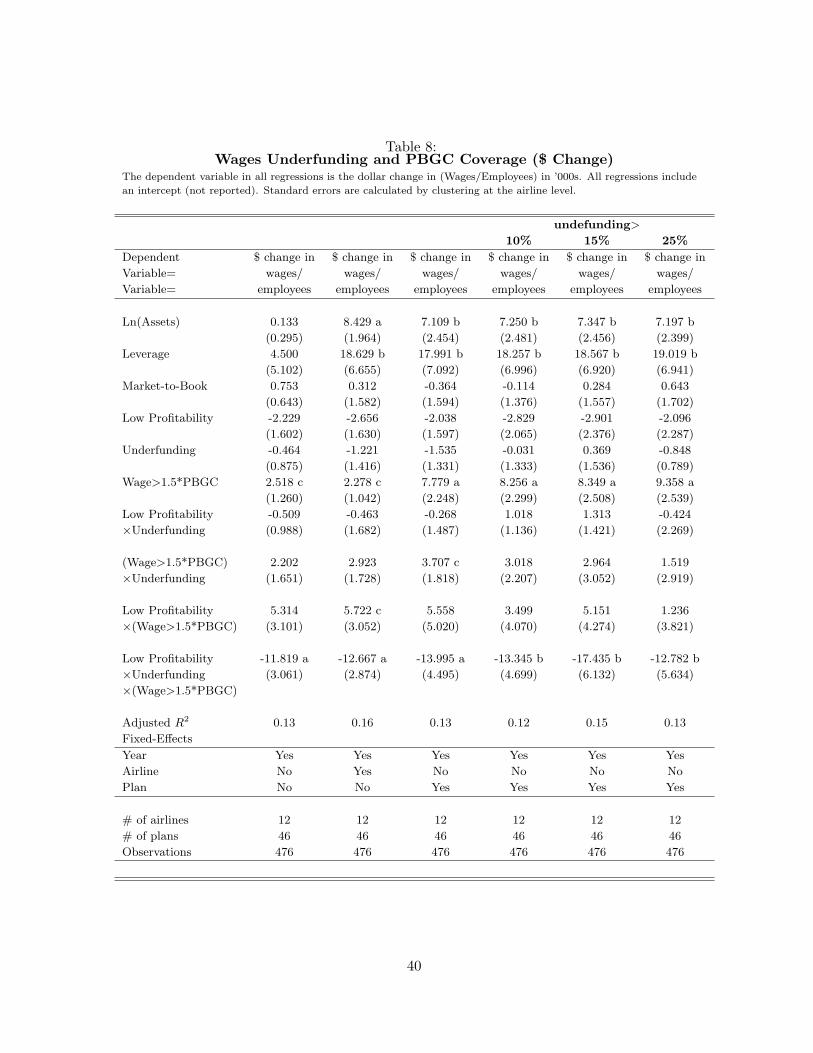
Table 8:Wages Underfunding and PBGC Coverage ($ Change)
The dependent variable in all regressions is the dollar change in (Wages/Employees) in ’000s. All regressions include
an intercept (not reported). Standard errors are calculated by clustering at the airline level.
undefunding>
10% 15% 25%
Dependent $ change in $ change in $ change in $ change in $ change in $ change in
Variable= wages/ wages/ wages/ wages/ wages/ wages/
Variable= employees employees employees employees employees employees
Ln(Assets) 0.133 8.429 a 7.109 b 7.250 b 7.347 b 7.197 b
(0.295) (1.964) (2.454) (2.481) (2.456) (2.399)
Leverage 4.500 18.629 b 17.991 b 18.257 b 18.567 b 19.019 b
(5.102) (6.655) (7.092) (6.996) (6.920) (6.941)
Market-to-Book 0.753 0.312 -0.364 -0.114 0.284 0.643
(0.643) (1.582) (1.594) (1.376) (1.557) (1.702)
Low Profitability -2.229 -2.656 -2.038 -2.829 -2.901 -2.096
(1.602) (1.630) (1.597) (2.065) (2.376) (2.287)
Underfunding -0.464 -1.221 -1.535 -0.031 0.369 -0.848
(0.875) (1.416) (1.331) (1.333) (1.536) (0.789)
Wage>1.5*PBGC 2.518 c 2.278 c 7.779 a 8.256 a 8.349 a 9.358 a
(1.260) (1.042) (2.248) (2.299) (2.508) (2.539)
Low Profitability -0.509 -0.463 -0.268 1.018 1.313 -0.424
×Underfunding (0.988) (1.682) (1.487) (1.136) (1.421) (2.269)
(Wage>1.5*PBGC) 2.202 2.923 3.707 c 3.018 2.964 1.519
×Underfunding (1.651) (1.728) (1.818) (2.207) (3.052) (2.919)
Low Profitability 5.314 5.722 c 5.558 3.499 5.151 1.236
×(Wage>1.5*PBGC) (3.101) (3.052) (5.020) (4.070) (4.274) (3.821)
Low Profitability -11.819 a -12.667 a -13.995 a -13.345 b -17.435 b -12.782 b
×Underfunding (3.061) (2.874) (4.495) (4.699) (6.132) (5.634)
×(Wage>1.5*PBGC)
Adjusted R2 0.13 0.16 0.13 0.12 0.15 0.13
Fixed-Effects
Year Yes Yes Yes Yes Yes Yes
Airline No Yes No No No No
Plan No No Yes Yes Yes Yes
# of airlines 12 12 12 12 12 12
# of plans 46 46 46 46 46 46
Observations 476 476 476 476 476 476
40

Table 9:Wages Underfunding and PBGC Coverage - Excluding Airlines in Chapter-11
The dependent variable in all regressions is the relative change in (Wages/Employees). All regressions include an
intercept (not reported). Standard errors are calculated by clustering at the airline level.
undefunding>
10% 15% 25%
Dependent % change in % change in % change in % change in % change in % change in
Variable= wages/ wages/ wages/ wages/ wages/ wages/
Variable= employees employees employees employees employees employees
Ln(Assets) 0.005 0.021 0.004 0.004 0.006 0.006
(0.005) (0.039) (0.040) (0.040) (0.043) (0.038)
Leverage 0.171 c 0.132 b 0.135 b 0.150 b 0.135 b 0.142 b
(0.093) (0.057) (0.060) (0.055) (0.055) (0.053)
Market-to-Book 0.032 c 0.070 c 0.063 0.062 0.059 0.055
(0.017) (0.036) (0.044) (0.041) (0.040) (0.036)
Low Profitability -0.037 -0.026 -0.022 -0.015 -0.023 -0.008
(0.022) (0.023) (0.029) (0.035) (0.038) (0.034)
Underfunding -0.024 -0.045 -0.052 -0.034 -0.026 -0.036
(0.023) (0.026) (0.032) (0.027) (0.031) (0.031)
Wage>1.5*PBGC 0.005 0.007 0.133 b 0.148 b 0.149 b 0.160 b
(0.015) (0.014) (0.048) (0.052) (0.055) (0.055)
Low Profitability 0.020 0.016 0.021 0.005 0.029 -0.010
×Underfunding (0.019) (0.018) (0.028) (0.036) (0.043) (0.046)
(Wage>1.5*PBGC) 0.044 0.058 0.070 c 0.050 0.053 0.027
×Underfunding (0.032) (0.036) (0.035) (0.032) (0.030) (0.048)
Low Profitability 0.053 0.053 0.067 0.048 0.046 0.004
×(Wage>1.5*PBGC) (0.034) (0.036) (0.058) (0.049) (0.047) (0.052)
Low Profitability -0.073 b -0.081 b -0.105 c -0.090 -0.091 c 0.023
×Underfunding (0.030) (0.031) (0.048) (0.061) (0.048) (0.060)
×(Wage>1.5*PBGC)
Adjusted R2 0.05 0.07 0.10 0.09 0.09 0.09
Fixed-Effects
Year Yes Yes Yes Yes Yes Yes
Airline No Yes No No No No
Plan No No Yes Yes Yes Yes
# of airlines 12 12 12 12 12 12
# of plans 45 45 45 45 45 45
Observations 402 402 402 402 402 402
41
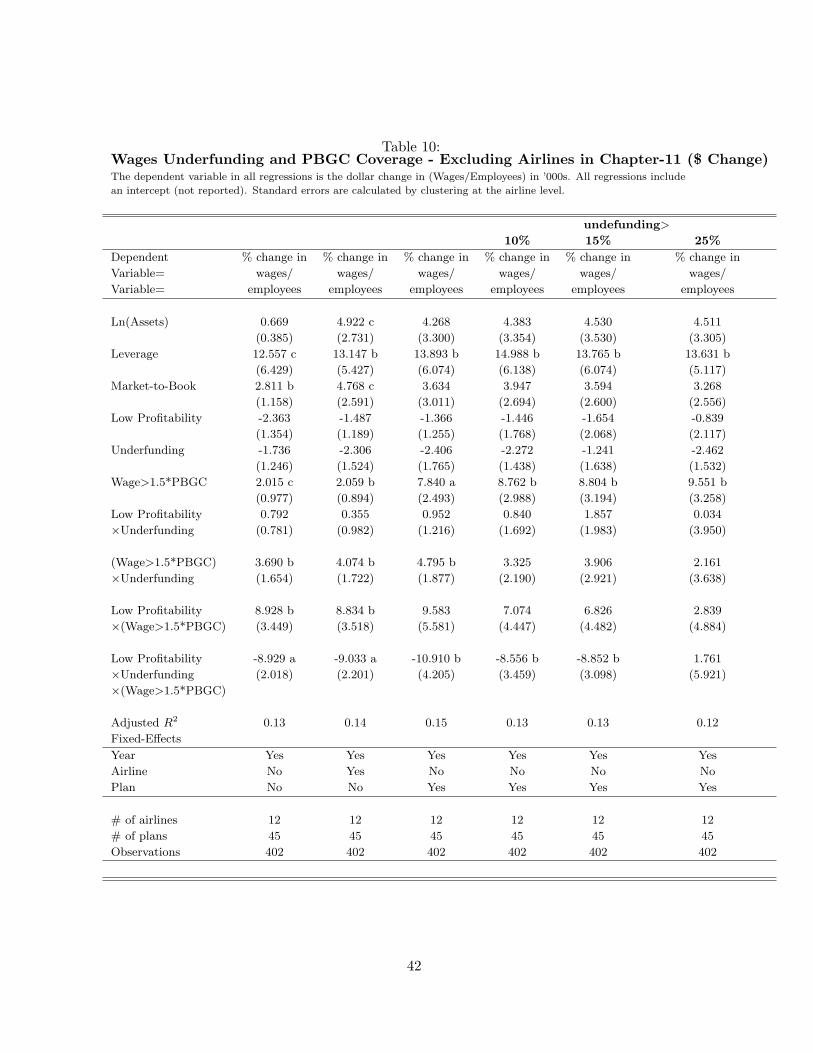
Table 10:Wages Underfunding and PBGC Coverage - Excluding Airlines in Chapter-11 ($ Change)The dependent variable in all regressions is the dollar change in (Wages/Employees) in ’000s. All regressions include
an intercept (not reported). Standard errors are calculated by clustering at the airline level.
undefunding>
10% 15% 25%
Dependent % change in % change in % change in % change in % change in % change in
Variable= wages/ wages/ wages/ wages/ wages/ wages/
Variable= employees employees employees employees employees employees
Ln(Assets) 0.669 4.922 c 4.268 4.383 4.530 4.511
(0.385) (2.731) (3.300) (3.354) (3.530) (3.305)
Leverage 12.557 c 13.147 b 13.893 b 14.988 b 13.765 b 13.631 b
(6.429) (5.427) (6.074) (6.138) (6.074) (5.117)
Market-to-Book 2.811 b 4.768 c 3.634 3.947 3.594 3.268
(1.158) (2.591) (3.011) (2.694) (2.600) (2.556)
Low Profitability -2.363 -1.487 -1.366 -1.446 -1.654 -0.839
(1.354) (1.189) (1.255) (1.768) (2.068) (2.117)
Underfunding -1.736 -2.306 -2.406 -2.272 -1.241 -2.462
(1.246) (1.524) (1.765) (1.438) (1.638) (1.532)
Wage>1.5*PBGC 2.015 c 2.059 b 7.840 a 8.762 b 8.804 b 9.551 b
(0.977) (0.894) (2.493) (2.988) (3.194) (3.258)
Low Profitability 0.792 0.355 0.952 0.840 1.857 0.034
×Underfunding (0.781) (0.982) (1.216) (1.692) (1.983) (3.950)
(Wage>1.5*PBGC) 3.690 b 4.074 b 4.795 b 3.325 3.906 2.161
×Underfunding (1.654) (1.722) (1.877) (2.190) (2.921) (3.638)
Low Profitability 8.928 b 8.834 b 9.583 7.074 6.826 2.839
×(Wage>1.5*PBGC) (3.449) (3.518) (5.581) (4.447) (4.482) (4.884)
Low Profitability -8.929 a -9.033 a -10.910 b -8.556 b -8.852 b 1.761
×Underfunding (2.018) (2.201) (4.205) (3.459) (3.098) (5.921)
×(Wage>1.5*PBGC)
Adjusted R2 0.13 0.14 0.15 0.13 0.13 0.12
Fixed-Effects
Year Yes Yes Yes Yes Yes Yes
Airline No Yes No No No No
Plan No No Yes Yes Yes Yes
# of airlines 12 12 12 12 12 12
# of plans 45 45 45 45 45 45
Observations 402 402 402 402 402 402
42

Table 11:Wages, Underfunding and PBGC Coverage (controlling for wage shares)
The dependent variable in all regressions is the relative change in (Wages/Employees). All regressions include an
intercept (not reported). Standard errors are calculated by clustering at the airline level.
undefunding>
10% 15% 25%
Dependent % change in % change in % change in % change in % change in % change in
Variable= wages/ wages/ wages/ wages/ wages/ wages/
Variable= employees employees employees employees employees employees
Ln(Assets) 0.000 0.093 a 0.066 b 0.065 b 0.067 b 0.065 b
(0.005) (0.021) (0.025) (0.028) (0.029) (0.027)
Leverage 0.058 0.219 b 0.199 b 0.197 b 0.198 b 0.207 b
(0.086) (0.083) (0.082) (0.075) (0.071) (0.071)
Market-to-Book 0.005 -0.002 -0.008 -0.006 -0.004 -0.001
(0.013) (0.026) (0.028) (0.025) (0.025) (0.025)
Wages Share -0.005 -0.011 1.117 a 1.162 a 1.151 a 1.169 a
(0.020) (0.029) (0.318) (0.309) (0.323) (0.330)
Low Profitability -0.043 -0.046 c -0.039 c -0.038 -0.040 -0.024
(0.025) (0.025) (0.021) (0.027) (0.031) (0.027)
Underfunding -0.014 -0.030 -0.029 -0.008 -0.002 -0.021
(0.018) (0.024) (0.024) (0.020) (0.025) (0.021)
Wage>1.5*PBGC 0.010 0.008 0.117 a 0.123 a 0.125 b 0.134 a
(0.016) (0.012) (0.033) (0.038) (0.041) (0.042)
Low Profitability -0.004 0.000 0.013 0.016 0.021 -0.012
×Underfunding (0.017) (0.016) (0.017) (0.021) (0.030) (0.028)
(Wage>1.5*PBGC) 0.032 0.046 0.045 0.040 0.035 0.030
×Underfunding (0.027) (0.030) (0.027) (0.028) (0.028) (0.038)
Low Profitability 0.042 0.044 0.058 c 0.043 0.049 0.012
×(Wage>1.5*PBGC) (0.027) (0.029) (0.027) (0.028) (0.029) (0.038)
Low Profitability -0.073 b -0.083 a -0.110 a -0.110 b -0.128 a -0.075 b
×Underfunding (0.028) (0.026) (0.024) (0.045) (0.036) (0.032)
×(Wage>1.5*PBGC)
Adjusted R2 0.08 0.12 0.17 0.17 0.17 0.17
Fixed-Effects
Year Yes Yes Yes Yes Yes Yes
Airline No Yes No No No No
Plan No No Yes Yes Yes Yes
# of airlines 12 12 12 12 12 12
# of plans 46 46 46 46 46 46
Observations 476 476 476 476 476 476
43

Table 12:Wages, Underfunding and PBGC Coverage
(controlling for airline-year fixed effects and wage share)The dependent variable in all regressions is the relative change in (Wages/Employees). All regressions include an
intercept (not reported). Standard errors are calculated by clustering at the airline level.
undefunding>
10% 15% 25%
Dependent % change in % change in % change in % change in
Variable= wages/ wages/ wages/ wages/
Variable= employees employees employees employees
Ln(Assets) -0.027 a -0.027 a -0.030 a -0.027 a
(0.008) (0.008) (0.006) (0.006)
Leverage 0.033 0.065 0.076 0.058
(0.050) (0.062) (0.069) (0.052)
Market-to-Book 0.027 a 0.031 a 0.033 a 0.028 a
(0.007) (0.007) (0.007) (0.008)
Wages Share -0.008 0.002 0.003 0.003
(0.026) (0.023) (0.021) (0.021)
Low Profitability -0.033 -0.051 -0.064 -0.058 c
(0.020) (0.038) (0.046) (0.031)
Underfunding -0.044 -0.054 -0.042 -0.043 a
(0.030) (0.035) (0.033) (0.014)
Wage>1.5*PBGC 0.000 0.011 0.016 0.019
(0.012) (0.012) (0.013) (0.015)
Low Profitability 0.029 0.049 0.062 0.055
×Underfunding (0.021) (0.040) (0.048) (0.032)
(Wage>1.5*PBGC) 0.048 0.041 0.033 0.033
×Underfunding (0.033) (0.042) (0.033) (0.047)
Low Profitability 0.036 0.033 0.040 0.004
×(Wage>1.5*PBGC) (0.030) (0.031) (0.037) (0.037)
Low Profitability -0.076 b -0.085 -0.098 c -0.040
×Underfunding (0.031) (0.055) (0.048) (0.057)
×(Wage>1.5*PBGC)
Adjusted R2 0.22 0.22 0.22 0.21
Airline-Year Yes Yes Yes Yes
Fixed-Effects
# of airlines 12 12 12 12
# of plans 46 46 46 46
Observations 476 476 476 476
44
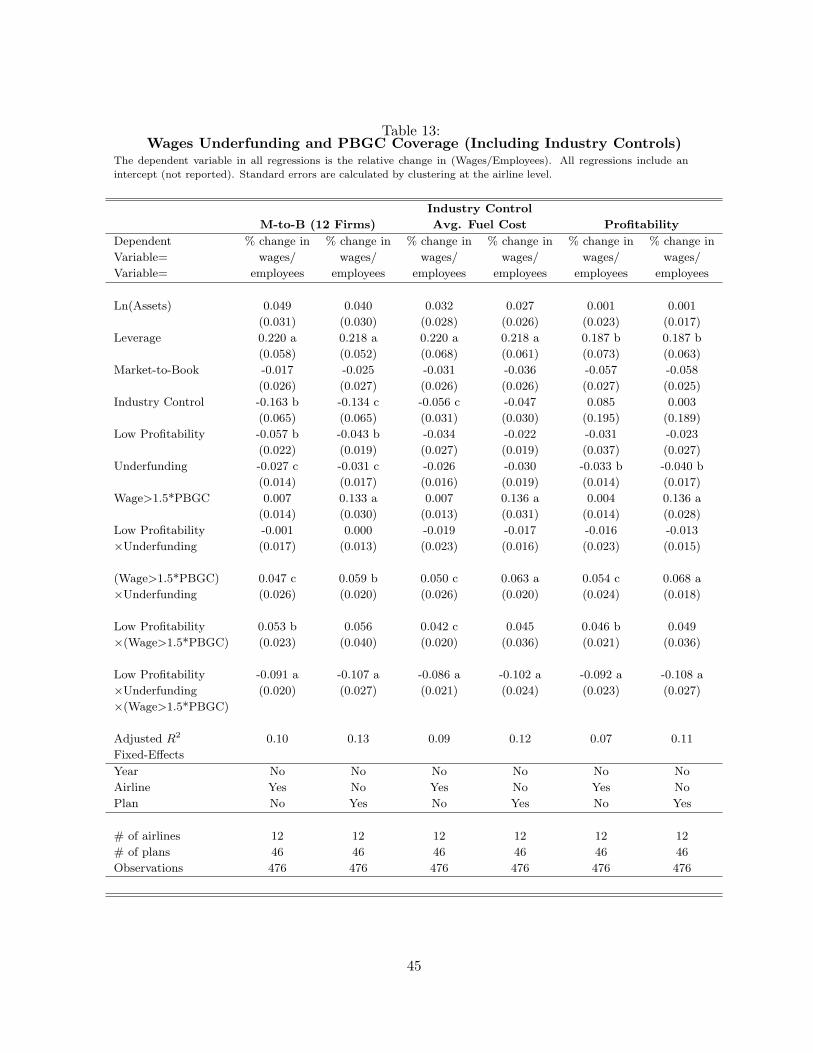
Table 13:Wages Underfunding and PBGC Coverage (Including Industry Controls)
The dependent variable in all regressions is the relative change in (Wages/Employees). All regressions include an
intercept (not reported). Standard errors are calculated by clustering at the airline level.
Industry Control
M-to-B (12 Firms) Avg. Fuel Cost Profitability
Dependent % change in % change in % change in % change in % change in % change in
Variable= wages/ wages/ wages/ wages/ wages/ wages/
Variable= employees employees employees employees employees employees
Ln(Assets) 0.049 0.040 0.032 0.027 0.001 0.001
(0.031) (0.030) (0.028) (0.026) (0.023) (0.017)
Leverage 0.220 a 0.218 a 0.220 a 0.218 a 0.187 b 0.187 b
(0.058) (0.052) (0.068) (0.061) (0.073) (0.063)
Market-to-Book -0.017 -0.025 -0.031 -0.036 -0.057 -0.058
(0.026) (0.027) (0.026) (0.026) (0.027) (0.025)
Industry Control -0.163 b -0.134 c -0.056 c -0.047 0.085 0.003
(0.065) (0.065) (0.031) (0.030) (0.195) (0.189)
Low Profitability -0.057 b -0.043 b -0.034 -0.022 -0.031 -0.023
(0.022) (0.019) (0.027) (0.019) (0.037) (0.027)
Underfunding -0.027 c -0.031 c -0.026 -0.030 -0.033 b -0.040 b
(0.014) (0.017) (0.016) (0.019) (0.014) (0.017)
Wage>1.5*PBGC 0.007 0.133 a 0.007 0.136 a 0.004 0.136 a
(0.014) (0.030) (0.013) (0.031) (0.014) (0.028)
Low Profitability -0.001 0.000 -0.019 -0.017 -0.016 -0.013
×Underfunding (0.017) (0.013) (0.023) (0.016) (0.023) (0.015)
(Wage>1.5*PBGC) 0.047 c 0.059 b 0.050 c 0.063 a 0.054 c 0.068 a
×Underfunding (0.026) (0.020) (0.026) (0.020) (0.024) (0.018)
Low Profitability 0.053 b 0.056 0.042 c 0.045 0.046 b 0.049
×(Wage>1.5*PBGC) (0.023) (0.040) (0.020) (0.036) (0.021) (0.036)
Low Profitability -0.091 a -0.107 a -0.086 a -0.102 a -0.092 a -0.108 a
×Underfunding (0.020) (0.027) (0.021) (0.024) (0.023) (0.027)
×(Wage>1.5*PBGC)
Adjusted R2 0.10 0.13 0.09 0.12 0.07 0.11
Fixed-Effects
Year No No No No No No
Airline Yes No Yes No Yes No
Plan No Yes No Yes No Yes
# of airlines 12 12 12 12 12 12
# of plans 46 46 46 46 46 46
Observations 476 476 476 476 476 476
45

Table 14:Labor Unionization
This table provides the percentage of labor that is unionized in each firm. For those firm-year observations in which there
is no detailed information, a dummy variable is used which takes a value of 1 if the firm has three or more unions and 0
otherwise.
Airline 1995 1996 1997 1998 1999 2000 2001 2002 2003 2004 2005
Alaska Airlines 1 1 87% 88% 87% 86% 84% 84% 1 84% 83%
Aloha Airlines 1 1 1 1 1 1 1 1 1 1 1
American Airlines 1 1 1 1 1 1 1 1 1 1 1
Continental Airlines 1 1 1 1 1 1 1 44% 1 42% 1
Delta Airlines 0 0 0 0 14% 16% 0 18% 18% 18% 18%
Federal Express 0 0 0 0 0 0 0 0 0 0 0
Hawaiian Airlines 1 1 1 1 1 1 1 1 1 1 85%
Horizon Air 1 1 27% 43% 45% 44% 45% 46% 1 43% 45%
Midwest Express 0 0 0 0 0 1 1 1 33% 1 35%
Northwest Airlines 1 1 1 1 1 1 1 1 1 1 1
Trans World Airlines 1 1 1 1 1 1 - - - - -
United Airlines 1 1 1 1 1 1 1 1 1 78% 80%
United Parcel Services 1 1 1 1 1 60% 60% 64% 1 64% 1
US Airways 69% 68% 65% 84% 84% 85% 86% 83% 84% 84% 81%
46

Table 15:Wages, Underfunding, Bankruptcy and PBGC Coverage
The dependent variable in all regressions is the relative change in (Wages/Employees). All regressions include an
intercept (not reported). Standard errors are calculated by clustering at the airline level.
undefunding>
10% 15% 25%
Dependent % change in % change in % change in % change in % change in % change in
Variable= wages/ wages/ wages/ wages/ wages/ wages/
Variable= employees employees employees employees employees employees
Ln(Assets) -0.001 0.056 b 0.051 b 0.051 b 0.046 c 0.050 c
(0.004) (0.022) (0.021) (0.023) (0.021) (0.024)
Leverage 0.094 0.108 0.129 0.134 0.119 0.126
(0.075) (0.075) (0.078) (0.075) (0.071) (0.072)
Market-to-Book 0.013 0.042 0.033 0.031 0.030 0.033
(0.012) (0.027) (0.032) (0.029) (0.029) (0.028)
Profitability 0.165 0.210 c 0.210 c 0.190 0.164 0.174 c
(0.106) (0.110) (0.108) (0.115) (0.100) (0.097)
Bankruptcy -0.090 a -0.142 a -0.102 b -0.107 b -0.093 c -0.089
(0.012) (0.027) (0.038) (0.040) (0.048) (0.057)
Underfunding -0.013 -0.043 c -0.049 c -0.022 -0.007 -0.030 c
(0.019) (0.024) (0.026) (0.015) (0.022) (0.014)
Wage>1.5*PBGC 0.017 0.017 0.137 a 0.150 a 0.151 a 0.154 a
(0.014) (0.013) (0.037) (0.037) (0.040) (0.044)
Bankruptcy 0.006 0.072 c 0.044 0.060 b 0.041 0.050
×Underfunding (0.035) (0.035) (0.042) (0.022) (0.024) (0.045)
(Wage>1.5*PBGC) 0.023 0.038 0.046 0.027 0.027 0.038
×Underfunding (0.027) (0.032) (0.033) (0.028) (0.022) (0.032)
Bankruptcy 0.050 0.078 b 0.030 0.025 0.074 0.052
×(Wage>1.5*PBGC) (0.033) (0.034) (0.035) (0.054) (0.050) (0.034)
Bankruptcy -0.096 -0.130 b -0.078 -0.078 -0.165 b -0.152 b
×Underfunding (0.058) (0.054) (0.063) (0.066) (0.065) (0.068)
×(Wage>1.5*PBGC)
Adjusted R2 0.13 0.15 0.17 0.16 0.17 0.17
Fixed-Effects
Year Yes Yes Yes Yes Yes Yes
Airline No Yes No No No No
Plan No No Yes Yes Yes Yes
# of airlines 12 12 12 12 12 12
# of plans 46 46 46 46 46 46
Observations 470 470 470 470 470 470
47

Table 16:Wages, Underfunding, Bankruptcy and PBGC Coverage ($ Change)
The dependent variable in all regressions is the dollar change in (Wages/Employees) in ’000s. All regressions include
an intercept (not reported). Standard errors are calculated by clustering at the airline level.
undefunding>
10% 15% 25%
Dependent $ change in $ change in $ change in $ change in $ change in $ change in
Variable= wages/ wages/ wages/ wages/ wages/ wages/
Variable= employees employees employees employees employees employees
Ln(Assets) 0.007 5.569 a 5.503 b 5.432 b 4.745 b 5.281 b
(0.282) (1.687) (2.034) (1.820) (1.700) (1.760)
Leverage 6.733 9.892 c 10.912 c 10.968 c 9.518 9.361 c
(4.089) (5.096) (5.748) (5.609) (5.407) (4.959)
Market-to-Book 0.798 1.530 0.714 0.610 0.741 1.021
(0.759) (1.985) (2.208) (1.963) (1.935) (1.903)
Profitability 16.164 23.054 c 22.253 c 19.756 c 15.903 c 16.912 b
(9.352) (11.008) (10.481) (10.519) (7.890) (7.413)
Bankruptcy -3.214 a -4.566 b -1.755 -3.379 -2.344 -2.245
(0.817) (1.618) (1.944) (3.528) (3.318) (3.189)
Underfunding -0.914 -2.510 c -2.757 b -1.468 c -0.404 -1.969 c
(0.752) (1.144) (1.140) (0.715) (1.324) (0.957)
Wage>1.5*PBGC 3.949 a 3.758 a 8.985 a 9.432 a 9.427 a 9.438 a
(1.009) (0.762) (1.865) (1.915) (2.158) (2.213)
Bankruptcy 0.690 3.603 c 1.618 4.251 2.410 3.603
×Underfunding (1.824) (1.804) (2.330) (2.450) (1.888) (2.435)
(Wage>1.5*PBGC) 1.371 2.287 2.645 2.414 2.512 4.455
×Underfunding (1.500) (1.575) (1.738) (1.955) (2.151) (3.118)
Bankruptcy -1.313 0.000 -5.506 -5.913 0.814 -1.120
×(Wage>1.5*PBGC) (2.850) (2.674) (4.090) (4.595) (7.769) (6.872)
Bankruptcy -12.790 -14.419 c -9.757 -10.815 -22.732 c -22.991
×Underfunding (7.407) (7.078) (8.712) (8.384) (11.889) (13.458)
×(Wage>1.5*PBGC)
Adjusted R2 0.20 0.20 0.17 0.17 0.20 0.20
Fixed-Effects
Year Yes Yes Yes Yes Yes Yes
Airline No Yes No No No No
Plan No No Yes Yes Yes Yes
# of airlines 12 12 12 12 12 12
# of plans 46 46 46 46 46 46
Observations 470 470 470 470 470 470
48
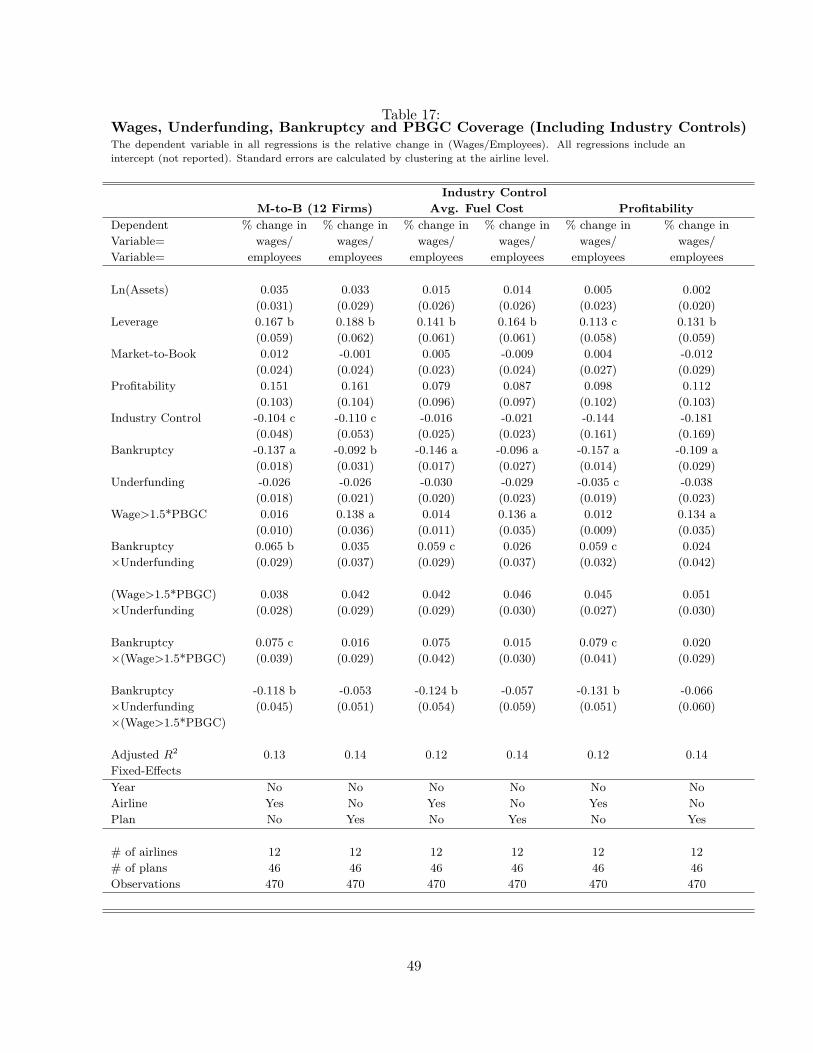
Table 17:Wages, Underfunding, Bankruptcy and PBGC Coverage (Including Industry Controls)The dependent variable in all regressions is the relative change in (Wages/Employees). All regressions include an
intercept (not reported). Standard errors are calculated by clustering at the airline level.
Industry Control
M-to-B (12 Firms) Avg. Fuel Cost Profitability
Dependent % change in % change in % change in % change in % change in % change in
Variable= wages/ wages/ wages/ wages/ wages/ wages/
Variable= employees employees employees employees employees employees
Ln(Assets) 0.035 0.033 0.015 0.014 0.005 0.002
(0.031) (0.029) (0.026) (0.026) (0.023) (0.020)
Leverage 0.167 b 0.188 b 0.141 b 0.164 b 0.113 c 0.131 b
(0.059) (0.062) (0.061) (0.061) (0.058) (0.059)
Market-to-Book 0.012 -0.001 0.005 -0.009 0.004 -0.012
(0.024) (0.024) (0.023) (0.024) (0.027) (0.029)
Profitability 0.151 0.161 0.079 0.087 0.098 0.112
(0.103) (0.104) (0.096) (0.097) (0.102) (0.103)
Industry Control -0.104 c -0.110 c -0.016 -0.021 -0.144 -0.181
(0.048) (0.053) (0.025) (0.023) (0.161) (0.169)
Bankruptcy -0.137 a -0.092 b -0.146 a -0.096 a -0.157 a -0.109 a
(0.018) (0.031) (0.017) (0.027) (0.014) (0.029)
Underfunding -0.026 -0.026 -0.030 -0.029 -0.035 c -0.038
(0.018) (0.021) (0.020) (0.023) (0.019) (0.023)
Wage>1.5*PBGC 0.016 0.138 a 0.014 0.136 a 0.012 0.134 a
(0.010) (0.036) (0.011) (0.035) (0.009) (0.035)
Bankruptcy 0.065 b 0.035 0.059 c 0.026 0.059 c 0.024
×Underfunding (0.029) (0.037) (0.029) (0.037) (0.032) (0.042)
(Wage>1.5*PBGC) 0.038 0.042 0.042 0.046 0.045 0.051
×Underfunding (0.028) (0.029) (0.029) (0.030) (0.027) (0.030)
Bankruptcy 0.075 c 0.016 0.075 0.015 0.079 c 0.020
×(Wage>1.5*PBGC) (0.039) (0.029) (0.042) (0.030) (0.041) (0.029)
Bankruptcy -0.118 b -0.053 -0.124 b -0.057 -0.131 b -0.066
×Underfunding (0.045) (0.051) (0.054) (0.059) (0.051) (0.060)
×(Wage>1.5*PBGC)
Adjusted R2 0.13 0.14 0.12 0.14 0.12 0.14
Fixed-Effects
Year No No No No No No
Airline Yes No Yes No Yes No
Plan No Yes No Yes No Yes
# of airlines 12 12 12 12 12 12
# of plans 46 46 46 46 46 46
Observations 470 470 470 470 470 470
49
Related Documents