NEED-BASED FINANCIAL AID AND COLLEGE PERSISTENCE: EXPERIMENTAL EVIDENCE FROM WISCONSIN* Sara Goldrick-Rab ([email protected]) University of Wisconsin-Madison Douglas N. Harris ([email protected]) Tulane University Robert Kelchen ([email protected]) University of Wisconsin-Madison James Benson ([email protected]) Institute for Education Sciences October 10, 2012 We examine the impacts of a private need-based college financial aid program distributing grants at random among first-year Pell Grant recipients at thirteen public Wisconsin universities. The Wisconsin Scholars Grant of $3,500 per year required full-time attendance. Estimates based on four cohorts of students suggest that offering the grant increased completion of a full-time credit load and rates of re-enrollment for a second year of college. An increase of $1,000 in total financial aid received during a student’s first year of college was associated with a 2.8 to 4.1 percentage point increase in rates of enrollment for the second year. JEL codes: C93, D03, H24, I23 __________________________ *The Bill and Melinda Gates Foundation, Great Lakes Higher Education Guaranty Corporation, Institute for Research on Poverty, Spencer Foundation, William T. Grant Foundation, Wisconsin Center for the Advancement of Postsecondary Education, and an anonymous donor provided funding for this study, conducted in partnership with the Fund for Wisconsin Scholars, the University of Wisconsin System, and the Wisconsin Technical College System. For significant contributions, we thank Drew Anderson, Alison Bowman, and Peter Kinsley, as well as Sigal Alon, Paul Attewell, Eric Bettinger, David Deming, Stephen DesJardins, Susan Dynarski, Felix Elwert, David Figlio, Donald Heller, Bridget Terry Long, David Mundel, Jeff Smith, Kevin Stange, and Christopher Taber. All opinions and errors are those of the authors. Direct all questions and other correspondence to the first author at [email protected].

Need-Based Financial Aid and College Persistence: Experimental Evidence from Wisconsin
Mar 07, 2016
The authors examine the impacts of a private need-based college financial aid program distributing grants at random among first-year Pell Grant recipients at thirteen public Wisconsin universities. The Wisconsin Scholars Grant of $3,500 per year required full-time attendance. Estimates based on four cohorts of students suggest that offering the grant increased completion of a full-time credit load and rates of re-enrollment for a second year of college. An increase of $1,000 in total financial aid received during a student’s first year of college was associated with a 2.8 to 4.1 percentage point increase in rates of enrollment for the second year.
Welcome message from author
This document is posted to help you gain knowledge. Please leave a comment to let me know what you think about it! Share it to your friends and learn new things together.
Transcript
NEED-BASED FINANCIAL AID AND COLLEGE PERSISTENCE:
EXPERIMENTAL EVIDENCE FROM WISCONSIN*
Sara Goldrick-Rab ([email protected])
University of Wisconsin-Madison
Douglas N. Harris ([email protected])
Tulane University
Robert Kelchen ([email protected])
University of Wisconsin-Madison
James Benson ([email protected])
Institute for Education Sciences
October 10, 2012
We examine the impacts of a private need-based college financial aid program distributing grants
at random among first-year Pell Grant recipients at thirteen public Wisconsin universities. The
Wisconsin Scholars Grant of $3,500 per year required full-time attendance. Estimates based on
four cohorts of students suggest that offering the grant increased completion of a full-time credit
load and rates of re-enrollment for a second year of college. An increase of $1,000 in total financial
aid received during a student’s first year of college was associated with a 2.8 to 4.1 percentage
point increase in rates of enrollment for the second year.
JEL codes: C93, D03, H24, I23
__________________________
*The Bill and Melinda Gates Foundation, Great Lakes Higher Education Guaranty Corporation, Institute for Research
on Poverty, Spencer Foundation, William T. Grant Foundation, Wisconsin Center for the Advancement of
Postsecondary Education, and an anonymous donor provided funding for this study, conducted in partnership with the
Fund for Wisconsin Scholars, the University of Wisconsin System, and the Wisconsin Technical College System. For
significant contributions, we thank Drew Anderson, Alison Bowman, and Peter Kinsley, as well as Sigal Alon, Paul
Attewell, Eric Bettinger, David Deming, Stephen DesJardins, Susan Dynarski, Felix Elwert, David Figlio, Donald
Heller, Bridget Terry Long, David Mundel, Jeff Smith, Kevin Stange, and Christopher Taber. All opinions and errors
are those of the authors. Direct all questions and other correspondence to the first author at [email protected].

The United States government currently provides more than $132 billion per year in
grant, loan, and work-study assistance to undergraduates (Baum and Payea 2011), but there is
little evidence as to whether financial aid promotes college credit and eventual degree attainment
among those it induces to attend college (Bettinger 2011).1 While there are well-established
economic returns to college attendance, those returns are strongest for students who accrue at
least a year or two of college credits (Kane and Rouse 1995; Heckman, Lochner, and Todd
2008). Yet over the last forty years, as college enrollment rates swelled, college persistence rates
did not (Bailey and Dynarski 2011). National estimates from the Beginning Postsecondary
Students study suggest that 14% of the federal Pell Grant recipients entering universities each
year fail to enroll for a second year of college, and only about 40% receive a bachelor’s degree
within six years.
Most financial aid research conflates effects on college attendance and effects on college
persistence, even though the two likely represent very different sets of decisions for individuals.
In this paper we capitalize on a statewide program to estimate the impacts of need-based grant on
college persistence. Specifically, with an experimental design we estimate the impacts of the
privately funded Wisconsin Scholars Grant (WSG), which is distributed at random among
eligible first-year undergraduates attending Wisconsin’s thirteen public universities. Drawing on
longitudinal data collected for four cohorts of students eligible to participate in the WSG
program (nearly 15,000 people in total), we examine the impact of offering an additional $3,500
grant (renewable for up to five years) on the college continuation decisions of Pell Grant
recipients.
We estimate that, on average, offering students the new grant generated small, positive
impacts on their retention rates, credit completion, and grade point average. Effects appear
strongest at the institutions where typical academic performance among Pell recipients (e.g.
based on the control group) leaves the most room for improvement. Since the net increases in
total financial aid (including all grants, loans, and work-study monies) resulting from treatment
varied due to how the grant crowded out existing aid, we use a multi-site instrumental variables
1 This figure includes $48 billion in federal grants ($34 billion of which is the Pell Grant), $70 billion in loans, $13
billion in tax credits and deductions, and $1 billion in work-study funds. However, in comparison to the average
cost of tuition and fees (currently $8,244 for in-state students at public universities), grants are fairly small; an
average Pell is $3,828 per full-time-equivalent student (Baum and Payea 2011).

3
approach to estimate the impact of dollars actually received on retention. Students receiving
more aid during their first year of college stayed enrolled longer; specifically we find a 2.8 to 4.1
percentage point increase in retention to the second year of college accruing to a $1,000 increase
in total financial aid.
The paper proceeds as follows: Section I provides additional background on prior
evidence of the impacts of need-based financial aid programs, Section II describes the Wisconsin
grant program, experimental design, and data, Section III presents estimates of impacts on
educational outcomes for each student cohort and across cohorts, and Section IV concludes with
a discussion of implications for future research and policy.
I. IMPACTS OF NEED-BASED FINANCIAL AID
Evidence suggests that the income inequality characterizing America’s economy in the
early decades of the 21st century is unlikely to abate without substantial increases in the rates of
college attainment among Americans from low-income families (Goldin and Katz 2008; Long
2012). What contribution might need-based financial aid make to those efforts? Children from
low-income families now face a nine percent chance of attaining a bachelor’s degree. That low
rate of college attainment is substantially attributable to high rates of college dropout, and is only
moderately explained by their lower levels of high school preparation and tested ability (Bailey
and Dynarski 2011). The substantial and rising cost of college is also a likely contributor, partly
given higher price elasticity among low-income families (Dynarski 2003; Goldin and Katz 2008;
Bowen, Chingos, and McPherson 2009; Deming and Dynarski 2010).
Historically, need-based grants have aimed to encourage students to attend college, but
there is growing interest in whether they also help them re-enroll each semester, complete
credits, get good grades, and eventually earn degrees. It is difficult to assess the impacts on these
outcomes because most studies of grants examine the total impact on both college enrollment
and persistence (e.g., McPherson and Shapiro 1991; Kane 1994; Light and Strayer 2000; Bound
and Turner 2002; DesJardins et al. 2002; Paulsen and St. John 2002; Seftor and Turner 2002; van
der Klauuw 2002; Stinebrickner and Stinebrickner 2003; Bettinger 2004; Singell 2004; Singell
and Stater 2006; Kane 2007; Stater 2009). The few quasi-experimental studies focusing on the
persistence margin suggest that a $1,000 increase in aid improves college retention rates by two

4
to four percentage points (Bettinger 2004; Bettinger 2010). An effect of this magnitude is also
consistent with estimates of how grant aid affects initial college attendance, where a $1,000
increase in aid appears to incur a three to four percentage point increase in rates of college
enrollment (Dynarski 2003). Thus, financial aid grants seem to benefit students, albeit to a
limited extent. It tends to be the case that studies finding otherwise are dated (i.e. Hansen 1983;
Kane 1995), analyzing the responses of students attending college many decades ago, when costs
and benefits were much lower and before price discrimination was heavily utilized in higher
education (there has been a distinct shift away from low-tuition models to high-tuition with
discounting) (Harris & Goldrick-Rab 2012; Long 2012).
Yet given how few estimates have been generated, some question their precision and
reliability, especially since estimates for programs like those delivering grants to needy students
are susceptible to bias resulting from selection (Cellini 2008). In other words, students receiving
aid are different in substantial ways, both observable and not, from those students who do not,
and this may provide either an over or an under-statement of grants’ effects (Goldrick-Rab,
Harris, and Trostel 2009). Many of the most rigorous studies of whether grants impact college
persistence consider programs that are not simple or strictly need-based, but instead impose
additional requirements on students in an effort to increase effectiveness (Bettinger 2011). For
example, the West Virginia PROMISE program, which offered free tuition and fees to students
to earning a minimum GPA and enrolling more-than-full-time (completing 30 credits per year
instead of 24), boosted four-year bachelor’s degree completion rates by 26% (from a base of 27
percentage points) (Scott-Clayton 2011). In contrast, experimental evaluations of two Canadian
university-based aid programs with strong academic performance requirements yielded far more
modest impacts (Angrist, Lang, and Oreopoulos 2009; Angrist, Oreopoulos, and Williams 2010),
and a randomized trial of a University of New Mexico program with moderate academic
requirements only produced small positive short-term impacts on credit completion (Patel and
Richburg-Hayes 2012). Three other experimental studies of scholarship programs targeted
students in poverty (primarily mothers receiving welfare) at community colleges in Louisiana,
Ohio, and New York, providing grant funds directly to students—outside the financial aid
system—in exchange for achieving specific credits and grades. Those efforts produced some
increases in both attempted and completed credits and modest change in re-enrollment rates
(Patel and Richburg-Hayes 2012).

5
Despite the relative preponderance of evaluations focused on performance-based
financial aid, the vast majority of U.S. federal and state financial grant programs remain need-
based and straightforward, with only modest academic requirements. The federal Pell Grant
program, perhaps the best-known, only requires students to enroll in college full-time (12
credits) in order to receive the full grant, and merely demands that students make “satisfactory
academic progress” each term in order to retain the aid. Since there are relatively few
evaluations of such simple programs, we contribute to the literature on aid by examining the
effects of a relatively simple Wisconsin program.
II. THE WISCONSIN SCHOLARS GRANT AND EXPERIMENTAL DESIGN
The Wisconsin Scholars Grant (WSG) is a privately funded program, initiated in 2008
and supported by a $168 million endowment from the Fund for Wisconsin Scholars, making it
one of the largest need-based grant programs in the state (Pope 2010).2. This paper describes
impact estimates based on the entering cohorts of 2008, 2009, 2010, and 2011, with the most
detailed estimates focusing on data from the program’s first cohort.
A. The Treatment
The WSG program offers Pell-eligible students a $3,500 grant per year for up to five
years, with a total potential maximum award of $17,500 per student.3,4
This amounts to 20.4% of
their estimated costs of attendance, and 69.9% of students’ annual demonstrated financial need.5
Students are eligible for the WSG if they are Wisconsin residents who attended and
graduated from a state public high school within three years of matriculating to one of the state’s
13 public universities, where they enrolled for at least 12 credits (full-time), completed the Free
2 More information on the Fund for Wisconsin Scholars is at www.ffws.org.
3 A student is eligible to receive the Pell Grant if his or her expected family contribution, as determined by
completion of a federal aid application and a need analysis methodology, is below a certain value ($4,041 in the
2008-2009 academic year). For more details, see Dynarski and Scott-Clayton (2007). 4 The grant is transferable among all public colleges and universities in Wisconsin. Students are still eligible if they
switched to a Wisconsin public two-year college, but the grant amount declines to $1,800 per year. 5 The estimated cost of attendance is set by institutions and includes tuition, fees, and an estimated budget for room,
board, books, and other expenses. Students are not allowed to have a financial aid package worth more than the cost
of attendance. The demonstrated financial need is defined as the cost of attendance less the expected family
contribution and the pre-treatment financial aid package.

6
Application for Federal Student Aid (FAFSA) and qualified for a federal Pell Grant, while still
possessing calculated unmet need (net of all grant aid) of at least $1.6
The program first begins to interact with students during their first semester of college
when, following random selection using administrative records, students are sent an award
notification letter in the mail.7 In response, students must affirm specific pieces of their grant
eligibility that cannot be checked with available administrative records, and return a form
accepting the award. Financial aid administrators then take the money sent by the WSG program
and integrate it into students’ financial aid packages, notifying them electronically of their new
award by the end of the first term.
All private financial aid is subject to state and federal regulations requiring that students’
aid awards not exceed an institution’s cost of attendance, and wherever possible, private aid
supplants government aid. In addition, as a ‘last dollar scholarship,’ the WSG program explicitly
aims to displace student loans. Therefore, while students were told that the WSG had a $3,500
value, other aid frequently was crowded out, reducing the effective net increases in students’ aid
packages resulting from treatment (an issue examined further in the next section). This is an
organizational inefficiency common to many aid programs, such as the Gates Millennium
Scholars (GMS) award, but is often overlooked by researchers (Amos et al., 2009).8 Drawing on
lessons from those other programs, the WSG program stipulated that institutional aid could not
be supplanted, and that the grant had to be awarded in its entirety (i.e., no partial awards were
possible).
6 The WSG could not plausibly have affected college entry in the first cohort and it is very unlikely to have affected
the initial enrollment decision of later cohorts. While the program was first announced about one year before the
awards were made (December 2007), program details were not public until September 2008 and even then received
little publicity. Because of this, we think our estimated impacts are purely on persistence and not on the initial
decision to enroll in college. 7 For the cohorts we describe in this paper, the letter was sent in October. Students were also sent an e-mail from
their financial aid officer verifying the legitimacy of the grant and to watch for documents in the mail. 8 This may be because it is difficult to observe financial aid package data. For example, while Bettinger (2010) notes
that students who were allocated more Pell and state grant aid from the Ohio policy he studied appeared to benefit
more, the data he had made it impossible to know how much of an increase in total aid students effectively received-
he did not observe aid packages and thus could not examine resulting changes in institutional aid, loans, or work-
study. If his conclusion, that more grant aid lowers dropout rates, is correct, then the estimated size of the impact
per $1000 may be understated.

7
Students can receive the grant for up to 10 semesters or five academic years. Grant
renewal terms require that students maintain Pell eligibility and enroll at a Wisconsin public
university or two-year college, full-time (at least 12 credits) at the start of each term, as well as
make satisfactory academic progress.9
B. Implementation
New programs often have growing pains as they hammer out effective ways to
implement their rules, communicate with constituents, and figure out other challenges. In one
sense, studying new efforts presents an opportunity to better understand the factors moderating
program effects, but it also comes with costs. This study has the most extensive data for the
WSG program’s first cohort, and therefore we present the most detailed analyses for that cohort,
describe program implementation to the best of our ability, and include results for three later
cohorts using the limited amount of administrative data we could obtain. In addition, the lead
author is also undertaking a new, comprehensive evaluation of the matured program with the
cohort of students beginning college in fall 2013.
Implementation could alter program impacts; for example the accuracy of both
institutional and student knowledge of program rules may have improved, or it may have become
more trusted. For example, it was not until the fourth year of implementation that the WSG
program provided financial aid officers with a comprehensive handbook of instructions, although
limited guidelines were provided in the first three years. As a result, interviews conducted with
financial aid officers revealed variation in their understandings of the criteria regarding who was
eligible for the grant, the conditions under which it could be renewed, and what messages they
were to provide students about the award. There was also significant turnover among the aid
officers over time, potentially reducing institutional knowledge of the program. This may have
affected how much total aid students received from the grant, and how continuously the grant
was awarded.
9 The Pell Grant also requires that students make satisfactory academic progress (SAP), which typically means a C
average or equivalent and “academic standing consistent with the requirements for graduation” from the institution.
Apart from SAP, there were no stated GPA requirements for the WSG.

8
In addition, interviews taking place within weeks of mailing the initial award letter to the
first cohort suggest that some students thought the grant was a “scam” and were suspicious
enough to seek more information from their financial aid officers. Students reported that they did
not know “where it came from” or “what it was for.” This was not, however, unique to the
WSG—they made similar statements about the federal Pell Grant.
Like many government programs, the WSG’s program rules were unevenly followed and
in some cases misunderstood by students. To reinstate the grant after an absence from college,
students had to notify their financial aid office and the program’s executive director and write a
request to be reinstated.10
Students in the first cohort were not regularly reminded about the
grant’s renewal criteria but the program did issue a few emailed communications containing
“different messages about eligibility, transferring, good luck with classes, and other general
information.”11
But surveys we administered to the first cohort in the months after the program
began and again a year later showed that barely half of students offered the grant knew that it
was part of their financial aid package. Some students were also confused about the grant’s
academic requirements. On surveys, fully 83% of students assigned to treatment revealed that
they misunderstood the grant’s requirements,12
and recipients of the federal Academic
Competitiveness Grant (ACG), which required a B average, seem to have mistakenly thought
that the Wisconsin grant demanded full-time enrollment and a B average.
It is important to remember that financial aid is always administered through a highly
complex bureaucratic structure, which may have its own independent effects. Data collected
from the program, aid officers, and students over four years suggest that these issues gradually
improved over time for the WSG program. For example, it continued to work out kinks in the
delivery of the financial aid and the messaging to aid officers. By examining the program’s
impacts across multiple cohorts we sought to assess the stability of program impacts, as well as
generate some hypotheses about whether aspects of implementation might be important.
C. Randomization, Sampling, and Take-Up
10
The Fund’s Executive Director reported that very few students did so. 11
This is an excerpt from a personal communication from the Fund’s Executive Director to the authors. 12
Specifically, in a survey administered to the 2008 cohort, three years after they were first awarded the grant,
recipients incorrectly identified either the number of credits and/or grade required to maintain the WSG.

9
Students did not apply for the WSG program. Rather, financial aid officers identified
eligible students using their institutional administrative records, and sent their names to a state
agency overseeing the distribution of several grant and loan programs. In conjunction with the
research team, in 2008 the Fund used random assignment to select which eligible students
received the WSG. Researchers did not oversee random assignment in the subsequent three
cohorts, but the same process was reportedly used and we performed checks on baseline
equivalence to verify randomization. It is notable that the program did not operate for research
purposes, and student participation was not predicated on research participation. This meant that
we studied the program as it operated in real life, rather than examining a trial program created
for research purposes (Heckman 2005). It also means, however, that we did not decide to whom
the grant would be targeted, or set its terms.
The number of eligible students fluctuated with each cohort, depending mainly on the
number of Pell-eligible students in the state, and the precision with which administrators
followed program rules in identifying students meeting the criteria. In 2008 the pool included
3,157 new freshmen and that number grew with each subsequent year, until in 2011 it included
nearly 5,000 students. Estimates based on the first cohort (see Table 1) indicate that 57% of the
students were female, 25% were members of a racial/ethnic minority group, and 53% were the
first in their family to attend college.13
In fall 2008, the average adjusted gross income of their
parents was just under $30,000 and the average expected family contribution was $1,631. Thus,
most students came from families living above the poverty line, yet qualifying as “working poor”
because they earned less than 200% of the federal poverty threshold (Center on Wisconsin
Strategy 2010).14
Since the grant’s eligibility criteria stipulated it, their mean age was just over
18, and just 2.8% were independent for tax purposes.
The number of grants the WSG offered each year (e.g. the size of the treatment group)
fluctuated slightly according to the program’s endowment, ranging from 550 to 621 per year. For
comparison purposes, the control group includes all students not offered the grant, except for the
13
Racial/ethnic minority groups include African-Americans, Native Americans, Hispanics, Southeast Asians, and
multiracial students who are from at least one of these groups. Information on race was obtained from a student
survey, as it is not included in the FAFSA, and as such is only available for about 80% of the full sample. 14
27% of families in Wisconsin earned less than 200% of poverty in 2010, compared to 30% nationwide (Center on
Wisconsin Strategy 2010).
10
first cohort, for which we drew a stratified random sample of 900 students (instead of the full
pool) to serve as the control group.15
In selecting that control group, we blocked the list of non-
recipients by university in order to facilitate the collection of an oversample of non-white
students. Thus, the size of the control group is 50% larger than the treatment group, and contains
more students attending racially and ethnically diverse institutions.16
We use weights when
analyzing that cohort to account for the sampling design.
The paper’s main analyses are based on the full samples for the second through fourth
cohorts, and a nearly complete sample for the first cohort. Table 1 includes details on a set of
subsamples from the first cohort that we use for some analyses. Prior to each analysis, we
examine baseline characteristics to check for initial equivalence and take steps to address
variation across the samples, but even with those best efforts in mind we caution readers about
the limited generalizability of the estimates.
D. Data
The State of Wisconsin lacks a student-unit record data system for higher education. In
order to examine the college outcomes of students offered the Wisconsin Scholars Grant, we
negotiated data agreements between the state agency that possesses financial aid information, the
University of Wisconsin System, each of the 13 public universities in that system, and the Fund
for Wisconsin Scholars. Over time, data agreements changed, and we did the best we could with
the available data, considering effects across cohorts with varying amounts of information. Next
we describe each measure, its data source, and the samples for which it is observed.
Baseline equivalence. For all four cohorts, we utilize data on the initial institution a
student attended and the incidence and number of terms of prior enrollment in the University of
15
We could not obtain the data for the entire group of non-recipients in the first cohort due to our initial data
agreements and data collection costs, but note that there are diminishing statistical returns to control group size with
a fixed treatment group (Bloom 2005). 16
We employ sampling weights to adjust for the unbalanced allocation of students between the treatment and
control groups in the first cohort. The sampling weights are calculated as the (inverse) probability of selection. In
the treatment group, the probability is the same for all students regardless of campus. In the control group, the
calculation is analogous, except that the probability of selection in the control group varies by campus because of the
number of students selected for treatment assignment and the selection of a larger control group (over-sampling) in
more diverse campuses. Our results are robust to the use of various sampling weights. We do not, however, use
non-response weights.

11
Wisconsin System before their stated first term of college. In addition, for the first cohort, we use
data from students’ pre-treatment federal applications for student financial aid (FAFSA) to
examine whether the treatment and control group were similar at baseline. We also examine
equivalence in the composition of the aid packages for two subsamples of cohort one.
Re-enrollment and degree completion. We measure whether and where a student is
enrolled in college each semester two ways. First, for all four cohorts we rely on data from the
University of Wisconsin System, which records all enrollments at the 13 universities and 13 two-
year branch campuses in that system. Second, for the first cohort we also use data from the
National Student Clearinghouse (NSC), a centralized reporting system that collects publicly
available directory information obtained from the colleges and universities attended by 92
percent of American undergraduates, to estimate impacts on transfer. All public universities in
Wisconsin participate in the NSC.17
We combine enrollment and degree attainment into a single
persistence measure since only three percent of students completed a degree in the three years
observed.18
Additionally, although we know from state administrative records that all 1500
students were enrolled in fall 2008, 34 do not show up in the NSC records as having been
enrolled. Data missingness is orthogonal to treatment; for more information on this, see
Goldrick-Rab and Harris (2010).
Credit completion and grade point average. For all cohorts, we observe credits and
grades as measured by the University of Wisconsin System (though for the first cohort we only
observe this for the two subsamples). 19
Of course, if students differentially left the system, these
analyses might be subject to bias, but estimates based on the first cohort suggest that there was
no impact of the treatment on transfer rates outside of the System (Appendix A1). We report
grade point average for enrolled students, and for students who are not enrolled, we use the GPA
17 Only 12 colleges in Wisconsin who participate in the IPEDS did not participate in the NSC as of 2008-2009. The
largest of these is Herzing University, a for-profit institution with a student enrollment of under 1,500. Total
enrollment at these 12 schools (none of which are public institutions) is just over 7,000 students. 18
We also calculated an alternative measure that simply measured degree attainment. Since the results do not differ,
we use the combined persistence-degree attainment measure in our analyses. 19
In order to observe completed credits and GPA, a student must have registered for and completed a credit and
passed the class with a D or above. Credits for pass/fail classes, which are not included in GPA calculations, are not
recorded with this measure. Credits derived from pre-college enrollment, including Advanced Placement tests, are
also not included.

12
from the last term enrolled, following Scott-Clayton (2011), while recognizing that estimation of
causal effects on GPA is not as straightforward as with other academic outcomes.20
Financial aid and loan burden. Since the WSG program intends to increase the size of
students’ financial aid packages and reduce student debt, we compute term-specific total aid
received, the composition of the package including specific grant amounts, and all forms of debt
reported to the financial aid office. We observe this data for subsample B of the first cohort only.
E. Methods
We begin by estimating the impacts of offering the WSG to students on their academic
outcomes, using OLS regression, for each cohort and then across cohorts. We test for treatment
impacts on semester-to-semester retention (from the first semester in which treatment was
awarded, through the third semester—one year after treatment began), credit accumulation, and
GPA as well as cumulative outcomes such as the total number of credits attained, cumulative
GPA, the number of semesters enrolled, and transfer. Then we extend the analysis to look at
impacts over the second and third years of college, for the cohorts for which we can observe
those outcomes.
We run covariate-adjusted models for every analysis, including university fixed effects
for each cohort, as well as age, race, gender, dependency status, expected family contribution,
and parental education for the first cohort. However, all of the regressions testing for impacts on
financial aid and academic outcomes are presented without any covariates because the results are
very similar to the adjusted models.21
The experimental analyses are conducted in an intent-to-treat (ITT) framework, capturing
the effect of the program’s full interactions with students, which go beyond the simple receipt of
additional dollars of aid. We use this approach because only assignment to treatment is random,
20
Students can only have grades if they are enrolled; thus if the grant influences enrollment, then this could give the
false appearance that the program influenced GPA when in fact it may be that different students were enrolled and
had grades observed. 21
Covariate-adjusted estimates of impacts on academic and financial aid outcomes are presented in Appendices A5-
A9.

13
and in practice all financial aid requires bureaucratic program interactions—it is rarely the case
that aid is delivered directly into students’ hands.22
Most but not all students sent the WSG award letter responded to it; this may be due to
non-receipt, misunderstanding, or knowledge that they were in fact ineligible for the award. The
take-up rate was highest in the first cohort (92%) and diminished to 74% in the fourth cohort.23
If
the intervention is posited to exert positive impacts only through receipt, then the ITT estimates
understate the true program impact. Because we only observe take-up at the student level for the
first cohort, a treatment-on-treated (TOT) impact comparing treatment recipients to non-
recipients is only possible for that cohort. Moreover, the TOT estimate is biased if non-recipients
of the grant were affected; we have some reason to suspect that receipt of the award letter may
have impacted student behavior even when the grant dollars were not received. For this reason,
we estimate impacts on grades in the very first term for each cohort (see Table 2), noting that the
award letter itself may have affected student effort. Finally, we also focus on the ITT because
duration of the grant receipt was limited—there was a sharp drop-off after the second year of
college, mainly due to the continued requirement of Pell eligibility.24
Next, in order to understand how much additional financial aid students really received
from the treatment, we estimate impacts on students’ financial aid packages during the first three
years of college using OLS regression. In addition to estimating impacts on total financial aid
received, we test for differences in grant aid, loans, and work-study funds received by year.
These impacts are reported unconditional on enrollment in later years; conditioning on
enrollment yields a similar pattern of results (Appendix A8).25
Then, we conduct an instrumental variables analysis to examine the impact of the total
increase in financial aid resulting from program participation on subsequent enrollment.
22
The one known exception is the Performance-Based Scholarship Demonstration program led by MDRC, where in
some sites aid is delivered outside of the mandated aid system. The policy relevance of estimates from such
demonstrations is limited unless one expects fundamental changes to the aid delivery system. 23
According to the program’s Executive Director, this unexpected decline in take-up rates is likely due to turnover
among the institutional administrators tasked with identifying eligible students, communicating with them, and
distributing the award. 24
We observe this drop-off for the first cohort, and cannot examine it for the others—however, the rules were the
same for all cohorts. 25
We perform these analyses only for the first cohort, as we lack financial aid data for other cohorts.
14
Specifically, leveraging the experimentally induced increase in total aid and taking advantage of
the fact that treatment was assigned at random across 13 universities, we use site-specific
instruments to estimate the impact of each $1000 in additional aid received by students in their
first year of college, on their rates of retention in their second year. Following the work of Sean
Reardon and colleagues (Reardon and Raudenbush forthcoming; Raudenbush, Reardon, and
Nomi 2012; Reardon et al. 2012), as well as exemplars such as Kling, Liebman and Katz (2007),
in this case we believe a multiple site-multiple instrument approach is preferable to a site-fixed
effects IV model using a single instrument because it enhances precision by taking advantage of
variable impacts of the treatment on financial aid packages (the mediator) across universities.26
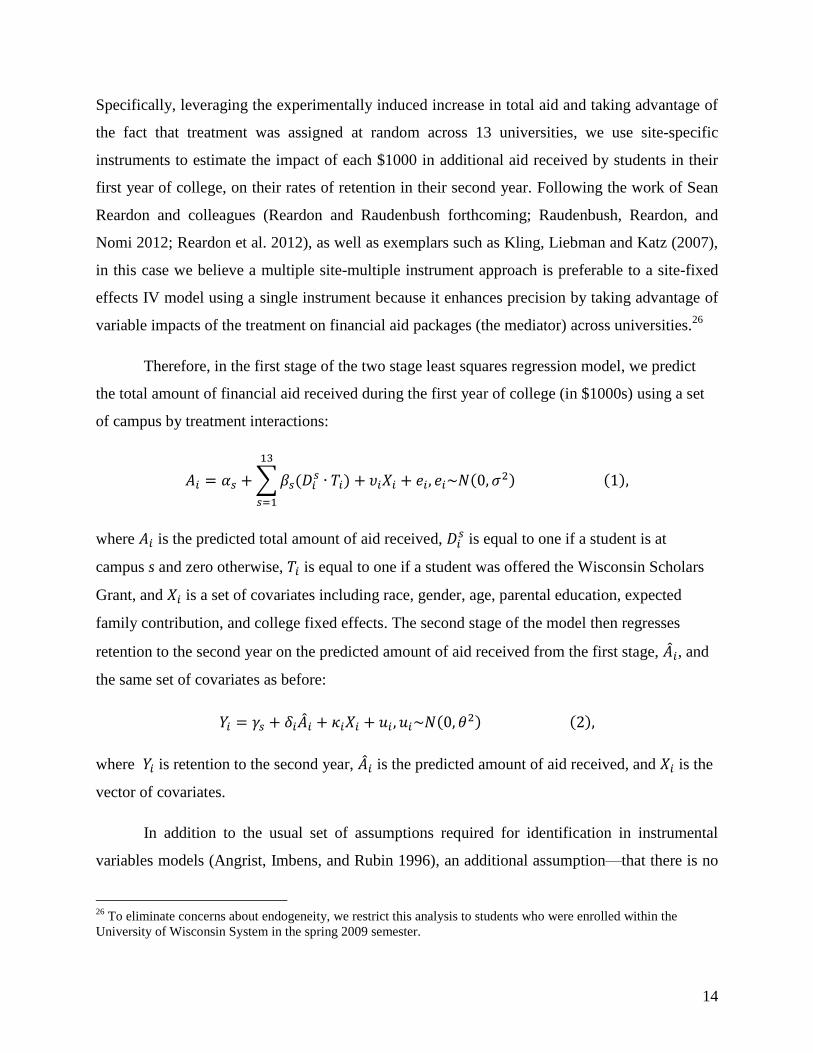
Therefore, in the first stage of the two stage least squares regression model, we predict
the total amount of financial aid received during the first year of college (in $1000s) using a set
of campus by treatment interactions:
∑
where is the predicted total amount of aid received, is equal to one if a student is at
campus s and zero otherwise, is equal to one if a student was offered the Wisconsin Scholars
Grant, and is a set of covariates including race, gender, age, parental education, expected
family contribution, and college fixed effects. The second stage of the model then regresses
retention to the second year on the predicted amount of aid received from the first stage, , and
the same set of covariates as before:
where is retention to the second year, is the predicted amount of aid received, and is the
vector of covariates.
In addition to the usual set of assumptions required for identification in instrumental
variables models (Angrist, Imbens, and Rubin 1996), an additional assumption—that there is no
26
To eliminate concerns about endogeneity, we restrict this analysis to students who were enrolled within the
University of Wisconsin System in the spring 2009 semester.

15
correlation between the site-average compliance rates and the site-average effects of the
mediator—is required (Raudenbush, Reardon, and Nomi 2012; Reardon and Raudenbush
forthcoming). We discuss this later in the paper.
F. Baseline Equivalence
If random assignment resulted in a good draw, recipients and non-recipients of the offer
of the WSG should be equivalent on observable and unobservable baseline characteristics at the
start of college (pre-treatment). We check for balanced allocation in every cohort and sample
with a series of tests using observable characteristics. Panel A of Table 1 reports means of
selected student characteristics for control students across all four cohorts, and Panel B does the
same for the first cohort’s subsamples. In each case, we present coefficients from OLS
regressions indicating whether and by how much the treatment group differed from the control
group.
The program did not block random assignment according to university, and thus the first
check on baseline equivalence we perform is to look at the distribution of students across
universities. In addition, we examine the percent of students with recorded enrollment in UW
System prior to treatment, and the number of terms enrolled during that time. Across the four
cohorts and 60 comparisons, we find that only two treatment differences are statistically
significant, and both are in cohort 3, suggesting that the treatment group had a higher incidence
of pre-treatment college enrollment compared to the control group. In addition to the individual
t-tests, we also report the results of an F-test of joint significance of all the observable measures
and fail to reject that they are jointly different from zero for any of the four cohorts.
We are able to perform far more extensive checks for the first cohort, and we find that of
the 33 independent comparisons in Table 1, only two are statistically different and present only
in subsample B. But again, the F-test suggests the treatment and control groups are equivalent.
Rates of missing data are quite similar between the control and treatment groups, as evidenced
by the very comparable proportion assigned to treatment in each subsample.
II. IMPACTS ON ACADEMIC AND FINANCIAL AID OUTCOMES
A. Average Treatment Impacts on Academic Outcomes

16
The WSG program began several weeks after students’ first semester of college started,
and thus we estimate program impacts on college retention, credit completion, and grade point
average across all four cohorts and for up to six semesters. We examine a total of three years of
outcomes for cohorts 1 and 2, two years for cohort 3, and one year for cohort 4. We first display
short-term academic impacts (from the first semester until the third—a year after treatment was
initiated) in Table 2, and then display longer-term academic impacts (for the fourth through sixth
semesters, and cumulative impacts) in Table 3.
There is some indication that the program’s impact began as soon as students were
notified that they were chosen for the WSG. This intervention, even prior to the actual
appearance of the new financial resources, seems to have very modestly boosted students’
academic performance and slightly increased their number of completed credits during the first
term of college (Table 2). The estimated program impacts grew stronger in the second term,
after the funds were distributed. The pooled estimates suggest that the offer of the WSG
increased retention in that term from just over 93% to about 95%, and also increased the percent
of students completing at least 12 credits from 79 to 81.4%. The impacts appear to persist
through the following fall, when just 81.7% of the control group returned for a second year of
college, compared to 84.2% of the treatment group. The point estimates for all of these impacts
are quite consistent across cohorts.
Over time, treatment impacts appear to fade (see Table 3). The estimated impact on
retention grows weaker and becomes non-significant by semester four, and there are no
detectable effects by the third year of college. We explore potential reasons for this in the next
section.27
Finally, we consider the possibility that some of our estimates are subject to ceiling
effects operating at institutions where retention and achievement were already quite high,
independent of treatment (specifically, universities where the rates of retention to the second year
of college exceeded 90 percent for the control group). As Table 4 illustrates, we find that the
27
Since these estimates only consider enrollment within the UW System, we also estimated impacts on transfer
outside of the System for the first cohort using National Student Clearinghouse data. While about one in four
students transferred, and 16 percent did so by leaving the system, there were no discernible differences according to
whether or not students were offered the WSG (see Appendix A1) and thus we do not believe that this data
restriction affects the estimated impacts of the grant on re-enrollment.

17
positive impacts of treatment on retention and credits are only clearly distinguishable from zero
at those universities where there was room for growth.28
For example, treatment increased
retention to the second year of college from 78.6 to 82% at the ten universities we designate as
having lower average retention, but did not appear to cause a change in the 92.8% retention rate
at the other three universities where retention on average is higher. To be clear, we are not
suggesting that the treatment impacts are necessarily heterogeneous—the group differences are
not statistically significant—but rather that the presence of ceiling effects at some universities
may mute the estimated average treatment impacts.
B. Impacts on Financial Aid Received
Given these modest and variable impacts of offering students the $3,500 WSG, we next
turn to an examination of how much additional financial aid they actually received as a result of
treatment. Table 5, Panel A shows that pre-treatment, students in the first cohort received just
over $11,000 in financial aid, including $6,739 in grants and almost $3,800 in loans.29
That
amount should immediately increase during the second term of college, for students assigned to
treatment, though in some cases the net increase should be affected by reductions in existing aid.
Comparing the financial aid packages of treatment and control students at the end of the first
year of college reveals that assignment to treatment (the $3,500 grant offer) induced a $1,471
increase in total financial aid (conditioning on enrollment in the second term yields an increase
of $1,545).30
The average total increase in aid resulting from the WSG was $3,214 rather than
$3,500 due to the 92.8% takeup rate, and just over $1,100 in loans were crowded out. Moreover,
as Panel B shows, because of crowd out, and high rates of ineligibility for grant renewal after the
first year (25% of students lost the grant after year one), the treatment and control groups had the
same amount of total financial aid after the first year of college. While the treatment group had
more than $1,000 in additional grant aid, the control group had more loans. The net effect was
that even with the addition of the $3,500 grant, the two groups had equivalent amounts of aid
28
We show baseline equivalence tests for these two groups in Appendix A2 and tests for impacts on cohort 1 only in
Appendix A4. 29
This is based on 645 of 828 students from subsample B. We received pre-treatment financial aid data from ten of
thirteen campuses, and there is a small amount of missing data within these campuses. 30
Ideally we would prefer to compare the aid packages immediately following treatment, but we do not observe
those for the control group.

18
with which to finance college, and Table 3 suggests that this resulted in no impact on college
retention rates.
To explore further the potential that crowd-out of existing financial aid ameliorated the
potential positive benefits of the WSG, we next re-estimate treatment impacts according to
whether the student attended a university where the WSG was often re-packaged to displace
loans. Specifically, using the site variation in treatments impacts on total financial aid displayed
in Table 7, Panel A, we distinguish between universities where students saw treatment impacts
on total aid of less than $1,000 and those where treatment led to at least a $1,000 increase in total
aid. This variation is largely attributable to (a) differences in how campuses packaged students’
financial aid awards after receiving the WSG, and (b) the amount of unmet need students had
prior to receiving the grant (which is affected by both the institution’s cost of attendance and
students’ willingness to accept loans). Table 6 shows the results, which suggest that all of the
estimated positive treatment impacts on retention, credits, and grades accrued to students
attending universities where the WSG resulted in at least a $1,000 increase in total financial aid
by not crowding out loans.31
This would seem to indicate that, at least in the short term, students
benefit from the increased monetary resources associated with loans. It is too early to tell if
students who saw their loans displaced by the program benefitted over the longer-term in other
ways.
C. Instrumental Variables Estimates
Given the indication from the experimental analyses that modest treatment impacts on
academic outcomes are associated with modest increases in total financial aid, we explore the
mediating influence of the actual total amount of aid students held during their first year of
college. In other words, we examine whether assignment to treatment induced an increase in the
total amount of aid students received in year one, which then affected their decision to enroll in
year two. To estimate this impact of a mediator not assigned at random, we take advantage of
the large amount of university-level variation in the treatment impact in total aid, which ranges
from near zero to nearly $3,000 (Table 7).
31
We show baseline equivalence tests for these two groups in Appendix A3.

19
Table 7 presents the OLS and IV estimates of the effects of total financial aid on retention
to the second year of college. We use university by treatment variation to instrument for the total
aid students received during their first year of college. The OLS estimate indicates that the
impact of an additional $1,000 in financial aid generated at best a 1.0 percentage point increase
in second year retention rates, but we cannot confirm that the true effect is different from zero.
The corresponding IV estimate is much larger, 2.8 percentage points, and is statistically
significant. This suggests a substantial amount of endogenous variation in students’ financial aid
packages (with needier students getting more financial aid) that downwardly biases the OLS
estimates. This estimated effect is consistent with estimates from the quasi-experimental
literature of the effects of aid on persistence (Bettinger 2011).
We also estimate impacts for the subset of ten universities where there was room for
improvement in retention (control group retention rates below 90 percent). The OLS estimate
for that group is 1.1 percentage points, and the IV estimate is even larger at 4.1 percentage points
(Table 7, Panel B).
Of course, this IV multi-site approach to estimating the average treatment effect rests on
several assumptions. For example, one key to our identification strategy is the assumption that
random assignment is a strong instrument for the mediator. The F statistic (8.56) suggests this
requirement is met. In addition, we must invoke the exclusion restriction, and fortunately can
partially test it because our dataset includes information on other hypothesized mediators. Table
8 illustrates the results of an analysis in which we estimate treatment impacts (the stage 1
equation) on the number of hours students worked, their degree expectations, and their self-
reported mental health. We find no evidence that these factors were affected by assignment to
treatment.
Furthermore, we must also assume that there is no correlation between the effect of
treatment on the mediator and the effect of the mediator on retention (this assumption is the
continuous-mediator analogue to the no-defier assumption for binary mediators). This
assumption would be violated if financial aid officers increased total aid more for those students
who they deemed more likely to benefit from the treatment. This is unlikely since financial aid
officers are constrained by a set of federal and state rules regarding aid packaging. However, it
remains possible that the IV estimate is biased if the same result occurred through students’

20
preferences and actions. We cannot rule out this possibility, and thus the results should be
interpreted with that caveat in mind.
III. CONCLUSION
Financial aid has long been evaluated for its effectiveness at promoting college
attendance. But the utility of college at promoting social mobility hinges on students completing
years of college credits, and facilitating college persistence among students from low-income
families appears to require offsetting the growing costs associated with college attendance.
Need-based financial grants are a popular mechanism with which to lower those costs. In this
analysis, we provide new evidence that in doing so they are modestly effective at inducing
students to remain enrolled, earn slightly more credits, and get somewhat better grades—and that
these effects are likely stronger when students receive more aid. Unlike most prior studies of
need-based grants, our estimates are based on a randomized experiment with four cohorts of
students, and yet we note that the estimated impacts are quite comparable to those obtained from
Bettinger’s work with both the federal Pell Grant (2004) and an Ohio program (2010).
The estimated effects of aid seem to accrue to all financial aid dollars – whether they
come from grants or loans. In other words, it seems that in terms of promoting college
persistence, Pell recipients benefit from having more dollars in hand during college, even though
down the road it means they will have more debt as well. These potentially countervailing
effects deserve more inquiry and consideration, as families increasingly rely on loans to finance
college.
The usefulness of replicating experimental work with real life programs as they evolve is
also worthy of further consideration. Monetary interventions are rarely simple drops of cash
from the sky; instead they reach their recipients through a process, one in which can affect the
monetary and non-monetary value of the money. Programs are often slow to evolve, and while
this one changed a bit over time, the most meaningful alterations are now occurring. For
example, the WSG no longer requires that students continue to be Pell-eligible to receive the
grant, an effort to increase the duration of receipt. Examining effects across multiple cohorts
helped to provide a sense of the reliability of the results, the degree to which the validity of the
estimates are sensitive to statistical power (these impacts are objectively small, and require large
21
sample sizes to detect), and provide some space to consider how program implementation relates
to effectiveness.
Finally, this analysis suggests that efforts to improve persistence rates among
economically disadvantaged students would benefit from changes to the rules regarding financial
aid packaging. Programs like the WSG commonly observe their philanthropic dollars supplant
government dollars, and while this may promote greater equity among financial aid recipients, it
may not be the most efficient approach. A closer examination of how packaging practices vary
across institutions may yield greater insights into which changes would be most effective.
Author Affiliations
Sara Goldrick-Rab is Associate Professor of Educational Policy Studies and Sociology at the
University of Wisconsin-Madison.
Douglas Harris is Associate Professor of Economics and University Endowed Chair in Public
Education at Tulane University.
Robert Kelchen is a doctoral candidate in Educational Policy Studies at the University of
Wisconsin-Madison.
James Benson is a program officer at the Institute for Education Sciences.

22
REFERENCES
Amos, Lauren, Amy Windham, Iliana Brodziak de los Reyes, Wehmah Jones, and Virginia
Baran. 2009. “Delivering on the Promise: An Impact Evaluation of the Gates Millennium
Scholars Program.” Washington, DC: American Institutes for Research.
Angrist, Joshua D., Guido W. Imbens, and Donald B. Rubin. 1996. “Identification of Causal
Effects Using Instrumental Variables.” Journal of the American Statistical Association, 91(434):
444-55.
Angrist, Joshua D., Daniel Lang, and Philip Oreopoulos. 2009. “Incentives and Services for
College Achievement: Evidence from a Randomized Trial.” American Economic Journal:
Applied Economics, 1(1): 136-63.
Angrist, Joshua D., Philip Oreopoulos, and Tyler Williams. 2010. “When Opportunity
Knocks, Who Answers? New Evidence on College Achievement Awards.” NBER Working
Paper 16643.
Bailey, Martha J. and Susan Dynarski. 2011. “Inequality in Postsecondary Education.” In
Wither Opportunity?”, ed. Greg Duncan and Richard Murnane, 117-132. New York, NY:
Russell Sage Foundation.
Baum, Sandy and Kathleen Payea. 2011. “Trends in Student Aid.” Washington, DC: The
College Board.
Bettinger, Eric P. 2004. “How Financial Aid Affects Persistence.” In College Choices: The
Economics of Where to Go, When to Go, and How To Pay for It, ed. Caroline Hoxby, 207-37.
Chicago, IL: University of Chicago Press.
Bettinger, Eric P. 2010. “Need-Based Aid and Student Outcomes: The Effects of the Ohio
College Opportunity Grant.” http://www.sesp.northwestern.edu/docs/need-based-aid-why.pdf.

23
Bettinger, Eric P. 2011. Financial Aid: A Blunt Instrument for Increasing Degree Attainment.
Washington, D.C.: American Enterprise Institute.
Bloom, Howard S. 2005. Learning More from Social Experiments: Evolving Analytic
Approaches. New York, NY: Russell Sage.
Bound, John, and Sarah Turner. 2002. “Going to War and Going to College: Did World War
II and the G.I. Bill Increase Educational Attainment for Returning Veterans?” Journal of Labor
Economics, 20(4): 784-815.
Bowen, William G., Matthew M. Chingos, and Michael S. McPherson. 2009. Crossing the
Finish Line: Completing College at America’s Public Universities. Princeton, NJ: Princeton
University Press.
Cellini, Stephanie R. 2008. “Causal Inference and Omitted Variable Bias in Financial Aid
Research: Assessing Solutions.” Review of Higher Education, 31(3): 329.
Center on Wisconsin Strategy. 2010. “Wisconsin Jobs and Low-Income Working Families.”
Retrieved September 19, 2012 from http://www.workingpoorfamilies.org/pdfs/comprehenvie_rp-
LIWF.pdf
Deming, David, and Susan Dynarski. 2010. “Into College, Out of Poverty? Policies to Increase
the Postsecondary Attainment of the Poor.” In Targeting Investments in Children: Fighting
Poverty When Resources are Limited, ed. Philip Levine and David Zimmerman, 283-302.
Chicago, IL: University of Chicago Press.
DesJardins, Stephen L., Dennis A. Ahlburg, and Brian P. McCall. 2002. “Simulating the
Longitudinal Effects of Changes in Financial Aid on Student Departure from College.” The
Journal of Human Resources, 37(3): 653-79.

24
Dynarski, Susan. 2003. “Does Aid Matter? Measuring the Effects of Student Aid on College
Attendance and Completion.” American Economic Review, 93(1): 279–88.
Dynarski, Susan, and Judith Scott-Clayton. 2007. “The Feasibility of Streamlining Aid for
College Using the Tax System.” National Tax Association Papers and Proceedings, 99: 250-62.
Goldin, Claudia, and Lawrence F. Katz. 2008. The Race Between Education and Technology.
Cambridge, MA: Harvard University Press.
Goldrick-Rab, Sara, and Douglas N. Harris. 2010. “Observations on the Use of NSC Data for
Research Purposes.”
http://www.finaidstudy.org/documents/NSC%20Dear%20colleagues%20letter.pdf.
Goldrick-Rab, Sara, Douglas N. Harris, and Philip A. Trostel. 2009. “How and Why
Financial Aid Does (or Doesn’t) Matter for College Success.” In Higher Education: Handbook
of Theory and Research (Vol. 24), ed. John C. Smart, 1-45.
Hansen, W. Lee. 1983. “Impact of Student Financial Aid on Access.” Proceedings of the
Academy of Political Science, 35(2): 84-96.
Harris, Douglas.N., and Sara Goldrick-Rab. 2012. “Improving the Productivity of Education
Experiments: Lessons from a Randomized Study of Need-Based Financial Aid.” Educational
Finance and Policy, 7(2): 143-69.
Heckman, James J. 2005. “Rejoinder: Response to Sobel.” Sociological Methodology, 35(1):
135-62.
Heckman, James J., Lance J. Lochner, and Petra E. Todd. 2008. “Earnings Functions and
Rates of Return.” Journal of Human Capital, 2(1): 1-31.

25
Kane, Thomas J. 1994. “College Entry by Blacks since 1970: The Role of College Costs.
Family Background, and the Returns to Education.” The Journal of Political Economy, 102(5):
878-911.
Kane, Thomas J. 1995. “Rising Public College Tuition and College Entry: How Well Do Public
Subsidies Promote Access to College?” NBER Working Paper 5164.
Kane, Thomas J. 2007. “Evaluating the Impact of the D.C. Tuition Assistance Grant Program.”
Journal of Human Resources, 42(3): 555-82.
Kane, Thomas J. and Cecilia E. Rouse. 1995. “Labor-Market Returns to Two- and Four-Year
College.” The American Economic Review, 85(3): 600-14.
Kling, Jeffrey R., Jeffrey B. Liebman, and Lawrence F. Katz. 2007. “Experimental Analysis
of Neighborhood Effects.” Econometrica, 75(1), 83-119.
Light, Audrey, and Wayne Strayer. 2000. “Determinants of College Completion: School
Quality or Student Ability?” Journal of Human Resources, 35(2): 299-332.
Long, Bridget T. 2012. “The Financial Crisis and Declining College Affordability: How Have
Students and Their Families Responded?
http://conference.nber.org/confer//2012/GRHEf12/Long.pdf
McPherson, Michael S., and Morton O. Shapiro. 1991. Keeping College Affordable:
Government and Educational Opportunity. Washington, D.C.: Brookings Institution.
Patel, Reshma, and Lashawn Richburg-Hayes. 2012. Performance-Based Scholarships:
Emerging Findings from a National Demonstration. New York, NY: MDRC.

26
Paulsen, Michael B., and Edward P. St. John. 2002. “Social Class and College Costs:
Examining the Financial Nexus between College Choice and Persistence.” The Journal of
Higher Education, 73(2): 189–236.
Pope, Emily. 2010. “An Overview of Student Financial Aid.” August 17. Presentation to the
Wisconsin Legislative Council Study Committee on Student Financial Aid Programs.
Raudenbush, Stephen W., Sean F. Reardon, and Takako Nomi. 2012. “Statistical Analysis
for Multisite Trials Using Instrumental Variables With Random Coefficients.” Journal of
Research on Educational Effectiveness, 5(3): 303-32.
Reardon, Sean F. and Stephen W. Raudenbush. (forthcoming). “Under What Assumptions do
Site-by-Treatment Instruments Identify Average Causal Effects?” Sociological Methods and
Research. http://cepa.stanford.edu/content/under-what-assumptions-do-site-treatment-
instruments-identify-average-causal-effects
Reardon, Sean F., Faith Unlu, Pei Zhu, and Howard Bloom. 2012. “Bias and Bias Correction
in Multi-Site Instrumental Variables Analysis of Heterogeneous Mediator Effects.”
http://cepa.stanford.edu/content/bias-and-bias-correction-multi-site-instrumental-variables-
analysis-heterogeneous-mediator-effects
Scott-Clayton, Judith. 2011. “On Money and Motivation: A Quasi-Experimental Analysis of
Financial Incentives for College Achievement.” Journal of Human Resources, 46(3): 614-46.
Seftor, Neil S., and Sarah E. Turner. 2002. “Back to School: Federal Student Aid Policy and
Adult College Enrollment.” Journal of Human Resources, 37(2): 336-52.
Singell, Larry D. 2004. “Come and Stay a While: Does Financial Aid Effect Enrollment and
Retention at a Large Public University?” Economics of Education Review, 23(5): 459-71.

27
Singell, Larry, and Mark Stater. 2006. “Going, Going, Gone: The Effects of Aid Policies on
Graduation at Three Large Public Institutions.” Policy Science, 39(4): 379-403.
Stater, Mark. 2009. “The Impact of Financial Aid on College GPA at Three Flagship Public
Institutions.” American Educational Research Journal, 46(3): 782-815.
Stinebrickner, Todd R., and Stinebricker, Ralph. 2003. “Understanding Educational
Outcomes of Students from Low-Income Families,” Journal of Human Resources 38(3): 591-
617.
Tukey, John W. 1962. “The Future of Data Analysis.” The Annals of Mathematical Statistics,
33(1): 1-67.
van der Klaauw, Wilbert. 2002. “Estimating the Effect of Financial Aid Offers on College
Enrollment: A Regression-Discontinuity Approach.” International Economic Review, 43(4):
1249-88.

28
Table 1. Baseline Equivalence Tests.
Panel 1A. Baseline Equivalence by Cohort.
Characteristic
Distribution of initial attendance (pct)
University 1 6.7 0.3 8.0 -1.1 7.7 -1.0 7.5 -1.0
(1.8) (1.2) (1.1) (1.1)
University 2 6.7 -0.1 5.8 0.0 6.0 -0.8 6.1 0.0
(1.5) (1.1) (1.0) (1.0)
University 3 6.0 0.3 10.5 0.2 8.1 0.5 7.1 0.7
(1.3) (1.5) (1.3) (1.2)
University 4 5.2 -0.7 5.6 -0.1 5.0 1.3 5.6 0.3
(1.5) (1.1) (1.1) (1.0)
University 5 6.9 0.3 6.5 -0.0 6.9 -0.8 7.4 -0.1
(1.6) (1.2) (1.1) (1.1)
University 6 7.6 0.6 8.5 0.4 8.5 0.6 8.6 -0.7
(1.7) (1.4) (1.3) (1.2)
University 7 13.7 1.0 9.4 0.1 8.6 -1.9 9.0 -0.7
(2.2) (1.4) (1.2) (1.2)
University 8 4.9 -0.2 5.1 -0.5 4.0 -0.1 3.4 0.7
(1.6) (1.0) (0.9) (0.8)
University 9 1.3 -0.3 1.3 0.3 1.5 -0.6 1.4 -0.1
(0.5) (0.6) (0.5) (0.5)
University 10 10.3 -1.2 8.9 -0.0 9.9 -1.0 9.3 0.8
(1.9) (1.4) (1.3) (1.3)
University 11 18.4 -1.1 19.2 -1.0 21.5 2.5 24.6 -1.2
(2.2) (1.9) (1.9) (1.8)
University 12 6.2 0.4 5.1 0.2 3.9 0.0 3.9 0.9
(1.2) (1.1) (0.9) (0.9)
University 13 6.1 0.7 5.4 1.3 7.9 1.9 5.7 0.4
(1.7) (1.2) (1.3) (1.0)
Prior enrollment (pct) 9.1 2.2 8.1 (0.8) 11.8 3.9** 8.5 -0.5
(2.2) (1.4) (1.6) (1.2)
Terms enrolled 0.16 0.03 0.11 0.01 0.20 0.14*** 0.11 0.01
(0.04) (0.02) (0.04) (0.02)
P-value from F-test
Sample Size 692 475 3582 495 4280 540 4168 615
SOURCE: University of Wisconsin System.
1.000 0.997 0.301 0.983
Control
Mean
Treatment
Difference
Cohort 1 Cohort 2 Cohort 3 Cohort 4
Treatment
Difference
Treatment
Difference
Control
Mean
Control
Mean
Treatment
Difference
Control
Mean

29
Characteristic
Gender (percent female) 56.7 1.6 55.9 5.0 59.6 3.6
(2.8) (3.1) (3.6)
Targeted minority (pct, self-report) 25.2 0.2 22.4 1.6 22.4 1.6
(2.7) (3.0) (3.0)
Average age (years) 18.25 0.00 18.25 0.01 18.24 0.03
(0.03) (0.03) (0.04)
First in family to attend college (pct) 53.6 -0.6 55.0 -2.6 53.7 0.0
(2.9) (3.2) (3.9)
Father has an AA or higher (pct) 28.3 2.0 27.4 2.9 29.3 1.0
(2.8) (3.1) (3.7)
Mother has an AA or higher (pct) 35.9 1.9 33.7 4.7 33.3 4.2
(2.9) (3.2) (3.8)
Financially dependent on parents (pct) 97.0 0.4 96.9 0.7 96.8 0.9
(0.9) (1.0) (1.2)
Expected family contribution ($) 1,607 60 1,609 49 1,631 83
(128) (147) (174)
Zero expected family contribution (pct) 31.7 -2.7 32.7 -3.3 33.9 -8.3**
(2.5) (2.9) (3.4)
Parent(s)' adjusted gross income ($) 29,437 1,203 29,014 1,352 28,646 2,908**
(1,009) (1,136) (1,361)
Parent(s)' investment net worth ($) 5,644 -1,110 5,231 -880 5,691 -791
(744) (826) (1,034)
P-value from global F-test 0.658
Sample Size 900 600 692 475 471 357
SOURCES: Data come from a student's 2008 FAFSA except for race, which is self-reported on a survey.
Notes:
(1) Standard errors from the regression are listed below the regression coefficients.
(2) We cannot identify universities in the sample by name due to data agreements.
(8) * represents p<.10, ** represents p<.05, and *** represents p<.01.
Control
Mean
Treatment
Difference
0.260
(5) Targeted minority groups include: African-Americans, Latinos, Southeast Asians, Native
Americans, and multiracial. "Targeted" refers to a policy of the University of Wisconsin System, in
which all sample participants began college.
Control
Mean
Treatment
Difference
Control
Mean
Treatment
Difference
(7) Parent investments (dependents only) had few extreme values with undue influences and were
Winsorized at the 95th percentile (Tukey, 1962).
0.197
(6) The global F-test (panel B) includes all above measures except race.
(3) Cohort 1 had 2557 students in the control group and 600 in the treatment group, but due to data
agreements we are unable to observe the full sample.
(4) Prior enrollment measures any enrollment history in the University of Wisconsin System prior to
the beginning of the first semester of college.
Full Sample Subsample A
Panel 1B. Sample Characteristics and Baseline Equivalence of Cohort 1 Students (Fall 2008) by
Assignment to Treatment.
Subsample B

30
Table 2. Short-Term Academic Impacts by Semester and Cohort.
Panel 2A. Short-Term Academic Impacts by Cohort.
Semester 1 (treatment began)
Credits earned 13.9 0.2 13.7 -0.0 13.7 0.2 13.8 0.2*
(0.2) (0.1) (0.1) (0.1)
Earned 12+ credits (pct) 87.9 0.6 88.6 1.5 87.4 0.5 92.2 1.3
(2.0) (1.4) (1.5) (1.1)
Cumulative GPA 2.52 0.08 2.66 0.08* 2.69 0.11*** 2.76 0.03
(0.06) (0.04) (0.04) (0.04)
Semester 2
Retention (pct) 93.4 1.4 93.7 1.2 93.0 2.5*** 93.4 1.4
(1.5) (1.1) (1.0) (1.0)
Credits earned 12.0 0.3 12.7 0.2 12.6 0.4** 12.8 0.4**
(0.3) (0.2) (0.2) (0.2)
Earned 12+ credits (pct) 73.5 1.1 80.0 0.9 78.6 5.5*** 81.3 3.8**
(2.7) (1.9) (1.7) (1.6)
Cumulative GPA 2.48 0.07 2.62 0.06 2.64 0.09** 2.70 0.04
(0.06) (0.04) (0.04) (0.04)
Semester 3
Retention (pct) 80.4 2.6 82.8 2.8* 81.4 2.6 -- --
(2.4) (1.7) (1.7)
Credits earned 10.6 0.3 11.2 0.3 10.9 0.5* -- --
(0.4) (0.3) (0.3)
Earned 12+ credits (pct) 65.2 2.8 69.4 2.1 67.9 3.4 -- --
(3.0) (2.2) (2.1)
Cumulative GPA 2.46 0.07 2.62 0.04 2.63 0.09** -- --
(0.06) (0.04) (0.04)
Sample Size 692 475 3582 495 4280 540 4168 615
Cohort 3 Cohort 4
Control
Mean
Treatment
Impact
Control
Mean
Treatment
Impact
Cohort 1 Cohort 2
Control
Mean
Treatment
Impact
Control
Mean
Treatment
Impact

31
Panel 2B. Short-Term Academic Impacts on Four Cohorts (2008-2011).
Semester 1 (treatment began)
Credits earned 13.8 0.2**
(0.1)
Earned 12+ credits (pct) 89.2 1.0
(0.7)
Cumulative GPA 2.68 0.06***
(0.02)
Semester 2
Retention (pct) 93.4 1.7***
(0.5)
Credits earned 12.6 0.3***
(0.1)
Earned 12+ credits (pct) 79.0 2.4***
(0.9)
Cumulative GPA 2.63 0.05**
(0.02)
Semester 3
Retention (pct) 81.7 2.5**
(1.1)
Credits earned 11.0 0.3**
(0.2)
Earned 12+ credits (pct) 67.9 2.4*
(1.3)
Cumulative GPA 2.59 0.05**
(0.02)
Sample Size 12722 2125
SOURCE: University of Wisconsin System.
Notes:
(1) Standard errors from the regression are listed below the regression coefficients.
(4) We only have two semesters of data for cohort 4.
(5) * represents p<.10, ** represents p<.05, and *** represents p<.01.
(3) If a student was not enrolled in a given semester, the cumulative GPA from the
previous semester is reported.
(2) Retention includes any of the 13 four-year University of Wisconsin System universities, as well as
the 13 two-year University of Wisconsin Colleges.
Control
Mean
Treatment
Impact

32
Table 3. Longer-Term Academic Impacts by Semester and Cohort.
Panel 3A. Longer-Term Academic Impacts by Cohort.
Semester 4
Retention (pct) 75.6 1.9 78.1 1.3 77.4 2.4 -- --
(2.7) (1.9) (1.8)
Credits earned 9.9 -0.1 10.3 0.5* 10.2 0.3 -- --
(0.4) (0.3) (0.3)
Earned 12+ credits (pct) 62.5 -3.9 64.2 5.1** 62.5 1.6 -- --
(3.1) (2.2) (2.2)
Cumulative GPA 2.46 0.07 2.61 0.04 2.62 0.10*** -- --
(0.06) (0.04) (0.04)
Semester 5
Retention (pct) 71.2 0.0 73.2 1.4 -- -- -- --
(2.9) (2.1)
Credits earned 9.0 0.3 9.6 0.3 -- -- -- --
(0.4) (0.3)
Earned 12+ credits (pct) 53.3 2.7 59.2 3.2 -- -- -- --
(3.1) (2.3)
Cumulative GPA 2.47 0.06 2.63 0.04 -- -- -- --
(0.06) (0.04)
Semester 6
Retention (pct) 69.3 -1.4 71.0 1.3 -- -- -- --
(2.9) (2.1)
Credits earned 8.8 -0.2 9.3 0.0 -- -- -- --
(0.4) (0.3)
Earned 12+ credits (pct) 55.9 -2.4 57.8 0.0 -- -- -- --
(3.1) (2.4)
Cumulative GPA 2.48 0.07 2.64 0.04 -- -- -- --
(0.06) (0.04)
Cumulative Outcomes
Credits completed 65.6 1.0 68.1 1.4 48.0 1.5** 26.7 0.6**
(1.8) (1.2) (0.7) (0.3)
12+ credits/sem (pct) 57.7 -2.2 59.7 2.7 65.3 2.1 83.2 3.8**
(3.1) (2.3) (2.1) (1.5)
Semesters enrolled 4.90 0.05 4.98 0.08 3.51 0.08** 1.93 0.02
(0.10) (0.08) (0.04) (0.01)
Cumulative GPA 2.48 0.07 2.64 0.04 2.62 0.10*** 2.70 0.04
(0.06) (0.04) (0.04) (0.04)
Sample Size 692 475 3582 495 4280 540 4168 615
Cohort 4
Control
Mean
Treatment
Impact
Control
Mean
Treatment
Impact
Control
Mean
Treatment
Impact
Control
Mean
Treatment
Impact
Cohort 1 Cohort 2 Cohort 3

33
Panel 3B. Longer-Term Academic Impacts on Four Cohorts (2008-2011).
Semester 4
Retention (pct) 77.3 1.7
(1.2)
Credits earned 10.2 0.2
(0.2)
Earned 12+ credits (pct) 63.1 1.0
(1.4)
Cumulative GPA 2.59 0.05**
(0.02)
Semester 5
Retention (pct) 72.5 0.4
(1.7)
Credits earned 9.4 0.2
(0.3)
Earned 12+ credits (pct) 57.1 2.2
(1.8)
Cumulative GPA 2.57 0.03
(0.03)
Semester 6
Retention (pct) 70.4 -0.2
(1.7)
Credits earned 9.1 -0.2
(0.3)
Earned 12+ credits (pct) 57.1 -1.2
(1.8)
Cumulative GPA 2.58 0.03
(0.03)
Cumulative Outcomes
Credits completed 49.2 2.3***
(0.6)
Cumulative GPA 2.63 0.05**
(0.02)
Sample Size 12722 2125
SOURCE: University of Wisconsin System.
Notes:
(1) Standard errors from the regression are listed below the regression coefficients.
(2) Sample sizes vary in panel B--the maximum sample size is presented.
(5) We only have four semesters of data for cohort 3 and two for cohort 4.
(6) * represents p<.10, ** represents p<.05, and *** represents p<.01.
(4) If a student was not enrolled in a given semester, the cumulative GPA from the
previous semester is reported.
(3) Outcomes include enrollment at any of the 13 four-year University of
Wisconsin System universities, as well as the 13 two-year University of Wisconsin
Colleges.
Control
Mean
Treatment
Impact

34
Table 4. Short-Term Academic Impacts by University Retention Rate.
p-value
Outcomes by Semester
Semester 1 (treatment began)
Credits earned 13.6 0.2*** 14.5 0.0 0.250
(0.1) (0.1)
Earned 12+ credits (pct) 87.5 1.2 95.5 0.3 0.499
(0.9) (1.0)
Cumulative GPA 2.58 0.07*** 3.02 0.02 0.233
(0.03) (0.04)
Semester 2
Retention (pct) 92.2 1.8*** 97.4 1.3** 0.564
(0.6) (0.6)
Credits earned 12.2 0.3*** 14.0 0.1 0.165
(0.1) (0.1)
Earned 12+ credits (pct) 75.6 2.7** 91.3 1.9 0.653
(1.1) (1.3)
Cumulative GPA 2.53 0.06*** 2.99 0.02 0.295
(0.02) (0.03)
Semester 3
Retention (pct) 78.6 3.4*** 92.8 -0.2 0.077
(1.3) (1.6)
Credits earned 10.4 0.4** 13.2 0.2 0.619
(0.2) (0.3)
Earned 12+ credits (pct) 63.4 3.4** 83.8 -0.3 0.188
(1.5) (2.3)
Cumulative GPA 2.48 0.06* 2.97 0.05 0.918
(0.03) (0.04)
Max Sample Size 9931 1678 2791 447
SOURCE: University of Wisconsin System.
Notes:
(1) Standard errors from the regression are listed below the regression coefficients.
(6) All four cohorts are pooled for semesters 1 and 2. Cohorts 1-3 are pooled for semester 3.
(7) * represents p<.10, ** represents p<.05, and *** represents p<.01.
(5) The p-values reported are a test of the difference in treatment impacts between low and high
retention campuses.
(2) Outcomes include enrollment at any of the 13 four-year University of Wisconsin System
universities, as well as the 13 two-year University of Wisconsin Colleges.
(3) If a student was not enrolled in a given semester, the cumulative GPA from the previous
semester is reported.
(4) Lower-retention campuses (n=10) had control group retention rates of less than 90 pct, while
higher-retention campuses (n=3) had control group retention rates of more than 90 pct.
Lower Retention Higher Retention
Diff. in
impacts
Control
Mean
Treatment
Impact
Control
Mean
Treatment
Impact

35
Table 5. Impacts on Financial Aid Packages over Three Years (Cohort 1).
Panel 5A: Financial Aid Packages Pre and Post Treatment, Conditional on Enrollment.
Total financial aid received ($) 11016.1 -194.3 12011.3 1544.7***
(261.3) (212.3)
Any grants or scholarships (pct) 99.1 0.1 100.0 -0.3
(0.8) (0.3)
Avg. amount of grant aid ($) 6739.7 -184.8 7809.2 2758.7***
(213.1) (212.9)
Wisconsin Scholars Grant (pct) -- -- 0.0 92.8***
(1.4)
Avg. amount of WSG ($) -- -- 0.0 3213.9***
(51.0)
Federal Pell Grant (pct) 98.0 1.2 99.9 -0.1
(1.0) (0.3)
Avg. amount of Pell ($) 3317.6 -74.5 3391.1 -159.0
(118.5) (101.1)
Any loans (pct) 82.0 -1.2 80.0 -6.0*
(3.3) (3.2)
Avg. amount of loans ($) 3779.9 -17.3 3991.8 -1139.8***
(186.9) (197.1)
Federal Work-Study (pct) 28.3 -0.8 17.4 -4.0
(3.8) (2.8)
Avg. amount of work study ($) 496.5 7.8 193.3 -71.8**
(70.1) (31.9)
Sample Size 378 267 453 341
End of Year
Control
Mean
Treatment
Difference
Pre-Treatment
Control
Mean
Treatment
Impact

36
Panel 5B: Impacts on Financial Aid Packages over Three Years, Unconditional on Enrollment.
Total financial aid received ($) 11825.7 1471.0*** 10463.7 613.8 9883.1 18.4
(221.9) (444.2) (547.7)
Any grants or scholarships (pct) 100.0 -0.3 80.7 -1.4 69.2 -1.7
(0.3) (3.0) (3.5)
Avg. amount of grant aid ($) 7667.0 2690.1*** 6138.2 1775.3*** 5653.2 1039.6**
(217.0) (370.0) (409.5)
Wisconsin Scholars Grant (pct) 0.0 92.4*** 0.0 67.5*** 0.0 49.2***
(1.4) (2.5) (2.7)
Avg. amount of WSG ($) 0.0 3143.4*** 0.0 2236.0*** 0.0 1653.5***
(52.6) (86.6) (91.9)
Federal Pell Grant (pct) 99.9 -0.1 75.7 -0.7 64.7 -1.2
(0.3) (3.2) (3.6)
Avg. amount of Pell ($) 3333.7 -161.9 3047.6 -198.7 2902.3 -251.5
(100.4) (158.2) (184.7)
Any loans (pct) 80.1 -6.4** 70.0 -8.0** 62.3 -9.7***
(3.1) (3.5) (3.7)
Avg. amount of loans ($) 3953.9 -1149.6*** 4036.6 -1071.9*** 3991.3 -965.7***
(191.8) (240.0) (273.5)
Federal Work-Study (pct) 17.1 -3.9 15.8 -3.8 11.2 -0.7
(2.7) (2.6) (2.3)
Avg. amount of work study ($) 188.4 -70.7** 205.0 -51.4 182.7 -43.3
(30.9) (37.2) (38.2)
Sample Size 470 356 470 356 470 356
Notes:
(1) Standard errors from the regression are listed below the regression coefficients.
(3) * represents p<.10, ** represents p<.05, and *** represents p<.01.
SOURCES: University of Wisconsin System universities (panel A), University of Wisconsin System
(panel B).
(2) The pre-treatment measures in panel A exclude students at three of 13 universities, where no
or insufficient data were provided, as well as small numbers of students at the other universities.
2009-2010 2010-20112008-2009
Control
Mean
Treatment
Impact
Control
Mean
Treatment
Impact
Control
Mean
Treatment
Impact

37
Table 6. Heterogeneity by University Financial Aid Package Response to Treatment.
p-value
Outcomes by Semester
Semester 1 (treatment began)
Credits earned 14.4 -0.0 13.5 0.3*** 0.032
(0.1) (0.1)
Earned 12+ credits (pct) 95.4 0.1 86.3 1.5 0.283
(0.9) (0.9)
Cumulative GPA 2.79 0.02 2.63 0.08*** 0.188
(0.04) (0.03)
Semester 2
Retention (pct) 94.4 0.7 92.9 2.2*** 0.188
(0.9) (0.6)
Credits earned 13.2 0.0 12.3 0.4*** 0.107
(0.2) (0.1)
Earned 12+ credits (pct) 84.8 1.9 76.3 2.8** 0.661
(1.5) (1.2)
Cumulative GPA 2.74 0.01 2.58 0.07*** 0.204
(0.03) (0.03)
Semester 3
Retention (pct) 84.2 0.4 80.6 3.5*** 0.170
(1.9) (1.3)
Credits earned 11.8 -0.1 10.6 0.6*** 0.094
(0.3) (0.2)
Earned 12+ credits (pct) 73.9 -1.0 65.0 4.1** 0.066
(2.3) (1.6)
Cumulative GPA 2.70 0.01 2.54 0.07** 0.193
(0.04) (0.03)
Max Sample Size 4039 660 8683 1465
SOURCE: University of Wisconsin System.
Notes:
(1) Standard errors from the regression are listed below the regression coefficients.
(6) All four cohorts are pooled for semesters 1 and 2. Cohorts 1-3 are pooled for semester 3.
(7) * represents p<.10, ** represents p<.05, and *** represents p<.01.
(2) Outcomes include enrollment at any of the 13 four-year University of Wisconsin System
universities, as well as the 13 two-year University of Wisconsin Colleges.
(3) If a student was not enrolled in a given semester, the cumulative GPA from the previous
semester is reported.
(4) Low change in aid campuses (n=5) had treatment impacts of aid of less than $1,000, while high
change in aid campuses (n=8) had treatment impacts of greater than $1,000.
(5) The p-values reported are a test of the difference in treatment impacts between low and high
change in aid campuses.
Diff. in
impacts
Low Change in Aid High Change in Aid
Control
Mean
Treatment
Impact
Control
Mean
Treatment
Impact
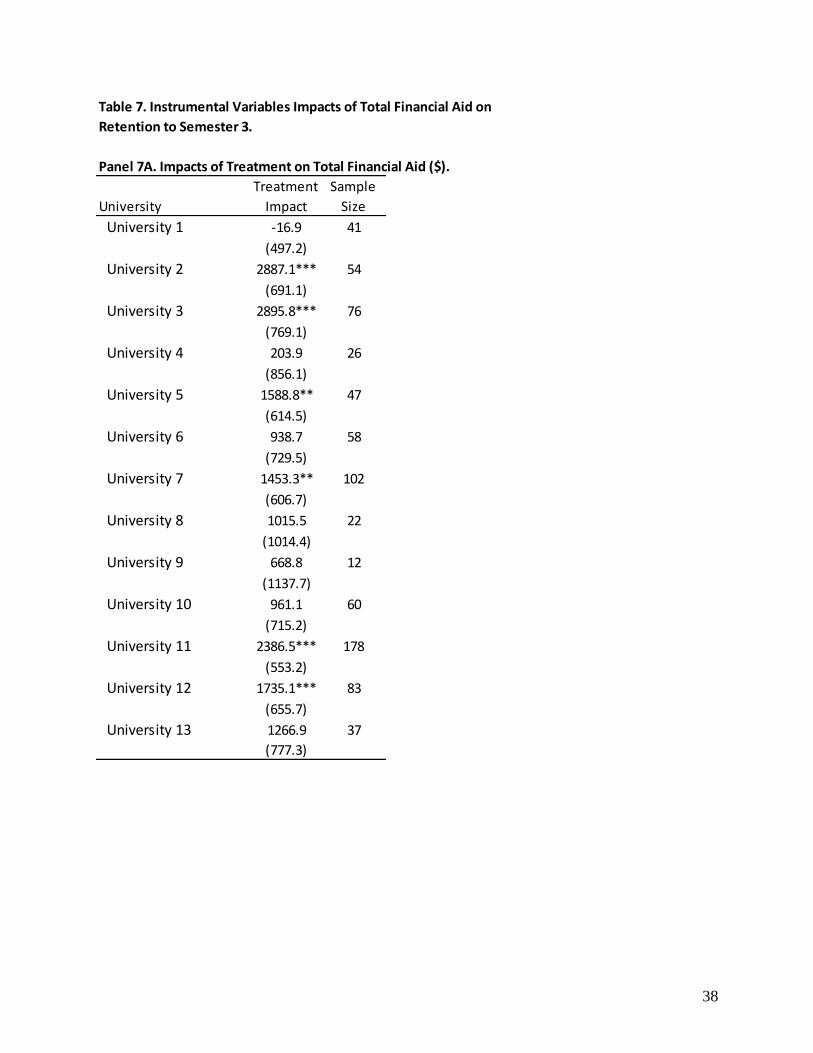
38
Panel 7A. Impacts of Treatment on Total Financial Aid ($).
University 1 -16.9 41
(497.2)
University 2 2887.1*** 54
(691.1)
University 3 2895.8*** 76
(769.1)
University 4 203.9 26
(856.1)
University 5 1588.8** 47
(614.5)
University 6 938.7 58
(729.5)
University 7 1453.3** 102
(606.7)
University 8 1015.5 22
(1014.4)
University 9 668.8 12
(1137.7)
University 10 961.1 60
(715.2)
University 11 2386.5*** 178
(553.2)
University 12 1735.1*** 83
(655.7)
University 13 1266.9 37
(777.3)
Table 7. Instrumental Variables Impacts of Total Financial Aid on
Retention to Semester 3.
Treatment
ImpactUniversity
Sample
Size

39
Panel 7B. Impacts of Total Financial Aid on Retention.
OLS impact (13 colleges) 1.0*
(0.6)
OLS impact (10 colleges) 1.1*
(0.7)
IV impact (13 colleges) 2.8**
(1.2)
IV impact (10 colleges) 4.1**
(1.7)
Stage 1 F 8.56
Stage 1 R-squared 0.280
SOURCE: University of Wisconsin System.
NOTES:
(6) * represents p<.10, ** represents p<.05, and *** represents p<.01.
(5) The IV estimate for 13 colleges is for subsample B of cohort 1. The IV
estimate for 10 colleges is only for colleges with control group retention
rates of below 90 percent.
(3) OLS impacts are the result of regressions across all campuses including
race, gender, age, EFC, parental education, and campus dummy variable by
WSG offer interactions.
(4) IV impacts are the result of using the measure at the top of each column
as an instrument for campus by treatment interactions. The same covariates
used in the OLS model are used in the IV model.
(1) This analysis only includes students in subsample B of cohort 1 and who
remained enrolled in the UW System in spring 2009 (796 of 828 students).
(2) Campus-level impacts are the result of campus-specific OLS regressions
without covariates.

40
Table 8. Treatment Impacts on Other Potential Mediators.
University 1 0.0 25.4 -8.4 41
(2.3) (17.2) (8.9)
University 2 -3.6* 17.9 12.9 54
(2.0) (14.5) (10.5)
University 3 0.7 -12.5 19.5*** 76
(1.7) (12.7) (7.1)
University 4 -3.2 -8.1 -3.2 26
(3.7) (22.0) (16.0)
University 5 1.0 -8.3 -8.7 47
(2.4) (18.1) (8.5)
University 6 -1.2 -21.5 10.3 58
(2.3) (15.3) (8.5)
University 7 -1.3 10.3 5.0 102
(1.9) (10.8) (6.8)
University 8 -3.1 -4.4 -13.3 22
(5.0) (27.5) (18.1)
University 9 -5.5 25.0 0.0 12
(4.8) (33.1) (0.0)
University 10 0.2 0.0 -13.3 60
(2.4) (16.0) (9.5)
University 11 0.3 4.9 1.0 178
(1.6) (10.3) (5.9)
University 12 -2.3 17.6 9.7 83
(2.6) (16.4) (6.9)
University 13 1.0 -23.3 -11.1 37
(2.4) (16.6) (11.1)
SOURCES: Fall 2008/spring 2009 WSLS surveys
NOTES:
(6) * represents p<.10, ** represents p<.05, and *** represents p<.01.
(3) Hours worked combines survey questions regarding hours worked on
campus and hours worked off campus.
(4) Expectation of graduate degree is equal to 1 if a student expected to
earn a master's degree or higher and 0 otherwise.
(5) Mental health is coded as 1 if a student responded "very good" or
excellent" and 0 otherwise.
(2) Campus-level impacts are the result of campus-specific OLS
regressions without covariates.
(1) This analysis only includes students in subsample B of cohort 1 and who
remained enrolled in the UW System in spring 2009 (796 of 828 students).
University
Fall 08
hrs
worked
Spring 09
expect grad
degree (pct)
Fall 08 mental
health (pct
very good)
Max
sample
size
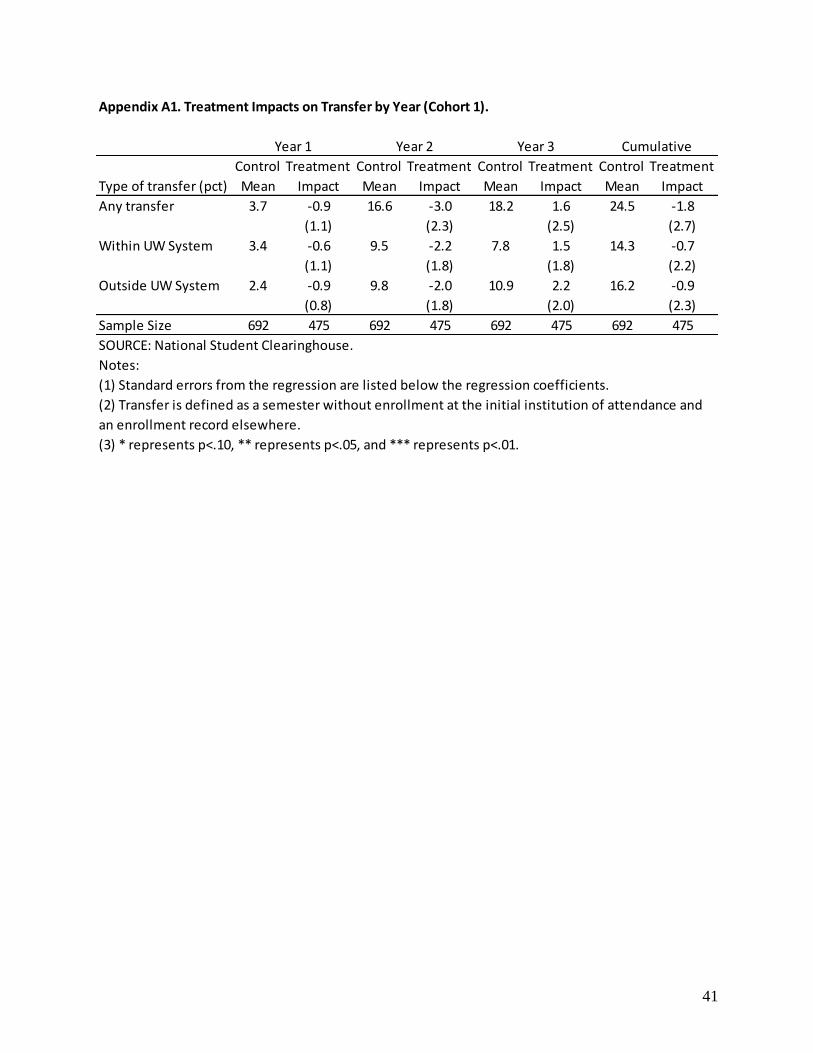
41
Appendix A1. Treatment Impacts on Transfer by Year (Cohort 1).
Type of transfer (pct)
Any transfer 3.7 -0.9 16.6 -3.0 18.2 1.6 24.5 -1.8
(1.1) (2.3) (2.5) (2.7)
Within UW System 3.4 -0.6 9.5 -2.2 7.8 1.5 14.3 -0.7
(1.1) (1.8) (1.8) (2.2)
Outside UW System 2.4 -0.9 9.8 -2.0 10.9 2.2 16.2 -0.9
(0.8) (1.8) (2.0) (2.3)
Sample Size 692 475 692 475 692 475 692 475
SOURCE: National Student Clearinghouse.
Notes:
(1) Standard errors from the regression are listed below the regression coefficients.
(3) * represents p<.10, ** represents p<.05, and *** represents p<.01.
(2) Transfer is defined as a semester without enrollment at the initial institution of attendance and
an enrollment record elsewhere.
Year 1
Control
Mean
Treatment
Impact
Year 2
Control
Mean
Treatment
Impact
Year 3
Control
Mean
Treatment
Impact
Cumulative
Control
Mean
Treatment
Impact

42
Appendix A2. Baseline Equivalence by University Retention Rate.
Panel A. Cohort 1 (Fall 2008).
Characteristic
Gender (percent female) 55.5 4.2 57.8 8.3
(3.5) (6.9)
Race/ethnicity (pct targeted minority) 26.3 1.6 8.2 1.0
(3.6) (4.4)
Average age (years) 18.26 0.01 18.20 0.02
(0.04) (0.06)
First in family to attend college (pct) 59.1 -5.5 38.2 9.3
(3.6) (7.3)
Father has an AA or higher (pct) 23.6 4.4 42.7 -3.3
(3.3) (7.5)
Mother has an AA or higher (pct) 30.9 7.6** 45.5 -7.2
(3.6) (7.5)
Financially dependent on parents (pct) 96.2 1.5 100.0 -2.7
(1.2) (1.9)
Average expected family contribution ($) 1,561 -17 1,803 312
(144) (457)
Zero expected family contribution (pct) 36.6 -5.1 16.5 4.1
(3.3) (5.7)
Parent(s)' adjusted gross income ($) 28,169 1,922 32,378 -896
(1,277) (2,470)
Parent(s)' investment net worth ($) 4,914 -1,624* 5,870 2,344
(842) (2,140)
Any prior enrollment (pct) 9.2 1.7 10.2 -0.4
(2.1) (4.2)
Terms of prior enrollment 0.17 0.01 0.15 -0.01
(0.04) (0.07)
P-value from global F-test 0.059
Sample Size 570 380 122 95
Higher Retention
Control
Mean
Lower Retention
Control
Mean
Treatment
Difference
Treatment
Difference
0.821

43
Panel B. Cohorts 1-4.
Characteristic
Any prior enrollment (pct) 8.6 1.2 12.8 2.1
(0.8) (1.8)
Terms of prior enrollment 0.13 0.05*** 0.18 0.06*
(0.02) (0.03)
Sample Size 9931 1678 2791 447
Notes:
(1) Standard errors from the regression are listed below the regression coefficients.
(4) Prior enrollment only includes enrollment within the University of Wisconsin System.
(6) * represents p<.10, ** represents p<.05, and *** represents p<.01.
Lower Retention
Control
Mean
Treatment
Difference
(5) Lower-retention campuses (n=10) had control group retention rates of less than 90
percent, while higher-retention campuses (n=3) had control group retention rates of
more than 90 percent.
SOURCES: Panel A: 2008 FAFSA except for race and prior enrollment, which comes from
the University of Wisconsin System. Panel B: University of Wisconsin System.
(2) Targeted minority groups include: African-Americans, Latinos, Southeast Asians,
Native Americans, and multiracial. "Targeted" refers to a policy of the University of
(3) Parent investments (dependents only) had few extreme values with undue
influences and were Winsorized at the 95th percentile (Tukey, 1962).
Higher Retention
Control
Mean
Treatment
Difference
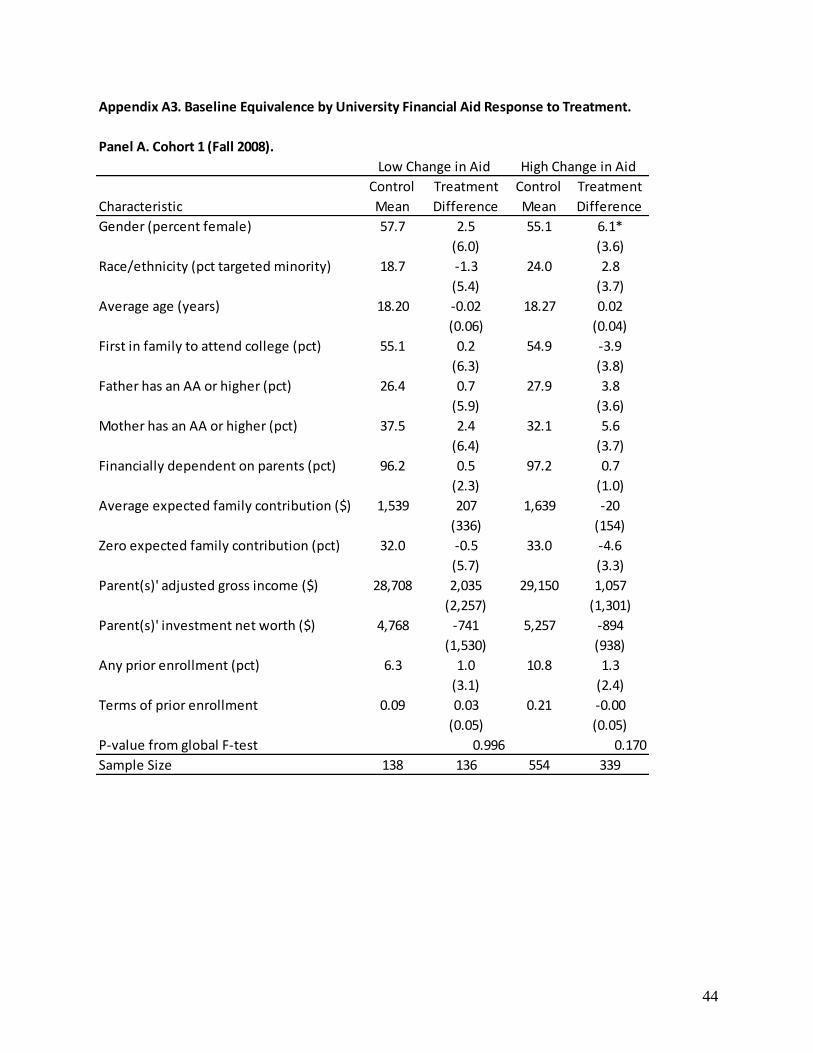
44
Appendix A3. Baseline Equivalence by University Financial Aid Response to Treatment.
Panel A. Cohort 1 (Fall 2008).
Characteristic
Gender (percent female) 57.7 2.5 55.1 6.1*
(6.0) (3.6)
Race/ethnicity (pct targeted minority) 18.7 -1.3 24.0 2.8
(5.4) (3.7)
Average age (years) 18.20 -0.02 18.27 0.02
(0.06) (0.04)
First in family to attend college (pct) 55.1 0.2 54.9 -3.9
(6.3) (3.8)
Father has an AA or higher (pct) 26.4 0.7 27.9 3.8
(5.9) (3.6)
Mother has an AA or higher (pct) 37.5 2.4 32.1 5.6
(6.4) (3.7)
Financially dependent on parents (pct) 96.2 0.5 97.2 0.7
(2.3) (1.0)
Average expected family contribution ($) 1,539 207 1,639 -20
(336) (154)
Zero expected family contribution (pct) 32.0 -0.5 33.0 -4.6
(5.7) (3.3)
Parent(s)' adjusted gross income ($) 28,708 2,035 29,150 1,057
(2,257) (1,301)
Parent(s)' investment net worth ($) 4,768 -741 5,257 -894
(1,530) (938)
Any prior enrollment (pct) 6.3 1.0 10.8 1.3
(3.1) (2.4)
Terms of prior enrollment 0.09 0.03 0.21 -0.00
(0.05) (0.05)
P-value from global F-test
Sample Size 138 136 554 339
0.996 0.170
Low Change in Aid High Change in Aid
Control
Mean
Treatment
Difference
Control
Mean
Treatment
Difference

45
Panel B. Cohorts 1-3.
Characteristic
Any prior enrollment (pct) 7.6 0.6 10.5 1.6*
(1.2) (0.9)
Terms of prior enrollment 0.11 0.03 0.16 0.06***
(0.02) (0.02)
Sample Size 4039 660 8683 1465
Notes:
(1) Standard errors from the regression are listed below the regression coefficients.
(4) Prior enrollment only includes enrollment within the University of Wisconsin System.
(6) * represents p<.10, ** represents p<.05, and *** represents p<.01.
SOURCES: Panel A: 2008 FAFSA except for race and prior enrollment, which comes from
the University of Wisconsin System. Panel B: University of Wisconsin System.
(2) Targeted minority groups include: African-Americans, Latinos, Southeast Asians,
Native Americans, and multiracial. "Targeted" refers to a policy of the University of
(3) Parent investments (dependents only) had few extreme values with undue
influences and were Winsorized at the 95th percentile (Tukey, 1962).
(5) Low change in aid campuses (n=5) had treatment impacts of aid of less than $1,000,
while high change in aid campuses (n=8) had treatment impacts of greater than $1,000.
Low Change in Aid High Change in Aid
Control
Mean
Treatment
Difference
Control
Mean
Treatment
Difference

46
Appendix A4. Short-Term Academic Impacts by University Retention Rate (Cohort 1).
p-value
Outcomes by Semester
Semester 1 (treatment began)
Credits earned 13.9 0.3 14.2 0.1 0.561
(0.3) (0.2)
Earned 12+ credits (pct) 86.1 0.9 95.6 -0.8 0.647
(2.3) (2.9)
Cumulative GPA 2.42 0.10 2.97 -0.03 0.278
(0.07) (0.11)
Semester 2
Retention (pct) 91.8 2.2 100.0 -1.8 0.068
(1.8) (1.3)
Credits earned 11.5 0.5 14.1 -0.2 0.211
(0.3) (0.5)
Earned 12+ credits (pct) 69.5 2.0 90.3 -3.0 0.373
(3.2) (4.6)
Cumulative GPA 2.36 0.11 2.97 -0.07 0.112
(0.07) (0.09)
Semester 3
Retention (pct) 76.6 4.5 96.1 -5.2 0.036
(2.8) (3.6)
Credits earned 10.0 0.4 13.1 0.1 0.704
(0.4) (0.7)
Earned 12+ credits (pct) 60.4 4.6 85.0 -5.0 0.151
(3.4) (5.7)
Cumulative GPA 2.33 0.10 2.99 -0.09 0.08
(0.06) (0.09)
Sample Size 570 380 122 95
SOURCE: University of Wisconsin System.
Notes:
(1) Standard errors from the regression are listed below the regression coefficients.
(6) * represents p<.10, ** represents p<.05, and *** represents p<.01.
(2) Outcomes include enrollment at any of the 13 four-year University of Wisconsin System
universities, as well as the 13 two-year University of Wisconsin Colleges.
(3) If a student was not enrolled in a given semester, the cumulative GPA from the previous
semester is reported.
(4) Lower-retention campuses (n=10) had control group retention rates of less than 90 percent,
while higher-retention campuses (n=3) had control group retention rates of more than 90
(5) The p-values reported are a test of the difference in treatment impacts between low and high
retention campuses.
Diff. in
impacts
Lower Retention Higher Retention
Control
Mean
Treatment
Impact
Control
Mean
Treatment
Impact

47
Appendix A5. Adjusted Treatment Impacts on Short-Term Outcomes by Semester and Cohort.
Panel A. Treatment Impacts by Cohort.
Semester 1 (treatment began)
Credits earned 0.2 0.2 -0.0 0.0 0.2 0.2 0.2* 0.2*
(0.2) (0.2) (0.1) (0.1) (0.1) (0.1) (0.1) (0.1)
Earned 12+ credits (pct) 0.6 0.3 1.5 1.5 0.5 0.8 1.3 1.2
(2.0) (1.8) (1.4) (1.3) (1.5) (1.4) (1.1) (1.1)
Cumulative GPA 0.08 0.08 0.08* 0.08** 0.11*** 0.10*** 0.03 0.03
(0.06) (0.06) (0.04) (0.04) (0.04) (0.04) (0.04) (0.04)
Semester 2
Retention (pct) 1.4 1.5 1.2 1.7* 2.5*** 2.5*** 1.4 1.4
(1.5) (1.4) (1.1) (0.9) (1.0) (1.0) (1.0) (1.0)
Credits earned 0.3 0.3 0.2 0.3 0.4** 0.4** 0.4** 0.4**
(0.3) (0.3) (0.2) (0.2) (0.2) (0.2) (0.2) (0.2)
Earned 12+ credits (pct) 1.1 0.8 0.9 1.1 5.5*** 5.6*** 3.8** 3.8**
(2.7) (2.7) (1.9) (1.8) (1.7) (1.6) (1.6) (1.5)
Cumulative GPA 0.07 0.07 0.06 0.07* 0.09** 0.08** 0.04 0.05
(0.06) (0.05) (0.04) (0.04) (0.04) (0.04) (0.04) (0.04)
Semester 3
Retention (pct) 2.6 2.5 2.8* 3.3** 2.6 2.7 -- --
(2.4) (2.4) (1.7) (1.7) (1.7) (1.7)
Credits earned 0.3 0.3 0.3 0.4 0.5* 0.5** -- --
(0.4) (0.4) (0.3) (0.3) (0.3) (0.3)
Earned 12+ credits (pct) 2.8 2.7 2.1 2.6 3.4 3.3 -- --
(3.0) (2.9) (2.2) (2.1) (2.1) (2.0)
Cumulative GPA 0.07 0.06 0.04 0.06 0.09** 0.10*** -- --
(0.06) (0.05) (0.04) (0.04) (0.04) (0.04)
Treatment Sample Size
Unadj
Impact
475 495 540 615
Cohort 1 Cohort 2 Cohort 3 Cohort 4
Unadj
Impact
Fixed
Effects
Unadj
Impact
Fixed
Effects
Unadj
Impact
Fixed
Effects
Fixed
Effects
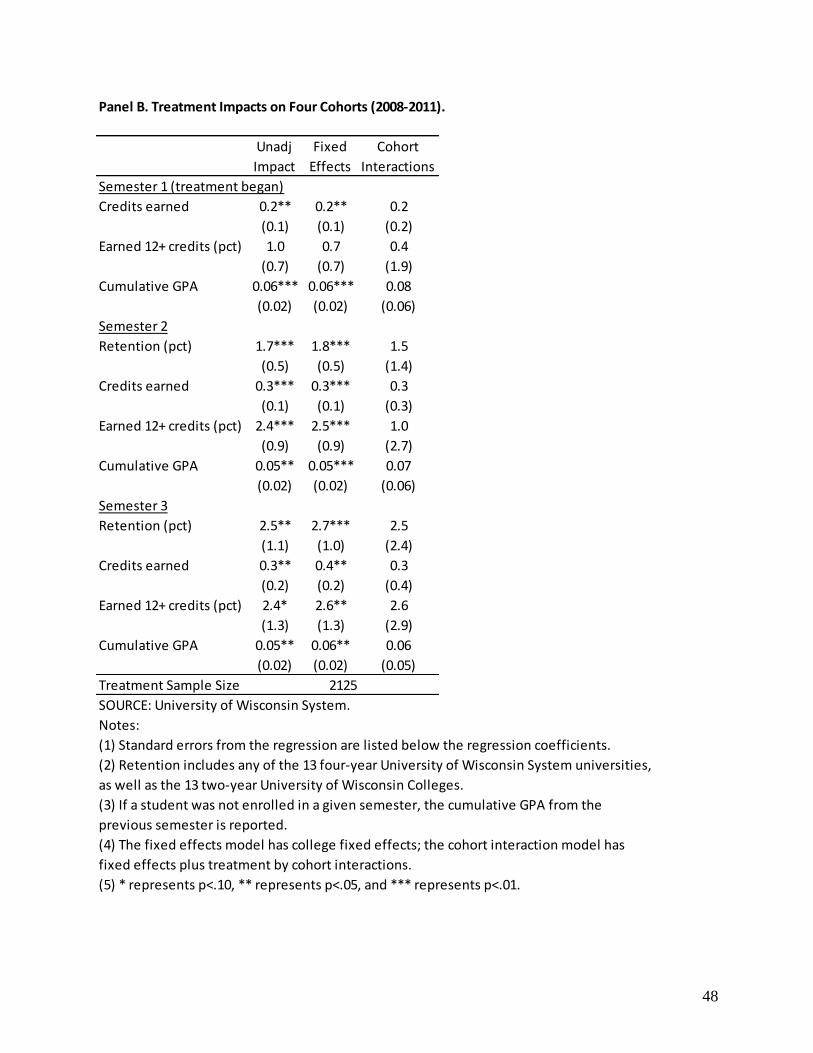
48
Panel B. Treatment Impacts on Four Cohorts (2008-2011).
Semester 1 (treatment began)
Credits earned 0.2** 0.2** 0.2
(0.1) (0.1) (0.2)
Earned 12+ credits (pct) 1.0 0.7 0.4
(0.7) (0.7) (1.9)
Cumulative GPA 0.06*** 0.06*** 0.08
(0.02) (0.02) (0.06)
Semester 2
Retention (pct) 1.7*** 1.8*** 1.5
(0.5) (0.5) (1.4)
Credits earned 0.3*** 0.3*** 0.3
(0.1) (0.1) (0.3)
Earned 12+ credits (pct) 2.4*** 2.5*** 1.0
(0.9) (0.9) (2.7)
Cumulative GPA 0.05** 0.05*** 0.07
(0.02) (0.02) (0.06)
Semester 3
Retention (pct) 2.5** 2.7*** 2.5
(1.1) (1.0) (2.4)
Credits earned 0.3** 0.4** 0.3
(0.2) (0.2) (0.4)
Earned 12+ credits (pct) 2.4* 2.6** 2.6
(1.3) (1.3) (2.9)
Cumulative GPA 0.05** 0.06** 0.06
(0.02) (0.02) (0.05)
Treatment Sample Size
SOURCE: University of Wisconsin System.
Notes:
(1) Standard errors from the regression are listed below the regression coefficients.
(5) * represents p<.10, ** represents p<.05, and *** represents p<.01.
(4) The fixed effects model has college fixed effects; the cohort interaction model has
fixed effects plus treatment by cohort interactions.
(2) Retention includes any of the 13 four-year University of Wisconsin System universities,
as well as the 13 two-year University of Wisconsin Colleges.
2125
Unadj
Impact
Fixed
Effects
(3) If a student was not enrolled in a given semester, the cumulative GPA from the
previous semester is reported.
Cohort
Interactions

49
Panel A. Treatment Impacts by Cohort.
Semester 4
Retention (pct) 1.9 1.8 1.3 2.0 2.4 2.5 -- --
(2.7) (2.6) (1.9) (1.9) (1.8) (1.8)
Credits earned -0.1 -0.1 0.5* 0.6** 0.3 0.4 -- --
(0.4) (0.4) (0.3) (0.3) (0.3) (0.3)
Earned 12+ credits (pct) -3.9 -4.1 5.1** 5.6** 1.6 1.6 -- --
(3.1) (3.0) (2.2) (2.2) (2.2) (2.1)
Cumulative GPA 0.07 0.06 0.04 0.06 0.10*** 0.10*** -- --
(0.06) (0.05) (0.04) (0.04) (0.04) (0.04)
Semester 5
Retention (pct) 0.0 -0.0 1.4 1.9 -- -- -- --
(2.9) (2.8) (2.1) (2.1)
Credits earned 0.3 0.3 0.3 0.4 -- -- -- --
(0.4) (0.4) (0.3) (0.3)
Earned 12+ credits (pct) 2.7 2.6 3.2 3.7 -- -- -- --
(3.1) (3.0) (2.3) (2.3)
Cumulative GPA 0.06 0.06 0.04 0.06 -- -- -- --
(0.06) (0.05) (0.04) (0.04)
Semester 6
Retention (pct) -1.4 -1.4 1.3 1.7 -- -- -- --
(2.9) (2.9) (2.1) (2.1)
Credits earned -0.2 -0.2 0.0 0.1 -- -- -- --
(0.4) (0.4) (0.3) (0.3)
Earned 12+ credits (pct) -2.4 -2.4 0.0 0.1 -- -- -- --
(3.1) (3.1) (2.4) (2.3)
Cumulative GPA 0.07 0.07 0.04 0.05 -- -- -- --
(0.06) (0.05) (0.04) (0.04)
Cumulative Outcomes
Credits completed 1.0 0.9 1.4 1.8 1.5** 1.5** 0.6** 0.6**
(1.8) (1.7) (1.2) (1.2) (0.7) (0.6) (0.3) (0.2)
12+ credits/sem (pct) -2.2 -2.3 2.7 3.0 2.1 2.4 3.8** 3.8***
(3.1) (3.0) (2.3) (2.2) (2.1) (2.0) (1.5) (1.4)
Semesters enrolled 0.05 0.04 0.08 0.11 0.08** 0.08** 0.02 0.01
(0.10) (0.10) (0.08) (0.07) (0.04) (0.04) (0.01) (0.01)
Cumulative GPA 0.07 0.07 0.04 0.05 0.10*** 0.10*** 0.04 0.05
(0.06) (0.05) (0.04) (0.04) (0.04) (0.04) (0.04) (0.04)
Treatment Sample Size
Appendix A6. Adjusted Treatment Impacts on Longer-Term Academic Outcomes by Semester
and Cohort.
475 495 540 615
Unadj
Impact
Fixed
Effects
Cohort 1 Cohort 2 Cohort 3 Cohort 4
Unadj
Impact
Fixed
Effects
Unadj
Impact
Fixed
Effects
Unadj
Impact
Fixed
Effects
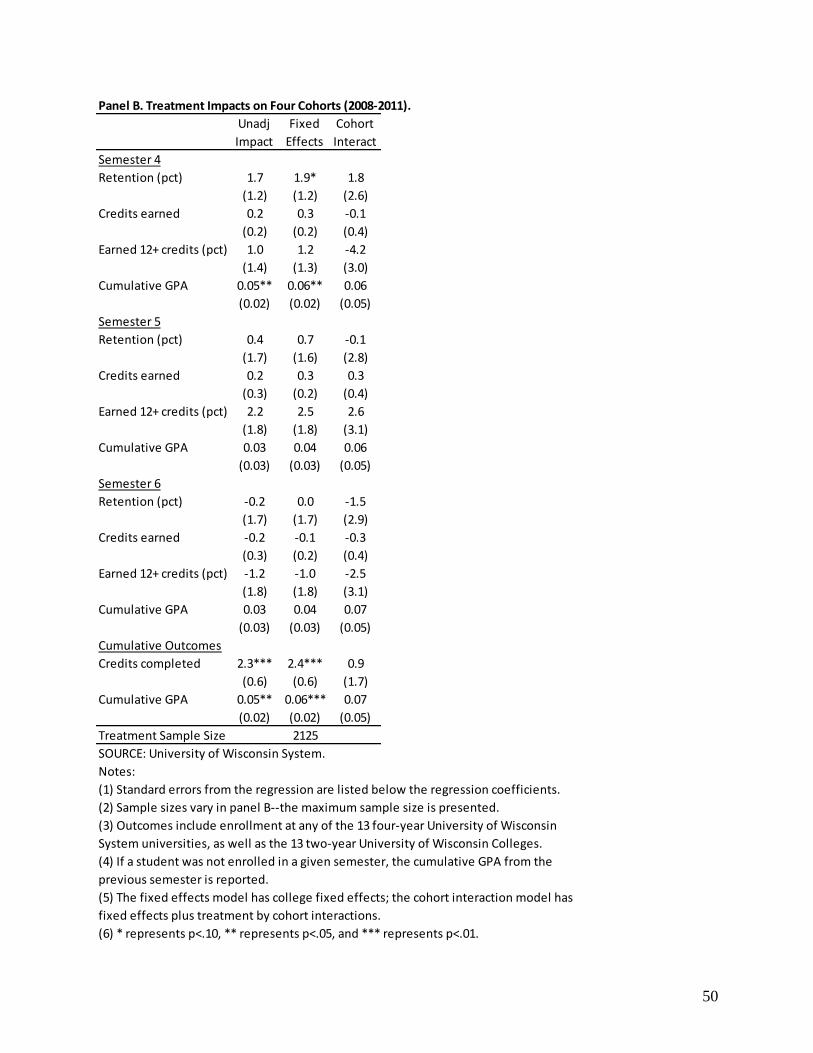
50
Panel B. Treatment Impacts on Four Cohorts (2008-2011).
Semester 4
Retention (pct) 1.7 1.9* 1.8
(1.2) (1.2) (2.6)
Credits earned 0.2 0.3 -0.1
(0.2) (0.2) (0.4)
Earned 12+ credits (pct) 1.0 1.2 -4.2
(1.4) (1.3) (3.0)
Cumulative GPA 0.05** 0.06** 0.06
(0.02) (0.02) (0.05)
Semester 5
Retention (pct) 0.4 0.7 -0.1
(1.7) (1.6) (2.8)
Credits earned 0.2 0.3 0.3
(0.3) (0.2) (0.4)
Earned 12+ credits (pct) 2.2 2.5 2.6
(1.8) (1.8) (3.1)
Cumulative GPA 0.03 0.04 0.06
(0.03) (0.03) (0.05)
Semester 6
Retention (pct) -0.2 0.0 -1.5
(1.7) (1.7) (2.9)
Credits earned -0.2 -0.1 -0.3
(0.3) (0.2) (0.4)
Earned 12+ credits (pct) -1.2 -1.0 -2.5
(1.8) (1.8) (3.1)
Cumulative GPA 0.03 0.04 0.07
(0.03) (0.03) (0.05)
Cumulative Outcomes
Credits completed 2.3*** 2.4*** 0.9
(0.6) (0.6) (1.7)
Cumulative GPA 0.05** 0.06*** 0.07
(0.02) (0.02) (0.05)
Treatment Sample Size
SOURCE: University of Wisconsin System.
Notes:
(1) Standard errors from the regression are listed below the regression coefficients.
(2) Sample sizes vary in panel B--the maximum sample size is presented.
(6) * represents p<.10, ** represents p<.05, and *** represents p<.01.
Cohort
Interact
2125
(3) Outcomes include enrollment at any of the 13 four-year University of Wisconsin
System universities, as well as the 13 two-year University of Wisconsin Colleges.
(5) The fixed effects model has college fixed effects; the cohort interaction model has
fixed effects plus treatment by cohort interactions.
Unadj
Impact
Fixed
Effects
(4) If a student was not enrolled in a given semester, the cumulative GPA from the
previous semester is reported.
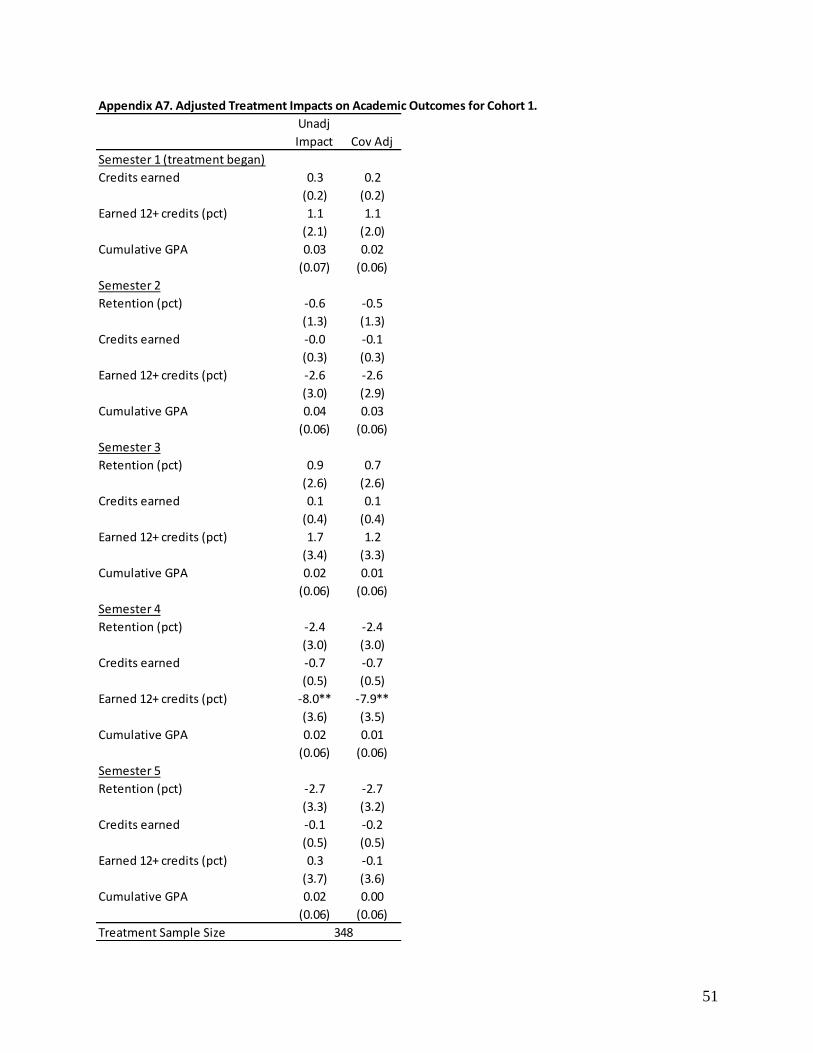
51
Appendix A7. Adjusted Treatment Impacts on Academic Outcomes for Cohort 1.
Semester 1 (treatment began)
Credits earned 0.3 0.2
(0.2) (0.2)
Earned 12+ credits (pct) 1.1 1.1
(2.1) (2.0)
Cumulative GPA 0.03 0.02
(0.07) (0.06)
Semester 2
Retention (pct) -0.6 -0.5
(1.3) (1.3)
Credits earned -0.0 -0.1
(0.3) (0.3)
Earned 12+ credits (pct) -2.6 -2.6
(3.0) (2.9)
Cumulative GPA 0.04 0.03
(0.06) (0.06)
Semester 3
Retention (pct) 0.9 0.7
(2.6) (2.6)
Credits earned 0.1 0.1
(0.4) (0.4)
Earned 12+ credits (pct) 1.7 1.2
(3.4) (3.3)
Cumulative GPA 0.02 0.01
(0.06) (0.06)
Semester 4
Retention (pct) -2.4 -2.4
(3.0) (3.0)
Credits earned -0.7 -0.7
(0.5) (0.5)
Earned 12+ credits (pct) -8.0** -7.9**
(3.6) (3.5)
Cumulative GPA 0.02 0.01
(0.06) (0.06)
Semester 5
Retention (pct) -2.7 -2.7
(3.3) (3.2)
Credits earned -0.1 -0.2
(0.5) (0.5)
Earned 12+ credits (pct) 0.3 -0.1
(3.7) (3.6)
Cumulative GPA 0.02 0.00
(0.06) (0.06)
Treatment Sample Size 348
Unadj
Impact Cov Adj

52
Appendix A7. Adjusted Treatment Impacts on Academic Outcomes for Cohort 1 (Continued).
Semester 6
Retention (pct) -4.3 -4.3
(3.4) (3.3)
Credits earned -0.8 -0.8
(0.5) (0.5)
Earned 12+ credits (pct) -6.0 -5.5
(3.7) (3.6)
Cumulative GPA 0.02 0.01
(0.06) (0.06)
Cumulative Outcomes
Credits completed -1.3 -1.5
(2.0) (1.9)
Full-time (12+ credits/sem, pct) -7.2** -7.0**
(3.6) (3.5)
Number of semesters enrolled -0.09 -0.09
(0.11) (0.11)
Cumulative GPA 0.02 0.01
(0.06) (0.06)
Treatment Sample Size
SOURCE: University of Wisconsin System.
Notes:
(1) Standard errors from the regression are listed below the regression coefficients.
(5) The sample used here is subsample B with a small amount of missing data on covariates.
(6) * represents p<.10, ** represents p<.05, and *** represents p<.01.
(2) Outcomes include enrollment at any of the 13 four-year University of Wisconsin System
universities, as well as the 13 two-year University of Wisconsin Colleges.
(3) If a student was not enrolled in a given semester, the cumulative GPA from the previous
semester is reported.
(4) The covariate-adjusted model includes race, gender, parental education, age, EFC, and
college fixed effects.
348
Unadj
Impact Cov Adj
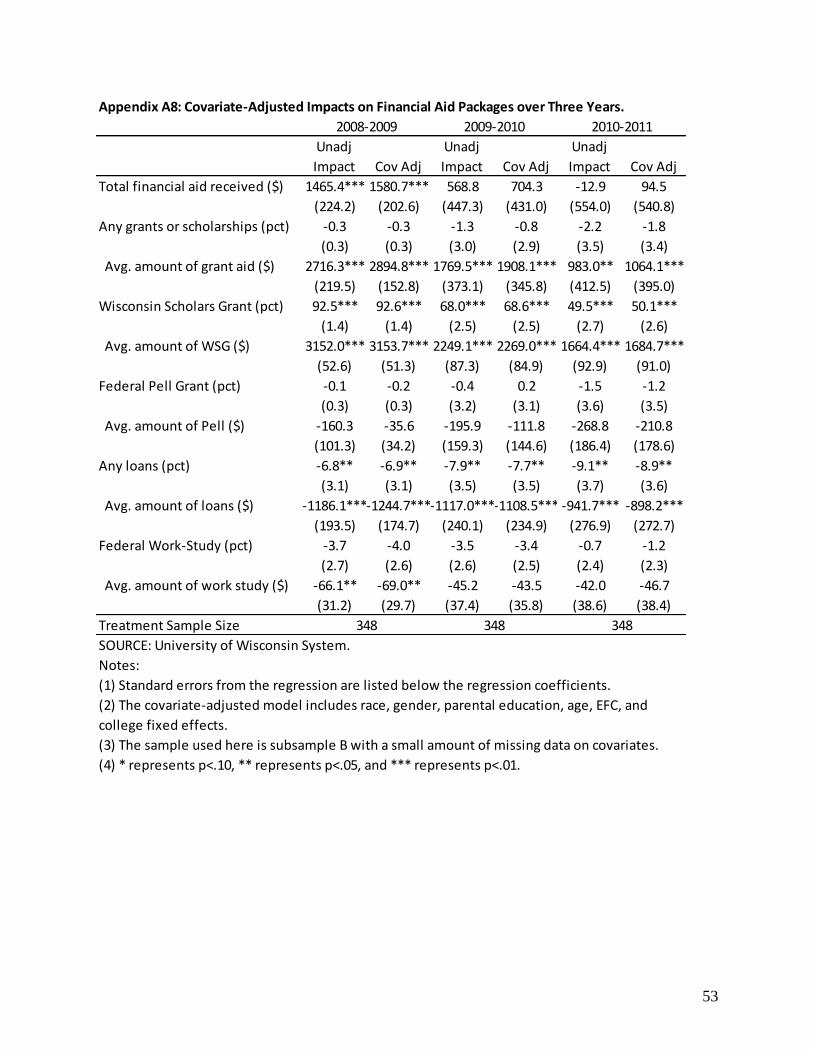
53
Appendix A8: Covariate-Adjusted Impacts on Financial Aid Packages over Three Years.
Total financial aid received ($) 1465.4*** 1580.7*** 568.8 704.3 -12.9 94.5
(224.2) (202.6) (447.3) (431.0) (554.0) (540.8)
Any grants or scholarships (pct) -0.3 -0.3 -1.3 -0.8 -2.2 -1.8
(0.3) (0.3) (3.0) (2.9) (3.5) (3.4)
Avg. amount of grant aid ($) 2716.3*** 2894.8*** 1769.5*** 1908.1*** 983.0** 1064.1***
(219.5) (152.8) (373.1) (345.8) (412.5) (395.0)
Wisconsin Scholars Grant (pct) 92.5*** 92.6*** 68.0*** 68.6*** 49.5*** 50.1***
(1.4) (1.4) (2.5) (2.5) (2.7) (2.6)
Avg. amount of WSG ($) 3152.0*** 3153.7*** 2249.1*** 2269.0*** 1664.4*** 1684.7***
(52.6) (51.3) (87.3) (84.9) (92.9) (91.0)
Federal Pell Grant (pct) -0.1 -0.2 -0.4 0.2 -1.5 -1.2
(0.3) (0.3) (3.2) (3.1) (3.6) (3.5)
Avg. amount of Pell ($) -160.3 -35.6 -195.9 -111.8 -268.8 -210.8
(101.3) (34.2) (159.3) (144.6) (186.4) (178.6)
Any loans (pct) -6.8** -6.9** -7.9** -7.7** -9.1** -8.9**
(3.1) (3.1) (3.5) (3.5) (3.7) (3.6)
Avg. amount of loans ($) -1186.1***-1244.7***-1117.0***-1108.5*** -941.7*** -898.2***
(193.5) (174.7) (240.1) (234.9) (276.9) (272.7)
Federal Work-Study (pct) -3.7 -4.0 -3.5 -3.4 -0.7 -1.2
(2.7) (2.6) (2.6) (2.5) (2.4) (2.3)
Avg. amount of work study ($) -66.1** -69.0** -45.2 -43.5 -42.0 -46.7
(31.2) (29.7) (37.4) (35.8) (38.6) (38.4)
Treatment Sample Size
SOURCE: University of Wisconsin System.
Notes:
(1) Standard errors from the regression are listed below the regression coefficients.
(3) The sample used here is subsample B with a small amount of missing data on covariates.
(4) * represents p<.10, ** represents p<.05, and *** represents p<.01.
(2) The covariate-adjusted model includes race, gender, parental education, age, EFC, and
college fixed effects.
348 348 348
2008-2009 2009-2010 2010-2011
Unadj
Impact Cov Adj
Unadj
Impact Cov Adj
Unadj
Impact Cov Adj

54
Appendix A9: Impacts on Financial Aid Packages over Three Years, Conditional on Enrollment.
Total financial aid received ($) 12011.3 1544.7*** 12772.9 849.0** 13401.4 628.5
(212.3) (338.8) (456.8)
Any grants or scholarships (pct) 100.0 -0.3 93.4 -0.5 92.1 0.4
(0.3) (2.2) (2.4)
Avg. amount of grant aid ($) 7809.2 2758.7*** 7505.3 2288.4*** 7709.6 1843.0***
(212.9) (358.9) (421.2)
Wisconsin Scholars Grant (pct) 0.0 92.8*** 0.0 80.4*** 0.0 69.7***
(1.4) (2.4) (3.0)
Avg. amount of WSG ($) 0.0 3213.9*** 0.0 2763.9*** 0.0 2379.3***
(51.0) (84.8) (104.9)
Federal Pell Grant (pct) 99.9 -0.1 87.5 0.2 86.0 0.8
(0.3) (2.8) (3.1)
Avg. amount of Pell ($) 3391.1 -159.0 3687.8 -177.8 3948.2 -205.7
(101.1) (159.1) (192.9)
Any loans (pct) 80.0 -6.0* 82.0 -9.2*** 82.5 -11.6***
(3.2) (3.5) (3.7)
Avg. amount of loans ($) 3991.8 -1139.8*** 4904.2 -1325.2*** 5363.0 -1145.3***
(197.1) (266.6) (319.4)
Federal Work-Study (pct) 17.4 -4.0 19.9 -5.5* 15.5 -0.8
(2.8) (3.2) (3.2)
Avg. amount of work study ($) 193.3 -71.8** 257.0 -66.6 251.8 -56.4
(31.9) (46.4) (52.9)
Sample Size 453 341 362 279 332 243
Notes:
(1) Standard errors from the regression are listed below the regression coefficients.
(3) * represents p<.10, ** represents p<.05, and *** represents p<.01.
SOURCES: University of Wisconsin System universities (panel A), University of Wisconsin System
(panel B).
(2) Students must have been enrolled within the UW System for both semesters in a given
academic year to appear in this table.
2008-2009 2009-2010 2010-2011
Control
Mean
Treatment
Impact
Control
Mean
Treatment
Impact
Control
Mean
Treatment
Impact
Related Documents